spatial distribution of airbnb accommodations in …2019... · the local moran indicator of spatial...
TRANSCRIPT

SPATIAL DISTRIBUTION OF AIRBNB ACCOMMODATIONS IN
SWITZERLAND
Domènech, A.1; Larpin, B.2; Schegg, R.3;. Scaglione, M.4
1: Universitat Rovira i Virgili - [email protected]
2/3/4: Institute Tourism, University of Applied Sciences and Arts
Western Switzerland Valais (HES-SO Valais-Wallis
blaise.larpin,roland.schegg,[email protected]
RESEARCH INTEREST (1) Unprecedented growth since its creation in 2008: the platform overpasses 3 millions of
listings in more than 190 countries
Multiple researchers argue that this digital platform has changed the concept of sharing
accommodation into a for-profit model.
Several research questions have been addressed very recently in time:
Does the presence of Airbnb listings influences the rental price of residential housing units?
Does Airbnb act in some neighbourhoods as a driver of gentrification and processes of
displacement?
Does Airbnb influences the price of the regulated tourist accommodations?
2 SPATIAL DISTRIBUTION OF AIRBNB ACCOMMODATIONS IN SWITZERLAND

RESEARCH INTEREST (2) To unravel these research questions related to the impacts of Airbnb accommodations, some
studies have used spatial analysis techniques:
Most part of these researches are focused on urban areas.
Sparse and selective studies can be found at different territorial scales of analysis:
o Comparative studies of the spatial distribution of Airbnb supply across European cities.
o Between countries.
Until the moment there is not yet any research that analyses the spatial distribution
of the Airbnb supply in a whole country (to the better of the authors’ knowledge).
Growth of Airbnb listings in Switzerland (see graph on the next slide).
3 SPATIAL DISTRIBUTION OF AIRBNB ACCOMMODATIONS IN SWITZERLAND
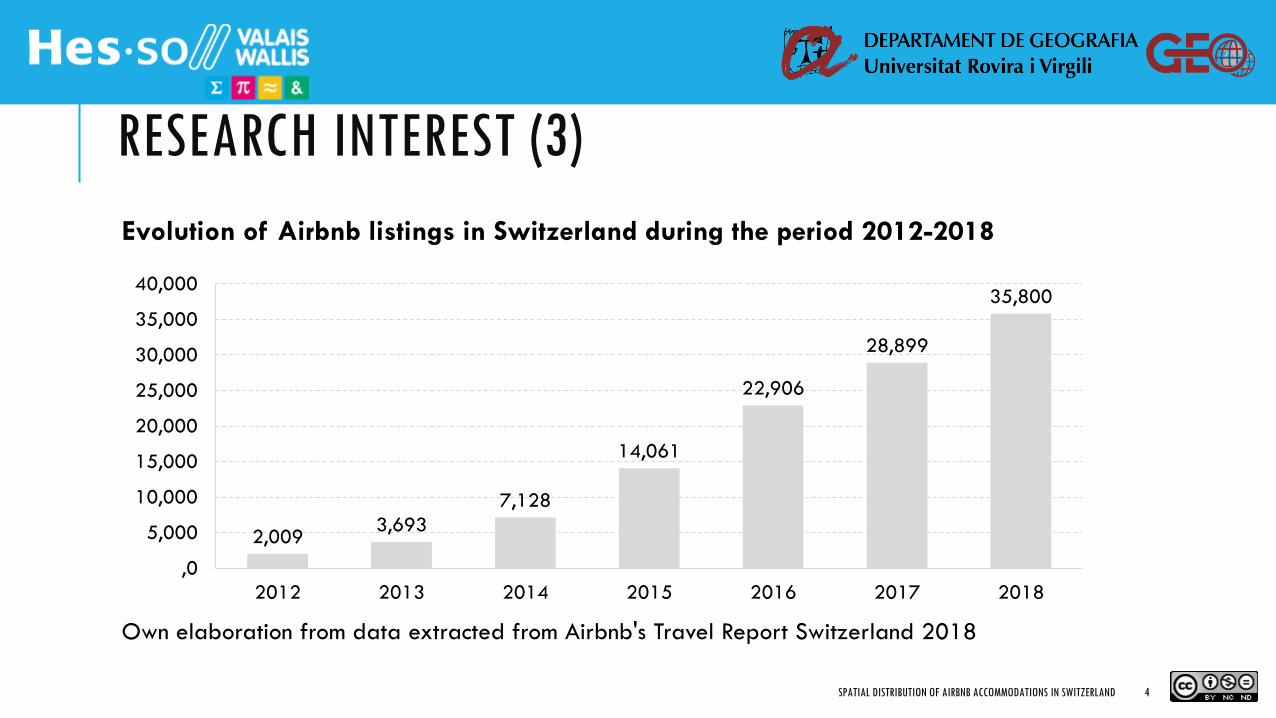
RESEARCH INTEREST (3)
Evolution of Airbnb listings in Switzerland during the period 2012-2018
Own elaboration from data extracted from Airbnb's Travel Report Switzerland 2018
4 SPATIAL DISTRIBUTION OF AIRBNB ACCOMMODATIONS IN SWITZERLAND
2,009 3,693
7,128
14,061
22,906
28,899
35,800
,0
5,000
10,000
15,000
20,000
25,000
30,000
35,000
40,000
2012 2013 2014 2015 2016 2017 2018
RESEARCH INTEREST (4)
5 SPATIAL DISTRIBUTION OF AIRBNB ACCOMMODATIONS IN SWITZERLAND
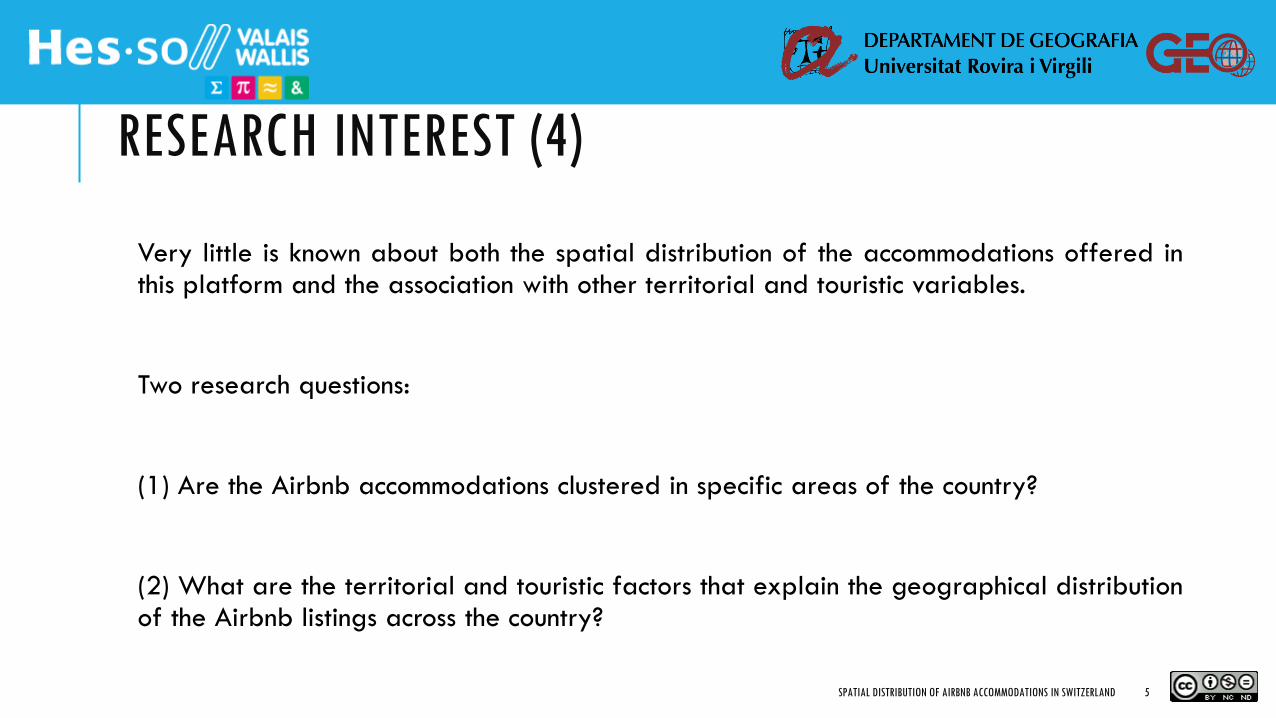
Very little is known about both the spatial distribution of the accommodations offered in this platform and the association with other territorial and touristic variables.
Two research questions:
(1) Are the Airbnb accommodations clustered in specific areas of the country?
(2) What are the territorial and touristic factors that explain the geographical distribution of the Airbnb listings across the country?
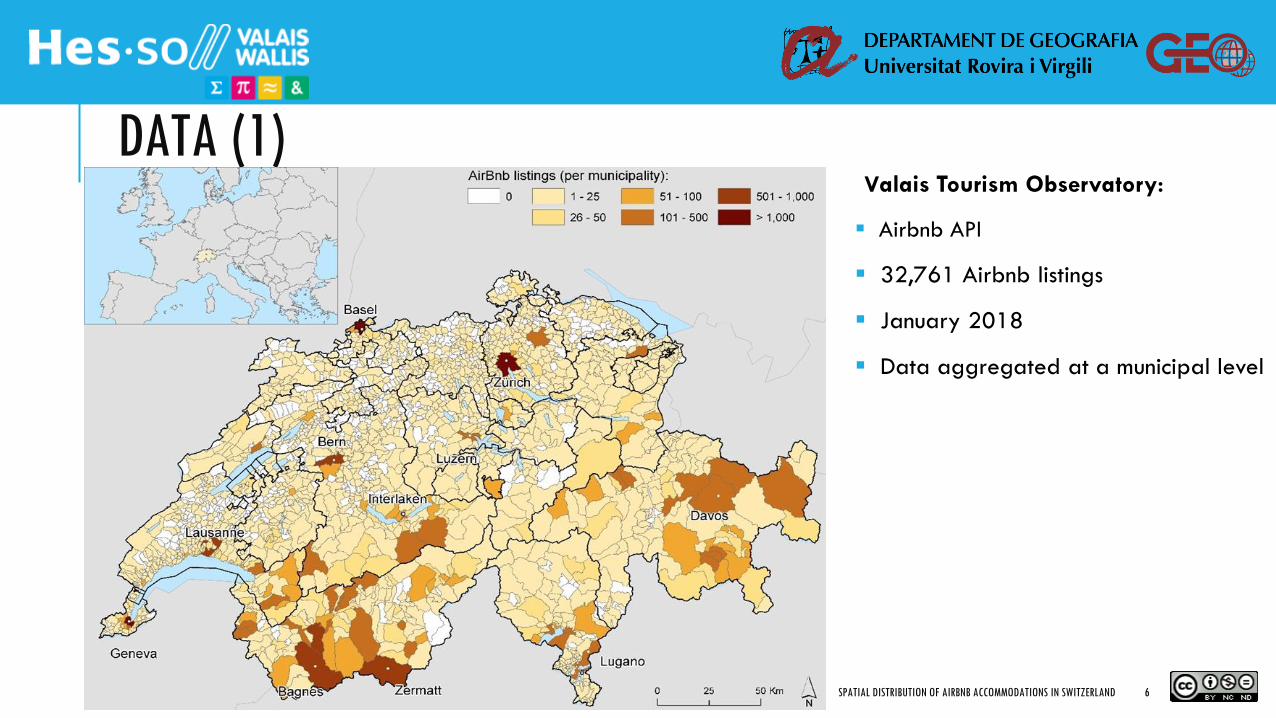
DATA (1) Valais Tourism Observatory:
Airbnb API
32,761 Airbnb listings
January 2018
Data aggregated at a municipal level
6 SPATIAL DISTRIBUTION OF AIRBNB ACCOMMODATIONS IN SWITZERLAND
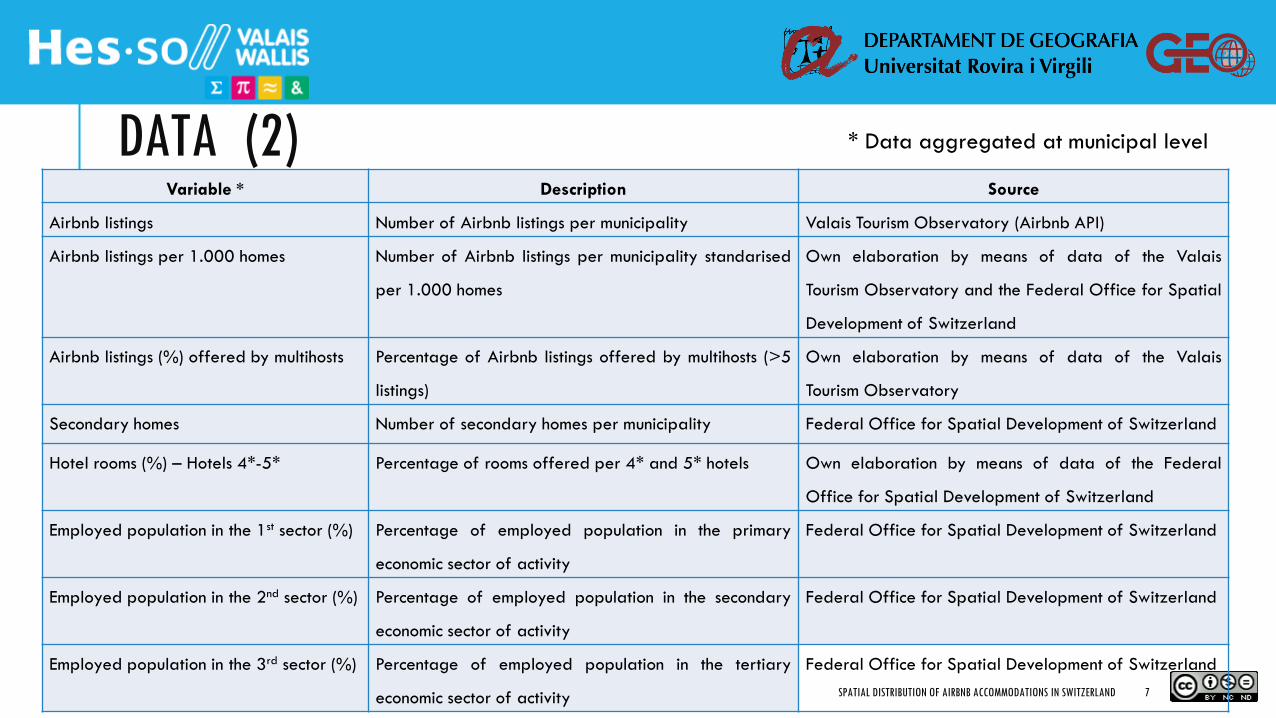
DATA (2) Variable * Description Source
Airbnb listings Number of Airbnb listings per municipality Valais Tourism Observatory (Airbnb API)
Airbnb listings per 1.000 homes Number of Airbnb listings per municipality standarised
per 1.000 homes
Own elaboration by means of data of the Valais
Tourism Observatory and the Federal Office for Spatial
Development of Switzerland
Airbnb listings (%) offered by multihosts Percentage of Airbnb listings offered by multihosts (>5
listings)
Own elaboration by means of data of the Valais
Tourism Observatory
Secondary homes Number of secondary homes per municipality Federal Office for Spatial Development of Switzerland
Hotel rooms (%) – Hotels 4*-5* Percentage of rooms offered per 4* and 5* hotels Own elaboration by means of data of the Federal
Office for Spatial Development of Switzerland
Employed population in the 1st sector (%) Percentage of employed population in the primary
economic sector of activity
Federal Office for Spatial Development of Switzerland
Employed population in the 2nd sector (%) Percentage of employed population in the secondary
economic sector of activity
Federal Office for Spatial Development of Switzerland
Employed population in the 3rd sector (%) Percentage of employed population in the tertiary
economic sector of activity
Federal Office for Spatial Development of Switzerland
7 SPATIAL DISTRIBUTION OF AIRBNB ACCOMMODATIONS IN SWITZERLAND
* Data aggregated at municipal level
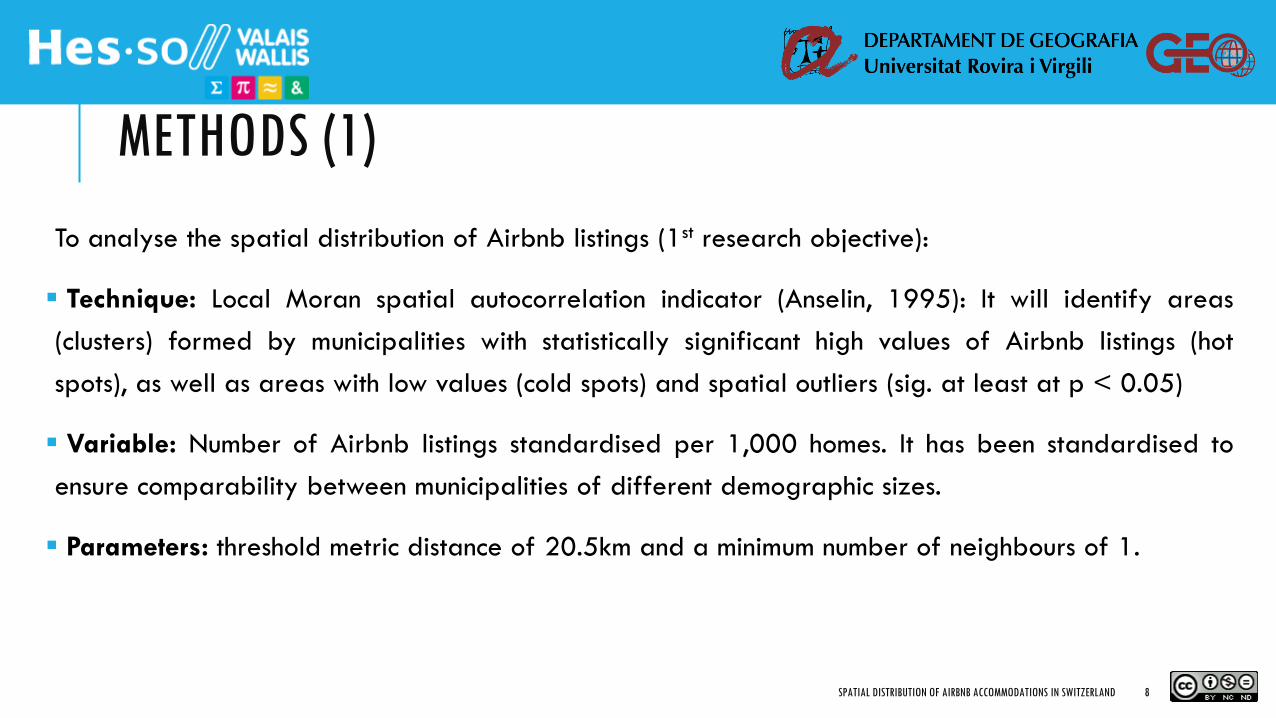
METHODS (1)
To analyse the spatial distribution of Airbnb listings (1st research objective):
Technique: Local Moran spatial autocorrelation indicator (Anselin, 1995): It will identify areas
(clusters) formed by municipalities with statistically significant high values of Airbnb listings (hot
spots), as well as areas with low values (cold spots) and spatial outliers (sig. at least at p < 0.05)
Variable: Number of Airbnb listings standardised per 1,000 homes. It has been standardised to
ensure comparability between municipalities of different demographic sizes.
Parameters: threshold metric distance of 20.5km and a minimum number of neighbours of 1.
8 SPATIAL DISTRIBUTION OF AIRBNB ACCOMMODATIONS IN SWITZERLAND
METHODS (2)
9 SPATIAL DISTRIBUTION OF AIRBNB ACCOMMODATIONS IN SWITZERLAND
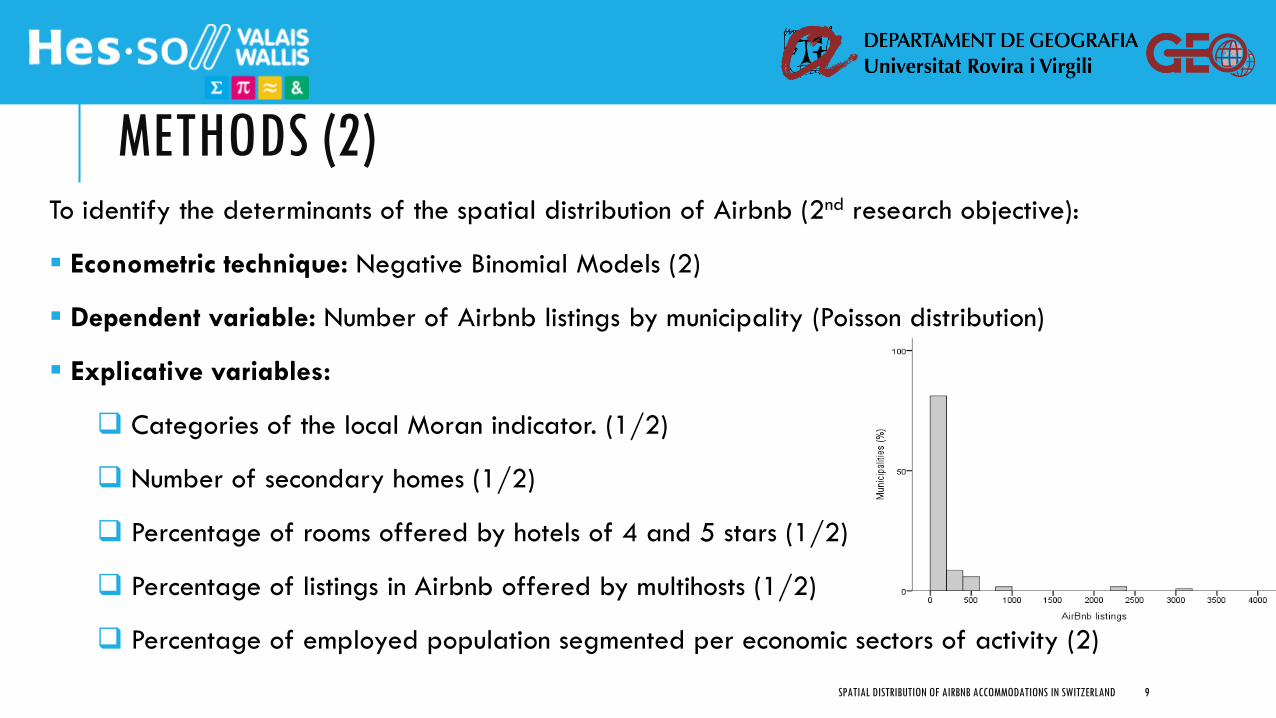
To identify the determinants of the spatial distribution of Airbnb (2nd research objective):
Econometric technique: Negative Binomial Models (2)
Dependent variable: Number of Airbnb listings by municipality (Poisson distribution)
Explicative variables:
Categories of the local Moran indicator. (1/2)
Number of secondary homes (1/2)
Percentage of rooms offered by hotels of 4 and 5 stars (1/2)
Percentage of listings in Airbnb offered by multihosts (1/2)
Percentage of employed population segmented per economic sectors of activity (2)

RESULTS (1)
10 SPATIAL DISTRIBUTION OF AIRBNB ACCOMMODATIONS IN SWITZERLAND
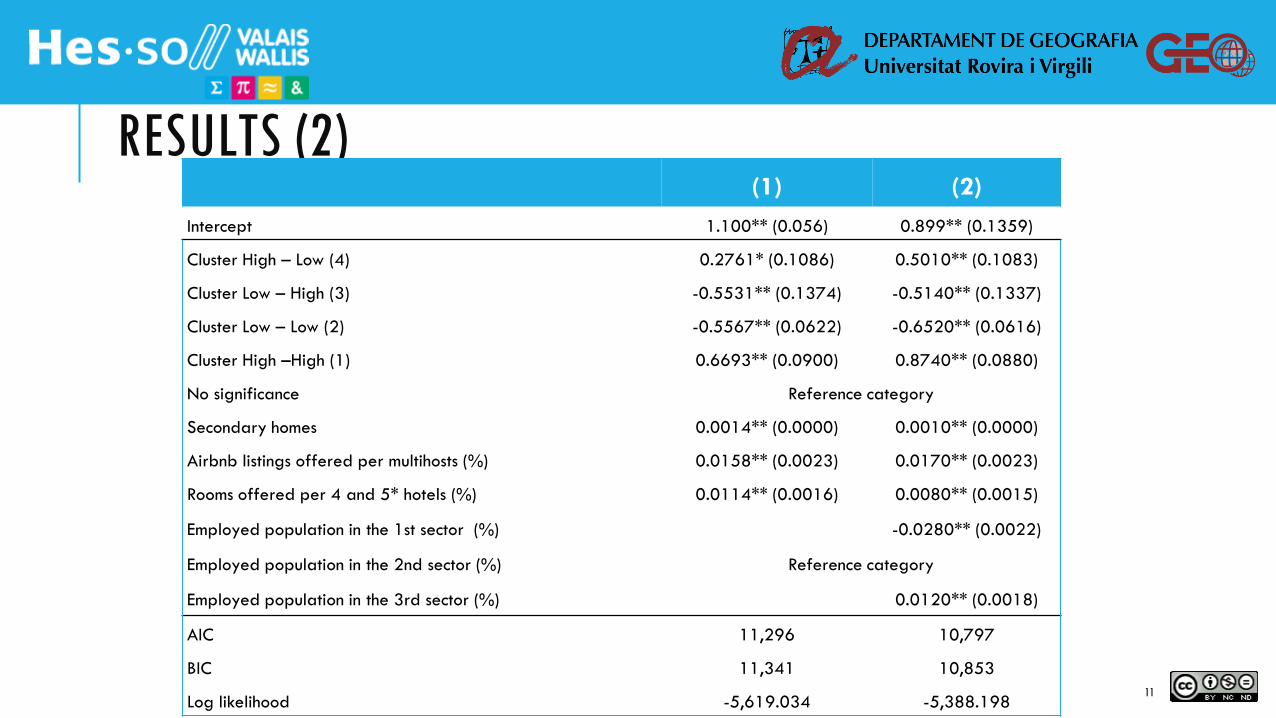
RESULTS (2) (1) (2)
Intercept 1.100** (0.056) 0.899** (0.1359)
Cluster High – Low (4) 0.2761* (0.1086) 0.5010** (0.1083)
Cluster Low – High (3) -0.5531** (0.1374) -0.5140** (0.1337)
Cluster Low – Low (2) -0.5567** (0.0622) -0.6520** (0.0616)
Cluster High –High (1) 0.6693** (0.0900) 0.8740** (0.0880)
No significance Reference category
Secondary homes 0.0014** (0.0000) 0.0010** (0.0000)
Airbnb listings offered per multihosts (%) 0.0158** (0.0023) 0.0170** (0.0023)
Rooms offered per 4 and 5* hotels (%) 0.0114** (0.0016) 0.0080** (0.0015)
Employed population in the 1st sector (%) -0.0280** (0.0022)
Employed population in the 2nd sector (%) Reference category
Employed population in the 3rd sector (%) 0.0120** (0.0018)
AIC 11,296 10,797
BIC 11,341 10,853
Log likelihood -5,619.034 -5,388.198 11
CONCLUSIONS (1)
The Local Moran indicator of spatial autocorrelation has pinpointed a prominent division
between the northern and the southern parts of the country.
This has confirmed the existence of clustering of Airbnb listings in specific areas (1st research
objective).
the spatial distribution of Airbnb in Switzerland could not be understood without considering,
precisely, the spatial component.
The development of the two negative binomial models have brought noteworthy results:
In accordance with previous researches, Airbnb accommodations are acting as a
competence of traditional accommodation supply.
The platform enables the commercialisation of private secondary homes and, therefore,
Airbnb listings are expanding the accommodation supply indistinctly in both areas with
important accommodation offer and underdeveloped offer.
12 SPATIAL DISTRIBUTION OF AIRBNB ACCOMMODATIONS IN SWITZERLAND
CONCLUSIONS (2)
Further analysis have to be developed at other territorial scales in order to see if the trends
detected in this study can also be identified.
Analysis at inframunicipal level would be especially useful to study how the proliferation of
Airbnb accomodations is affecting both the housing and the tourism markets in Switzerland.
13 SPATIAL DISTRIBUTION OF AIRBNB ACCOMMODATIONS IN SWITZERLAND

Many thanks for your attention
14 SPATIAL DISTRIBUTION OF AIRBNB ACCOMMODATIONS IN SWITZERLAND
Leading author: Antoni Domènech
Universitat Rovira i Virgili Departament de Geografia
orcid.org/0000-0002-1881-6679