spatial and temporal population genetics of swiss red
TRANSCRIPT

Spatial and Temporal Population Genetics
of Swiss Red Foxes (Vulpes vulpes)
Following a Rabies Epizootic.
Peter Wandeler
Thesis is submitted for the degree o f Doctor o f Philosophy
Institute o f Zoology Zoological Society o f London
Biodiversity and Ecological Process Research Group School of Biosciences
Cardiff University
December 2004

UMI Number: U584722
All rights reserved
INFORMATION TO ALL USERS The quality of this reproduction is dependent upon the quality of the copy submitted.
In the unlikely event that the author did not send a com plete manuscript and there are missing pages, th ese will be noted. Also, if material had to be removed,
a note will indicate the deletion.
Dissertation Publishing
UMI U584722Published by ProQuest LLC 2013. Copyright in the Dissertation held by the Author.
Microform Edition © ProQuest LLC.All rights reserved. This work is protected against
unauthorized copying under Title 17, United States Code.
ProQuest LLC 789 East Eisenhower Parkway
P.O. Box 1346 Ann Arbor, Ml 48106-1346

DECLARATION
This work has not previously been accepted in substance for any degree and is not
being concurrently submitted in candidature for any degree.
Signed
Date
(candidate)
Statement 1This thesis is the result o f my own investigation, except where otherwise stated. Other
sources are acknowledged by footnotes giving explicit references. A bibliography is
appended.
Signed L W & t o m M r ........................... (candidate)
' Jk-l-.K.....................................
Statement 2I hereby give consent for my thesis, if accepted, to be available for photocopying and
for inter-library loan, and for the title and summary to be made available to outside
organisations.
Signed (candidate)
Date ................ ........................................................................
SUMMARY
Infectious disease can affect the demography o f natural populations and, as a consequence, can alter the genetic variation within and between those populations. This study investigated long-term effects o f rabies-induced mortality on the demography and genetic variation in two Swiss red fox populations over ten to fourteen generations. In Switzerland, the last rabies epizootic persisted from 1967 to 1999 and was continuously monitored by collecting fox carcasses throughout the country. Alongside records o f rabies tests and post-mortem data, tooth samples were systematically archived for ageing. In this study, DNA from 666 individual teeth was extracted. For 279 extracts, the concentration o f nuclear DNA was estimated in a quantitative PCR and found to be negatively correlated with storage time. After excluding samples with insufficient DNA concentration for reliable genotyping, 382 samples were screened using between nine and seventeen canine and red fox specific microsatellites. Tooth samples were combined with 189 modem tissue samples. By assessing the age structure continuously throughout and after the rabies epizootic for the first population, population census size and age structure were found to be altered by the high rabies-induced mortality. In contrast, no long-term trends in genetic diversity were identified although a high variation of Ho, H e, Fis was discovered both in short-term and longer-term. A strong isolation-by-distance pattern was revealed for the second population by comparing individual pairwise genetic with spatial distances using modem samples. Furthermore, genetic data demonstrated that dispersal was sex- biased and diverted by the topography o f the landscape. When investigating isolation- by-distance patterns within the same population in 1971-73 and 1982-84 at lower population densities, density-dependant dispersal was observed. In conclusion, this study revealed no loss of genetic diversity in red foxes following a rabies epizootic despite a population bottleneck, yet highlights population density as an important factor to determine local spatial genetic structure.

ACKNOWLEDGEMENTS
There are many people who have provided invaluable support on both a professional
and a personal level and without whom this project would not have been possible.
First and foremost, I wish to thank Ruedi W olf who, in spring 1999, drew my attention
to some old card-boxes stacked with red fox tooth samples in the cellar o f the Institute
o f Veterinary Virology, Bem. At this time, neither of us realised that less than two
years later I would embark on an entire PhD project with these samples.
I would like to thank the past and present staff of the Swiss Rabies Centre, Reto
Zanoni and Uli Mueller, but in particular Alexander Wandeler and Andreas Kappeler,
who initiated, but more importantly, continued the systematic collection o f these tooth
samples a long time ago. A special thank goes to Matthias Ulrich for ageing a
considerable number o f teeth, and to Marcel Guntert, Christoph Meier, Peter Ltips and
Beatrice Liischer from the Natural History Museum in Bem, for logistic,
methodological and mental support. I would also like to thank Mr Rudin from the
Forensic Institute in Bem for introducing me into the technique o f DNA extraction
from hard tissues, and Mr Oetliker from the Technical Institute o f the Kocher Institute,
Bem, for manufacturing six simply undestroyable steel mortars.
Working for more than three years at the Institute of Zoology in London was, apart
from some frenzy days of teeth smashing, PCR and fragment analyses, a wonderful
experience. Listing all the people who directly contributed to this study or simply
made life at the IOZ special to me would be too far-reaching. Nonetheless, I would
like to mention and thank the following people: Sonia and Dada for always looking
after me, and Oliver, Simon and Lizzie for peacefully sharing such a tiny office. Daisy,
who by now would have got her own PhD and who I remember very fondly. I thank
Seirian, Katrien and Kate for significantly improving the writing o f this thesis, and
Zjef, Christine and Helmut for their wonderful friendship. Much gratitude further goes
to Bill, Simon and Mat,, but in particular to Jingliang for discussing and improving

some analyses of this study. Finally, I thank Richard for his statistical support of this
study.
I am especially grateful to Steve Smith and Phil Morin from the Max Plank Institute o f
Evolutionary Anthropology, Leipzig whose support and generosity improved this
study substantially. I further wish to thank Fridolin Zimmermann for his competent
GIS computing and Gaby Obexer for saving hundreds o f laboratory hours by drawing
my attention to a magical PCR multiplex mix. Furthermore, I like to thank Lukas
Keller and his group from the Zoological Museum in Zurich for their patience and
support.
Although I could already depend upon a huge collection of historic tooth samples
when I started this project, modem red fox samples were still needed. These were
kindly provided by Peter Voser, Georg Brosi, Hannes Jenny and Georg Gerig from the
hunting Authorities o f the Canton Aargau, Grisons and Uri. I further would like to
acknowledge Peter Deplazes and Daniel Hegglin from the Institute o f Parasitology,
Zurich for sharing their red fox samples.
I am very grateful to the Swiss Federal Offices for Education and Science, the Swiss
Agency for the Environment, Forests and Landscape and Federal Veterinary Office o f
Switzerland for financial support o f this project.
I would like to say special thanks to all o f my three supervisors: Urs Breitenmoser
from the Institute o f Veterinary Virology, University of Bem for his encouragement
since the very early days o f this project but in particular for his trust. Mike Bruford
from the Biodiversity and Ecological Process Research Group, Cardiff University for
his supervision and valuable help throughout the course of this project. But especially I
wish to thank Stephan Funk from the Institute of Zoology who had to deal with my
questions, problems, but also with my ups and downs and my impatience on a daily
bases. His support and his scientific enthusiasm were invaluable for this project.
Finally I am very grateful to my family and Leslie for all their support and love.
v

CONTENTS
General Introduction
Chapter 1 Decay o f nuclear DNA in historic tooth samples: patterns,
methodological constraints and solutions.
Chapter 2 Short microsatellite DNA markers for the red fox ( Vulpes
vulpes)
Chapter 3 Inferring dispersal in a continuous population of red foxes
using genetic methods.
Chapter 4 Temporal demography and genetic diversity of a red
fox population following a rabies epizootic.
Chapter 5 Density-dependent dispersal in a continuous red fox
population with changing density.
General Discussion
Bibliography
19
24
51
76
101
107
Appendices 119

GENERAL INTRODUCTION
The red fox is one of the best-studied wild carnivores worldwide. A large variety of
literature describes the red fox’s ecology and behaviour from the discovery o f its
occurrence in urban habitat (Teagle 1967) to its threat to native species in Australia
(Dickman et al. 1993). Most research on the red fox, however, has considered its role
as a potential carrier and vector for disease, particularly rabies. The impact of the last
rabies epizootic on the abundance of red fox populations in Europe has been
documented in several countries and, dependent on the initial density, was reported to
reduce populations substantially (Macdonald 1980; Macdonald & Voigts 1985). To
date, rabies has been eradicated in all Western European countries {reviewed in
Vitasek 2004). Nonetheless, the potential of re-infection is high (Chautan et al. 2000)
because most populations recovered from the rabies-induced mortality and have even
reached higher densities than prior the epizootic. Furthermore, rabies has remained
widespread in Eastern Europe (Vitasek 2004).
Rabies epidemiology is tightly associated with the social structure, population
dynamics and ecology o f the red fox (Steck & Wandeler 1980, Macdonald 1980). Fox
dispersal is considered an important cause o f the spread of rabies {e.g. Wandeler et al.
1974). Several studies have been carried out to describe fox density and social
organization and with these findings obtained, models on fox contact rate and its
implication for rabies control have been developed {e.g. Trewhella & Harris 1988,
White et al. 1995). Infected foxes change their behaviour shortly after infection (Steck
& Wandeler 1980, Artois et al. 1990). They become more active during daylight and
lose their territoriality. By entering into neighbouring territories the disease can
therefore be rapidly transmitted throughout the population (Artois et al. 1990). In
general, the dynamics o f rabies is a function o f the density o f foxes - or of the carrying
capacity o f the habitat type - and of their ability to disperse (Steck & Wandeler 1980,
Macdonald 1980, Funk 1994). As a consequence, dispersal distances and directions
have been the subject o f several field {reviewed in Chautan et al. 2000) and simulation
studies {e.g. Artois et al. 1997, Tischendorf et al. 1998). Dispersal in red foxes is
thought to be male biased and negatively correlated with population density
(Trewhella et al. 1988). Despite the importance of dispersal for the spread of rabies, so
1

INTRODUCTION
far, no study has yet applied population genetic methods to improve knowledge o f the
rabies epizootiology in red foxes.
In a more general context, dispersal is central to our understanding o f the ecology and
evolution o f species on a population and individual level (Clobert et al. 2001).
Nonetheless gaining direct information about dispersal in the field is difficult (Koenig
et al. 1996). As a consequence, population genetic methods based on Wright’s F-
statistics and neutral genetic markers have been widely used to infer the rate of
migration between populations (Neigel 2002). However, these estimates o f migration
often reflect past rather than current levels o f gene flow (Rousset 2001). Recently,
Rousset (2000) developed a method to infer dispersal pattern on an individual level
assuming isolation-by-distance (IBD , Wright 1943, 1946). By estimating dispersal at a
local scale, this method is less sensitive to temporal and spatial heterogeneity (Leblois
et al. 2004).
Infectious disease can threaten small and endangered populations by making them
more vulnerable to stochastic factors and, as a consequence, reducing their viability
(May 1988, Woodroffe 1999). In this context, disease might have a serious impact on
the genetic structure o f populations (O’Brien & Evermann 1988) by reducing the
population size significantly {i.e. demographic bottleneck). The consequence o f lower
genetic variability can limit the adaptive potential o f a population and increase the rate
o f inbreeding {e.g. Lande 1988). Despite the importance o f infectious diseases in
conservation, little is known about its potential influence on the genetic structure of
natural population. Furthermore, our understanding of mechanics, dynamics and
persistence o f disease in natural systems remains poor (Funk et al. 2001).
Recent advances in molecular methods have revealed genetic information of historic
samples by applying mitochondrial (Pichler & Baker 2000, Consuegra et al. 2002,
Hadly et al. 2004) and nuclear genetic markers {e.g. Bouzat et al. 1998, Groombridge
et al. 2000). Comparing the genetic structure o f historic and recent samples not only
permits an assessment o f the level o f genetic diversity for a given time period, but can
also provide and estimate for the rate at which genetic diversity changes (Pichler &
2

INTRODUCTION
Baker 2000). Furthermore, temporal changes in allele frequencies facilitate estimating
variance effective population size (e.g. Berthier et al. 2002) and population growth or
decline (Beaumont 2003). Nonetheless, as DNA degrades over time (reviewed in
Lindahl 1993), it is difficult to gain reliable genotype data from historic samples. In
addition, sample size and sampling information of museum collections are often
limited (Nielsen et al. 1999a). So far, only a few studies (e.g. Queney et al. 2000) have
estimated the impact o f an infections disease on the genetic structure in natural
populations. Finally, little is known about how changes in population size might affect
the spatial genetic structure within and between populations over time.
The main objective o f my thesis was to assess the population genetic structure within
two red fox populations following a rabies epizootic. Red foxes are substantially
hunted, providing easy access for post-mortem analyses and tissue for population
genetic studies. The convenience of the latter is further facilitated by the red fox’s
relatedness to the domestic dog. Indirectly, this guarantees access to a large set of
potential genetic markers (from the dog genome project). In Switzerland, monitoring
o f red foxes is unique since hunting statistics have been recorded since the early 20th
century. Following the arrival o f rabies in 1967, a long-term collection of foxes
throughout Switzerland has been carried out to observe the ongoing rabies epizootic
(Zanoni et al. 2000). As a result, a large number of historical tooth samples, individual
rabies virus tests and post-mortem data have been continuously collected over 35
years. Using these canine teeth as a source for DNA and accurate ageing, it was
possible to reconstruct past genetic and demographic population structure.
This thesis is subdivided into four independent chapters followed by a combined list o f
references. Contents and format o f each chapter are expected to represent one scientific
publication. The general aims and a brief summary for the four chapters are the
following:
The objective o f the first two chapters was to gain information on the quantity and
quality of extracted DNA from historic tooth samples and subsequently to assess their
feasibility for reliable genotyping. Moreover, patterns o f DNA decay were investigated
3

INTRODUCTION
by estimating the amount o f nuclear DNA for samples collected continuously over 35
years. Methodological solutions were explored to facilitate consistent and efficient
genotyping. The first chapter has already been published (Wandeler et. al. 2003a).
In the third chapter, the primary objective was to test for IBD within a continuous red
fox population. Topographic effects on dispersal were inferred by comparing pairwise
genetic with spatial distances in an IBD context. For this purpose, pairwise spatial
distances between individuals were computed using a Geographic Information System
(GIS). Based on the slope o f the regression between relatedness and spatial distance,
an estimate o f average dispersal distance was inferred and compared with demographic
data from the literature. In addition, sex-specific dispersal patterns were examined.
In chapter four, the effect o f rabies-induced mortality was assessed for age structure,
sex-ratio and genetic diversity o f a local red fox population. Analyses were based on
post-mortem data and historic and recent tooth samples, collected before, during and
after a rabies epizootic and covering continuously 35 years.
The primary aim of the last chapter was to assess the spatial genetic structure within an
growing and continuous red fox population. Individual based IBD was inferred for
three distinct time periods representing three different population densities. Average
gene dispersal distances were estimated for each period and temporal changes in allele
frequencies and genetic diversity between time periods were assessed.
4

CHAPTER 1_____________________________________
Decay of Nuclear DNA in Historic Tooth Samples:
Patterns, Methodological Constraints and Solutions.
AbstractThe amount o f nuclear DNA extracted from teeth of 279 individual red foxes {Vulpes
vulpes) collected the last three decades was determined by quantitative PCR. Although
teeth were autoclaved during initial collection, 73.8% o f extracts contained sufficient
DNA concentration (> 5pg/pL) suitable for reliable microsatellite genotyping.
However the quantity o f nuclear DNA significantly decreased over time in a non-linear
pattern. The success o f PCR amplification using four examined canine microsatellites
was dependent on fragment size and storage time. By including data from two different
tests for human contamination and from frequencies of allelic dropout and false alleles,
the methodological constraints o f population genetic studies using microsatellite loci
amplified from historic DNA are discussed.
5
CHAPTER 1
Introduction
Historic samples o f species are an important source for DNA in conservation and
evolutionary studies. They allow us to reveal the evolutionary history of extinct
species (e.g. Shapiro et al. 2002) and to address loss o f genetic variation in species
with declining populations (e.g. Bouzat et al. 1998, Pichler & Baker 2000, Pertoldi et
al. 2001). Furthermore, samples collected over several generations from different
populations allow us to identify temporal dynamics of gene flow, genetic drift and
selection (Nielsen et al. 1999a).
Nucleic acids gradually degrade over time owing to the accumulation of hydrolytic and
oxidative damage (reviewed in Lindahl 1993). Thus one o f the main problems in using
ancient and historic samples for genetic studies - apart from the frequently limited
number o f samples and sample information available (Nielsen et al. 1999a) - is related
to problems arising from low concentrations of DNA (Taberlet et al. 1996) and
degraded DNA (Nielsen et al. 1999b). Studies using ancient DNA preferentially utilise
mitochondrial DNA markers, mainly because up to 1000 more DNA copies per cell are
available compared to single-copy nuclear DNA (Hoss 2000). Even so, small nuclear
DNA sequences can be amplified in well-preserved specimens, as demonstrated in
permafrost mammoth samples from the late Pleistocene (Greenwood et al. 1999). In
fact, individual DNA profiles from human specimens up to 3,000-year-old were
assessed by simultaneous amplification of microsatellite loci (Hummel et al. 1999).
Using these polymorphic genetic markers to genotype historic samples allows the
identification o f spatial and temporal genetic structure of natural populations,
especially when historic and recent samples can be combined (e.g. Nielsen et al.
1999a, Bouzat et al. 1998, Pertoldi et al. 2001). However, there may be a bias in
genotyping results due to genotyping errors in samples with degraded DNA or very
low amounts of DNA, and consequently special precautions are needed in order to
ensure the accuracy o f microsatellite data (e.g. Navidi et al. 1992, Taberlet et al. 1996,
Morin et al. 2001).
One error that may occur is allelic dropout, which is though to be the stochastic
amplification of only one o f two alleles at a heterozygote locus. Allelic dropout is
mainly explained by stochastic events when pipetting very diluted DNA (Taberlet et
6

CHAPTER 1
al. 1996). The clear relationship between the initial amount o f template DNA and the
proportion o f PCRs with allelic dropout in microsatellite markers was demonstrated by
Morin et al. (2001) by initially quantifying the amount of extracted DNA from non-
invasive samples using a quantitative PCR (qPCR) assay. Furthermore, low numbers
o f target molecules can also lead to PCR-generated false alleles, probably
corresponding to slippage during the first few cycles o f amplification (Taberlet et al.
1996, Goossens et al. 1998).
Although the decay o f nuclear DNA over time has been demonstrated in a number of
empirical studies (e.g. Nielsen et al. 1999b, Hummel et al. 1999), to the best of my
knowledge it has not previously been quantified. The objective o f this study was to
quantify amplifiable amounts o f nuclear DNA extracted from samples o f red fox teeth
collected and stored over a period of 30 years, to test their quality in relation to storage
time and to discuss methodological limitations when using this DNA as a template for
microsatellite amplification.
Methods
Historic tooth samples
Since 1967, hunters and game wardens provided red fox carcasses throughout
Switzerland to the Swiss Rabies Centre at the University of Bem for the surveillance
o f rabies. Individual data were systematically recorded on date o f delivery and
included sex and site o f origin. Age of individuals was initially estimated as either
juvenile or adult by measuring the relative width of the pulp cavity of a canine tooth by
X-ray (Kappeler 1985). In order to extract the caninus tooth, the lower jaw of each
carcass was removed and autoclaved with the objectives of eradication of any rabies
virus and facilitation o f removal of the teeth. One tooth per individual was then fixed
onto strong paper by adhesive tape and X-rayed. Subsequent storage o f teeth was at
room temperature in laboratories or cellars until 2000, when all teeth were moved to
the Natural History Museum o f Bem for archiving. A portion (10mm) o f the root-tip of
all adult individuals was removed and subsequently aged by counting annual
7
CHAPTER 1
cementum lines (Kappeler 1985)1. Under the assumption that all animals were bom on
the 1st April, we estimated lifespan in months. Individual storage time o f teeth was
calculated as the number of days between delivery to the Swiss Rabies Centre and
DNA extraction date.
DNA extraction from teeth
DNA from tooth samples was extracted following a revised protocol after Yang et a l
(1998) using a PCR purification kit (QLAquick®, Qiagen). For juveniles the whole
tooth, or for adults, the tooth crown remaining after ageing was sealed in a zip-bag and
frozen for 20s in liquid nitrogen. After grinding the sample in a small steel mortar, the
powder was transferred into a 2mL microcentrifuge tube and 1.1 - 1.7mL of EDTA
buffer (0.5M, pH 8.0) was added. The mixture was incubated under agitation at room
temperature for 72h. The samples were digested twice at 56°C under agitation over
night. For the first digestion, 60pL of 10% N-sarcosyl and 540pg o f proteinase K were
added. For the second digestion, an additional 260pg of proteinase K was used. After
centrifugation, lm L o f supernatant was transferred in a lOmL tube containing 5mL PB
Buffer (Qiagen) and mixed. The remaining supernatant was stored at -70°C for future
DNA extractions. DNA was bound to the QLAquick silica membrane using a vacuum
manifold (QIAvac24; Qiagen) at -400mmHg. Multiple loading was avoided by
transferring the total solution into a small funnel (55mm disposable funnel; CAMLAB)
resting on the QIAquick column. Silica membranes were washed twice with 500pL of
PE Buffer (Qiagen) and then dried by centrifugation. DNA was eluted in 100pL of
lOmM Tris-Cl (pH 8.5) and diluted to a final volume of 200pL with distilled water.
Before each extraction mortars and disposable equipment were decontaminated by
exposure to UV-light or by thoroughly rinsing with 4% bleach.
Quantification o f nuclear DNA2
Total amount o f extracted nuclear DNA was estimated by qPCR. A 5’ exonuclease
assay was used, which targets an 81 bp portion of the highly conserved c-myc proto
oncogene (Morin et al. 2001). The assay was performed using an ABI Prism® 7700
Sequence Detector (ABI) in 20pL PCR reactions containing 5pL of DNA extract as
1 All tooth samples were aged by Matthias Ulrich, Bem, CH.2 QPCR assay was developed by Phil Morin and Steve Smith, Leipzig, G. Quantification o f nuclear DNA was performed by PW and Steve Smith.
8

CHAPTER 1
described in Smith et al. (2002). A triplicate set o f eight standards of known DNA
quantity and no-template controls were included in the assay. A single preparation of
the PCR reagent mix for all DNA extracts, standards and controls was applied.
Amounts o f nuclear DNA per PCR sample were estimated on the basis of the standards
according to Morin et al. (2001). The total quantity o f extractable DNA per tooth was
then estimated taking into account the proportion of supernatant, which was not
extracted after the digestion steps.
Human contamination tests3
The c-myc81 assay does not target exclusively the DNA of a species of interest, but
also contaminant human or other DNA, if present. Consequently, we tested all extracts
for contamination using two different methods. The first method is based on
differences between red fox and human target sequences in 5’ exonuclease assay
efficiency caused by oligonucleotide mismatches (Smith et al. 2002). The efficiency of
the #PCR amplification for all extracts was attained by using a 239bp assay targeting
the c-myc proto-oncogene and by subsequent comparison o f amplification plot slopes
(APS; Smith et al. 2002 / Red fox template DNA does not perfectly match the 5’
exonuclease assay probe in the c-myc239 assay (three mismatches, data not shown),
leaving a less efficient template for cleavage o f the probe. Dilution series of known
levels of human and red fox DNA (percentage o f human DNA were: 100, 75, 50, 40,
25, 15, 10, 5, 2.5, 1, 0.5 and 0; a constant total DNA concentration o f 6ng/pL was
maintained) were analyzed to define the threshold of APS value to detect human
contamination. PCR conditions were identical with c-myc81 except that the annealing
temperature was reduced from 59°C to 55°C and the subsequent ramp time to 95°C
was slowed to 45s.
The second test for contamination with human DNA utilized a human microsatellite
(HLABC-CA2; International Histocompatibility Working Group; www.ihwg.org) of
small fragment-size (between 96 - 134bp). PCR was performed in a lOpL reaction
volume containing 2pL o f DNA extract, 0.5mM dNTPs, 3pmol primers, 2pg BSA,
0.4U HotStarTaq (Qiagen), PCR-buffer (Qiagen) and 2mM MgCb- PCR was carried
out in a GeneAmp ® PCR System 9700 (ABI) using the following cycling parameters:
lOmins o f initial denaturation at 95°C, followed by 50 cycles of 25s at 94°C, 30s at
3 APS - values were computed by Steve Smith and PW.
9
CHAPTER 1
60°C annealing temperature and 40s extension at 72°C, finished by a final extension of
12mins at 72°C. All PCR products were electrophoretically separated using an ABI
Pnsm 377 DNA sequencer (ABI). Allele sizes were scored against the size standard
GS350 Tamra™ (ABI) using GENESCAN™ Analysis and GENOTYPER™ software.
Canine microsatellite markers
All DNA extracts were genotyped twice for four canine microsatellites (AHT-130;
Holmes et al. 1995; CXX-466, CXX-374 and CXX 436; all Ostrander et al. 1995),
which amplify fragment sizes ranging from 118 to 246bp in red fox. PCR was carried
out in a 6pL reaction volume containing 2pL o f template DNA, 0.5mM of dNTPs,
2.5pmol primers, 1.2pg of BSA, 0.3U HotStarTaq® (Qiagen), PCR PARR™ Buffer
(CAMBIO) and 1.5mM MgCh. Cycling conditions and genotyping procedure were
identical with HLABC-CA2 apart from locus specific annealing temperatures (AHT-
130: 56°C; CXX-466, CXX-374 and CXX-436: 60°C). The number o f positive
amplifications in two independent PCR reactions was recorded. Two subsets of
samples collected before 1974 (n = 48) and after 1994 (n = 41), respectively, were
genotyped a further three times to a total of five independent PCR amplifications for
loci AHT-130, CXX-466 and CXX-374. For these two subsamples, the frequency of
allelic dropout and false alleles across successful PCR amplifications was calculated
only for extracts with three or more positive amplifications per locus.
The DNA extraction of the teeth and the PCR preparations for the human and canine
microsatellite markers were performed within a spatially isolated laboratory dedicated
for samples with low-copy DNA at the Institute of Zoology in London, UK.
Throughout all procedures, special care was taken to avoid cross-contamination and
contamination with contemporary DNA. Replicas of the canine microsatellite
amplifications for all four polymorphic loci together with the sequential number and
batch number of the DNA extraction allowed to detect contamination and hence to
verify the viability o f individual genotypes. Extraction and genotyping was not
replicated in a second laboratory because no such evidence for contamination between
extracts or contamination with contemporary fox DNA was obtained (Hofreiter et al.
2001). QPCR assays were carried out at the Laboratories for Conservation Genetics in
Leipzig, Germany.
10
CHAPTER 1
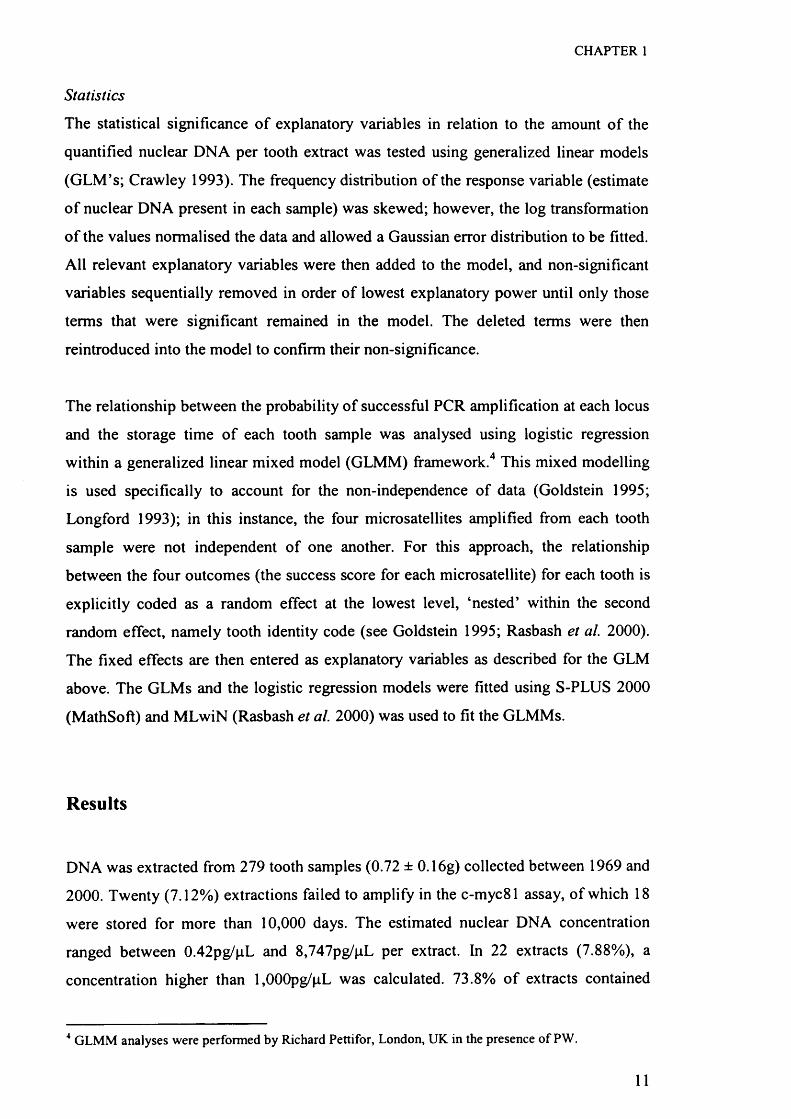
Statistics
The statistical significance o f explanatory variables in relation to the amount o f the
quantified nuclear DNA per tooth extract was tested using generalized linear models
(GLM’s; Crawley 1993). The frequency distribution of the response variable (estimate
o f nuclear DNA present in each sample) was skewed; however, the log transformation
o f the values normalised the data and allowed a Gaussian error distribution to be fitted.
All relevant explanatory variables were then added to the model, and non-significant
variables sequentially removed in order of lowest explanatory power until only those
terms that were significant remained in the model. The deleted terms were then
reintroduced into the model to confirm their non-significance.
The relationship between the probability of successful PCR amplification at each locus
and the storage time o f each tooth sample was analysed using logistic regression
within a generalized linear mixed model (GLMM) framework.4 This mixed modelling
is used specifically to account for the non-independence of data (Goldstein 1995;
Longford 1993); in this instance, the four microsatellites amplified from each tooth
sample were not independent of one another. For this approach, the relationship
between the four outcomes (the success score for each microsatellite) for each tooth is
explicitly coded as a random effect at the lowest level, ‘nested’ within the second
random effect, namely tooth identity code (see Goldstein 1995; Rasbash et al. 2000).
The fixed effects are then entered as explanatory variables as described for the GLM
above. The GLMs and the logistic regression models were fitted using S-PLUS 2000
(MathSoft) and MLwiN (Rasbash et al. 2000) was used to fit the GLMMs.
Results
DNA was extracted from 279 tooth samples (0.72 ± 0.16g) collected between 1969 and
2000. Twenty (7.12%) extractions failed to amplify in the c-myc81 assay, of which 18
were stored for more than 10,000 days. The estimated nuclear DNA concentration
ranged between 0.42pg/pL and 8,747pg/pL per extract. In 22 extracts (7.88%), a
concentration higher than l,000pg/pL was calculated. 73.8% o f extracts contained
4 GLMM analyses were performed by Richard Pettifor, London, UK in the presence of PW.
11

CHAPTER 1
sufficient DNA concentration (> 5pg/pL) in 200pL volume suitable for microsatellite
genotyping (Morin et al. 2001).
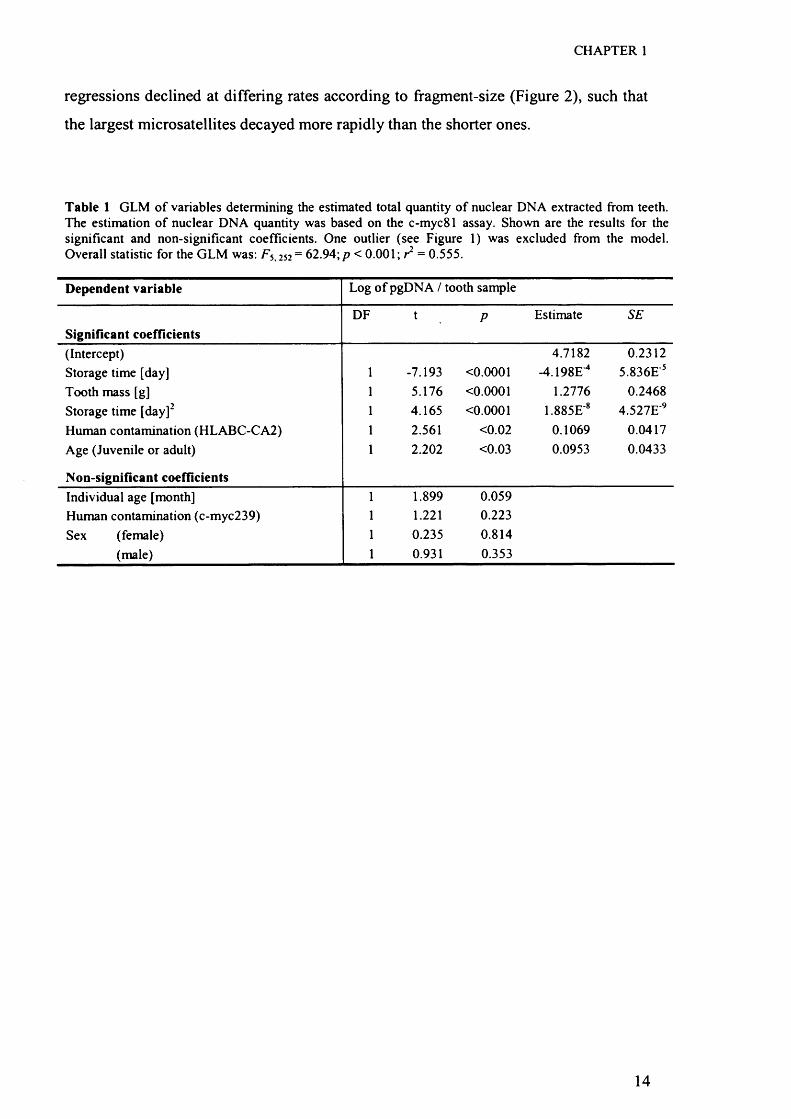
Statistical analyses showed that storage time was a highly significant explanatory
variable (Figure 1; p < 0.0001), alongside tooth mass and the age o f the individual
(juvenile or adult; Table 1). The quantified amount of DNA extracted from each tooth
sample decayed non-linearly with storage time (Figure 1). The presence of human
contamination also significantly explained some o f the total variance in the estimated
amount of DNA extracted; however, this was only true for the microsatellite based
(HLABC-CA2) method, and not for the qPCR (c-myc239) based approach (Table 1).
Across the series o f twelve known contamination levels, the APS values for the c-
myc239 assay varied between 0.030 for 100% fox DNA to 0.124 for 100% human
DNA (data not shown). Based on these results, an APS value greater than 0.045 was
taken to indicate human contamination level of at least 5% because smaller levels of
human contamination could not be reliably distinguished from pure fox DNA. In total,
107 samples (38.9%) failed across all 275 tested extracts. Based on the predefined
threshold APS value, 109 (64.9%) of the 168 remaining extracts indicated human
contamination. Human contamination was detected in 110 (40.0%) o f 279 tested
samples by microsatellite typing (HLABC-CA2) and a total number of 13 different
human alleles were revealed. The mean number o f amplified alleles across
contaminated extracts was 1.423 (range 1-3). Both test revealed human contamination
in 72 (25.8%) samples, whilst one or the other test indicated contamination in a further
60 (21.5%) samples.
12

CHAPTER 1
106 -
o2
o o
<z O oQO O O
4,0000 2,000 6,000 8,000 10,000 12,000
Storage time [days]
Figure 1 Relationship between the estimated quantity o f nuclear DNA (c-myc81 assay) in DNA extractions from teeth versus storage time. Note that values for the estimated quantity o f nuclear DNA are shown in a logarithmic scale on the y axis. The cross refers to an outlier, by excluding this sample the equation for the regression is: log(DNA quantity) = 5.550 - 3.862E"4 * time + 1.597E'8 * time2 ; r2 = 0.471).
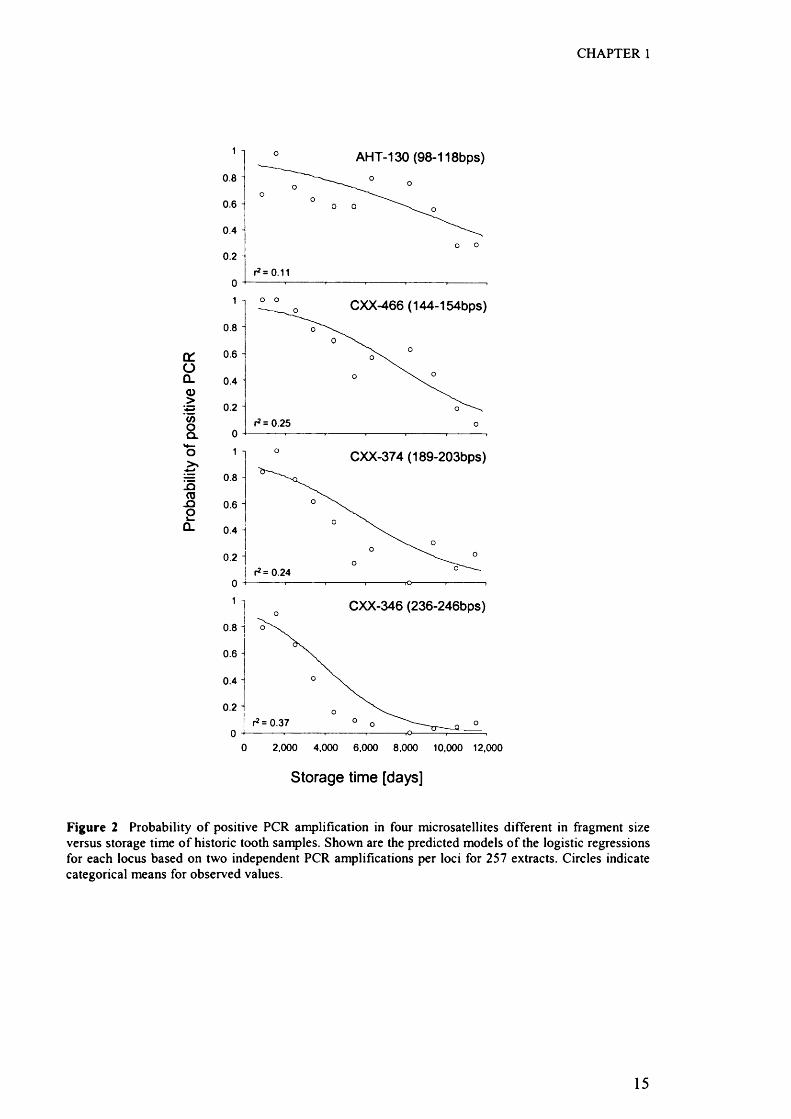
Across all four loci, the probability of a positive amplification of the two independent
PCR reactions declined significantly with storage time (X*i = 151 J ; p < 0 .001, Figure
2). After controlling for storage time, there were also significant differences in the
probabilities o f amplification across the four microsatellites (A’S = 155.7; p < 0.001).
The mean observed success-rate in two independent PCR reactions were 0.56 (AHT-
130), 0.54 (CXX-466), 0.39 (CXX-374) and 0.27 (CXX-436). Based on their joint
confidence intervals (to account for multiple testing) there were significant differences
between all pair-wise comparisons across all loci (all p < 0.0001), except between loci
AHT-130 and CXX-466 (X2] = 0.60; ns). Amplification performance among the four
canine loci was dependent on fragment-size, as indicated by the dissimilar slopes for
positive PCR and as represented by a significant interaction between time and
microsatellites (X2} = 33.1; p < 0.001, Figure 2). Whilst all four loci showed similar
PCR performance in more recently collected tooth samples, the slopes of the
13
CHAPTER 1
regressions declined at differing rates according to ffagment-size (Figure 2), such that
the largest microsatellites decayed more rapidly than the shorter ones.
Table 1 GLM o f variables determining the estimated total quantity o f nuclear DNA extracted from teeth. The estimation o f nuclear DNA quantity was based on the c-myc81 assay. Shown are the results for the significant and non-significant coefficients. One outlier (see Figure 1) was excluded from the model. Overall statistic for the GLM was: Fs, 252= 62.94; p < 0.001; r2 = 0.555.
Dependent variable Log o f pgDNA / tooth sample
Significant coefficientsDF t P Estimate SE
(Intercept) 4.7182 0.2312Storage time [day] 1 -7.193 <0.0001 -4.198E-4 5.836E'5Tooth mass [g] 1 5.176 <0.0001 1.2776 0.2468Storage time [day]2 1 4.165 <0.0001 1.885E'8 4.527E'9Human contamination (HLABC-CA2) 1 2.561 <0.02 0.1069 0.0417Age (Juvenile or adult) 1 2.202 <0.03 0.0953 0.0433
Non-significant coefficientsIndividual age [month] 1 1.899 0.059Human contamination (c-myc239) 1 1.221 0.223Sex (female) 1 0.235 0.814
(male) 1 0.931 0.353
14
CHAPTER 1
1 AHT-130 (98-118bps)0.8
0.6
0.4
0.2
01 o o CXX-466 (144-154bps)
0.2 -
Q.**—O 1 o CXX-374 (189-203bps)
0.8 -
0.4 i
0.2 -
CXX-346 (236-246bps)
0.6 -
0.4 -
0.2 -
0 2,000 4,000 6,000 8,000 10,000 12,000
Storage time [days]
Figure 2 Probability o f positive PCR amplification in four microsatellites different in fragment size versus storage time o f historic tooth samples. Shown are the predicted models o f the logistic regressions for each locus based on two independent PCR amplifications per loci for 257 extracts. Circles indicate categorical means for observed values.
15

CHAPTER 1
Mean storage time ± SD for the two sample sets collected before 1974 and after 1994
were 1,461 ± 472 and 10,640 ± 327 days, respectively. The frequencies of allelic
dropout within the subsample ‘>1994’ compared with subsample ‘<1974’ were
consistently smaller for the three examined loci (AHT-130: 2.69% vs. 17.91%; CXX-
466: 2.50% vs. 19.64% and CXX-374: 8.15% vs. 52.20%). Further the frequency o f
allelic dropout for both subsamples was considerably higher for the largest examined
locus CXX-374 compared with AHT-130 and CXX-466 (Table 2). The frequency of
false alleles ranged between 0.0% and 4.00% across the three loci and subsample
(Table 2).
Table 2 Frequency o f allelic dropout and false alleles o f three microsatellite loci in two subsamples o f teeth extractions across a total of five independent PCR amplifications with three or more successful amplification. Shown are the total number of tested (n) and successful extracts, mean o f successful PCR amplifications per extract, and the percentage (total number) of allelic dropout and false alleles.
n Successful extracts Allelic dropout False alleles
AHT-130 (98-118bps)r v i i i - i v / i i u o p
<1974 48 17 3.94 17.91 (12) 2.99 (2)>1994 41 41 4.53 2.69 (5) 1.08 (2)
CXX-466 (144-154bps)<1974 48 13 4.30 19.64 (ID 1.79 (1)>1994 41 41 4.87 2.50 (5) 1.00 (2)
CXX-374 (189-203bps)<1974 48 6 4.17 52.00 (13) 4.00 (2)>1994 41 40 4.84 8.15 (15) 0.00 (0)
Discussion
A unique set o f historic tooth samples collected continuously over three decades
provided the opportunity to describe and to quantify the pattern o f nuclear DNA decay
over time. This study indicates that historic teeth can be a good source for extracting
DNA even after being autoclaved and stored at room temperature. Similar findings of
the usefulness o f tooth samples as a reliable source for DNA from museum samples
were described e.g. by Pichler & Baker (2001) and Pertoldi et al. (2001). Nevertheless,
nuclear DNA degraded rapidly in a non-linear pattern in the examined teeth and PCR
amplification from older samples often failed or did not provide reliable genotyping.
16
CHAPTER 1
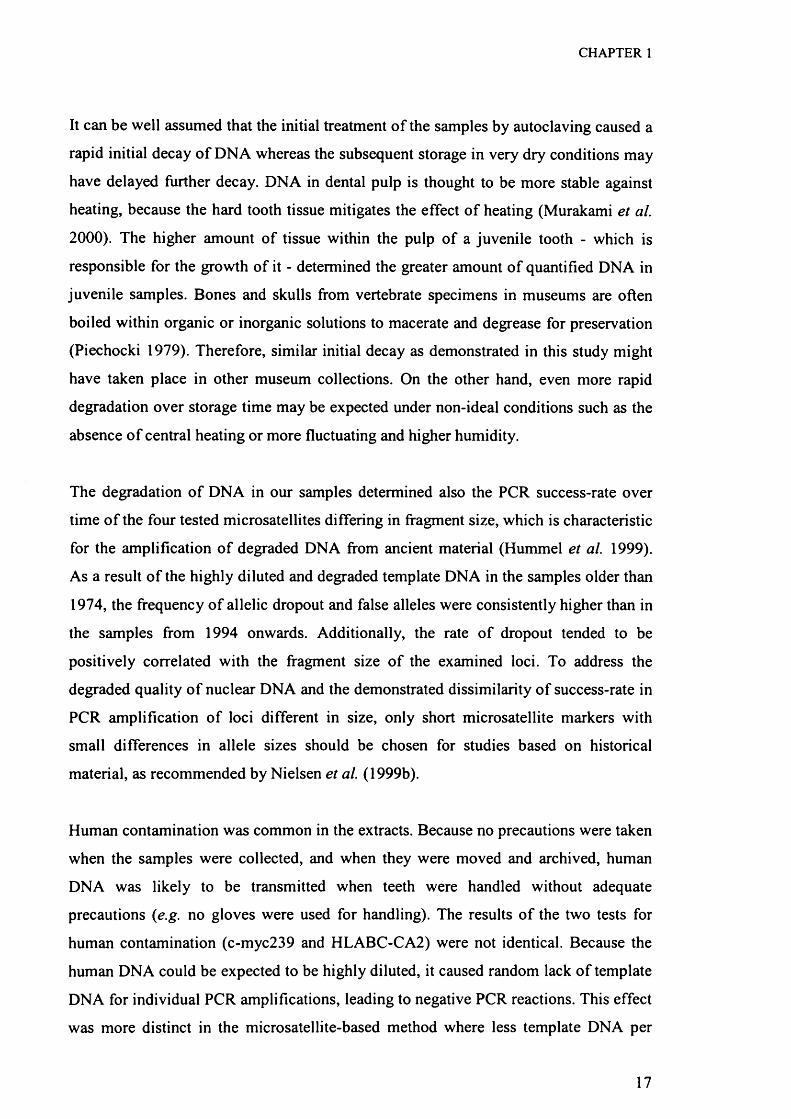
It can be well assumed that the initial treatment o f the samples by autoclaving caused a
rapid initial decay o f DNA whereas the subsequent storage in very dry conditions may
have delayed further decay. DNA in dental pulp is thought to be more stable against
heating, because the hard tooth tissue mitigates the effect o f heating (Murakami et al.
2000). The higher amount of tissue within the pulp of a juvenile tooth - which is
responsible for the growth of it - determined the greater amount of quantified DNA in
juvenile samples. Bones and skulls from vertebrate specimens in museums are often
boiled within organic or inorganic solutions to macerate and degrease for preservation
(Piechocki 1979). Therefore, similar initial decay as demonstrated in this study might
have taken place in other museum collections. On the other hand, even more rapid
degradation over storage time may be expected under non-ideal conditions such as the
absence o f central heating or more fluctuating and higher humidity.
The degradation o f DNA in our samples determined also the PCR success-rate over
time o f the four tested microsatellites differing in fragment size, which is characteristic
for the amplification o f degraded DNA from ancient material (Hummel et al. 1999).
As a result o f the highly diluted and degraded template DNA in the samples older than
1974, the frequency o f allelic dropout and false alleles were consistently higher than in
the samples from 1994 onwards. Additionally, the rate of dropout tended to be
positively correlated with the fragment size of the examined loci. To address the
degraded quality o f nuclear DNA and the demonstrated dissimilarity of success-rate in
PCR amplification of loci different in size, only short microsatellite markers with
small differences in allele sizes should be chosen for studies based on historical
material, as recommended by Nielsen et al. (1999b).
Human contamination was common in the extracts. Because no precautions were taken
when the samples were collected, and when they were moved and archived, human
DNA was likely to be transmitted when teeth were handled without adequate
precautions {e.g. no gloves were used for handling). The results o f the two tests for
human contamination (c-myc239 and HLABC-CA2) were not identical. Because the
human DNA could be expected to be highly diluted, it caused random lack o f template
DNA for individual PCR amplifications, leading to negative PCR reactions. This effect
was more distinct in the microsatellite-based method where less template DNA per
17

CHAPTER 1
single PCR reaction was used. A second explanation for the dissimilar results of the
two tests might lie in the minimum level of human template DNA required for
detection in the qPCR assay, which was probably not attained in some of the
contemporary samples with a high quantity o f red fox DNA. Finally, the 239bp long c-
myc239 qPCR could have simply failed because the nuclear DNA was too degraded in
older samples. Although the general presence o f traces of human DNA does not
influence the outcome of non-human species-specific genotyping, the incidence of
contamination has to be addressed on an individual level when samples are pre
screened to quantify the amount of nuclear DNA for accurate genotyping (Morin et al.
2001).
Comparing the genetic composition of past and recent populations is a convincing
approach to gain new and valuable insight in a population’s interaction with its
environment over time. As demonstrated in this study, nuclear DNA can rapidly decay,
leaving only low copy numbers of degraded template DNA for microsatellite
amplification. Moreover, the decay may reduce significantly the number of samples
suitable for analysis. Since the risk of genotyping error and in particular the frequency
o f allelic dropout covaries with the available concentration of DNA (Morin et a l 2001)
and with fragment size (in this study), the genetic polymorphism of older samples can
be systematically underestimated. This might be the case when the number of required
repetitions for accurate genotyping of homozygotes is defined by the frequencies of
allelic dropout averaged over all individuals (Gagneaux et al. 1997). Hence, for each
individual, independent replications of PCR reactions (Navidi et al. 1992, Taberlet et
al. 1996, but see Valiere et al. 2002) are consequently needed for reliable genotyping.
This multiple tubes approach (Taberlet et al. 1996) requires a priori, and without
consideration o f the likelihood of allelic dropout, as defined by DNA quantity, a
substantial number o f replicates - including failed PCR amplifications - which will
limit the number o f analysable loci (Morin et al. 2001). Quantification of DNA is
extremely useful not only because it identifies those DNA extracts with increased
likelihood o f dropout, but also because it avoids waste of limited samples when DNA
quantity is high (Morin et al. 2001).
18
CHAPTER 2__________________________________
Short microsatellite DNA markers for the red fox
{Vulpes vulpes).
AbstractSeven short microsatellites loci (< 165bps) and species-specific primers were
characterized for red foxes with the emphasis to amplify degraded DNA from historic
samples. Following PCR amplification using primers developed in the domestic dog,
red fox specific primers were designed within the flanking region. The number of
detected alleles ranged between six and 15 alleles and the expected heterozygosities
ranged between 0.67 and 0.92. No deviations from Hardy-Weinberg equilibrium were
detected for any of the markers.
19
CHAPTER 2
The red fox ( Vulpes vulpes) is one of the best-studied wild mammals worldwide. A
large variety o f literature is available on red fox ecology and behaviour, it’s
introductions and the resulting implications for endangered species and its role as a
vector of zoonotic diseases. Several studies have applied dog-specific microsatellite
primers to assess the genetic structure between and within red fox populations (Baker
et al., 2004; Lade et al., 1996; Robinson, Marks, 2001; Swanson et al., 2005;
Wandeler et al., 2003a).
Comparing historic and recent samples allows to assess the temporal dynamics of
genetic drift, gene flow and selection. However, DNA degrades over time (Lindahl,
1993) and as a consequence the success of PCR amplification in microsatellites from
historic DNA is found to be higher for shorter PCR products {e.g. Hummel et al.,
1999; Nielsen et al., 1999; Wandeler et al., 2003b). PCR success for historic DNA
samples is also reduced by the use of degenerate primers since degenerate primers
have an increased likelihood of primer mismatches. Furthermore, primer mismatches
can increase the potential of null-alleles. The aim of this study was to design primers
that are specific for red foxes and produce short PCR products. New primers were
designed in the flanking region o f microsatellites amplified using primers
characterized in domestic dogs {Canis familiaris).
Eight canine microsatellite loci (AHT-142, Holmes et al. unpublished; CXX-374,
CXX-402, CXX-436, CXX-468, CXX-502, CXX-602, CXX-622; all Ostrander et al.,
1995) were selected, based on successful cross-specific amplification o f red foxes
(Funk, unpublished), and screened in three samples representing different Swiss
populations. PCR was carried out in a 30 pL reaction volume consisting of 3 pL of
template DNA, 0.8 pM o f each dNTP, 0.5 U of taq polymerase and two different
20

CHAPTER 2
MgCh concentrations (1.5 mM and 3 mM, respectively). PCR amplification was
performed in a GeneAmp® PCR System 9700 (ABI) using the following cycling
parameters: 4 min of initial denaturation at 95 °C, followed by 30 cycles o f 30 s at 94
°C, 30 s at two annealing temperatures (60 °C and 55 °C, respectively) and 30 s
extension at 72 °C, and a final extension o f 10 min. PCR products were
electrophoretically separated on an agarose gel alongside size standards and visually
analysed with regard to amplification intensity and size. The most unambiguous PCR
products for the three individuals across the two different MgCh concentrations and
annealing temperatures were pooled for each locus and subsequently purified using a
PCR purification kit (QIAquick®; Qiagen). Purified PCR products were cloned using
standard TA cloning following the manufacturer’s protocol (TOPO TA Cloning® kit or
TA Cloning® kit; Invitrogen). Plasmids were tested for the correct insert size by ECO-
R1 digestion and plasmid DNA was subsequently purified using the QIAGEN’s
miniprep kit (QIAprep®). Forward and reverse sequencing was performed using
BigDye™ Terminator v3.0 (ABI), Better Buffer (webscientific) chemistry on a ABI
Prism® 377 DNA sequencer. Sequences were aligned and edited in B io E d it (v.5.0.9.).
Between one and six clones were sequenced for each primer pair.
Sequence data o f between one and six different clones for each locus revealed
microsatellite tandem repeats homologous to the domestic dog. In addition, several
point mutations and deletions within the flanking regions were detected (data not
shown). Finally, primers specific for red foxes were designed in P rim e r3 (Rozen,
Skaletsky, 2000).
21
CHAPTER 2
Fox-specific primers were tested in 26 foxes from Eastern Switzerland. Genomic DNA
was isolated from muscle tissue using a Wizard® SV96 Genomic extraction kit
(PROMEGA). Amplification was conducted in a final volume o f 6 pL containing 3 pL
o f PCR master-mix (Qiagen’s PCR multiplex kit), 0.2 pM o f each primer (one of
which was labelled with a fluorescent dye) and 2pL o f template DNA. PCR was
performed in a GeneAmp® PCR System (ABI) using the following cycling parameters:
15 min o f initial denaturation at 95 °C, followed by 30 cycles o f 30 s at 94 °C, 120 s at
58 C° and 60 s extension at 72 °C and a final extension of 30 min at 60 °C. Fragment
analysis was performed on a ABI Prism® 377 DNA sequencer (ABI).
Fragment analysis for V I42, V374, V402, V468, V502, V602 and V622 indicated
consistent results across different alleles and individuals. However, allele sizes for
V I42 and V602 followed a mononucleotide repeat distribution, most likely caused by
an inconsistent single nucleotide deletion within the flanking region. Locus V436
showed irregular positive stutter-bands for several of the scored alleles and was
therefore excluded from further analyses. The number of alleles per locus, fragment
size range and observed and expected heterozygosity are listed in Table 1. PCR
success across all individuals and loci was 100%. Using G enepop v3.1 (Raymond,
Rousset, 1995; probability-test), no significant deviation from Hardy-Weinberg
equilibrium was detected. By combining these seven red fox specific genetic markers
with eight short canine microsatellite markers (AHT-130, Holmes et al., 1995; CXX-
156, CXX-250, CXX-279 Ostrander et al., 1993; CXX-434, CXX-466, CXX-606,
CXX-608, Ostrander et al., 1995; all less than 175 bps in size, Wandeler et al.,
unpublished) a set o f highly polymorphic genetic markers to study historic samples of
red foxes is now available.
22

CHAPTER 2
Table 1 Characterization o f seven red fox ( Vulpes vulpes) microsatellite loci based on a sample o f 26 individuals.
Locusdog fox
Nc Repeat pattern Primer sequence 5 ’-> 3 ’
Size range [bp]
n a H0 h e
AHT-142 V142 3 (TG)i4|6,18AAGCAGATCCTAGAGCAGCACCCCACAGTTTAGAAATATCTGC 133-148 10 0.85 0.80
CXX-374 V374 6 (CA)g.j3 GACAGAAAGACAGAAGGCTTAGTACACACAGGAAGTAATGGGG 106-118 6 0.88 0.89
CXX-402 V402 3 (TG)9h i3 GGGTAATTCATCCAGTGCCTTTATGCAAACATGCAAACATGC 7 8 -9 0 7 0.69 0.78
CXX-468 V468 4 (AC)|6-|9TCTCCCACCCAAATCTCTTGGCCTGTAGACTTTTTAGTCCCG 8 2 -9 4 7 0.96 0.92
CXX-502 V502 1 (AC)8T(CA)7 ACCCAAGTGTCCTCCATAGATTGGCCAAGTACTCTTCCACT 7 9 -9 1 6 0.62 0.67
CXX-602 V602 5 f'rT'k ( C A \ CAGCCTGGACTACAATTCTCTTT t'- 1 ll3,l4,18\C^vl5,18,l9 CCCCAAGTCTTTTGTCCAGA 140- 162 15 0.88 0.77
CXX-622 V622 4 (TG)i7.2oTTTTTTGAAAAGCACACCCTGCTTTGTGTATCTTTTCTTTC 91 - 115 6 0.73 0.77
jVc, Number o f different clone sequences (GenBank accession nos AXXX - AXXX)Na, Number o f alleles; HQ, observed heterozygosity; HE expected heterozygosity
23

CHAPTER 3
Inferring Dispersal in a Continuous Population of
Red Foxes Using Genetic Methods.
AbstractDispersal is one o f the most important factors in shaping the genetic structure of
populations. An understanding of dispersal is consequently essential when studying
the ecology, evolution and conservation of a species. Yet, gaining direct information
on dispersal in natural populations is considered to be difficult. In an attempt to better
understand dispersal in red foxes ( Vulpes vulpes), individual genetic and accurate
spatial data o f a continuous population in the Swiss Alps (study area of 4189km2)
were combined to obtain indirect estimates of sex-bias, distances and direction of
dispersal. A total of 145 tissue samples were sexed using a molecular marker (SRY)
and genotyped using 17 microsatellite loci. Isolation-by-distance (IBD) was tested by
comparing pairwise individual genetic with Euclidian spatial distances. Given the
slope o f the IBD regression and effective population size, the mean effective dispersal
distance was inferred and contrasted with a demographic estimation of dispersal
distance from mark-recapture studies. Sex-biased dispersal was investigated by
comparing sex-specific heterozygote deficits (Fis - values) and IBD patterns. Spatial
analyses were performed in a geographic information system (GIS) based on an
elevation model. Pairwise genetic distances between individuals were compared with
a sequence o f ten spatial distance matrices, which accounted increasingly for the
topographic structures of the study area. Significant IBD and male-biased dispersal
was observed. The effective dispersal distance (3,794m; 95%CI: 2,764-11,134m)
inferred from genetic data was considerably smaller compared to the demographic
estimate (8,925m) from the literature. The sum of fit (r ) for the regressions between
individual spatial and genetic distances increased when topographic structures were
taken into account. Differences between sex-biased dispersal and the estimated
genetic and demographic dispersal distance are discussed in respect to the relationship
between topography and fine-scale spatial genetic structure.
24

CHAPTER 3
Introduction
Dispersal and estimating dispersal in the fie ld
Studying dispersal is central to our understanding of the ecology and evolution of
species on an individual, population and species level (Clobert et a l 2001). Natal
dispersal, or the permanent movement from an animal’s birthplace to that of its first
offspring (Greenwood 1980) counteracts local adaptation and genetic drift (e.g.
Wright 1977). From an ecological viewpoint, dispersal influences the distribution
pattern, the dynamics and persistence of populations and therefore affects the
abundance of a species and its distribution (Dieckmann et al. 1999). In conservation,
dispersal can be vital in maintaining gene flow between small populations by reducing
the effects of inbreeding (e.g. Vila et al. 2003) and by allowing the natural re
colonization o f areas in which populations have become extinct (Hanski 1998, Sumner
et al. 2001). Moreover, dispersal and its restoration by management is vital for
conservation planning for fragmented populations.
Gaining direct estimates o f dispersal distances from natural populations by capture-
mark-recapture is difficult (Koenig et al. 1996). By applying this method, direct
estimates o f dispersal can underestimate large-scale dispersal events systematically
because the fate o f dispersing animals often remains unknown (Koenig et al. 1996,
Spong & Creel 2001). Although radio-tracking techniques might represent a good
alternative approach for studying dispersal pattern (Koenig et al. 1996), the logistic
and personal effort involved is extensive (Funk 1994, Zimmermann et al. unpublished
data). Moreover, both methods of assessing direct dispersal distances fail to address
the issue o f whether successful dispersers reproduce after successful colonization
(Koenig et al. 1996).
Population genetic methods to infer dispersal
Population genetics has long been recognized to contribute to our understanding of
dispersal. Based on Wright’s F-statistics and neutral genetic markers, indirect
estimates for dispersal - by the number of migrants (Nm) - can be inferred (e.g. Neigel
1997). However, these estimations often estimate historical rather than current degrees
o f gene flow (Koenig et al. 1996, Thompson & Goodman 1996, Rousset 2001; but see
Neigel 2002).
25

CHAPTER 3
An alternative approach is to use ‘assignment-tests’, which estimate recent migration
patterns between known populations by assigning individual genotypes to populations
in which their greatest frequency is expected (e.g. Paetkau et al. 1995, Waser &
Strobeck 1998). Because this approach requires a significant level of genetic
differentiation among populations (Comuet et al. 1999) it is less suitable when the
genetic structure among populations is expected to be small. Assignment-tests rely on
a priori defined discrete population patterns, which might not reflect population
subdivision in reality (Manel et al. 2004). Further, these tests are less informative
when potential source populations are not sampled. However, such ‘cryptic
population’ can be theoretically detected by using admixture models (e.g.
STRUCTURE, Prichard et al. 2000; Falush et al. 2003) and a sufficiently large
number o f immigrant individuals from the non-sampled population. Finally, it is
important to emphasize that all the genetic methods presented above only describe
inter-population dispersal patterns and therefore do not infer dispersal patterns within
populations.
Population genetics can further help to reveal sex-biased dispersal. While most studies
concentrated on addressing sex-biased dispersal relied on sex-specific genetic markers
such as mitochondrial DNA (reviewed in Prugnolle & Meeus 2002) and more recently
Y-linked markers (Petit et al. 2002), sex-biased dispersal can also be detected using
codominant genetic markers (Goudet et al. 2002, Prugnolle & Meeus 2002). Provided
that adults are sampled and sampling therefore includes potentially dispersed
individuals, theory predicts that the dispersing sex is genetically less structured
compared to the more phylopatric sex and should present further a larger heterozygote
deficit (Goudet et al. 2002).
The non-random spatial distribution of genotypes at a large spatial scale is the result
o f different processes such as selection, mutation and historic events (e.g. post glacial
re-colonization; Vekemans & Hardy 2004). Yet at a finer spatial scale, the observed
distribution of genotypes is most likely caused by the accumulation of local genetic
drift under restricted dispersal (e.g. Sumner et al. 2001, Vekemans & Hardy 2004).
Restricted dispersal will lead to genetic differentiation with increasing spatial distance
as predicted by the theory o f isolation-by-distance (IBD\ e.g. Wright 1943, Rousset
26

CHAPTER 3
1997). Consequently, estimating dispersal pattern can be expected to be more accurate
on a local population scale (Leblois et al. 2003).
Describing the slope o f the regression line between genetic and spatial distance
amongst individuals can disclose the mean parent-offspring dispersal distances in a
continuous population when applied on a small geographical scale alongside data on
effective population density (Rousset 2000, Vekemans & Hardy 2004). In this context,
the inverse of the slope can be expressed as Wright’s (1946) neighbourhood size (NS).
Nonetheless, spatial data can be expected to explain only a small proportion of the
total genetic sampling variance (r2 % 1%) due to the high sampling variance expected
when estimating pairwise relatedness or genetic distances on an individual level
(Lynch & Ritland 1999, Wang 2002, Coulon et al. 2004). Moreover, low explanatory
power is a general observation in migration-drift models (Rousset 2000). Whereas
most research using an individual based IBD approach was done on plant species
(reviewed in Vekemans & Hardy 2004), studies in animals remain rare with only a
few focused on vertebrates to date (Waser & Elliott 1991, Rousset 2000, Leblois et al.
2000, Peakall et al. 2003, Sumner et al. 2001, Caizergues et al. 2003, Coulon et al.
2004).
Red fo x dispersal and social structure
By applying an individual based IBD approach; this study combined genetic data
based on 17 polymorphic microsatellites with accurate spatial data from a continuous
red fox population in a mountainous habitat in Switzerland. To my knowledge, this is
one o f the first studies investigating dispersal patterns inferred from fine-scale spatial
genetic structure in a widely dispersing mammal.
The red fox is a habitat generalist (Macdonald 1980), with an area-wide distribution in
Switzerland up to 2500m altitude (Wandeler 1995). For this reason, the red fox
represents a good example o f a species with a continuous population distribution,
necessary for fine-scale IBD analyses. To date, the red fox is the main vector of rabies
in Western Europe (Steck & Wandeler 1980). Since fox dispersal is considered to be
important for the rate o f rabies spread {e.g. Wandeler et al. 1974) dispersal distances
and directions in foxes were the subject o f several field {reviewed in Chautan et al.
2000) and simulation studies {e.g. Artois et al. 1997). Although in general dispersal
27

CHAPTER 3
distances have been observed to be longer for males (reviewed in Trewhella et al.
1988), other studies reported differently (Englund 1980; Funk et al. 1994). Beeline
recovery distances for tagged foxes longer than 300km have been recorded in North
America (Rosatte 1992; Allen & Sargeant 1993) while in rural Europe maximum
dispersal distances have been reported to be below 100km (e.g. Zimen 1984,
Trewhella et al. 1988, Funk 1994). A negative correlation between population density
and dispersal distance has been observed (reviewed in Trewhella et al. 1988, but see
Funk 1994) across different habitat types. In addition, several studies have indicated
that dispersal directions in red foxes were altered by environmental factors (e.g.
topography, habitat type; Zimen 1984) and human built barriers (motorways; Allen &
Sargeant 1993, Funk 1994; but see Trewhella & Harris 1990).
Social organization in red fox is variable. They defend territories and live in pairs or in
family groups, which can be often explained by the abundance o f food and the pattern
o f fox mortality (Voigt & Macdonald 1984). Fox populations with high densities, such
as in urban habitat, are characterized by reduction of reproducing females and the
formation of family groups larger than the breeding pair (review in Cavallini 1996)
Larger groups have been described to include one male and several related females
(Voigt & Macdonald 1984). At high density, only a minority of females will rear cubs
while barren and socially sub-ordinate females tend to act as helpers (Macdonald
1979, Kolb 1986). In contrast, breading yearling females are common at lower density
(Vos 1994). The red fox social organization at high density is reflected by small and
vastly overlapping home ranges (Baker et al. 1998, Baker et al. 2000) and anegative
correlation between home range size and population density has been described
(White et al. 1995).
Objectives
The primary objective o f this study was to test the occurrence of IBD by analysing a
continuous population of red foxes at a local scale. IBD could be expected by
assuming a predominance o f small average dispersal distances in relation to the total
spatial expansion of the studied population.
The second objective was to investigate different dispersal patterns o f males and
females. Based on the observation that dispersal in red foxes is predominantly sex-
28

CHAPTER 3
biased, differences in sex-specific IBD pattern can be hypothesized. Furthermore,
males, who are reported to disperse more, could display a higher heterozygote deficit
compared to females.
The third objective was to compare an indirect (genetic) estimate of an average
dispersal distance in red foxes against a direct (demographic) estimate from published
recovery distances o f ten mark-recapture studies. Given the difficulty to estimate for
long-distance dispersal in field studies, one may assume that indirect estimated
dispersal distances inferred in capture-mark-recapture studies should be longer than
distances estimated from demographic data.
The final objective was to investigate the effect of topographic structures on the
dispersal in red foxes. As reported previously (Zimen 1984, Allen & Sargeant 1993,
Funk 1994) dispersal in foxes should follow distinct topographic structures such as
river-valleys and mountain ranges. As a result, spatial matrices of individual pairwise
distances, which account for topographic structures, can be expected to better explain
more o f the total genetic sampling variance than pairwise Euclidian distances only.
29

CHAPTER 3
Methods
Study site and red fo x samples
The study area (4189km2) was located in the eastern part of the Swiss Alps and the
Canton Grisons and is surrounded by the watershed of the river Rhine (Figure 1).
Local hunters and hunting authorities provided over 380 fox tissue samples between
mid November until February of 2001-02 and 2002-03. Because the onset of dispersal
in rural areas occurs primarily between September and November in red foxes (e.g.
Zimen 1984), a high proportion of the sampled foxes could be considered as dispersed
or resident individuals. Attention was given to obtaining accurate individual
geographic data by evaluating local field names with individual XY-coordinates. Each
sampling location was represented by one tissue sample only. Thus, where more than
one fox sample was provided from the same sampling location, only one sample was
randomly chosen. Finally a sub-sample was selected for a consistent distribution of
sampling across the study and to fulfil the required sample size (n > 100; Leblois et al.
2003) for an informative IBD analyses based on individual genotypes.
Spatial distances analyses between foxes5
Pairwise distances between individual locations were computed in a Geographic
Information System (GIS; Arc View®, ESRI) using a cost-ffiction-analysis based on an
elevation model (250x250m grid cell resolution; MONA, GEOSYS). In a cost-
friction-analyses a distance / proximity surface (cost-surface) is generated based on a
digital map (e.g. landscape model, vegetation model, altitude model, or a combination
o f them) across the area o f interest. Based on the digital model used, a value of
friction is assigned to each grid cell (e.g. the effort of a fox to cross a specific grid cell
at a given altitude). All possible paths between two given points are computed. Finally
the path with the least sum o f friction (also referred to as a least-cost distance or
ecological distance) is chosen. However, because red fox specific values of friction for
a given altitude were unknown, pairwise distances between individual locations were
thus calculated as follows:
A sequence of ten different altitude thresholds (1200m, 1400m, 1600m, 1800m,
2000m, 2200m, 2400m, 2600m, 2800m and 3000m) was arbitrarily defined. For each
5 GIS analyses were computed by Fridolin Zimmermann, Bern, CH and PW.
30

CHAPTER 3
given threshold a cost-friction surface was computed across the whole study area.
Grid cells were coded as one for cells below the given altitude threshold (potential
area) and no data (impenetrable) for all other cells, respectively. Pairwise distances
(least-cost distance) between all individual spatial locations were thus calculated by
taking into account only cells below the threshold (see Figure 2 for a hypothetical
example). In addition, Euclidian pairwise distances were computed across a cost-
friction surface with coded cells as one only. Distances calculated by this method do
not represent true Euclidian distances (for details see ESRI 1996a-c). However, the
method allows them to be directly compared with the pairwise distance calculations
for the ten different altitude thresholds.
o Female• Male10 kilometer*
Figure 1 Location o f study area in the Swiss Alps (Canton Grisons). Circles indicate individual red fox samples. Grey-scale refers gradually to the elevation (low altitude = white; high altitude = dark-grey).
All pairwise distances for each altitude threshold and all Euclidian distances were
combined within a matrix using Rey’s (2002) cost-distance matrix extension.
Analyses were notably eased by the hierarchical topography (watershed) of the study
area, which prevented a situation in which individual locations at a given altitude were
enclosed by a sequence of grid cells with a higher altitude.
31

CHAPTER 3
Figure 2 Principal of the calculation of a spatial distance (black lines) between the hypothetical locations of two individuals (X and Y; filled cell). White, grey and dark-grey represents low, medium and high altitude, respectively, a.) Euclidian distance b.) Distance calculated for a high altitude threshold c.) Distance calculated for a medium altitude threshold, d.) Hypothetical example of sample X collected at the same altitude (medium) as the altitude threshold. Sample X was at first shifted to the nearest grid cell (fasciated) and an altitude below the threshold. The distance between the new location and sample Y was calculated (arrow) and subsequently added to the distance between the new and the original location. Note that the black lines do not exactly reflect the path of how the spatial distances were calculated.
A number of individuals locations were at a higher altitude than the a priori set
altitude thresholds for some of the spatial matrices. Therefore, these locations were
shifted to the nearest grid cell with an elevation below the threshold in question, prior
to the cost-friction analyses. Subsequently, the Euclidian distances between the
corrected and the original locations were calculated and summarized in an additional
correction matrix. Pairwise distances were then calculated by including the corrected
locations as described above. Finally, the correction matrix was added to the
corresponding distance matrix (Figure 2).
32

CHAPTER 3
Genotyping
DNA was extracted from frozen muscle tissue by using a Wizard® SV96 Genomic
DNA extraction kit (PROMEGA). Extracted DNA was eluted in 400|iL H2O. All
samples were sexed by the presence/absence o f a PCR product (132bps) at a Y-
chromosome marker (SRY - gene; Breen et al. 2001). This enabled sexing of samples
whose sex has not been recorded. To account for PCR failure, SRY PCR amplification
for possible female samples (no visible PCR product) were repeated. PCR was
performed in a lOpL reaction volume containing 2pL o f DNA extract, 0.5mM dNTPs,
0.2pM of each primer, 0.3U taq (Invitrogene), and 1.5mM MgCb- PCR was carried
out in a GeneAmp® PCR System 9700 (ABI) using the following cycling parameters:
4min of initial denaturation at 95°C, followed by 30 cycles of 30s at 94°C, 30s at
61 °C annealing temperature and 45s extension at 72°C, finished by a final extension
of 7min at 72°C. PCR products were separated by electrophoresis and visually
analysed on an agarose gel.
Ten canine microsatellite loci (AHT-130, Holmes et al. 1995, CXX-156, CXX-279,
CXX-466, CXX-606, CXX-608 Ostrander et al. 1993, 1995; c2010, c2017, c2054 and
c2088; Francisco et al. 1996) and seven re-designed red fox specific canine
microsatellite loci (V142, V374, V402, V468, V502, V602, V622; Chapter 2) were
used in this study. Between three and five loci were amplified within the same PCR
reaction using Qiagen’s PCR multiplex kit, which co-amplifies numerous primer pairs
within the same PCR reaction despite different locus specific PCR conditions.
Amplification was carried out in a total volume o f 6/xL containing 3/xL of 2x
multiplex master-mix, 0.07 - 0.3pM of each primer and 2pL o f template DNA. PCR
was performed using a GeneAmp® PCR System 9700 (ABI) and applying the
following cycling parameters: 15min of initial denaturation at 95°C, followed by 30
cycles o f 30s at 94°C, 120s at 58 - 60°C and 60s extension at 72°C, with a final
extension o f 30min at 60°C. For all PCR amplifications, a blank sample and three
positive controls of known genotypes were used. PCR products were
electrophoretically separated on an ABI Prism® 377 DNA sequencer (ABI). Allele
sizes were scored against the size standard GS350 Tamra™ (ABI) using
GENESCAN™ and GENOTYPER™ software.
33

CHAPTER 3
General population genetic analyses and testing fo r sex biased dispersal
To evaluate whether all examined loci could be considered as independent replicates
of population structure, genotypic linkage disequilibrium between all pairs of loci
(Gamier-Gere & Dillmann 1992) were tested in GENEPOP v3.1 (Raymond &
Rousset 1995b). Single locus genetic diversity (H e \ Nei 1987) and probability-tests for
deviation from Hardy-Weinberg equilibrium across all samples were computed using
the same software package. Critical significance levels were adjusted for multiple tests
using Bonferroni corrections (Rice 1989).
To examine current sex-biased dispersal, single locus Fjs - values (Weir & Cockerham
1984) were computed across all males and females, respectively, using GENEPOP
(Raymond & Rousset 1995b). Pairwise F/s - values for males and females were
subsequently compared for statistical significance with a Wilcoxon sign-rank test. The
dispersing sex is expected to demonstrate a higher mean F/s compared to the
philopatric sex, due to mixture of resident and current immigrant individuals within
the tested genepool (Goudet et al. 2002). The allele frequency distribution between
males and females was compared using a genic differentiation test (Raymond &
Rousset 1995a) implemented in GENEPOP.
Analyses o f spatial genetic structure
IBD was described using two different individual pairwise genetic estimators (aT,
Rousset 2000 and Rw, Wang 2002; nomenclature based on Van de Casteele et al.
2001) and pairwise logarithmic transformed spatial distances. Rousset’s (2000)
estimator ar is a genetic distance measure that is analogous to F st/O -^st) but is
performed between pairs o f individuals instead o f populations. Moreover, the slope of
the regression line between genetic and spatial distances was used to infer effective
dispersal distances (Rousset 2000). Unlike other individual genetic estimators, aT does
not depend on a ‘reference’ population for allele frequency distribution. However, it
tends to suffer higher sampling variance and thus has less statistical power (Vekemans
& Hardy 2004). Wang’s (2002) /?w estimator performed better in a simulation study
(Wang 2002) compared to other relatedness estimators (i.e. Rl&r, Lynch & Ritland
1999; Rq&g, Queller & Goodnight 1989). This was in particular true for uneven allele
frequency distributions, which can be expected when using highly polymorphic
34

CHAPTER 3
markers such as microsatellites. Multilocus estimators were calculated and compared
with the logarithmic transformed pairwise Euclidian distances.
The spatial genetic structure was tested for both estimators against the logarithmic (In)
transformed Euclidian pairwise spatial distances by assessing the significance o f the
regression slope using a Mantel test (10,000 permutations o f individual spatial
location). For computing Rw measures, allele frequency distributions were calculated
across all individuals used in this study. Spatial genetic analyses were performed
using the software SPAGEDI (Hardy & Vekemans 2002).
Mean gene dispersal distance a (axial parent-offspring distance; Rousset 2000) per
generation72 was estimated based on the regression slope between aT against the In
transformed spatial distance. The inverse of the slope (blog) equals in a two-
dimensional space per generation (Rousset 2000) and can be further referred as
neighbourhood (Wright 1946) or neighbourhoodsize (NS, e.g. Sumner et a l 2001).
NS can be interpreted as the number of individuals defining the strength of local
genetic drift (Wright 1946). The parameter D is the effective population density,
which is the effective population size (Ne) divided by the area (km2) of the study site
(Rousset 1997).
Ne was calculated for populations with overlapping generations based on demographic
data (Johnson 1977). Assuming a constant population size, sex ratio and age
distribution, Nc can be estimated in terms of two matrices specifying the passage of
genes between different age groups (and sexes) and the number o f individuals in each
age group (equation 10 in Johnson 1977). An estimate o f the effective population
density D was calculated based on the average number of killed (hunting and roadkill)
red foxes for 2001 and 2002 in the study area. However, because no detailed
demographic data were available for this population the Ne estimations were based on
the following demographic data sets: a global estimate o f juvenile - adult ratio in
Switzerland (Rabies data set; n = 4122) and a life table o f 160 adult foxes from the
Canton Aargau from 1995 to 2000 (Appendix; Chapter 4). Because a significant
proportion of adult foxes in their second year may not reproduce (Harris & Smith
1987, Vos 1994), a second estimation of the effective density (Dmod) was computed by
applying a 50% reduced reproduction for this age class.
35

CHAPTER 3
The effective dispersal distance crwas calculated for the two effective densities D and
Anod across all pairwise spatial distances (global regression). Approximate 95%
confidence intervals were computed as ± 2SE, where SE is the standard error of blog
estimated by jackknifing over loci (Fenster et al. 2003). The linear relationship
between genetic and spatial distance can be expected to hold best only within the
distance range o - 20cr(for details see Rousset 1997, 2000). Therefore, an iterative
approach (Heuertz et al. 2003) was applied to estimate cr for both densities D and
Anod- At first, a was extracted from the global regressions covering all pairwise
distance comparisons for each of the two densities and subsequently new estimates of
Do? were calculated based on a restricted regression considering distances only
between o and 20 o . These procedures were repeated until 6 estimations stabilized
and converted (Vekemans & Hardy 2004). Approximate confidence intervals of 95%
for the cr- values were computed.
The two indirect genetic cr estimations for both densities D and Dmod were compared
with a demographic estimation of cr. The parameter cr was estimated using a linear
regression between the mean inverse beeline recovery distances (km) for tagged males
and females against fox density (family groups * k m ') across ten red fox populations
of different habitat types (Trewhella et al. 1988). The density of family groups (FD)
across the whole study area was calculated as follows: it was assumed that the
population density was constant and that the number of dead foxes reported (based on
the annual hunting and road-kill statistic from the Canton Grisons) within the study
area equalled the number of the annual generation of cubs (Wandeler et a l 1974).
Then,
_2 number of dead foxesFD = number of fox family groups km = --------------------- «---------------------------
study area km’ * mean litter size
where mean litter size was assumed to be 4.7 (Wandeler et al. 1974; Harris &
Trewhella 1988). Subsequently, the mean recovery distance for males and females
was derived using equations 5 and 7 from Trewhella et al.'s (1988) publication. To
allow for direct comparison of genetic and demographic cr estimation, the mean
recovery distance was averaged across males and females. Finally, to account for the
36

CHAPTER 3
non-axial estimation of individual movements of the recovery distance the
demographic cr estimation was divided by two (for details see Sumner et al. 2001).
All ten spatial matrices computed in GIS were In transformed and regressed against
two pairwise genetic (ar and Rw) matrices in SPAGEDI (Hardy & Vekemans 2002).
For each individual regression the measure of fit (r - value) was recorded.
To compare sex specific dispersal patterns, fine-scale spatial genetic structure was
assessed independently for males and females. Average (± SE jackknifed over loci)
relatedness (R^; Wang 2002) for seven a priori defined and by the natural logarithm
(In) transformed distance categories (<8,106m, 8,107m - 12,182m, 12,183m -
18,174m, 18,175m - 27,113m, 27,114m - 40,447m, 40,448m - 60,340m and
>60,34 lm ) were computed in SPAGEDI (Hardy & Vekemans 2002). Spatial data
were based on the altitude threshold matrix with the best measure of fit (highest r2 -
value) of genetic against spatial distances (see paragraph above). Allele frequency
distributions were calculated across all individuals used in this study.
Results
Sampling and spatial GIS analyses
A total o f 145 individual samples from red foxes (73 males and 72 females) were used
in this study. Mean altitude for all individual locations was 1169m (min 505m; max
1944m, for spatial distribution see Figure 1). The potential surface (the surface below
a given altitude threshold) for computing pairwise distances decreased markedly for
each lower altitude threshold to less than 15% for the 1200m threshold (Table 1). In
contrast, the average distance and standard deviation across all individuals increased
for each lower threshold from 34,951m ± 6,953m for the 3000m - to 45,236m ±
10,046m for the 1200m altitude threshold (Table 1). The total number o f corrected
individual locations increased from 4 (2.8%) to 76 (52.4%; Table 1) individuals for
the four lowest altitude thresholds.
37

CHAPTER 3
Table 1 Spatial distances between red fox samples are summarized in an Euclidian (E) and a sequence o f ten altitude matrices. Shown are the potential surface, the mean ± SD o f pairwise individual spatial distances and the absolute and relative number o f corrected individual locations and pairwise distances.
Altitudethresholdmatrix
Potential area (Surface below a given threshold)
Area [km2] %
Pairwise spatial distance
Mean [m] SD [m]
Corrected individual locations
# %E 4189 100.0 34950 69353000 4166 99.9 34951 69352800 4068 97.1 34956 69372600 3787 90.4 35080 70112400 3296 78.7 36117 75132200 2741 65.4 37407 78832000 2198 52.5 38431 82221800 1698 40.5 39600 8528 4 2.81600 1262 30.1 41819 9536 17 11.71400 884 21.1 44042 9861 41 28.31200 594 14.2 45236 10046 76 52.4
Microsatellite genotyping and sex biased dispersal
Total genotyping success across all samples and the 17 loci was 99.9%. No significant
linkage disequilibrium was found among all pairs of loci after adjusting for multiple
comparisons (data not shown; k= 136; all tests p > 0.05/k with Bonferroni correction of
a = 0.05). Single locus genetic diversity (H e) across all samples was high ranging
from 0.599 (V502) to 0.914 (V602) with a multilocus mean ± SD o f 0.808 ± 0.077.
The total number o f alleles per locus ranged from four (c2010) to 20 (c2054; mean ±
SD = 10.24 ± 3.78; Table 2). Deviation from Hardy-Weinberg was significant for loci
V622 (p = 0.021) and c2017 (p = 0.030), whilst no significant deviation was observed
after correcting for multiple testing. In contrast, the overall deviation across all loci
was significant (X2 = 49.4; d f= 3 4 tp < 0.05; Fisher’s method, Table 2).
Observed Fis - values across loci were significantly higher in males (mean ± SD =
0.027 ± 0.056) than in females (mean ± SD = -0.008 ± 0.055; n = 17, z = 2.3432,
p<0.02; Wilcoxon sign-rank test; Table 2). A total of twelve (6.9%) and five (2.9%)
sex-specific alleles were recorded in males and females respectively. Global test for
allele frequency distribution (Genic test) across all loci revealed no difference in allele
frequency distribution between sexes (X2 = 32.9; df= 34; p = 0.523; Fisher’s method).
38
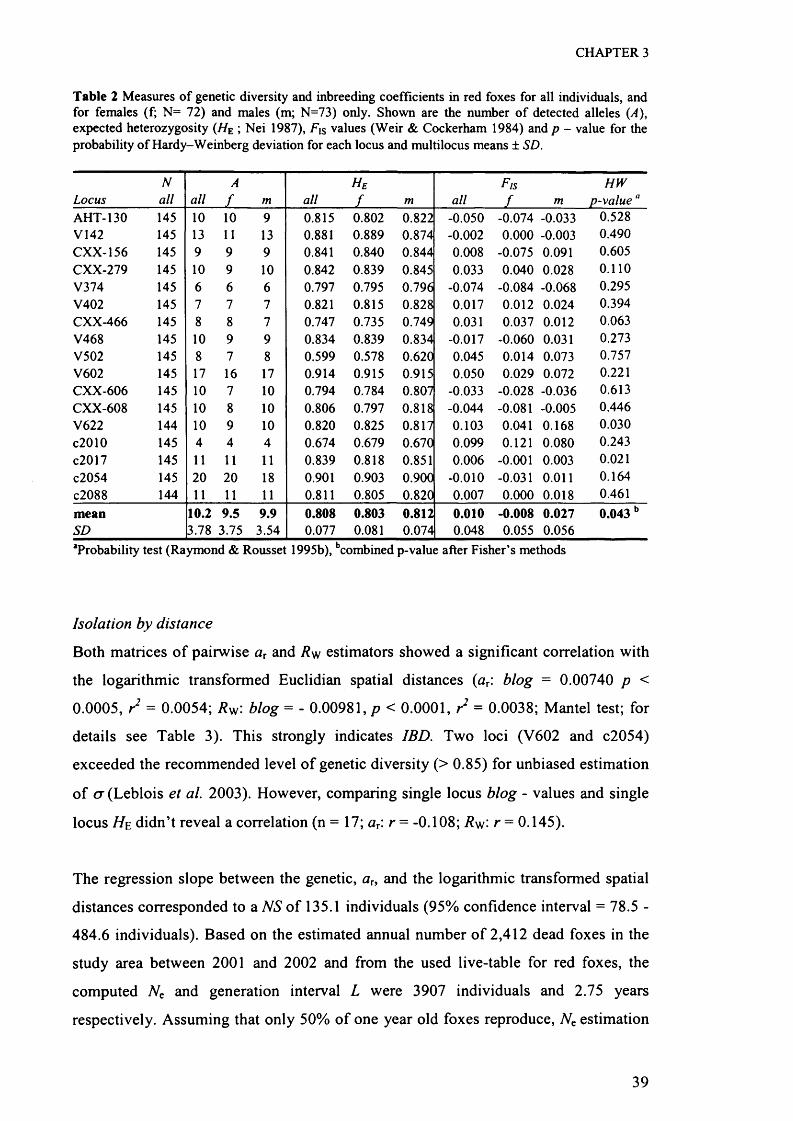
CHAPTER 3
Table 2 Measures o f genetic diversity and inbreeding coefficients in red foxes for all individuals, and for females (f; N= 72) and males (m; N=73) only. Shown are the number o f detected alleles (A), expected heterozygosity (HE ; Nei 1987), F1S values (Weir & Cockerham 1984) and p - value for the probability o f Hardy-Weinberg deviation for each locus and multilocus means ± SD.
LocusNall all
Af m all
He
f m allF/sf m
HW p-valuea
AHT-130 145 10 10 9 0.815 0.802 0.822 -0.050 -0.074 -0.033 0.528V142 145 13 11 13 0.881 0.889 0.874 -0.002 0.000 -0.003 0.490CXX-156 145 9 9 9 0.841 0.840 0.844 0.008 -0.075 0.091 0.605CXX-279 145 10 9 10 0.842 0.839 0.845 0.033 0.040 0.028 0.110V374 145 6 6 6 0.797 0.795 0.796 -0.074 -0.084 -0.068 0.295V402 145 7 7 7 0.821 0.815 0.828 0.017 0.012 0.024 0.394CXX-466 145 8 8 7 0.747 0.735 0.749 0.031 0.037 0.012 0.063V468 145 10 9 9 0.834 0.839 0.834 -0.017 -0.060 0.031 0.273V502 145 8 7 8 0.599 0.578 0.620 0.045 0.014 0.073 0.757V602 145 17 16 17 0.914 0.915 0.915 0.050 0.029 0.072 0.221CXX-606 145 10 7 10 0.794 0.784 0.807 -0.033 -0.028 -0.036 0.613CXX-608 145 10 8 10 0.806 0.797 0.818 -0.044 -0.081 -0.005 0.446V622 144 10 9 10 0.820 0.825 0.817 0.103 0.041 0.168 0.030c2010 145 4 4 4 0.674 0.679 0.670 0.099 0.121 0.080 0.243c2017 145 11 11 11 0.839 0.818 0.851 0.006 -0.001 0.003 0.021c2054 145 20 20 18 0.901 0.903 0.900 -0.010 -0.031 0.011 0.164c2088 144 11 11 11 0.811 0.805 0.820 0.007 0.000 0.018 0.461mean 10.2 9.5 9.9 0.808 0.803 0.812 0.010 -0.008 0.027 0.043 bSD 3.78 3.75 3.54 0.077 0.081 0.074 0.048 0.055 0.056“Probability test (Raymond & Rousset 1995b), bcombined p-value after Fisher’s methods
Isolation by distance
Both matrices of pairwise aT and Fw estimators showed a significant correlation with
the logarithmic transformed Euclidian spatial distances (aT: blog = 0.00740 p <
0.0005, r2 = 0.0054; R ^\ blog = - 0.00981, p < 0.0001, r2 = 0.0038; Mantel test; for
details see Table 3). This strongly indicates IBD. Two loci (V602 and c2054)
exceeded the recommended level of genetic diversity (> 0.85) for unbiased estimation
of cr (Leblois et al. 2003). However, comparing single locus blog - values and single
locus He didn’t reveal a correlation (n = 17; ar: r - -0.108; R^\ r = 0.145).
The regression slope between the genetic, au and the logarithmic transformed spatial
distances corresponded to a NS of 135.1 individuals (95% confidence interval = 78.5 -
484.6 individuals). Based on the estimated annual number of 2,412 dead foxes in the
study area between 2001 and 2002 and from the used live-table for red foxes, the
computed Ne and generation interval L were 3907 individuals and 2.75 years
respectively. Assuming that only 50% of one year old foxes reproduce, Nt estimation
39

CHAPTER 3
decreased to 3,646 individuals (L = 3.24 years) resulting in a Ne/N ratio (TV = adult
population size per generation) of 0.44 and 0.35, respectively (see Appendix A l for
details). Effective population densities based on D and Dmod were 0.933 and 0.870
respectively. These corresponded to mean axial dispersal distances a across all
pairwise spatial distances (global regressions) of 3,395m (2,588 - 6,429m, 95%
confidence interval) for D and 3,516m (2,680 - 6,658m) for Dmod, respectively (Table
5).
Table 3 Results o f the global regressions between individual pairwise genetic distances (ar) and Euclidian spatial distances, and between relatedness (/?w) and Euclidian spatial distances in red foxes. For each locus, the microsatellite repeat structure (2 for dinucleotides, 4 for tetra-nucleotides) and the blog - values (slope) for ar and /?w, respectively, are shown. The summary statistics show multilocus means and SE (Jackknifed over loci).
Microsatellite Microsatellite blog - valuesrepeat pattern ar Rfy
AHT-130 2 0.0067 -0.0113V142 2 0.0030 -0.0128CXX-156 2 0.0107 -0.0060CXX-279 2 0.0002 0.0029V374 2 -0.0058 0.0104V402 2 0.0285 -0.0296CXX-466 2 0.0195 -0.0279V468 2 0.0123 -0.0309V502 2 0.0212 -0.0239V602 2 0.0195 -0.0145CXX-606 2 0.0152 -0.0215CXX-608 2 0.0046 -0.0032V622 2 0.0164 0.0031c2010 4 -0.0094 0.0049c2017 4 -0.0045 0.0039c2054 4 -0.0045 -0.0016c2088 4 -0.0043 0.0002mean 0.0074 -0.0098SE 0.0027 0.0031
NS calculated from the inverse slope of the restricted regressions for D (162.3) and
Anod (157.4) were larger compared to the NS derived from the global regression (NS =
135.1; Table 4). The restricted regressions result in estimated mean axial dispersal
distances <7 for D and Anod of 3,720m (2691 - 12,534 m, 95% confidence interval)
40

CHAPTER 3
and 3,794m (2764 - 11134m) respectively. Both slopes deviated significantly from
zero (D : p < 0.005, r2 = 0.0027; Dmod- P < 0.005, f 2 = 0.0028; Mantel tests).
Estimated fox density FD (total number of fox families*km‘2) was 0.123, resulting in
a demographic a - value of 8,925m. Compared with the mean values of the genetic
estimation for the effective dispersal distance, the demographic cr estimation was
considerable larger, but was within the 95% confidence interval of restricted
regression (Table 4).
Table 4 Indirect estimation o f the average dispersal distance in red foxes for the effective population densities D and Dmod. Shown are the genetic estimates for the global and restricted regressions for ‘neighbourhood size’ (NS), effective dispersal distance cr per generation7', 95% confidence interval for a, absolute and relative number of individual pairwise comparisons (see text for details).
Effective density NS <7 Genetic [Individuals * [Individuals] [m/generation1
generation/km2]
95% Cl 2] [m/generationl/2]
N[dyads]
%[dyads]
Global regressionD =0.933 135.1 3395 2588-6429 10440 100Dmod =0.870 135.1 3516 2680-6658 10440 100Restricted regressionD =0.933 162.3 3720 2691-12534 9973 95.5Dmod =0.870 157.4 3794 2764- 11134 9999 95.8
Table 5 Estimation o f cr from demographic data based on Trewhella’s (1988) function between red fox density and the recovery distances o f tagged individuals. Shown are the demographic estimates o f the recovery distance for males, females and across both sexes and the effective dispersal distance a.
Fox density [Family groups/km']
Expected recovery distance [m]
Males Female Average
*7 Demographic
[m]
FD =0.123 24,828 10,873 17,850 8,925
Measures of fit (r2) for the regressions of the two genetic estimators ar and Rw against
the Euclidian and the ten altitude matrices are shown in Figure 3. For both genetic
estimators the highest r2 - values were computed with the 1400m-altitude matrix (aT:
0.0082; Rw’. 0.0042). The 1400m-altitude matrix explained 53.2% and 9.6% more of
41

CHAPTER 3
the genetic variance compared with the Euclidian matrix for the aT and Rw estimators,
respectively (Figure 3). Overall, the variance explained by using the ax estimator was
higher compared with the Rw relatedness estimator.
C\l
OCDl.3COCD<D
0.009
0.008
0.007
0.006
0.005
0.004
0.003
0.002
0.001
a - ar (Rousset 2000)
o - Rw (Wang 2002)
a o-
- < V --------------- o ----------------- 0 o
1200 1400 1600 1800 2000 2200 2400 2600 2800 3000
Altitude threshold [m]
Figure 3 Results o f the isolation-by-distance analyses between pairwise individual genetic and In transformed spatial distances in a continuous red fox population. Shown are measures o f fit (r2 - values) for global regressions using two genetic estimates (ar Rousset 2000; /?w Wang 2002) against a spatial Euclidian matrix (E) and a sequence o f ten different spatial matrices. Each of theses spatial matrices accounted gradually for the topographic structure o f the landscape by restricting pairwise spatial distance calculations to pre-defined altitude thresholds (see text for details). Filled symbols refer to the highest observed r2 - value.
Sex specific IBD patterns for seven distance categories are shown in Figure 4. A
general pattern of IBD for males and females was observed. Females were more
closely related to each other than males were across all distance categories, with the
exception of the second distance category (8,107 - 12,182m), where the highest
average relatedness across males was found. Across all samples and pairwise spatial
distances, relatedness amongst females was greater than relatedness amongst males (z
= -2.864; nLoci= 17 ; p < 0.005; Wilcoxon signed-rank test).
42

CHAPTER 3
Discussion
Given the central importance of studying dispersal in order to understand the ecology
and evolution of a species, it is essential that reliable and precise information on
dispersal pattern is obtained. In this study we found evidence of male biased dispersal
and topographic effects on dispersal direction, and we obtained an estimate for
average dispersal distance in red foxes by applying population genetic methods in
combination with geographic and demographic data. This study is the first to reveal
sex-biased and directed dispersal pattern in red foxes using genetic methods,
demonstrating the potential usefulness of individual based IBD methods, especially
for widely dispersing species.
Isolation by distance
A strong IBD pattern was found between pairwise individual genetic and spatial
distances. This demonstrated a non-random distribution of genotypes, indicating that
red foxes in close proximity to each other are genetically more alike than individuals
separated over longer distances. As predicted, dispersal was restricted and thus could
not counteract local genetic drift. This result is in agreement with Trewhella et al. ’s
(1988) review on several red fox studies, where the recovery distance of tagged foxes
was generally short with only a few long distance movements. In contrast, beeline
recovery distances of over 300km in tagged red foxes (Rosatte 1992, Allen &
Sargeant 1993) were recorded, being more than twice as long as the total width of the
study area. This comparison illustrates that dispersal distances in red foxes are flexible
and differ between populations and at different population densities. The observed
IBD pattern also questions the assumption that the development of fine-scale spatial
genetic structure is unlikely to occur in widely dispersing taxa (Peakall et al. 2003).
Moreover, these results leave little doubt that IBD can be tested in a wide number of
different animal taxa, provided that sufficient genetic markers are used in combination
with a thorough sampling regime.
43

CHAPTER 3
Sex-biased dispersal
Based on the comparison between the observed sex-specific F/s-values, dispersal was
male biased, indicating an existing mixed male population of resident and immigrant
individuals (Goudet et al. 2002). In addition, the trend of the observed higher number
o f sex-specific private alleles detected in male foxes emphasized that males were the
sex that dispersed the most. The observed differences between the sex specific F\s -
values indicated that the recent dispersal rate was sufficient to be detected yet not
widespread enough to erase the signature of genetic differentiation between the study
and the adjacent populations.
Breeding groups are an important component of population structure, yet they are
ignored in most population genetic models (Sugg et al. 1996) as well as in the
methods (F-statistics, IBD) applied in this study. As social organization in red foxes is
complex (Cavallini 1996) the general deficit o f heterozygosity observed might reflect
some unaccounted social subdivision in the examined population. In fact, the observed
significant IBD pattern specifies per se non-random mating. However, unclear were
the potential effects of the social system on the differences observed in the sex-
specific Fis - values. It should be noted, that the difference in Fis - values revealed
current dispersal within an interval of one generation rather than a historic dispersal
pattern (Goudet et al. 2002). Nonetheless, by incorporating only one sample from the
same sampling site (Figure 1) sampling of closely related females occupying the same
territory could be eliminated.
Inferring a sex-biased dispersal pattern from sex-specific IBD pattern (Figure 4)
proved to be more difficult. Females, showed consistently higher relatedness amongst
themselves compared with males for the seven spatial distance categories. Yet, despite
the expected lower population structure in the more dispersive sex (Goudet et al.
2002) males showed a distinct IBD pattern (Figure 4). Sex-biased dispersal was
further revealed by the observed higher mean relatedness among male foxes in the
second distance category (8,107-12,182m) in relation to the first spatial distance
category (Figure 4), which could indicate that a significant proportion of male foxes
examined did in fact move away from their place of birth. Examining IBD patterns on
a sex-specific level reduced the number of pairwise comparisons (dyads) per distance
category to one quarter. For that reason, the number of seven arbitrary defined
44

CHAPTER 3
distance categories was a trade-off between the level of variance per category
expected and the spatial resolution of the analyses.
0.05 i
1650.03 - 188
308 3935982556
..103801
120 529■§ -0 01 - a)
" m - 0.02 -
1662628262 779 ■<> 681
£ -0.03 -
-0.04 -12 ,183- 18,174<8,106 2 7 ,114-40,447 >60,341
8 ,107- 12,182 18 ,175-27,113 4 0 ,448-60,340 mean
Ln spatial distance [m]
Figure 4 Sex-specific isolation-by-distance in a continuous red fox population. Shown are the average (± SE; jackknifing over loci) relatedness (/?w Wang 2002) for males and females for seven log transformed and a priori defined distance categories. Spatial data were based on the 1400m threshold altitude matrix (see text for details). Figures represent the total number of dyads for each distance category.
The interpretation of sex-biased dispersal by applying autosomal genetic markers
revealed to be pretty complex. Although both methods suggested male-biased
dispersal, alternative explanations could not be entirely excluded. Furthermore the
results of the IBD analyses disclosed the need for future simulation studies to
investigate the conditions under which sex-biased dispersal pattern can be expected
using individually based analyses. Finally, sex-biased dispersal could also be assessed
using an assignment test implemented in G e n e C la ss2 (Piry et al. 2004). Although
this study consists only of one population, G e n e C la s s 2 computes a probability -
value for each individual genotype belonging to the focal population. By comparing
the sex - ratio of individual genotypes with a low probability value (e.g. < 0.01) it
should be possible to identify differences in sex biased dispersal.
45

CHAPTER 3
The observed pattern of male biased dispersal confirmed previous results of studies
addressing sex-specific dispersal pattern in red foxes and reflects the general rule
according to which males represent the more dispersive sex among most carnivores
and mammals (Waser 1996). These data were consistent with results from mark-
recapture studies, where mean recovery distances for males foxes were significantly
compared with females (<reviewed in Trewhella et al. 1988, Allen & Sargeant 1993).
It is important to note that although the two methods applied highlighted male-biased
dispersal, they did not reveal any successful reproduction by individuals who moved
to a new location through natal dispersal. In fact, the observed mortality of dispersing
foxes was described to be significantly higher (reviewed in Chautan et al. 2000, Harris
and Trewhella 1988; Woollard & Harris 1990) compared with philopatric individuals.
Therefore, a significant proportion of dispersed males could be expected to have died
before reproducing successfully. Actual gene flow between the studied population and
its surroundings might therefore be lower than assumed by the apparent number of
detected current immigrants.
Dispersal distances
The average dispersal distance cr for the effective population densities D and the more
realistic density /)mod were smaller than the demographic cr values for the extrapolated
and corresponding fox density FD. Furthermore, simulations indicated that a twofold
difference in accuracy between the demographic and genetic estimates can be
expected (Rousset 2000). The deviation between the two estimates may be explained
by the lack of precision in one or both of the estimates. Therefore some potential
causes o f imprecision and / or biases are specified and discussed below:
The model assumptions for the genetic estimation of cr might not reflect reality
(Rousset 2000; Sumner et al. 2001). The effective fox density was likely to be uneven
across the study area because fox abundance is higher at lower altitude (Wandeler
1995), resulting in a lower level of precision of the genetic estimation. As determined
by the estimated a value, the study site somewhat exceeded the recommended area of
lOcr* lOcrfor an unbiased estimation of Dc? (Rousset 2000; Leblois et al. 2003). Due
to the expected mutation process and the high mutation rate of microsatellites,
sampling at large distances can lead to an underestimation of the regression slope and
46

CHAPTER 3
therefore to an overestimation of D<? (Leblois et a l 2003). This bias might to some
degree be reflected by the estimated average multilocus relatedness for males and
females examined for the largest pairwise distance category (> 60,340m), which did
not follow the general trend of IBD (Figure 4). In contrast, the restricted regression
analyses for the two given effective densities resulted in less steep slopes (smaller
blog - values) and thus longer estimates of dispersal distance.
The examined red fox population was subject to a two - to threefold density increase
following a severe rabies epidemic in the early 1980s along a long-term trend of a
growing caring-capacity for foxes in Switzerland (Breitenmoser unpublished; Chapter
4). It can therefore be speculated that the population might not yet be in a drifl-
migration equilibrium and so the D ci estimation reflects past rather than recent
demographic parameters (Leblois et al. 2004).
Trewhella et a l ’s (1988) general regression model for the average beeline recovery
distance in relation to the observed density was inferred from studies across different
habitat types. Thus, deviations between this model and the specific study area could
be expected, especially since the study site is in an Alpine habitat, which was not
included in Trewhella et al.'s (1988) analysis. In addition, the genetic estimation of cr
refers to a time period of one generation. In contrast, no temporal information was
available for the demographic cr estimation derived from the literature. Moreover,
although foxes are thought to disperse predominantly as juveniles, dispersal of adult
individuals was reported in other studies (Harris & Trewhella 1988; Zimen 1984).
Hence, given that the time period over which capture-mark-recapture studies were
conducted, the demographic estimation of a might be therefore underestimated.
The recorded difference between indirect and direct dispersal distance estimation
contradicted the prediction that, because of the difficulty to detect long dispersal
distances, the genetic estimation should be longer (but see Rousset 2001). In fact, the
estimated genetic distance was substantially smaller than the dispersal distance
inferred from demographic data. As previously discussed, it is important to distinguish
between an individual that moved to a new location and an individual which moved
and subsequently reproduced successfully. The genetic estimation of dispersal
distances addressed the actual genetic input that dispersed foxes had in the examined
47

CHAPTER 3
population. In contrast, the demographic estimate of beeline recovery distances
represents spatial movement of individuals only. Despite the methodological
constraints imposed by the limited demographic data available, it can be assumed that
actual gene flow appears more spatially restricted when inferred from demographic
data only. So far, only a few studies (Rousset et al. 2000, Sumner et a l 2001) have
compared direct and indirect dispersal distances in animals. Therefore a general
discussion of observed differences between genetic and demographic dispersal
distances is inappropriate. However, it is well accepted that the cost of dispersal is
higher than that for phylopatric behaviour (e.g. Rousset & Gandon 2002) and thus
mortality for dispersing individuals is high. As a result, effective dispersal distances
that are small in relation to demographic estimates can be expected across a wider
range of species.
Dispersal and topographic structures
Despite the calculated differences of the two pairwise genetic estimators aT and i?w,
the results across the ten spatial matrices were similar with both estimators, achieving
the highest r2- values with the /400m-altitude matrix. Although expected, the overall
genetic variance explained by the set of different spatial matrices was small (< 1%).
Consequently it would be useful to validate the observed r - values with simulated
values for both pairwise genetic estimators under ideal conditions. In fact, an
informative simulation study across the whole range of individual relatedness and
distance estimators (for a summary see Vekemans & Hardy 2004) would help to
choose the most appropriate genetic estimator for future individual based IBD
analyses. Furthermore, a primary objective was to keep the spatial analyses in GIS as
simple and thus transparent as possible. Therefore it is reasonable, that a more
complex cost-friction analysis (e.g. energetic model, habitat model) based on
additional assumptions, could have helped to explain more of the genetic sampling
variation compared with the results from the ten altitude threshold matrices.
Despite an expected continuum of fox abundance up to 2500m elevation, the best fit
between genetic and spatial distances in the individual based IBD analyses was
observed for the second lowest (1400m) altitude threshold matrix. The most
parsimonious explanation for this result is that red foxes disperse along valleys rather
48

CHAPTER 3
than across them and thus supports the assumption that dispersal direction in red foxes
can be altered by topography. Moreover, it emphasizes that habitat requirements
during dispersal might be different to general habitat requirements in red foxes. The
topographic effect on red fox dispersal direction was indirectly reflected by the spread
o f the last rabies epidemic (1967-96) in Switzerland (Kappeler 1991). The rabies
epidemic was observed to be repeatedly channelled and delayed by various natural
and artificial structures, such as lakes and large rivers, mountain chains over 2 0 0 0 m
altitude, agglomerations and fenced-off motorways (Kappeler 1991). To the best of
my knowledge this is the first genetic study showing that red foxes prefer to disperse
along topographic features. Furthermore the present study confirms the findings of
ecological data (Zimen 1984, Funk 1994).
White at a l (1995) demonstrated a negative relationship between red fox density and
home range size. As previously discussed, red fox density is likely to be higher at
lower altitude than at higher altitude. Assuming that red fox dispersal distances are
reflected by the number of territories crossed rather than by an absolute distance in
meters (Macdonald & Bacon 1982, Trewhella et a l 1988), the expected average
dispersal distance at lower altitude is likely to be shorter. Under these conditions and
by neglecting any topographic effects on dispersal direction, the best fit for an IBD
analysis between genetic and spatial distances should be demonstrated with an
Euclidian distance matrix. Consequently, the actual effect of topographic structures on
dispersal direction might be even more pronounced than observed.
Conclusions
This study demonstrates a strong relationship between the topography of a landscape
and the fine-scale spatial genetic structure of red foxes. This study demonstrated that
spatial data computed using GIS methods, based on accurate individual sampling and
combined with genetic data based on a set polymorphic loci, can help to analyse the
landscape context of dispersal (Coulon et a l 2004, Sacks et a l 2004). While this
study incorporated elevation data for the spatial analyses only, future studies might
benefit from a growing set of geographic reference data {e.g. high resolution height
models, landscape models including a set of thematic layers such as habitat, human
use, etc.). This study further pointed out the possibility to gain indirect estimates of
49

CHAPTER 3
dispersal distances and sex-biased dispersal. In general, it follows the emerging field
o f moving from population genetic research based on allele frequencies and arbitrary
defined populations to research centred on analysing individual multilocus genotypes
in a continuous population (Vrana & Wheeler 1992, Manel et a l 2003, Coulon et al.
2004). Given the potential to obtain diverse information on dispersal, combining
individual spatial and genetic data from continuous populations might soon be the
method of choice to infer data of dispersal pattern in ecology and evolution.
50

CHAPTER 4
Temporal Demography and Genetic Diversity of a
Red Fox Population Following a Rabies Epizootic.
AbstractInfectious diseases can pose a serious threat to natural population viability. In this study,
the demography and genetic variation of a local red fox ( Vulpes vulpes) population
(411km2, Switzerland) before, during and after a rabies epizootic from 1966 onwards
were analysed. Post mortem data on rabies tests (n=2658), juvenile - adult ratio
(n=1628), accurate adult age (n=561) and sex (n=1612) were complemented by small-
scale roadkill (roadkill index) and hunting records (hunting index). A total o f 16
polymorphic microsatellite loci were successfully amplified in historic tooth and tissue
samples (n=184). In particular, care was taken to account for genotyping reliability. In
1975, the red fox population declined by 79% based on the roadkill index as a result of
the first rabies infection. Following this decline, the population increased continuously
by over 600% (roadkill index) until it reached a plateau in the mid-1990s, which likely
corresponded with the carrying capacity. Throughout these 35 years, the age distribution
altered significantly. Whilst the juvenile proportion decreased from 56% to 40% during
the phase of population growth (1976-94), the average adult age increased from 1.78 to
2.86 years. In contrast, no long-term trends in heterozyosity (H o and H e), allelic diversity
and inbreeding coefficient (Fis) could be identified although for all three estimators
considerable variation was found both short-term and longer-term. Alterations in the
demographic structure were explained by a general lower mortality subsequent to the
population decline and by variance in female reproduction over time. The interpretation
of the absence of a genetic bottleneck needs to take into account immigration and the
relation between remnant local and regional effective population size following the first
rabies infection.
51

CHAPTER 4
Introduction
Infectious diseases are considered to play a central role in natural systems, ranging from
influencing species compositions in ecological communities to the genetic diversity of
hosts (Altizer et al. 2003). Because of their potential to trigger sudden and unexpected
epidemics (Altizer et al. 2003), infectious diseases can pose a serious threat to
endangered species and small populations (e.g. Smith 1982, May 1988). They can
negatively influence population viability by direct deterministic extinction or by
suppressing the size or growth rate and thus making small populations vulnerable to
stochastic factors (Woodroffe 1999). The biggest threat usually comes from virulent
pathogens, which can ‘spill over’ from other and more numerous host species
(Woodroffe 1999, see also Daszak et al. 2000). Carnivores in particular are vulnerable to
infectious disease and several dramatic declines in populations o f different species have
occurred since the beginning of the 1990s (reviewed in Funk et al. 2001). However, the
effect o f infectious disease and its dynamics in wild populations is complex and our
understanding o f mechanics, dynamics and persistence of disease is still poor (Funk et al.
2001).
Infectious diseases can have serious consequences to the genetic diversity of populations
by causing drastic reductions in population size (O’Brien & Evermann 1988). In general,
demographic bottlenecks can limit the adaptive potential of a population and increase the
probability o f extinction due to a higher rate of inbreeding, fixation of deleterious alleles
and loss of genetic variation (e.g. Lande 1988). Furthermore, the potential genetic
consequences caused by a demographic bottleneck such as a strong selection for
resistance against an infectious disease, might further reduce genetic diversity (O’Brien
& Evermann 1988). Despite the importance of infectious diseases in conservation, little
is known about the genetic consequences caused by diseases in natural populations. This
applies to small and large populations. An apparent explanation for this deficit may be
the absence o f pre-bottleneck sampling, which is essential for assessing the temporal
genetic diversity o f populations.
52
CHAPTER 4
The dynamics of gene flow and selection in natural populations on a spatial and temporal
scale is fundamental in ecological and evolutionary processes. While a large number of
studies exist on genetic differentiation on a spatial scale, relatively little effort has been
directed towards studies on temporal dynamics o f genetic diversity, drift and gene flow
in natural populations (Nielsen et al. 1999a). Nonetheless, it is widely accepted that
observed genetic patterns are stable over time and that other factors, which may cause
temporal genetic differences, are negligible (Tessier & Bematchez 1999).
In conservation, knowledge of the demographic history of populations is important when
making decisions about population management (Bruford & Beaumont 1999).
Consequently, current low levels of genetic variability based on neutral genetic markers
have been used to infer past population bottlenecks (e.g. O’Brien et al. 1983, Ellegren et
al. 1996). Data on allele frequencies could further help to identify recent bottlenecked
populations by testing for heterozygosity excess (Luikart & Comuet 1998). However,
analysing DNA from historical samples collected before bottlenecks or from extinct
populations could give more informative insight into the past demographic history of
populations and species (Bouzat et al. 1998). Furthermore, by combining historical with
recent samples, levels o f genetic diversity could be compared across different time
periods, while the rate in which diversity has changed can be estimated (Pichler & Baker
2000).
Since DNA gradually degrades over time (reviewed in Lindahl 1993), the extracted DNA
from historic samples can be expected to be highly degraded and diluted. Development
of molecular methods in general, and short polymorphic genetic markers amplified by
PCR, for example microsatellites, have nonetheless allowed even genetic data to be
gained from traces o f nuclear DNA (e.g. Bouzat et al. 1998, Nielsen et al. 1999b,
Chapter 1). However, along with the necessity to verify sample authenticity (Hoss 2000),
genotyping errors due to highly diluted historic samples can be expected (e.g. Navidi et
al. 1992, Taberlet et al. 1996, Chapter 1).
It is obvious that the main problem of using historic samples for population genetic
studies - apart from dealing with low copy and quality DNA - is related to sampling.
Investigations based on historic samples rely almost explicitly on museum collections,
and obviously, these collections have not been created to conduct population genetic
53

CHAPTER 4
studies in the first place. Therefore, sample sizes have often been inadequate to estimate
allele frequencies for a given population (Nielsen et al. 1999a). In addition, information
on individual samples {e.g. age, sex, sampling site) is often limited. Exceptions are long
term collections of scale samples for age surveillance of fish populations {e.g. Nielsen et
al. 1999a, Heath et al. 2002, Meldgaard et al. 2003).
Most studies using historic samples have focussed on reconstructing phylogenies based
on mitochondrial DNA sequence variability {e.g. Leonard et al. 2000, Hammond et al.
2001, Shapiro et al. 2002). In contrast, relatively few studies have addressed temporal
population genetic structure by comparing the genetic diversity inferred from autosomal
inherited genetic markers {e.g. microsatellites) between historic and contemporary
samples (Bouzat et al. 1998, Nielsen et al. 1999a, Groombridge et al. 2000, Pertoldi et
al. 2001, Walker et al. 2001, Larson et al. 2002, Miller & Waits 2003).
The present study assessed the dynamics of a red fox population in Switzerland
following a rabies epizootic and investigates its effects on the demography and the
genetic diversity o f the population. Rabies is a viral infection in mammalian species of
the central nervous system (Blancou et al. 1991). The principal hosts and vectors for the
classical rabies are the domestic dog (urban rabies) and the red fox (silvatic rabies,
Macdonald 1980). Red foxes are very susceptible to rabies infection (Macdonald &
Voigt 1985) and dependent on the initial population density, their populations can be
severely reduced by it (Anderson et al. 1981, Macdonald & Voigt 1985). Despite the
high selective pressure imposed by the high rabies-induced mortality, red foxes seem
however, not to have developed resistance to rabies (Macdonald & Voigt 1985). In this
context, silvatic rabies differs from a general host-parasite evolution model, where the
host’s immune competence is thought to counteract parasite virulence {e.g. Wakelin &
Apanius 1997). Consequently, the epidemic of rabies is tightly associated with the social
structure, population dynamics and ecology of the red fox, the only vector species in
Western Europe {e.g. Steck & Wandeler 1980, Macdonald 1980, Anderson et al. 1981).
Based on the findings of numerous studies on fox density and social organisation, models
o f fox contact rate and its implication for rabies control have been developed {e.g.
Trewhella & Harris 1988, White et al. 1995). In general, the dynamics of rabies is a
function o f fox density, dispersal and the carrying capacity o f the habitat type (Steck &
Wandeler 1980, Macdonald 1980, Funk 1994). The mass immunisation of the principal
54
CHAPTER 4
wild host with live attenuated, and later recombinant vaccines, led to the successful
establishment of oral immunisation of red foxes (Wandeler 2000).
The current silvatic rabies epizootic in Europe started in Poland in 1939 and
subsequently spread westwards (Macdonald 1980). In Western Europe, the disease
reached its maximum extension around the early 1980s, before oral vaccination
campaigns led to a significant decrease in the number of rabies cases (Stohr & Meslin
1996). At present, red fox rabies is no longer present in most initially infected Western
European countries, while in Eastern Europe the epizootic has remained prevalent
(www.who-rabies-bulletin.orgV
The rabies epizootic reached Northern Switzerland in 1967 and subsequently swept
through the country. In the 1980s, the cumulative area infected reached 55% of the total
area o f Switzerland, but following the successful initiation of oral wildlife vaccination,
the disease was soon eliminated from most parts of Switzerland (Kappeler 1991). Since
September 1996, no more rabid foxes have been recorded and in 1999, Switzerland was
declared rabies-free according to WHO guidelines (Breitenmoser et a l 2000).
Since 1967, the European rabies epizootic has been thoroughly monitored by sampling
red foxes throughout Switzerland. In addition, local hunting authorities recorded long
term roadkill and hunting data. By combining these post-mortem data with a
comprehensive collection of historic tooth samples of foxes accumulated during the
epizootic, this study aimed to assess the demography and genetic structure in a local red
fox population before, during and after a rabies infection.
The study had three main objectives: i) To assess the population dynamics of red foxes
over the last 35 years in relation to the observed number of recorded rabies cases, ii) To
investigate the effect o f the induced mortality on age structure and sex ratio, iii) To
assess temporal genetic changes in genetic structure following the rabies epizootic by
using polymorphic microsatellites markers.
55

CHAPTER 4
Materials and Methods
Historic samples and study area
Between 1967 and 2000, hunters and game wardens provided more than 50,000 fox
carcasses for the surveillance of the epizootic to the Swiss Rabies Centre at the
University of Bern. Individual data for each fox was systematically recorded including
date of delivery, sex, sampling site and results from the rabies virus test. For monitoring
the oral wildlife vaccination, fox samples were additionally tested for the successful
uptake of the vaccine bait. To discriminate between juveniles and adults the relative
width of the pulp cavity of a canine tooth was measured using X-ray (Kappeler 1985). In
order to extract the caninus tooth, the lower jaw of the fox carcass was removed and
subsequently autoclaved with the objective to eradicate any potential rabies virus and to
facilitate the removal of the tooth. Therefore, one tooth per fox sample was
systematically collected and stored. Throughout the rabies epizootic, a total of over
28,000 individual tooth samples were systematically collected.
R h i n e
10km
Figure 1 Location of the study area (411km2; grey area) in the Canton Aargau, Switzerland. The dark and light lines represent rivers and approximate hunting ground boundaries, respectively.
56

CHAPTER 4
Despite the large number of teeth available, samples were not randomly distributed in
time or space. In general, sampling efforts were biased towards rabies-infected areas and
vaccination zones. Since the objective of this study was to investigate a continuously
sampled population over time, a confined study area was selected in Northern# ^
Switzerland (Canton Aargau). This 411km area is encompassed by the two main rivers
Rhine and Aare (Figure 1), which prevented the spread o f the first rabies wave in 1967.
However, in 1975 the epizootic swept across the whole region. Nevertheless, foxes were
collected from 1967 onwards, thus providing pre- samples before the rabies infection hit
the study area. Following some single positive rabies records in the late 1980s and the
1990s, a continuous surveillance of the disease and vaccination programme was
necessary. To supplement the historic tooth collection, recent tissue samples were
provided by the local hunting authorities in 2 0 0 1 -0 2 .
Rabies epidemic and demographic data
Based on the available data records from the study area, the annual numbers of observed-y
positive rabies cases per km (rabies index), and the annual and three-year sliding means
for female and juvenile proportions of the red fox population studied were computed.
Additionally, a number o f historic and recently collected teeth from adult foxes were
accurately aged; the root-tip was removed and subsequently aged by counting annual
cementum lines following a modified protocol by Kappeler (1985) based on Grue &
Jensen’s (1973) method6. Annual mean and three-year sliding means for adult age were
computed. Furthermore, the age distribution based on accurate individual age data from
adult foxes collected in 1971-73, 1983-85 and 1996-98 was tested in a contingency table.
Hence an unbiased estimate of the p - value of the probability test (Fisher’s exact test)
was performed by a Markov chain method using the sub-program STRUCT implemented
in GENEPOP (Raymond & Rousset 1995b).
To assess the red fox population dynamics, an additional and independent data set of the
annual number o f foxes killed by traffic (roads and rails) and hunting was provided by
the hunting authorities of the Canton Aargau for the study area between 1970 and 1967,
respectively. These data records were based on individual or joint local hunting grounds
on a borough level (Figure 1). To account for missing data and the size of individual
hunting grounds, roadkill and hunting data were recorded as the number of foxes killed
6 All tooth samples were aged by Matthias Ulrich, Bern, CH.
57
CHAPTER 4
per km (roadkill index and hunting index) for each hunting ground. Annual means,
three-year sliding means and standard errors (SE) across grounds were computed.
Finally, the annual growth rate of the fox populations was calculated as: rx = In ( A [ r0adkiii-
index] i / ^[roadkiii-index] i - i ) (McCallum 2000). All data records and analyses were based on
biological years by assuming that all foxes were bom on the 1st April.
Laboratory work
Only individual samples with a complete record, i.e. accurate age, date of delivery, sex,
sampling site, rabies test results and an undamaged tooth sample, were selected for
genetic analyses. DNA was extracted from the tooth using a silica-based spin column
(QIAquick® - PCR purification kits, Qiagen). In brief, the whole canine tooth or the
remaining tooth crown (« 0.7g) for juveniles and accurately aged adults, respectively,
were ground to powder using a steel mortar. After decalcification (EDTA, pH8.0, 0.5M,
72h), samples were digested (proteinase K) twice overnight. DNA was bound to the
silica membrane by vacuuming the supernatant through the QIAquick column, purified
following the manufacturers protocol (for details see Chapter 1) and finally eluted in
200/iL o f H2O. DNA from recent tissue samples was extracted using a DNeasy® tissue kit
(Qiagen).
Based on the results o f successful PCR amplification in historic tooth extracts in relation
to different microsatellite loci in size (Chapter 1), only loci were used with less than 170
bps of maximum fragment size. Nine canine microsatellite loci (AHT-130, Holmes et al.
1995; CXX-156, CXX-250, CXX-279, CXX-434, CXX-466, CXX-606, CXX-608
Ostrander et a l 1993, 1995; and c2088; Francisco et a l 1996) and seven re-designed red
fox-specific canine microsatellite (V142, V374, V402, V468, V502, V602, V622;
Chapter 2) were used in this study. Single PCR reactions for loci AHT-130, CXX-156,
CXX-250, CXX-434, CXX-466, CXX-608 and c2088 were performed in a total volume
of 6 /iL containing 2/iL of template DNA, following a hotstart PCR protocol (for details
see Chapter 1). For all other loci, PCR efficiency and success was significantly improved
by using Qiagen’s PCR multiplex kit. Between two and three loci were co-amplified.
PCR was carried out in a total volume o f 8 /1L containing 4^tL o f multiplex PCR master-
mix, \.2fxg BSA, 0.08-0.4/xM of each primer and 3/*L of template DNA. PCR
amplifications were performed in a GeneAmp® PCR System 9700 (ABI) using the
following cycling parameters: 12mins o f initial denaturation at 95°C, followed by 40
58

CHAPTER 4
cycles of 30s at 94°C, 120s at 58°C and 60s extension at 72°C, with a final extension of
30mins at 60°C. All PCR products were electrophoretically separated using an ABI
Prism® 377 DNA sequencer (ABI). Allele sizes were scored against the size standard
GS350 Tamra™ (ABI) using GENESCAN™ Analysis and GENOTYPE™ software.
To account for allelic drop-out and false alleles by PCR amplification of microsatellite
loci from highly diluted DNA (e.g. Navidi et al. 1992, Gagneaux et al. 1997, Morin et al.
2001, Chapter 1), the nuclear DNA concentration for all individual tooth samples was
initially estimated by a quantitative PCR (5’ exonuclease assay), which targets a 81 bps
portion of the highly conserved c-myc proto-oncogene (Morin et al. 2001, for details see
Chapter 1). Only samples with an estimated DNA concentration of 5 pg//iL or more were
considered for subsequent microsatellite genotyping. Heterozygote genotypes were
independently and successfully amplified at least twice, whereas homozygote genotypes
were repeated according to the estimated DNA concentration (Morin et al. 2001). Hence,
extracts with an estimated concentration of more than 200pg for a single PCR reaction
were amplified twice, samples between 1 0 0 - 2 0 0 pg, four times and extracts with less
than lOOpg at least five times. DNA extraction of all tooth samples and PCR mix
preparations were performed within a spatially isolated laboratory dedicated for working
with low-copy DNA samples. Special care was taken to avoid cross-contamination and
contamination with contemporary DNA. Quantitative PCR assays were carried out at the
Laboratories for Conservation Genetics in Leipzig, Germany.
Population genetic analyses
Global estimates o f single locus genetic diversity (He\ Nei 1987) and observed
heterozygosity (H o) across all samples and years were computed in GENEPOP
(Raymond & Rousset 1995b). Genotypic linkage disequilibrium between all pairs o f loci
(Gamier-Gere & Dillmann 1992) was tested in GENEPOP. Using the same software,
single and multilocus deviation from Hardy-Weinberg equilibrium was tested
(probability test). Annual estimates for He, Ho and the inbreeding coefficient F\s (Weir &
Cockerham 1984) were calculated using the same software package. Further, to estimate
the allelic diversity (A3), the mean number and SE o f detected alleles across all loci were
permuted ( 1 0 0 0 iterations) for a minimum number of three individuals for each year
using POP ASSIGN (Funk, unpublished). To account for missing genotypes,
permutations were computed for each locus independently. A genic differentiation test
59

CHAPTER 4
across all annual samples was applied to test for the global allelic distribution using
GENEPOP (Raymond & Rousset 1995b). For each locus a contingency table was
computed and an unbiased estimate of the p - value of the probability test was performed
(Raymond & Rousset 1995a). Subsequently, single locus probability values were
combined according to Fisher’s method (Sokal & Rolf 1995). Because alleles are
expected to be lost faster than heterozygosity following a demographic bottleneck
(Luikart & Comuet 1998), annual A 3 and He measures were correlated to identify a
potential recent bottleneck. For all population genetic analyses on an annual basis,
individual samples were allocated to their year of birth, with the exception of nine
temporally isolated individuals, which were assigned to either the previous or the
following year.
To establish a smoother function of the observed genetic estimates over time, annual
multilocus means were also computed for He, Ho, F\s and A 3 by including all individual
samples bom within a time period of three years. In contrast to the single annual values,
an individual sample could thus be represented in up to three annual genetic estimates.
Finally, global genic differentiation and Fst - values were computed across all individual
samples from 1971-73, 1983-85 and 1996-98.
Results
Population dynamics and demography
Annual roadkill and hunting data were available for up to 40 local hunting grounds and
combined, represented 95.6% (mean: 9.8km2; min - max: 2.5 - 30.5km2) of the total size
of the study area (Table 1). From 1967 to 2000 a total of 2658 fox carcasses from the
study area were posted to the Rabies Centre. 742 foxes were tested rabies positive,
peaking in 1975 with 558 recorded cases (rabies index = 1.36). The whole region
remained rabies-infected until 1984 and was re-infected in the first half of the 1990s
(Table 1; Figure 2). Between 1984-86 and 1989-98, the red fox population studied was
subjected to oral rabies vaccination. Post-mortem data on sex and age (juvenile and
adults) were recorded for 1612 and 1628 individuals, respectively. The absence of data
recording was prominent for the first three years of rabies surveillance and during the
60
CHAPTER 4
first rabies wave between 1974 and 1976, while from 1978 onwards, records were
complete. A total of 561 adult individuals were accurately aged (Table 1).
A positive correlation between the roadkill and hunting index was observed and
subsequently improved when an outlier (1975) was excluded (roadkill index = 0.013 +
3.54*hunting index; r = 0.93, n = 30). After the first rabies infection in 1975, the roadkill
index in 1976 dropped from 0.445 to 0.0175 by 79.2%, indicating a severe decline in
population size. However, following the rabies-induced population crash, the roadkill
index increased by over 600%, therefore exceeding pre-rabies population size from the
mid-1980s onwards. The dynamics of this population can be divided into three periods:
‘pre-rabies’ (< 1976), ‘recovery and growth’ (1977-94) and ‘carrying capacity’ (> 1995;
Figure 2). Finally, the average annual population growth rate between 1970 and 2000
was 0.031.
Mean ± SD o f female and juvenile proportion across all years was 0.45 ± 0.08 and 0.47 ±
0.13, respectively (Table 1). During the period of population recovery the estimated
proportion of juveniles declined from 56% to 40% (juvenile proportion = 20.5 -
0.0101 *year; n = 17; r = -0.51; Figure 2). Although there was no apparent trend for the
sex ratio observed, the proportion of recorded females in relation to males was low
between 1981 and 1988 (0.35 - 0.44). The ratio between rabies-infected and non-infected
foxes was not affected by sex or age (adults versus juveniles), although the observed
proportion of infected males compared to females tended to be higher (sex: X * ] , \ ( > \ 2 =
3.008; p = 0.08; age: = 0.73; p>0.39; Chi-square test). Following the first rabies
infection, average adult individual observations increased from 1.78 (1984) to 2.86 years
(1994) during the population growth period (mean adult age = -211.1 + 0.107*year; n =
10; r = 0.85; Figure 2). The observed distribution of adult age classes for 1971-73, 1983-
85 and 1996-98 differed significantly (p < 0.009, Table 2). Finally, no adult individual
collected and accurately aged between 1983 and 1985 (n = 63) was older than five years
(Table 2).
61

Table 1 Summary of the demographic and epidemic data for a red fox population (Canton Aargau, Switzerland) following a rabies epizootic from 1966-2001. Shown are the annual (biological year) data / estimates for sample size of provided foxes and recovered individual tooth samples, absolute number of recorded rabies cases and rabies index (recorded positive cases per km2), oral vaccination (yes / no), female and juvenile population ratios, average adult age, average (± SE) roadkilland hunting index and growth rate (McCallum 2000).Year Sample size
Foxes Teeth N N
RabiesRabiesN
& Vaccination cases Vacc. index yes/no
FemaleMean
Sexprop.
N
ratio & Age structure Juvenile prop. Adult Mean N Mean
ageN
Roadkill & Growth rate Index (cases/km2) Growth
Mean SE N r
Hunting Index (cases/km2)
Mean SE N1966 - . - _ _ _ _ . 1.89 1.37 381967 38 0 0 0.000 0 _ - - - 2.32 1.06 381968 32 0 0 0.000 0 0.38 13 0.69 13 - - _ - - - 1.32 0.81 321969 13 4 0 0.000 0 0.60 10 0.40 10 3.00 3 - _ - - 0.86 0.68 321970 7 4 0 0.000 0 0.50 6 0.29 7 1.00 3 0.18 0.17 35 - 0.74 0.61 381971 89 10 0 0.000 0 0.47 87 0.80 87 2.00 14 0.26 0.30 39 0.56 0.87 0.53 381972 177 70 0 0.000 0 0.47 177 0.51 176 2.35 62 0.34 0.35 40 0.17 1.36 0.71 381973 133 45 0 0.000 0 0.52 111 0.47 111 2.07 44 0.27 0.25 40 -0.34 1.27 0.88 381974 115 0 3 0.007 0 - - - - - - 0.44 0.33 38 0.29 2.02 1.05 381975 854 25 558 1.358 0 0.33 39 0.46 37 3.10 10 0.43 0.44 33 0.29 4.98 2.71 371976 6 0 2 0.005 0 - - - - - - 0.09 0.17 40 -0.94 0.32 0.31 381977 4 0 0 0.000 0 - - - - - - 0.14 0.21 40 0.17 0.35 0.32 381978 10 3 5 0.012 0 0.56 9 0.60 10 - - 0.15 0.21 40 0.00 0.48 0.42 381979 56 4 45 0.109 0 0.40 55 0.60 55 1.67 3 0.17 0.24 39 0.14 1.12 0.78 371980 10 0 9 0.022 0 0.56 9 0.44 9 - - 0.11 0.16 40 -0.42 0.29 0.36 381981 23 0 16 0.039 0 0.35 23 0.70 23 - - 0.14 0.23 40 0.37 0.27 0.32 381982 10 1 7 0.017 0 0.44 9 0.40 10 - - 0.12 0.17 40 -0.26 0.30 0.29 381983 25 1 15 0.036 0 0.42 24 0.54 24 - - 0.21 0.24 40 0.32 0.34 0.29 381984 70 71 24 0.058 1 0.35 66 0.39 70 1.53 43 0.21 0.23 40 -0.03 0.40 0.41 381985 67 62 0 0.000 1 0.35 65 0.63 67 1.75 20 0.26 0.30 39 0.25 0.70 0.49 381986 82 78 0 0.000 1 0.41 79 0.52 82 2.14 36 0.24 0.21 39 -0.37 0.97 0.53 381987 45 23 0 0.000 0 0.43 44 0.53 45 - 1 0.41 0.43 39 0.74 1.42 0.86 381988 25 23 0 0.000 0 0.36 25 0.36 25 2.42 12 0.50 0.40 39 -0.07 1.51 0.88 381989 50 49 1 0.002 1 0.50 48 0.37 49 1.92 26 0.50 0.42 39 0.04 2.48 1.93 371990 34 33 1 0.002 1 0.53 34 0.53 34 2.25 8 0.51 0.34 39 -0.20 2.54 1.72 381991 136 130 1 0.002 1 0.46 136 0.42 136 2.43 60 0.58 0.40 40 0.15 2.35 1.35 381992 91 88 5 0.012 1 0.36 91 0.41 91 2.57 44 0.61 0.50 38 0.22 1.61 0.99 381993 116 109 19 0.046 1 0.45 114 0.43 116 3.00 47 0.60 0.38 40 -0.26 2.18 1.23 381994 135 117 29 0.071 1 0.45 133 0.45 135 2.50 26 0.73 0.44 40 0.15 2.11 1.17 381995 65 53 2 0.005 1 0.49 65 0.28 65 3.09 33 0.61 0.44 40 -0.01 2.22 1.03 381996 50 47 0 0.000 1 0.43 49 0.44 50 2.92 24 0.69 0.45 40 0.02 2.29 1.28 381997 25 24 0 0.000 1 0.44 25 0.20 25 2.27 15 0.62 0.38 40 -0.17 2.16 1.00 381998 35 33 - - 1 0.49 35 0.37 35 3.00 14 0.58 0.39 40 0.05 2.23 1.36 381999 12 5 - - 0 0.58 12 0.50 12 3.50 2 0.71 0.46 40 0.16 2.48 1.45 382000 2 2 - - 0 - - - - - 2 0.78 0.42 40 -0.07 2.58 1.79 382001 16 16 - - 0 0.3125 16 0.44 16 2 9 - - . -
Mean 75.9 32.3 - - - 0.447 0.472 - 2.369 0.394 0.324 - 0.031 1.524 0.941 -
SD - - - - - 0.077 - 0.130 - 0.602 ~ 0.218 0.106 - - 1.005 0.549 -
Total 2658 1130 742 - 13 - 1609 - 1625 - 561 - - - - - - -
CHAPTER
4
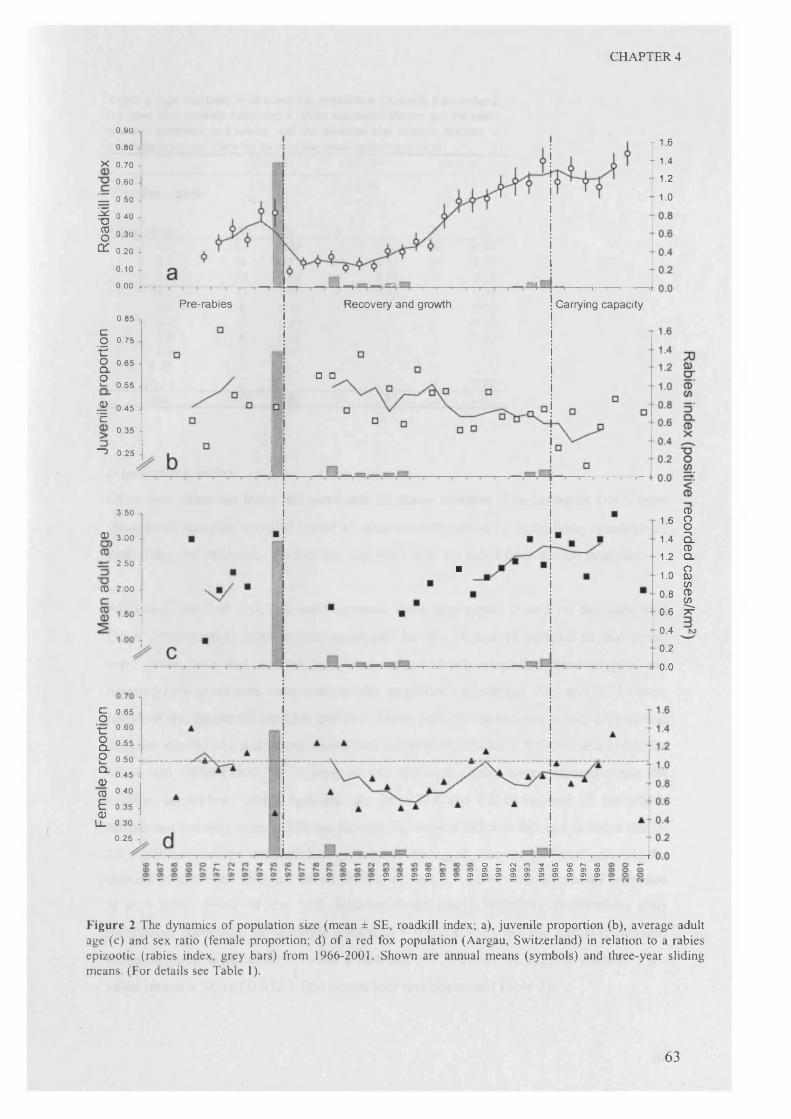
CHAPTER 4
0.90
0.80
X 0 70
0.60
-Z 0.50 § 0.40
g 0 30
0 0.20
0.10
0.00
0.85cO 0.75 €O 0.65 Q .O- 0 . 5 5
^ 0.45 C
0.35=3
“ 5 0.25
3.50
□ □
■
<D 3 00
2.50 i
0 2.00
c 0.65o■c 0.60 -
a 0.55 -
s 0.50 -CL 0.45<1)0 0.40
E 0.35<D
LL 0.300.25
O ^ ( N C 0 ^ t f ) ( 0 N f l 0_ _ _ _ _ _ _ _ O) O) O O) O) O) o o> o>
_ _ _ 0 ) 9 0 ( S 0 9 Q O > 0 ) C D O ) 0 > 0 ) 0 ) 0 ) 0 >
Figure 2 The dynamics of population size (mean ± SE, roadkill index; a), juvenile proportion (b), average adult age (c) and sex ratio (female proportion; d) of a red fox population (Aargau, Switzerland) in relation to a rabies epizootic (rabies index, grey bars) from 1966-2001. Shown are annual means (symbols) and three-year sliding means. (For details see Table 1).
Pre-rabies
016 81.4 EL
01 .2 Q -
1.0 8 0
0 8 ® tn0.6 ^ 0.4
0.2
0.0
E-l —? ^ 1 » , r
Recovery and growth— ...............
j Carrying capacity
T 16- 1.4
- 1.2
1.0
63

CHAPTER 4
Table 2 Age distribution o f a red fox population (Aargau, Switzerland) for three time periods following a rabies epizootic. Shown are the ratios between juveniles and adults, and the absolute and relative number of individuals per age class for each of the three sampling periods.
1971-73 1983-85 1996-98
Juveniles: Adults 1:0.76 1:0.96 1:1.75(N=374) (N=161) (N=l 10)
Age in years N % N % N %1-2 65 0.54 35 0.56 20 0.382-3 20 0.17 20 0.32 10 0.193-4 10 0.08 6 0.10 10 0.194-5 11 0.09 2 0.03 2 0.045-6 4 0.03 - - 4 0.086-7 5 0.04 - - 5 0.097-8 4 0.03 - - 1 0.028-9 1 0.01 - - - -
9-10 - - - - - -
10-11 - - - - 1 0.02Total 120 100 63 100 53 100
Population genetics
DNA was extracted from 262 tooth and 16 tissue samples. The extracted DNA from
three tooth samples revealed traces of cross-contamination by amplifying consistently
more than two alleles for several loci and were thus excluded from further analyses.
All tissue and 168 (64.1%) tooth samples were genotyped. Based on the estimated
DNA concentration, homozygote genotypes for 96, 24 and 48 samples in that order,
were twice, four and at least five times independently amplified. Homozygote and
heterozygote genotypes were successfully amplified on average 3.33 and 2.95 times,
respectively, across all samples and loci. Mean genotyping success across all loci and
samples was 96.3% and varied across loci between 90.2% for CXX-606 and 100% for
V374 and V486 (Table 3). A total of 142 different alleles were detected while the
number across loci varied between six for V374 and CXX466, and 17 for V602.
Multilocus values (mean ± SD) for He and Ho were 0.785 ± 0.065 and 0.760 ± 0.075.
No significant linkage disequilibrium was found among all pairs of loci after adjusting for
multiple comparisons (data not shown; A=136; all tests p > 0.05Ik with Bonferroni correction
of a = 0.05). None o f the loci departed from Hardy-Weinberg equilibrium after
Bonferroni correction for multiple testing (a = 0.05; k =16), but the global multilocus
value deviated significantly (Fisher’s method: p < 0.0002). A slightly positive Fis -
value (mean ± SD) o f 0.032 ± 060 across loci was observed (Table 3).
64

CHAPTER 4
Table 3 Summary of the observed genetic diversity, PCR success and the number of independent PCR repetitions for accurate microsatellite genotyping across all historic (n= 168) and recent (n = 16) red fox samples collected continuously over 35 years. Shown are single-locus values for the absolute and relative number of successful genotyping, average number o f independent and successful PCR repetitions for homozygote {Horn) and heterozygote {Het) genotypes, range of microsatellite fragment size, number of detected alleles (A), expected ( / /E; Nei 1987) and observed heterozygosity (H0), inbreeding coefficient (FiS; Weir & Cockerham 1984) and p - values for Hardy-Weinberg deviation.
Locus
PCR success & PCR repetitions
Success* Repetitions* Fragment r size [bps]
N % Horn Het Min Max
Genetic diversity & Test for HW-deviation
HW-testb
A He Ho Fis P*AHT-130 167 99.5 4.36 3.51 98 120 8 0.741 0.743 -0.003 0.047V142 159 95.1 2.58 2.62 133 147 10 0.875 0.840 0.040 0.589CXX-156 161 96.2 3.15 2.95 131 131 9 0.797 0.746 0.064 0.023CXX-250 161 96.2 3.44 2.63 124 140 9 0.805 0.802 0.003 0.091CXX-279 161 96.2 2.79 2.65 114 142 9 0.788 0.825 -0.047 0.315V374 168 100.0 3.78 3.92 106 118 6 0.813 0.766 0.057 0.086V402 167 99.5 2.91 2.39 78 90 7 0.784 0.798 -0.018 0.234CXX-434 158 94.6 4.15 3.37 102 110 7 0.709 0.655 0.076 0.385CXX-466 162 96.7 3.74 3.98 144 154 6 0.735 0.787 -0.071 0.179V486 168 100.0 3.11 2.98 82 98 9 0.835 0.793 0.049 0.728V502 166 98.9 2.87 2.17 79 95 9 0.656 0.560 0.146 0.071V602 164 97.8 3.52 3.00 140 172 17 0.904 0.878 0.029 0.076CXX-606 150 90.2 2.66 2.43 152 166 8 0.709 0.735 -0.037 0.565CXX-608 158 94.6 2.82 2.75 129 147 8 0.778 0.770 0.010 0.056V622 153 91.8 2.95 2.59 91 119 9 0.835 0.763 0.086 0.020c2088 156 93.5 4.09 3.01 116 156 11 0.802 0.703 0.124 0.015Mean 161.2 963 333 2.95 113.7 131.6 8.88 0.785 0.760 0.032 0.0002SD 5.4 - 0.57 0.53 23.8 25.4 2.55 0.064 0.075 0.060 -* Based on historic samples only.b p - value (probability test; Raymond & Rousset 1995a) before Bonferroni correction for multiple testing.
The temporal allelic distribution across loci and the 27 annual samples did not differ
significantly (Fisher’s method, X2 = 45.39; d f = 3 2 ; p > 0.059), although the computed
p - value was just outside the significance level of 0.05. The dynamics of the annual
and the combined three year multi locus means for He-, Hq, A 3 and Fis are shown in
Table 4 and Figure 3. None of the temporal trends of He, Hq and A3 indicated a
reduction of genetic diversity following the rabies-induced population crash in 1975.
Indeed, He and A3 demonstrated a slightly higher genetic diversity after the epidemic
(Figure 3).
65

Table 4 Summary of the population genetic estimates for a red fox population (Aargau, Switzerland) following a rabies epizootic from 1966-2001. Shown are the sample size for extracted historic tooth samples (NEX), successful genotyped samples (iVGT), samples sorted by year o f birth (jVb), samples used to calculate annual estimates for one year only (N\) and for three years pooled (jV3). Annual multilocus means and SE (across loci) for the inbreeding coefficient (Fis; Nei 1987), expected (HE\ Nei 1987)and observed heterozygosity (//q), and allelic richness (randomised across three individuals) are calculated for one year and three years pooled.Year
NexSample size
Ngr Ng N/ N,Annual population genetics (one year)
Fis HE H0 A mean SE mean SE mean SE mean
3SE
Annual population genetics (three vears pooled) Ft s He Ho A
mean SE mean SE mean SE mean3
SE1966 - - 4 5 - 0.101 0.067 0.735 0.039 0.669 0.060 3.455 0.210 - - - - - - -
1967 - - 1 10 - _ _ - - - _ - 0.065 0.043 0.755 0.026 0.717 0.047 3.526 0.1671968 - - 5 5 8 -0.047 0.053 0.748 0.041 0.778 0.059 3.533 0.246 -0.030 0.054 0.753 0.027 0.772 0.046 3.511 0.1771969 4 2 2 - 10 . . - - -0.055 0.060 0.753 0.029 0.784 0.044 3.542 0.1981970 4 0 3 5 12 -0.064 0.092 0.765 0.029 0.797 0.062 3.525 0.233 0.007 0.035 0.787 0.020 0.778 0.029 3.724 0.1501971 5 0 7 7 17 0.042 0.050 0.805 0.022 0.776 0.046 3.819 0.179 0.045 0.035 0.784 0.019 0.750 0.033 3.707 0.1401972 44 20 7 8 15 0.074 0.055 0.770 0.023 0.720 0.048 3.623 0.161 0.049 0.040 0.784 0.020 0.748 0.039 3.705 0.1501973 29 5 1 - 9 - - - - - - - - 0.074 0.050 0.766 0.022 0.716 0.045 3.582 0.1501974 0 0 1 - 8 - - - - - - - - 0.084 0.065 0.761 0.031 0.698 0.055 3.519 0.1571975 18 10 6 7 0.060 0.060 0.746 0.039 0.704 0.058 3.493 0.184 - _ _ _ - - -
1976 0 0 - - - - - - - - - - - - - - - - - - -
1977 0 0 _ - - - - - - - - - - - - - _ - - - -
1978 3 2 3 5 - 0.095 0.041 0.810 0.022 0.738 0.035 3.828 0.169 - - - - - - - -
1979 4 1 2 - 6 - - - - - - - - 0.084 0.035 0.799 0.022 0.738 0.034 3.785 0.1581980 0 0 1 - 6 - - - - - - - - 0.037 0.046 0.772 0.024 0.748 0.043 3.656 0.1571981 0 0 3 4 11 0.041 0.082 0.789 0.031 0.766 0.070 3.737 0.171 0.025 0.044 0.766 0.022 0.747 0.039 3.583 0.1361982 1 0 7 7 18 0.031 0.060 0.766 0.025 0.738 0.044 3.537 0.170 0.002 0.032 0.771 0.017 0.769 0.028 3.618 0.1151983 0 0 8 8 22 -0.036 0.051 0.773 0.020 0.796 0.040 3.666 0.117 0.002 0.030 0.771 0.017 0.771 0.030 3.631 0.1181984 22 19 7 7 20 -0.002 0.069 0.777 0.026 0.774 0.055 3.655 0.183 -0.021 0.030 0.777 0.017 0.792 0.026 3.687 0.1141985 10 4 5 5 20 -0.008 0.044 0.808 0.016 0.814 0.037 3.808 0.141 0.030 0.028 0.797 0.014 0.775 0.029 3.736 0.1301986 16 13 8 8 19 0.089 0.057 0.812 0.017 0.746 0.050 3.791 0.154 0.017 0.029 0.796 0.015 0.780 0.024 3.735 0.1201987 3 2 6 6 20 -0.026 0.057 0.785 0.021 0.794 0.036 3.735 0.162 0.037 0.029 0.803 0.016 0.771 0.023 3.762 0.1251988 4 4 6 6 19 -0.017 0.061 0.778 0.021 0.781 0.039 3.633 0.121 -0.021 0.029 0.781 0.020 0.793 0.022 3.696 0.1361989 8 6 7 7 19 -0.034 0.066 0.764 0.030 0.793 0.058 3.652 0.222 -0.019 0.029 0.775 0.021 0.786 0.024 3.650 0.1521990 3 3 6 6 20 -0.024 0.052 0.770 0.025 0.777 0.034 3.577 0.180 -0.033 0.035 0.785 0.021 0.809 0.030 3.735 0.1531991 13 8 7 7 21 -0.033 0.033 0.823 0.018 0.847 0.031 3.986 0.166 0.000 0.031 0.776 0.019 0.775 0.028 3.647 0.1521992 10 10 8 8 22 0.070 0.052 0.763 0.024 0.711 0.042 3.559 0.175 0.055 0.026 0.786 0.018 0.744 0.026 3.684 0.1361993 10 8 7 7 23 0.137 0.067 0.783 0.024 0.677 0.056 3.573 0.175 0.075 0.035 0.787 0.018 0.729 0.031 3.669 0.1391994 9 9 8 8 23 0.035 0.060 0.814 0.020 0.789 0.051 3.901 0.154 0.051 0.034 0.795 0.017 0.757 0.031 3.740 0.1331995 9 9 8 8 24 -0.012 0.045 0.784 0.018 0.789 0.032 3.702 0.134 0.040 0.038 0.794 0.016 0.763 0.033 3.729 0.1111996 12 12 8 8 25 0.093 0.057 0.785 0.020 0.711 0.042 3.605 0.123 0.015 0.026 0.787 0.016 0.775 0.024 3.692 0.1181997 8 8 9 9 23 -0.031 0.042 0.797 0.017 0.819 0.036 3.807 0.149 0.033 0.026 0.780 0.016 0.753 0.021 3.633 0.1151998 10 10 6 6 22 0.085 0.042 0.772 0.021 0.708 0.032 3.559 0.162 0.007 0.030 0.778 0.018 0.772 0.028 3.677 0.1361999 3 3 7 8 14 0.012 0.052 0.780 0.027 0.765 0.039 3.696 0.177 0.039 0.040 0.774 0.022 0.740 0.029 3.645 0.1522000 0 0 1 - 17 - - - - - - - - 0.063 0.030 0.790 0.021 0.742 0.029 3.723 0.1492001 *16 *16 9 9 - 0.085 0.035 0.787 0.023 0.722 0.032 3.713 0.142 _ _ _ _ _ _ - -
Mea _ 0.027 0.056 0.781 0.024 0.759 0.045 3.673 0.169 0.025 0.036 0.779 0.020 0.760 0.032 3.664 0.141.lo ta L 27?
00 ■'t00 ■'t00
- - - - - - - - - - - - - - - - -
* Tissue sample

CHAPTER 4
0.881.6
0 . 8 41.4
0 . 8 0
WI ; 0 . 7 6
1.2
1.0
0.80 . 7 2
0.60.68
0.40.20 .6 4
. . , — ^ — T
Recovery and growtho .o
Pre-rabies Carrying capacity0.88
0 8 41.4
0 .8 0
0 . 7 6 -
0 . 7 2 - 0.8 _ . 30.6 9 -
0.680.40.20 .6 4
0.0
4 . 2 0
4 . 0 0 1.4
3 . 8 0
3 . 6 00.8 W
CD0.6 S"3 .4 0
3 . 2 0 ro0.2
0.0
0.201.60 . 1 6
1.40.12
0 . 0 8
C/5 0 .0 4 1.00 00
0.80.6
- 0 . 0 4
- 0 . 0 8
0.40.2
- 0.12
- 0 . 1 6
0.0
Figure 3 Temporal population genetics of a red fox population (Aargau, Switzerland) following a rabies epizootic from 1966-2001. Shown are the annual means (symbols) ± SE (calculated across loci) and three-year means (lines) for expected (a; HE) and observed heterozygosity (b; H0), allelic richness (c; A3, permuted for three individuals) and inbreeding coefficient (d; Fis). Grey bars represent the annual number of recorded rabies cases in red foxes (rabies index). For details see Table 1 and 4.
67

CHAPTER 4
The first annual estimate obtained for He and A3 (1978), after the population reduction
following the rabies infection, aligned within the distribution of all other annual values
(Figure 4). Although the global observed F\S was positive across the 35 years studied,
eight out of nine annual estimates were negative during the most significant periods of
population growth between 1983 and 1991 (Figure 3). Finally, no genic differentiation
across loci and the three time periods 1971-73 (n=15), 1983-85 (n=20) and 1996-98
(n=23) was detected (X1 = 40.6; df = 32; p > 0.14; global Fst = 0.0002).
CO
<D>TDO
4.0
3.9 J
3.8
= 3.7 -
3.6 -
3.5
✓
1978
I□
o oo o
ooo
oo o •P
• 5; 1975o 1976-94 o > 1994
0.72 0.74 0.76 0.78
Hc0.80 0.82 0.84
Figure 4 Relationship between genetic ( H E) and allelic diversity (Ay, permuted for three individuals), showing annual estimates of a red fox population (Aargau, Switzerland) following a rabies epizootic from 1966-2001. Values.represent pre-rabies (filled circles), population recovery and growth (grey circles) and carrying capacity phase (clear circles). The square symbol represents the first population genetic estimation (1978) following the rabies-induced population reduction of 79% in 1975.
68

CHAPTER 4
Discussion
A combination of detailed and long-term epidemiological, demographic and
population genetic data enabled questions on the effects of a rabies epizootic on the
population dynamics, age structure and genetic diversity in a local red fox population
to be addressed. The main findings were as follows: i) Following the rabies outbreak,
the red fox population was estimated to be reduced by 79%. Subsequent to this
reduction the population size increased by over 600% until it most likely reached its
carrying capacity, ii) The age distribution altered over time following the population
reduction and the recovery phase, iii) No genetic bottleneck was detected.
Population dynamics
Indicated by the roadkill index, the red fox population size was reduced by 79%
following the first infection of rabies in 1975. Thus, the observed level of reduction
was higher than the expected proportion o f 50% to 60% of red foxes killed by rabies
(Bogel et al. 1974). In addition, only a minor proportion of the total number of rabid
foxes are being detected (Macdonald & Voigt 1985). Yet, variation in mortality rates
across different fox populations can be expected because the effect of rabies is thought
to be habitat dependent (Zimen 1982); this is due to dissimilar levels of habitat
carrying capacities and the resulting different fox densities. Consequently, a fox
population infected by rabies will be reduced to a certain threshold density (about one
fox per km2), where the epizootic cannot be transmitted further independently from its
preliminary density (see also Anderson et a l 1981). Similar levels of mortality (70%)
were recorded in Scandinavian red fox populations, which were infested by sarcoptic
mange (Lindstrom et al. 1994). Furthermore, Young (1994) reported levels of die-offs
between 50-85% for different diseases and carnivore species. However, it is important
to emphasise that rabies-induced mortality might be much higher, when the disease is
transmitted via a sympatric reservoir host. For example, severe population declines
were reported in the Ethiopian wolf Canis simiensis (see Sillerio-Zubiri et al. 1996)
and the African wild dog Lycaon pictus (see Alexander et a l 1993) after transmission
of rabies through domestic dogs.
Human intervention such as disproportionately high hunting pressure during the peak
o f the rabies epizootic in 1975 is likely to have affected the observed population
69
CHAPTER 4
reduction. In fact, more than 2000 foxes were culled in the study area during the first
year of the rabies epizootic. In contrast, it can be speculated that most of these foxes
would have been killed by rabies nonetheless. It can be assumed, that the fox density
dropped substantially below the expected threshold of one fox per km2. The low
number or absence o f recorded rabies cases in the following three years (1976-78)
further supports this assumption. Hence, the population size for the study area
(411km2) following the first rabies infection could have significantly dropped below
400 individuals.
In 1988, the population reached the same density as before the rabies outbreak. The red
fox population continued to grow until it reached a population plateau in the mid-
1990s. Furthermore, fox abundance subsequently experienced a two-fold increase
following the progressive elimination of rabies. Indeed, this observation is consistent
with the general trend of a current high abundance of red foxes in Switzerland
(Breitenmoser, unpublished data) and Europe (reviewed in Chautan et al. 2000).
Moreover, this highlights the mounting potential of re-infection of rabies or infection
o f other zoonoses (Chautan et al. 2000).
Finally, it is important to emphasise, that although the study area was unaffected by the
first rabies wave between 1968-70, the red fox population studied was nonetheless
subject to population control measures such as gassing of dens (until 1972) and high
hunting pressure. Therefore, the population dynamic and the pre-rabies data on
population demography and genetic might have been altered by human interventions
and do not precisely reflect an altogether rabies unbiased population structure.
Demography and age structure
The observed age distribution changed significantly over time. The high rabies-
induced mortality alongside human intervention in 1975, lead to a significant reduction
in adult average age and an increase in the proportion of juveniles in the subsequent
decade. Moreover, the age distribution continued to change after reaching pre-rabies
density. Given the age distribution before the rabies infection, only a small number of
adult animals older than three years would have survived the epizootic. Indeed, no
individual older than five years was found between 1976 and 1985.
70

CHAPTER 4
Following the observed reduction of population size, an increased reproduction could
have compensated for the observed losses and could have consequently advanced the
long-term population growth. The reproduction of fox populations depends on litter
size and the proportion of adult females reproducing, while female productivity can
differ between areas and, where food availability cycles, between years (Macdonald &
Voigt 1985). Nonetheless, whether litter size increases in a reduced fox population is
controversial. No difference in the mean number of litter sizes, by counting placental
scars between rabies-endemic and rabies-free areas, has been found (Wandeler et al.
1974, Vos 1994). In contrast, Funk (1994) revealed a significant increase in litter size,
defined as counted cubs at the den, following a rabies outbreak.
The proportion of barren females and, in particular, the postponement of reproduction
by subordinate and younger females (Macdonald 1979, reviewed in Cavallini 1996), is
thought to be density-dependent (Englund 1980, Macdonald 1980). The red fox social
structure varies from monogamous pairs to small to medium-sized groups, while
groups consist o f a dominant breeding pair and one or more subdominant females
(Cavallini 1996, but see Baker et al. 1998). Furthermore, Baker et al. (2000) revealed a
decline in group size following a mange epizootic in an urban fox population. It can
thus be assumed that following the first rabies infection most animals, which survived
the epizootic, could have indeed reproduced in the following years. In contrast, a
significant portion of subordinate and younger females are likely not to have
reproduced before 1975 and, in particular, subsequent to the population growth since
the mid-1980s (Vos 1995). Despite the broad range of data available for female
productivity, in relation to population density, ecological factors and social status, little
is known about male reproductive success.
Combining the results of the observed age distribution and the variance of female
reproduction in relation to population density and to the rabies epidemic, the average
generation time was not constant over time. Therefore, a considerable shorter
generation time subsequent to the rabies infection could be expected.
Alongside the observed and expected temporal changes in mortality and reproduction,
the rabies epizootic may also have affected dispersal patterns. In this context, an area
with a transiently disease-induced high mortality could act as a ‘sink’, whereas the
71

CHAPTER 4
‘source’ is an area with no or little mortality (Artois et al. 1990, Zimen 1984). Thus,
the rabies-affected population studied should consist of a mixture of resident survivors
and predominantly juvenile immigrants (Harris 1977). Furthermore, the overall
expected sex ratio should be male-biased based on the assumption that males in red
foxes are in general the more dispersive sex (reviewed in Trewhella et al. 1988,
Chapter 3). Although the observed juvenile ratio was high subsequent to the rabies-
induced population reduction, the data collected do not allow us to distinguish between
immigration and, as previously discussed, changes in mortality rates and reproduction.
Nonetheless, the higher proportion of males observed in the mid-1980s might indicate
some immigration into the study area.
Population genetics
The DNA extracted from the historic tooth samples was poor in terms of quality (DNA
degeneration) and quantity, which further decreased with storage time (Chapter 1).
Consequently, one third of all extracts, with a bias towards older samples, was not
suitable for microsatellite genotyping due to the estimated insufficient DNA
concentration (<5pg//il, Morin et al. 2001; Chapter 1). Furthermore, because of the
highly degenerated DNA observed, only loci with a maximum of 170 bps in fragment -
size could be amplified by PCR. Thus, the operational range o f the ABI Prism® 377
sequencer was limited to less than 100 bps (78-172 bps). Therefore, only between two
and three loci could simultaneously be electrophoretically separated and analysed.
Knowledge of the accurate age of each genotyped individual allowed us to assign each
sample to its year of birth. This approach was preferred to sorting the samples into
years o f delivery, because by doing so, changes in genetic diversity could be
immediately detected. In contrast, each individual was represented in one annual
sample only. Thus, differences in reproductive success across individuals, which can
be expected to correlate with sample age, were not considered. Sorting individual
samples by age of birth, improved the sample distribution significantly over time, yet
resulted in small annual sample sizes.
In contrast to the temporal age distribution, no evidence was found for the alteration of
the genetic population structure during the rabies-induced demographic bottleneck and
the subsequent population growth. The following three interpretations might help to
explain the observed results.
72
CHAPTER 4
Firstly, because the transmission of rabies in a red fox population is density-dependent,
the disease is unable to persist at a given density threshold within a population
(Anderson et al. 1981). Therefore, a certain number of foxes should have survived
rabies. Although the red fox population size in the study area was considerably
reduced as revealed by the roadkill records, the effective local population size (Ne),
based upon the non-infected individuals by rabies, remained sufficiently large to
maintain the pre-rabies genetic diversity. Subsequent to the demographic bottleneck,
the high reproductive potential of red foxes and the resulting population recovery
prevented further genetic drift over time. Similar results were observed in a natural
rabbit population reduced by the rabbit viral haemorraghic disease (Queney et al.
2000). Despite the estimated high mortality o f 88-99% no loss o f genetic diversity was
detected following the bottleneck by comparing the genetic diversity over time; this
was due to the sufficiently large remnant population size and a fast population
recovery (Queney et al. 2000).
Secondly, immigration could have prevented the lasting effects of a genetic bottleneck.
As previously discussed, the high rabies-induced mortality might have acted as a
demographic ‘sink’. Thus, dispersing and predominantly juvenile foxes could have
moved into the rabies-affected study area following the infection. The importance of
immigration for rescue of a small and inbred wolf population Canis lupus was reported
by Vila et al. (2003). Further, the ephemerality o f a natural demographic bottleneck,
which was caused by a severe winter storm in an insular population of song sparrows
Melospiza melodia, was demonstrated by Keller et al. (2001). While the genetic
diversity had declined after the demographic bottleneck, the genetic diversity regained
pre-bottleneck levels within three years ( » one generation) of the crash due to
migration (Keller et al. 2001). In the present study, historic samples were only
available for one year (1978) out of five years subsequent to the rabies-induced
population decline. Therefore a potential short-term genetic bottleneck might not have
been noticed. However, this is dependent upon the assumption that the rabies epizootic
caused a temporal heterogeneous distribution of mortality across the whole region to
create demographic ‘sinks’ and ‘sources’. Successful immigration might also be
reflected by the observed negative F\$ - values during the most significant period of
population growth in the mid-1980s.
73

CHAPTER 4
Thirdly, the red fox is a habitat generalist (Macdonald 1980), with an area-wide
distribution in Switzerland up to 2500m altitude (Wandeler 1995). Despite being
partially enclosed by two rivers, the examined red fox population might represent only
a portion of the regional population rather than an isolated part. Hence, although the
rabies epizootic swept throughout the whole region and reduced the red fox density
substantially, the regional Ne can be expected to have remained sufficiently large
enough to have maintained all the genetic diversity existing before the rabies epizootic.
Assuming a continuous red fox population and a spatial genetic structure following an
isolation-by-distance pattern (Chapter 3, Chapter 5), dispersal should have obscured
local deficits in genetic diversity within a few generations. In fact, the spatial genetic
structure of red foxes in Switzerland can be expected to be only moderately
differentiated (Chapter 5, but see Wandeler et al. 2003a).
Although no clear long-term trends in genetic diversity were detected, variation in
annual estimations of Ho, He, F\$ was found both short-term and longer-term. In
particular, annual Fis - estimates varied considerably. Moreover this variation could be
observed, when annual estimations were calculated based on samples pooled over
three years. This result contradicts therefore studies which inferred general levels of
genetic diversity and population inbreeding from temporal point-estimates.
Detecting losses of genetic diversity following a demographic bottleneck by using
historic samples proves in general to be difficult. For example, Nielsen et al. (1999a)
described the temporal population genetics in Atlantic salmon Salmo salar, but found
the genetic diversity to be unaffected over time. Similar results were found for the
European otter Luttra luttra (see Pertoldi et al. 2001) and Scandinavian wolverine
Gulo gulo (see Walker et al. 2001). In both studies the historic samples did not show
higher levels of genetic variability compared to contemporary samples, despite a
significant reduction of population size in both species over the last century. In
contrast, declines in genetic variation in the Greater Prairie chicken Tympanuchus
cupido (see Bouzat et al. 1998), Mauritius kestrel Falco punctatus (see Groombridge
et al. 2000) and sea otter Enhydra lutris (see Larson et al. 2002) were revealed by
comparing pre- and post-bottleneck genetic diversity.
74

CHAPTER 4
The overall European red fox population and the studied population are thought to
have experienced long-term population growth due to an increased carrying capacity
independent from the recent rabies epizootic {reviewed in Chautan et a l 2000).
Although the rabies-induced effects on the population dynamics and demography are
evident in the earlier years following the first infection in 1975, the effects might have
been much less evident in the long-term. Although no apparent temporal genetic effect
could be revealed in relation to the rabies-induced demographic bottleneck, all four
population genetic estimates and in particular the Fis - values showed considerable
variation over time (Figure 3). However, red fox social structure is very variable,
ranging from a monogamous pair at lower population size to complex family groups at
higher densities (Cavallini 1996). Therefore, this variation observed might be caused
by the six-fold increase in population size and its effect on the red fox social structure,
rather than by the initially expected consequences of the rabies-induced demographic
bottleneck.
75

CHAPTER 5
Density-Dependent Dispersal in a Continuous Red
Fox Population with Changing Density.
AbstractDispersal and effective population size (Ne) are fundamental parameters of ecological
and evolutionary processes. Whilst a growing number of studies have addressed the
effects of demographic heterogeneities over time on Ne (e.g. bottlenecks), much less is
known about such effects on dispersal and the resulting genetic structure within and
between populations. In this study, the spatio-temporal genetic structure was assessed
for a red fox (Vulpes vulpes) population in Switzerland during an estimated two to
threefold density increase following a rabies epizootic. Under isolation-by-distance
(IBD), the balance between gene dispersal and effective population density defines the
level of local genetic drift in a continuous population and therefore its spatial genetic
structure. Moreover, theoretical and empirical studies predict a negative correlation
between dispersal and population density in red foxes. To assess the effects of an
increasing density on the spatial genetic structure in a natural population, microsatellite
data (nine loci) for three distinct time periods (1971-73; 1982-84, and 2001-03)
representing ten to fourteen generations, were collected in a 4189km2 Alpine area
using historic tooth (n = 214) and recent tissue samples (n = 118). Individual samples
were collected in topographically distinct sampling sites within the study area.
Although allele frequencies between time periods (1971-73 vs. 1982-84 and 1982-84
vs. 2001-03 were significantly different, the observed level of temporal genetic
differentiation was small (Fst: 0.009 ± 0.013 and 0.005 ± 0.007, respectively).
Significant IBD was revealed when pairwise relatedness and spatial distances between
individual samples were compared for the time periods 1982-84 and 2001-03 whilst a
lower level of genetic structure was observed for the period 1971-73. Similarly,
temporal discrepancies were reflected by global F st - values calculated across
sampling sites for each time period (1971-73: 0.002 ± 0.013; 1982-84: 0.008 ± 0.010;
2001-03: 0.012 ± 0.009). Furthermore, inferring gene dispersal distances for the three
sampling periods confirmed the predictions of negative density-dependent dispersal.
76
CHAPTER 5
Introduction
Effective population size (Ne) and dispersal are important parameters in evolutionary
processes (e.g. Leblois et al. 2003). Ne determines rates of loss or maintenance of
genetic variation, selection efficiency, inbreeding and inbreeding depression, while
dispersal and the resulting gene flow counteracts local adaptation and genetic drift (e.g.
Wright 1977, Hartl & Clark 1977). However, both demographic parameters are subject
to spatial and in particular temporal heterogeneities and, therefore, are often not
constant over space and time. In conservation, demographic bottlenecks are expected
to reduce levels of genetic variation (Nei et al. 1975) and, if Ne is maintained at a small
size over a long period, higher levels of inbreeding may result, which in turn might
result in inbreeding depression leading to a reduction in fitness (Keller & Waller
2002). In contrast, dispersal between small populations can increase meta-population
size and reduce the effects of inbreeding and loss of genetic variability (e.g. Keller et
al. 2001; Vila et al. 2003).
Several population genetic methods allow the estimation of the variance Ne based on
neutral genetic markers (reviewed in Schwarz et al. 1998, Beaumont 2003). One
method of inferring demographic history employs population genetic theory that
relates the structure of allelic genealogies observed in recent samples to historical
changes in Ne (Beaumont 1999, Storz & Beaumont 2002). In addition, Ne o f a
population can be inferred based on temporal changes o f neutral allele frequencies
between samples of populations collected at different time intervals (e.g. Berthier et al.
2002, Wang 2001, Wang & Whitlock 2003, Tallmon et al. 2004). In this context,
historic samples from museums can serve as a valuable source of reference (Bouzat et
al. 1998).
It has been noted that the usefulness and practicality of historic samples for population
genetic studies are often restricted by inadequate sampling and DNA quality (Nielsen
1999a, Chapter 1). Historic collections were often not conducted for the purpose of a
population genetic study and, therefore, often lack adequate individual sampling
information (e.g. age, sex, accurate data on sampling site) and sample size (Nielsen
1999a, Chapter 1). In addition, DNA degrades over time (reviewed in Lindahl 1993,
Chapter 1). As a consequence, extracted DNA is not only highly degraded but also
77
CHAPTER 5
highly diluted and can be contaminated (Chapter 1). Therefore, reliable genotyping
from historic samples is particularly difficult (Taberlet et al. 1996, Hoss 2000, Chapter
1). Despite these issues, the use of archival DNA samples in population genetic studies
has increased recently using mitochondrial DNA markers (e.g. Pichler & Baker 2000,
Matocq & Villablanca 2001) and nuclear DNA markers (Bouzat et al. 1998, Nielsen et
al 1999a, Groombridge et al. 2000, Pertoldi et al. 2001, Walker et al. 2001, Larson et
al. 2002, Miller & Waits 2003).
Environmental conditions such as habitat quality, social and demographic structures
and population density, can induce dispersal of species (reviewed in Ims & Hjermann
2001). In particular, several empirical studies suggest that for many species dispersal
rate depends on local population density and can be positively or negatively-density
dependent (for references see Travis et al. 1999). Negative density-dependent effects
on dispersal, in which a smaller fraction of individuals disperse at higher density, can
be expected in territorial animals (reviewed in Wolff 1997). According to theoretical
model territoriality can suppress migration by increasing costs of emigration due to the
social fence of aggressive and territorial individuals. In this context, dispersal distances
should experience the least resistance and lowest cost and thus should be smaller at
higher density (from Wolff 1997).
Several studies have estimated dispersal rates in natural populations based on direct
demographic methods (e.g. capture-mark-recapture and radio-telemetry; reviewed in
Bennetts et al. 2001) and indirect population genetic methods (e.g. Rousset 2001,
Chapter 2). However, discrepancies between indirect and direct estimations have often
been attributed to the general inadequacy of the assumptions of genetic models such as
the Wright-Fisher population model and the violation of the assumption of
demographic stability in time and space (Leblois et al. 2003, 2004).
Restricted dispersal in space, together with local genetic drift, leads to genetic
differentiation with increasing spatial distance as described by the theory of isolation-
by-distance (IBD; e.g. Wright 1943, Rousset 1997). A substantial number of studies
assessed IBD by comparing the genetic and spatial distance between populations (e.g.
Slatkin 1993, Rueness et al. 2003). More recently, restricted dispersal has also been
demonstrated for a number of species in a continuous population using individual
78

CHAPTER 5
based genetic and geographic data (for animals see: e.g. Rousset 2000, Spong & Creel
2001, Sumner et al. 2001; Chapter 2; for a review of plants see: Vekemans & Hardy
2004).
Following Wright (1943), models of IBD consider ‘neighbourhood size’ (NS) as the
basic unit o f population structure. Although the biological significance of NS is often
difficult to assess and even misleading (e.g. Rousset 1997), NS is a convenient way to
express the balance between genetic drift and gene dispersal (Vekemans & Hardy
2004). In a continuous population NS can be calculated as the inverse of the regression
slope (blog) between genetic and spatial distances (Rousset 1997, 2000). NS equals the
product of 4 tzDo2, where D is the effective population density and o2 a measure for
gene dispersal, the average squared parent-offspring distance (for details see Chapter 2,
Sumner et al. 2001). In an growing population (increasing D) but with constant gene
dispersal cr, NS will increase representing a lower level of spatial genetic
differentiation (flatter regression slope). In contrast, NS will remain unchanged if a
shorter average dispersal distance can keep the product of Dc? constant. Investigating
the population genetic structure at a local scale has the additional advantage that
mutation processes and the potential non-neutrality of the genetic markers applied
have little or no effect on the estimation of the product D o2 (Rousset 2000, Leblois et
al. 2003). Although some empirical studies have described spatial genetic
differentiation across natural populations for different time periods (e.g. Nielsen et al
1999a, Tessier & Bematchez 1999, Pertoldi et al. 2001), so far and to the best of my
knowledge, no study investigated temporal changes in spatial genetic structure within
populations.
Here I present the first empirical study which describes the spatial genetic structure of
a continuous natural population for different time periods. The study investigated the
genetic structure of an increasing red fox population in the Swiss Alps, following the
recovery of a rabies epizootic.
With an area-wide distribution of up to 2500m altitude in Switzerland, the red fox is a
habitat generalist (Wandeler 1995, Macdonald 1980). For that reason, the red fox
represents a good example of a territorial species with a continuous population
distribution. By comparing pairwise genetic and spatial distances of individual fox
79
CHAPTER 5
dyads, IBD pattern was found in a red fox population in the Swiss Alps (Chapter 2).
Moreover, dispersal was male biased and dispersal was shown being affected by
topography (Chapter 2). A review of capture-mark-recapture studies in different
habitats demonstrated that red fox dispersal distances is density-dependent, based on a
negative correlation found between the recovery distance of tagged foxes and
estimated population density (Trewhella et al. 1988). However, exceptions from this
general rule have also been reported (Funk 1994).
The current silvatic rabies epizootic in Europe started in Poland in 1939, spread
westwards and reached Switzerland in 1967 (Macdonald 1980). The red fox is the
main vector of this epizootic (Steck & Wandeler 1980). After 1967, rabies swept
throughout Switzerland before the disease was successfully eliminated by oral wildlife
vaccination in 1999 (Kappeler 1991, Breitenmoser et al. 2000, Chapter 3). After the
cessation of rabies as a substantial mortality factor, the population density increased.
This increase in population density appears to follow a long-term increase o f red fox
carrying capacity (Breitenmoser unpublished, Chautan et a l 2000). Throughout the
rabies epizootic, the disease was monitored by sampling fox carcasses across
Switzerland. Consequently, a large set of post-mortem and epidemiological data along
an extensive collection of individual tooth samples were compiled over the last three
decades (for details see Chapter 2, Chapter 3). Depending on their initial population
density, red fox populations can be severely reduced by rabies (Anderson et al. 1981,
Bogel et al. 1974, Chapter 3). Whilst this reduction of population size and density can
change the age structure of a population, the genetic variation might remain unaffected
(Chapter 3). Dispersal in foxes affects the rate o f the spread of rabies (Wandeler et al.
1974). Consequently, research on red fox dispersal has been the subject o f several field
(reviewed in Chautan et al. 2000) and simulation studies (Artois et al. 1997,
Tischendorf et al. 1998).
The objective of this study was to assess the spatial and temporal genetic structure of a
Alpine red fox population in Switzerland over three decades following significant
changes in population density, induced by the arrival and the eradication of rabies. The
genetic structure of a continuous population for three distinct time periods (1971-73,
1982-84 and 2001-03) was assessed based on microsatellite data from historic tooth
and recent tissue samples.
80

CHAPTER 5
M a te r ia l a n d M eth o d s
Study area and sampling
The study area was situated in the Eastern Alps of Switzerland (Canton Grisons),
identical with the study area from Chapter 2. Unlike in Chapter 2, sampling was
restricted to five distinct sites (160 - 693km2) representing 50.4% of the total study
area (GRm and GI%; Figure 1).
D 1971-73
A 1982-84
• 2001-02
Figure 1 Red fox sampling sites in the study (dash line; Canton Grisons) and control area (solid line; Canton Uri) in Switzerland. Shown are individual sampling locations (boroughs) for three time periods. Grey scale refers gradually to the elevation (low altitude = white; high altitude = dark-grey). Note that one symbol might represent several individuals from the same period and sampling location.
Fox samples were chosen for three short time periods: early rabies (1971-73) late
rabies (1982-84) and post rabies (2001-03; Figure 2). Fox samples from 1971-73 and
1982-84 derived from a large collection of historic teeth samples collected throughout
Switzerland following the last rabies epizootic (for details see Chapter 1, Chapter 3).
No historic samples were available for sampling site GR6 and time period 1982-84. For
81

CHAPTER 5
time period 2001-03, local hunting authorities provided tissue samples (Chapter 2). In
addition, historic and recent samples for the same time periods were included from an
adjacent control area (URo; Canton Uri) that was not affected by rabies. Data on sex,
individual sampling location (local borough name) and results from rabies virus tests
were available for all collected foxes.
<o0</)8w0
2T 30f80£T
250 - r
200 -
150 -
-r 0 .6
100
Icar—»»
3CD
5'CL<DX
CDCl
OX•OCO—1
3NJ
Figure 2 Dynamic of an Alpine red fox population (Canton Grisons; Switzerland) in relation to rabies over the last sixty years. Shown are the annual numbers km*2 of foxes killed by hunting (black line) and the total number of recorded rabid foxes (grey bars). Triangles represent years of sampling (time periods). Note that due to the rabies epizootic the hunting pressure was likely higher between the years 1966 and ca. 1980.
Laboratory work
DNA was extracted from historic tooth samples using silica-based spin columns
(QIAquick® - PCR purification kits, Qiagen; Yang et al. 1998). The whole canine
tooth or the tooth crown only was pulverized in a steel mortar. After decalcification
(EDTA, 0.5M, pH 8.0) and digestion (proteinase K), DNA was bound to the silica
membrane by vacuuming the supernatant through a QIAquick column. Subsequently,
the extracted DNA was purified and eluted in 150pL H2O (for details see Chapter 1).
DNA from recent samples (2001-03) was extracted from muscle tissue by using a
Wizard® SV96 Genomic DNA extraction kit (PROMEG A) following the
manufacturer’s protocol and subsequently eluted in 400pL H20.
82

CHAPTER 5
Based on previous results of the PCR amplification success-rate of microsatellite loci
in historic extracts (Chapter 1 and Chapter 3), four canine (AHT-130, Holmes et a l
1995; CXX-156, CXX-279, Ostrander et a l 1993; CXX-466, Ostrander et a l 1995)
and five re-designed red fox specific microsatellites (V142, V374, V402, V468, V502,
Chapter 1) were used. Up to three loci were co-amplified using the Qiagen PCR
multiplex kit. PCR conditions were identical with the conditions described in Chapter
3. Amplified products were electrophoretically separated using an ABI Prism® 377
DNA sequencer (ABI). Subsequently, allele sizes were scored against the size standardTM TM Til
GS350 Tamra (ABI) using GENESCAN Analysis and GENOTYPER software.
Unlike in Chapter 3, no estimation of DNA concentration by a quantitative PCR was
performed for the historic tooth extracts. Thus, the selection of samples suitable for
reliable genotyping was carried out as follows: All historic tooth extracts were
independently pre-screened in a multiplex PCR twice by simultaneously amplifying
three different microsatellite loci in fragment size (V468, CXX-279 and V I42). For
further genotyping, only extracts with a 6 6 % or a higher PCR success-rate across loci
and amplification were chosen. All heterozygote genotypes were independently and
successfully amplified at least twice. Potential homozygote genotypes for the historic
samples from 1971-73 and 1982-84 were successfully amplified for at least four and
three times, respectively based on previous experiences (Chapter 1, Chapter 3). Special
care was taken to avoid cross-contamination and contamination with contemporary
DNA. Consequently, historic DNA extraction and PCR preparation were performed
within a spatially isolated laboratory dedicated for working with low-copy DNA.
Population genetic analyses
Single and multi-locus genetic diversity (H e, Nei 1987; mean ± SD, jackknifed over
loci) for all sampling sites (GRm, GR6 and URo) and for all three time periods (1971-
73, 1982-84 and 2001-03) were calculated in GENEPOP, v3.1 (Raymond & Rousset
1995b). Using the same software package, global / / E, observed heterozygosity (Ho),
and inbreeding coefficient (Fis; Weir & Cockerham 1984) across all samples (mean ±
SD, jackknifed across loci) for each of the three time periods were computed.
Additionally, single-locus deviation from Hardy-Weinberg equilibrium was tested for
the three time periods separately (probability-test in GENEPOP). Subsequently, single-
83

CHAPTER 5
locus probability-values were combined according Fisher’s method (Sokal & Rolf
1995).
The distribution o f allele frequencies for each time period across sampling sites (GRm
and GR6) was assessed using the genic differentiation test (Raymond & Rousset
1995a) implemented in GENEPOP (Raymond & Rousset 1995b). To estimate the
spatial genetic differentiation for each period, global single-locus Fst-'values were
calculated across sampling sites and subsequently averaged across loci (mean ± SD,
jackknifed over loci). No historic samples were available for sampling site GR6 in
1982-84, and therefore analyses were repeated for the time periods 1971-73 and 2001-
03 by excluding site GR6 . Finally, single-locus Fsr-values for each time period (1971-
73 vs. 1982-84; 1971-73 vs. 2001-03; 1982-84 vs. 2001-03) were compared using a
Wilcoxon sign-rank test.
The temporal genetic differentiation ( F s t ) between 1971-73 and 1982-84 and 1982-84
and 2001-03, respectively, was estimated for the whole study area. Pairwise single
locus Fst- values for each of the four sampling sites GR1-4 were calculated and
subsequently averaged (mean ± SD, jackknifed over loci) across sampling sites and
loci. In addition, the allelic distribution between 1971-73 and 1982-84 and 1982-84
and 2001-03, respectively, was assessed for each sampling site (GR1-4; genic
differentiation test; Raymond & Rousset 1995a). Finally, for each of the two temporal
comparisons the probability-values across sampling sites were combined according to
Fisher’s method (Sokal & Rolf 1995)
Global multi-locus values for He, Ho and Fis (mean ± SD, jackknifed over loci) across
the three time periods were calculated for the control area (UR) using GENEPOP
(Raymond & Rousset 1995b). In addition, allelic distributions (genic differentiation
test) and global F s t - values across loci and the three time periods were calculated.
No temporal difference in allelic distribution (genic differentiation test) was revealed
for the control area (UR) across sampling periods (see results section). Consequently,
all samples from the control area were pooled irrespective of sampling period for
subsequent analyses. Pairwise genetic differentiation and allelic distribution (genic
differentiation test) was assessed between each sampling site of the study area and the
84
CHAPTER 5
control area. For each of the three time periods, computed F st - values were averaged
across sampling sites and loci (mean ± SD, jackknifed over loci). Single-locus
probability-values for the genic differentiation test were combined across sites and loci
(Fisher’s method). Analyses were repeated for the two periods 1971-73 and 1982-84
by excluding site GR6.
Finally, critical significance levels were adjusted for multiple testing by Bonferroni
corrections (Rice 1989).
Individual based IBD analyses
For the study area (G R u and GR6) and each time period, pairwise spatial distances
between individual locations were computed in a Geographic Information System
(GIS; ArcView; ESRI 1996a-c)7. Because precise data for individual geographic
sampling locations for the time period 1971-73 were not available, spatial analyses for
all time periods were computed based on administrative community (borough) data.
Therefore, the geographic location of an individual sample was approximated by the
location (XY-coordinates) of the borough’s church tower. Previous results
demonstrated that the topographic structure of a landscape could alter the fine-scale
spatial genetic structure of red foxes (Chapter 2). Therefore, two different spatial
distance matrixes for each of the three time periods were computed. The first matrix
represented pairwise Euclidian distances between individuals. The second matrix was
computed in a cost-ffiction analysis. A cost-surface was generated based on an
elevation model (MONA, GEOSYS) across the study area and a geographic distance
(least cost distance) between individual locations was calculated restricted to areas
below an altitude of 1400m. By doing so, pairwise spatial distances between
individuals were calculated around rather than across mountain ridges (for details see
Chapter 2).
Pairwise relatedness was estimated using Wang’s (2002) Rw - estimator. For
computing Fw - values, the expected allele frequencies were calculated across all
individuals (study area) for each of the three time periods. To account for imprecision
in the geographic origin of the samples, pairwise genetic and spatial data for
individuals representing the same borough were excluded from further analyses. For
7 GIS analyses were computed by Fridolin Zimmermann, Bern, CH and PW.
85
CHAPTER 5
each sampling period, the slope (blog - values; inverse of NS) was computed. IBD was
tested by assessing the significance of the regression slope between the genetic matrix
and each of the two logarithmic transformed spatial matrixes for each of the three time
periods in a Mantel test (10,000 permutations of spatial location). Mean relatedness for
five a priori defined and by the natural logarithm transformed distance categories
(<8956m, 8956m - 16317m, 16318m - 29733m, 29734m - 54176m and >54176m,
1400m-altitude threshold matrix) were computed for each time period. SE were
calculated by jackknifing over loci. All spatial genetic analyses were performed using
the software SPAGEDI (Hardy & Vekemans 2002). Finally, average parent-offspring
distances (o) were assessed for each of the three time periods based on an initial
effective population density (D) of 0.87 individual*km‘2 for the sampling period 2001-
03 (for details see Chapter 2). To account for lower historic population density, two
independent <r estimations were performed for the sampling periods 1971-73 and'y
1982-84 based on densities of 0.435 and 0.290 individual*km' representing an
assumed population increase of two and three times, respectively.
Results
Microsatellite genotyping
The genomic DNA of 262 and 125 historic tooth samples from the time periods 1971-
73 and 1982-84, respectively, was extracted. After pre-screening, 107 (40.8%; 1971-
73) and 97 (77.6%; 1982-84) extracts were selected for further genotyping (Table 1).
Independent PCR amplifications for hetero- and homozygote genotypes were (± SD,
jackknifed over loci) 3.88 ± 0.50 and 4.64 ± 0.37 times (1971-73) and 3.04 ± 0.17 and
3.66 ± 0.45 times (1982-84), respectively. Total success-rate of genotyping across loci
and all historic samples was 87.3% and varied across loci between 72.5% for CXX-
466 and 99.5% for V486 and V502 (Table 2, Table 3). A strong correlation between
genotyping success-rate and maximal microsatellite ffagment-size was found (r = -
0.98, n = 9). Finally, a total of 118 tissue samples were extracted and subsequently
genotyped, of which 90 (76.3%) samples were also used in Chapter 2.
86
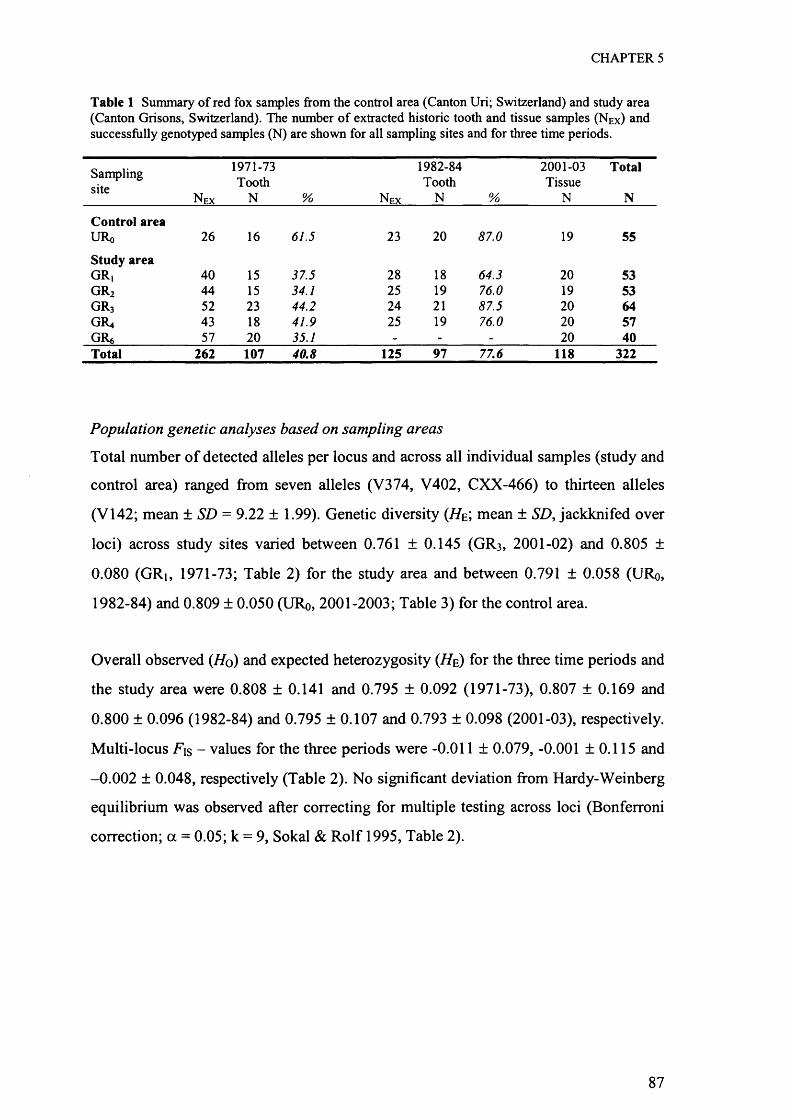
CHAPTER 5
Table 1 Summary of red fox samples from the control area (Canton Uri; Switzerland) and study area (Canton Grisons, Switzerland). The number o f extracted historic tooth and tissue samples (NEX) and successfully genotyped samples (N) are shown for all sampling sites and for three time periods.
Samplingsite
N ex
1971-73Tooth
N % N ex
1982-84Tooth
N %
2001-03Tissue
N
Total
N
Control areaURo 26 16 61.5 23 20 87.0 19 55
Study areaGR, 40 15 37.5 28 18 64.3 20 53g r 2 44 15 34.1 25 19 76.0 19 53g r 3 52 23 44.2 24 21 87.5 20 64GR* 43 18 41.9 25 19 76.0 20 57GR* 57 20 35.1 - - - 20 40Total 262 107 40.8 125 97 77.6 118 322
Population genetic analyses based on sampling areas
Total number of detected alleles per locus and across all individual samples (study and
control area) ranged from seven alleles (V374, V402, CXX-466) to thirteen alleles
(V I42; mean ± SD = 9.22 ± 1.99). Genetic diversity ( H e , mean ± SD, jackknifed over
loci) across study sites varied between 0.761 ± 0.145 (GR3, 2001-02) and 0.805 ±
0.080 (GRi, 1971-73; Table 2) for the study area and between 0.791 ± 0.058 (URo,
1982-84) and 0.809 ± 0.050 (URo, 2001-2003; Table 3) for the control area.
Overall observed ( H o ) and expected heterozygosity ( H e ) for the three time periods and
the study area were 0.808 ± 0.141 and 0.795 ± 0.092 (1971-73), 0.807 ± 0.169 and
0.800 ± 0.096 (1982-84) and 0.795 ± 0.107 and 0.793 ± 0.098 (2001-03), respectively.
Multi-locus Fis - values for the three periods were -0.011 ± 0.079, -0.001 ± 0.115 and
-0.002 ± 0.048, respectively (Table 2). No significant deviation from Hardy-Weinberg
equilibrium was observed after correcting for multiple testing across loci (Bonferroni
correction; a = 0.05; k = 9, Sokal & Rolf 1995, Table 2).
87

Table 2 Measures o f genetic diversity for nine microsatellite in red foxes (study area, Canton Grisons; Switzerland) across five sampling sites (GR1 - GR4, GR6) and three time periods. For each of the three periods and sites single-locus estimates of the number of individual genotypes ( N Gt) , genetic diversity (//E; Nei 1987) are shown. In addition, for each period N Gt , He, observed heterozygosity (H0), allelic diversity {A), inbreeding coefficients (P is ; Weir and Cockerham 1984) and p-value for the probability of Hardy-Weinberg deviation across all samples are summarized. The summary statistics shows multi-locus means and SD jackknifed over loci.
Microsatellie
1971-73N q j
GR,He
n=15N q j
g r 2He
n=15Hgi
g r 3He
n=23N q j
GR«He
n=18H q j
GR*He
n=20Mgt %
n=91
All individual samples A H0 He F i S P3
AHT-130 11 0.844 14 0.762 19 0.829 11 0.874 17 0.811 72 79.1 9 0.861 0.815 -0.057 0.309V142 8 0.875 11 0.874 20 0.891 13 0.889 14 0.907 66 72.5 13 0.939 0.893 -0.053 0.018CXX-156 8 0.842 11 0.836 21 0.812 13 0.742 15 0.844 68 74.7 10 0.824 0.819 -0.006 0.801CXX-279 11 0.810 11 0.857 22 0.818 13 0.834 14 0.780 71 78.0 10 0.831 0.828 -0.004 0.392V374 11 0.853 13 0.843 22 0.802 15 0.811 18 0.783 79 86.8 6 0.810 0.821 0.014 0.192V402 14 0.762 15 0.832 23 0.794 18 0.816 20 0.826 90 98.9 7 0.811 0.818 0.008 0.276CXX-466 9 0.745 12 0.743 18 0.773 10 0.747 12 0.685 61 67.0 6 0.770 0.734 -0.050 0.209V486 14 0.868 15 0.814 23 0.788 18 0.822 20 0.829 90 98.9 9 0.911 0.828 -0.101 0.389V502 14 0.646 15 0.639 23 0.572 18 0.592 20 0.603 90 98.9 9 0.511 0.603 0.153 0.169mean 11.1 0.805 13.0 0.800 21.2 0.787 14.3 0.792 16.7 0.785 76.3 83.9 8.78 0.808 0.795 -0.011 0.077bSD 0.080 0.079 0.102 0.097 0.096 2.31 0.141 0.092 0.0791982-84 n=18 n=19 n=21 n=19 n=77AHT-130 17 0.783 18 0.835 21 0.829 19 0.791 75 97.4 10 0.893 0.820 -0.090 0.186V142 13 0.868 16 0.897 20 0.868 17 0.875 66 85.7 11 0.879 0.882 0.004 0.711CXX-156 13 0.840 14 0.847 19 0.845 16 0.831 62 80.5 11 0.871 0.839 -0.038 0.504CXX-279 16 0.887 15 0.814 19 0.787 19 0.846 69 89.6 10 0.899 0.840 -0.070 0.151V374 16 0.710 19 0.794 20 0.836 18 0.800 73 94.8 7 0.795 0.792 -0.003 0.067V402 18 0.816 19 0.825 21 0.846 19 0.852 77 100.0 7 0.844 0.839 -0.007 0.076CXX-466 14 0.802 14 0.791 17 0.783 16 0.794 61 79.2 7 0.820 0.788 -0.041 0.171V486 18 0.803 19 0.727 21 0.765 19 0.822 77 100.0 9 0.805 0.799 -0.007 0.240V502 18 0.673 19 0.639 21 0.617 19 0.437 77 100.0 7 0.455 0.597 0.240 0.007mean 15.9 0.798 17.0 0.796 19.9 0.797 18.0 0.783 70.8 91.9 8.78 0.807 0.800 -0.001 0.007bSD 0.072 0.080 0.086 0.170 1.80 0.169 0.096 0.1152001-2003 n=20 n=19 n=20 n=20 n=20 n=99AHT-130 20 0.850 19 0.789 20 0.764 20 0.846 20 0.781 99 100 10 0.869 0.810 -0.073 0.514V142 20 0.872 19 0.896 20 0.876 20 0.873 20 0.878 99 100 12 0.919 0.885 -0.039 0.657CXX-156 20 0.851 19 0.832 20 0.801 20 0.831 20 0.821 99 100 9 0.778 0.827 0.060 0.373CXX-279 20 0.835 19 0.782 20 0.753 20 0.803 20 0.887 99 100 9 0.788 0.824 0.044 0.079V374 20 0.753 19 0.794 20 0.785 20 0.812 20 0.799 99 100 6 0.818 0.785 -0.043 0.242V402 20 0.812 19 0.782 20 0.778 20 0.846 20 0.835 99 100 7 0.778 0.819 0.051 0.208CXX-466 20 0.749 19 0.694 20 0.764 20 0.801 20 0.719 99 100 8 0.758 0.755 -0.004 0.399V486 20 0.799 19 0.851 20 0.874 20 0.779 20 0.856 99 100 9 0.869 0.844 -0.030 0.453V502 20 0.705 19 0.617 20 0.455 20 0.546 20 0.556 99 100 8 0.576 0.587 0.019 0.777mean 20.0 0.803 19.0 0.782 20.0 0.761 20.0 0.793 20.0 0.792 99.0 100 8.67 0.795 0.793 -0.002 0.383bSD 0.058 0.087 0.145 0.118 0.113 m 9,107 Q,Q?8 0.048
oo ap- value (probability -test; Raymond & Rousset 1995b); combinedp-value after Fisher’s methods
CHAPTER
5

CHAPTER 5
Global deviation (Fisher’s method) from Hardy-Weinberg equilibrium was significant
for the second time period (A2 = 36.0, d f = 18, p < 0.007; Bonferroni correction: a =
0.05; k = 3; 1982-84), while non-significant deviations were observed for the time
period 1971-73 (X* = 27.1, d f= 18, p = 0.077) and 2001-03 = 19.1, d f= 18, p =
0.383; Table 2).
Table 3 Measures o f genetic diversity o f red foxes for the control area (Canton Uri; Switzerland) for three time periods. Shown are single-locus values for nine microsatellite loci of the number of individual genotypes (Agt) and genetic diversity (HE) for each time period and NGT, HE, observed heterozygosity (H0), allelic diversity (A), inbreeding coefficients (F1S) across all samples. The summary statistics shows multilocus means and SD jackknifed over loci.
Microsatellite 1971-73 1982-84 2001-03 All individual samplesAct h e NCj h e Agt h e Nc T % A Ho h e Fi s
n=16 n==20 n= 19 n==55AHT-130 16 0.756 15 0.708 19 0.817 50 90.9 8 0.780 0.765 -0.020V142 14 0.881 11 0.840 19 0.853 44 80.0 12 0.886 0.848 -0.045CXX-156 15 0.828 13 0.871 19 0.842 47 85.5 8 0.872 0.850 -0.026CXX-279 13 0.843 14 0.751 19 0.828 46 83.6 9 0.804 0.814 0.012V374 16 0.802 19 0.808 19 0.795 54 98.2 6 0.815 0.802 -0.016V402 16 0.847 19 0.825 19 0.788 54 98.2 7 0.833 0.810 -0.029CXX-466 12 0.859 14 0.802 19 0.785 45 81.8 7 0.822 0.807 -0.019V486 16 0.774 20 0.803 19 0.862 55 100.0 8 0.745 0.819 0.090V502 16 0.669 20 0.710 19 0.710 55 100.0 7 0.691 0.693 0.003mean 14.9 0.807 16.1 0.791 19.0 0.809 50.0 90.1 8.00 0.806 0.801 -0.006SD 0.069 0.058 0.050 1.92 0.063 0.052 0.045
Global test for the spatial genic differentiation across sampling sites revealed a
difference in the distribution of allele frequency for the time period 1971 -73 (Al2 =
33.9, d f — 18, p = 0.013) across all sampling sites (GRm and GR6); but no genic
differentiation was revealed when calculated across four sampling sites (GRm) (A'2 =
29.2, d f = 18, p = 0.046; Bonferroni correction: a = 0.05; k = 3). The genic
differentiation test for the two later time periods was significant across all sampling
sites (2001-03: A2 = 54.9, d f= 18, p < 0.0001; GRm and GR$) and across the four
selected sites (1982-84: X 2 = 50.3, df= 18,/? < 0.0001; 2001-03: A2 = 52.5, df= 18,/? <
0.0001; GRm)* Global Fst values for the three time periods and across the four
sampling sites GRm were 0.002 ± 0.013 in 1971-73, 0.008 ± 0.010 in 1982-84 and
0.012 ± 0.009 in 2001-2003, respectively. Across all sampling sites (GRm and GR6),
global Fsi^values for the time period 1971-73 and 2001-03 were 0.003 ± 0.009 and
0.009 ± 0.008, respectively (Figure 3).
89
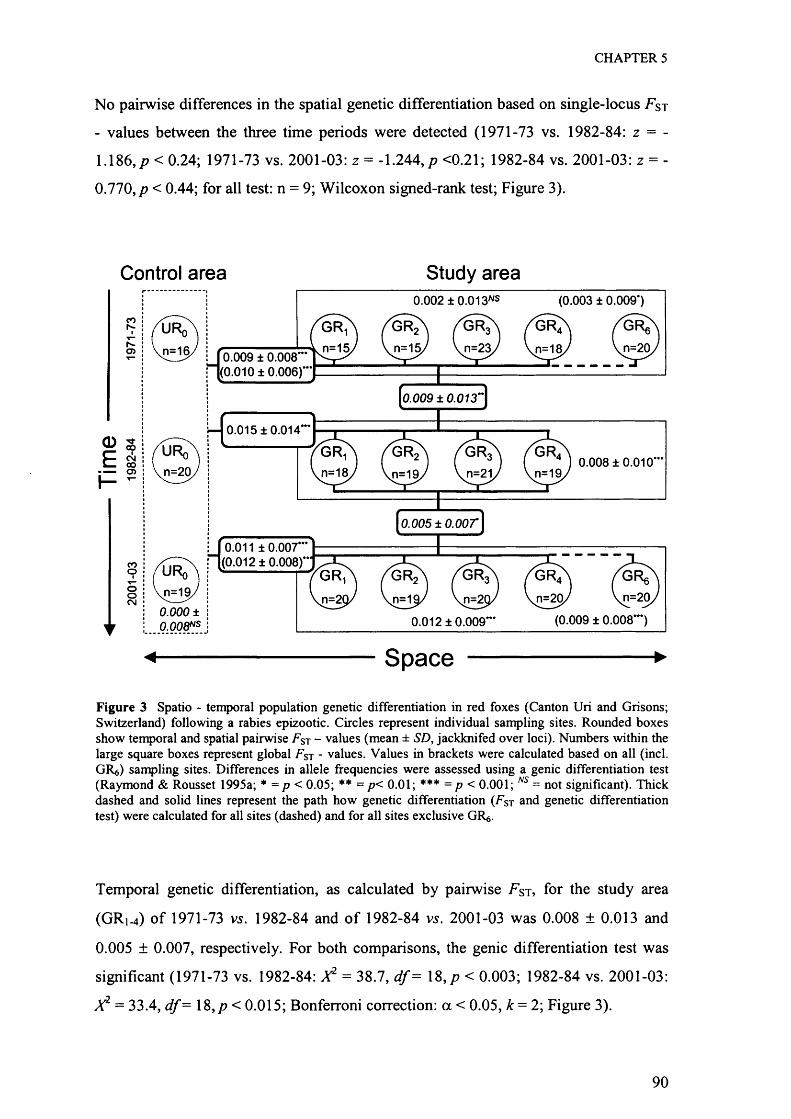
CHAPTER 5
No pairwise differences in the spatial genetic differentiation based on single-locus F st
- values between the three time periods were detected (1971-73 vs. 1982-84: z = -
1.186,/? < 0.24; 1971-73 vs. 2001-03: z = -1.244,/? <0.21; 1982-84 vs. 2001-03: z = -
0.770,/? < 0.44; for all test: n = 9; Wilcoxon signed-rank test; Figure 3).
Control area Study area0.002 ± 0.013NS (0.003 ± 0.009*)
CO
f*.05 0.009 ± 0.008***
(0.010 ± 0.006)***
0.009 ± 0.013
0.015 ±0.014’
0.008 ±0.010***
0.011 ±0.007*’ (0.012 ± 0.008)'CO
GR.GR.GR
ji= 2 looCM n=1 n=2l
(0.009 ± 0.008***)0.012 ±0.009***
Space•4
Figure 3 Spatio - temporal population genetic differentiation in red foxes (Canton Uri and Grisons; Switzerland) following a rabies epizootic. Circles represent individual sampling sites. Rounded boxes show temporal and spatial pairwise Fst - values (mean ± SD, jackknifed over loci). Numbers within the large square boxes represent global F$t - values. Values in brackets were calculated based on all (incl. GR<0 sampling sites. Differences in allele frequencies were assessed using a genic differentiation test (Raymond & Rousset 1995a; * = p < 0.05; ** = p< 0.01; *** = p < 0.001; NS = not significant). Thick dashed and solid lines represent the path how genetic differentiation (FST and genetic differentiation test) were calculated for all sites (dashed) and for all sites exclusive GR6.
Temporal genetic differentiation, as calculated by pairwise Fst, for the study area
(GRm) of 1971-73 vs. 1982-84 and of 1982-84 vs. 2001-03 was 0.008 ±0.013 and
0.005 ± 0.007, respectively. For both comparisons, the genic differentiation test was
significant (1971-73 vs. 1982-84: X 2 = 38.7, df= 18,/? < 0.003; 1982-84 vs. 2001-03:
X 2 = 33.4, d f = 18,/? < 0.015; Bonferroni correction: a < 0.05, k = 2; Figure 3).
90

CHAPTER 5
For the control area UR, overall Ho, He and F\$ averaged across loci and across all fox
samples were 0.806 ± 0.063, 0.801 ± 0.052 and -0.006 ± 0.045, respectively (Table 3).
No genic differentiation over time was detected across the three time periods (A2 =
17.3, d f = 18,/? < 0.503; F ST = 0.000 ± 0.008).
Finally, the spatial genetic differentiation (Fst) between control area (UR) and the
study area (G R m ) for the three time periods were 0.009 ± 0.008 (1971-73), 0.015 ±
0.014 (1982-84) and 0.011 ± 0.007 (2001-03), respectively. Based on all sampling
sites (G R m and GR6), overall F st for the time period 1971-73 and 2001-03 were 0.010
± 0.006 and 0.012 ± 0.008. The test for allelic differentiation between the control and
the study area for all three time periods was significant based on four sampling sites
(G R m : 1971-73: X 2 = 84.9; 1982-84: ^ = 117.2; 2001-03: X 1 = 88.4; all df= 18, p <
0.0001) and based on all sampling sites (G R m : and GR«: 1971-73: X 2 = 103.0; 2001-
03: X 2 = 102.6; all df= 18,/) < 0.0001; Figure 3).
IBD analyses o f pairs o f individuals
Three historic samples (G196, G197, G335; all 1971-73) with less than four
successfully genotyped loci were excluded from subsequent IBD analysis. Average
Euclidian distances (mean ± SD) between individual samples for the three time periods
1971-73, 1982-83 and 2001-03 were 32,043m ± 8,448m, 30,465m ± 6,849m and
35,732m ± 7,094m, respectively. Averaged geographic distances (mean ± SD) between
individuals computed in GIS and restricted below a 1400m-altitude threshold were
38,755m ± 9,806m (1971-73), 32,410m ± 7,342m (1982-84) and 41,089m ± 9,008m
(2001-03).
A total of 119 dyads (3.11%) in 1971-73, 109 dyads (3.73%) in 1982-83 and 103
dyads (2.12%) in 2001-03 were excluded for the Mantel tests, because they were
individuals from the same borough (Table 4). No significant correlation between the
logarithmic transformed Euclidian distances and the genetic relatedness (Fw) was
detected for the time period 1971-73 (blog = -0.0012, r2 = 0.002, p = 0.0747, n = 88;
Mantel test). In contrast, significant IBD patterns were revealed for the time periods
1982-84 (blog = -0.026, r2 = 0.012,p < 0.0001, n = 77) and 2001-03 (blog = -0.021, r2
= 0.010,/? < 0.0001, n = 99; Mantel test, Table 4, Figure 4a).
91

CHAPTER 5
Based on the spatial distances computed below a 1400m-altitude threshold, no
significant IBD was observed for the time period 1971-73 (blog = -0.009, r2 = 0.001,/?
= 0.1061), while the correlation was significant for 1982-84 (blog = -0.026, r2 = 0.011,
p < 0.0001) and 2001-03 (blog = -0.019, r2 = 0.009,/? < 0.0001; Table 4, Figure 4).
Table 4 Results o f the isolation-by-distance (IBD) analyses in a continuous red fox population for three time periods. Shown are the number of used and excluded dyads, the slope, slope SE, intercept and measure of fit (r2) for the regression computations between spatial distance (log transformed) and relatedness (/?w; Wang 2002). Results are shown for two spatial distance matrices: Euclidian distances and spatial distances, which accounted for the topography of the study area given an a priori defined altitude threshold of 1400m altitude (see text for details). The significance of the slopes was assessed in a Mantel test.
1971-73 1982-84 2001-03n=88 n=77 n=99
Dyadsall 3828 2926 4851excluded (same borough) 119 109 103used 3709 2817 4748
EuclidianSlope -0.0117 -0.0255 -0.0209SE Slope 0.0497 0.0393 0.0225Intercept 0.1245 0.2523 0.2175t2 0.0018 0.0115 0.0095P 0.0747 <0.0001 <0.0001
1400m altitude thresholdSlope (blog) -0.0090 -0.0249 -0.0189SE Slope 0.0476 0.0380 0.0202Intercept 0.0984 0.2476 0.1989r2 0.0013 0.0114 0.0088P 0.1061 < 0.0001 <0.0001
The fine-scale spatial genetic structures for five a priori defined spatial categories and
for the three time periods are shown in Figure 4b. In general, all three sampling
periods demonstrated a decrease of average relatedness with each longer spatial
category (Table 5). However, a noticeable deviation from IBD pattern was revealed for
the period 1971-73 in the second spatial category (8956m - 16317m; Figure 4).
92

CHAPTER 5
Table 5 Summary of the isolation-by-distance (IBD) analyses in red foxes for five a priori defined spatial distance classes and three time periods. The number of dyads, the percentages that each individual is represented in a given distance class (%partic), the average and SE of relatedness (/?w, Wang 2002) are presented for each distance class and time period. Spatial distances were corrected for the topography of the study area. (1400m altitude threshold, see text for details).
Spatial distancesSpatial classes
1971-73n=88
Dyads %partic Dyads
1982-84n=77
%partic Dyads
2001-03n=99
%partic< 8956m 475 100 432 100 513 99
8956- 16317m 390 97.7 391 97.4 430 10016318-29733m 683 100 702 100 765 10029734-54176m 1055 100 829 100 1578 100
> 54176m 1225 86.4 572 83.1 1565 94.9Total 3828 2926 4851
Relatedness (Rw, Wang 2002)Spatial classes Mean SE Mean SE Mean SE
< 8956m 0.022 0.064 0.019 0.091 0.037 0.0218956- 16317m -0.007 0.072 0.021 0.075 0.014 0.049
16318-29733m 0.022 0.047 0.021 0.097 0.019 0.03329734 - 54176m -0.001 0.059 -0.023 0.087 0.003 0.025
> 54176m -0.002 0.078 -0.039 0.076 -0.018 0.024Total 0.005 0.057 -0.004 0.079 0.003 0.012
Based on the computed blog - values for each of the three time periods and an assumed
two and three-times population increase, the estimated <j - values were 4508m and
5522m for the sampling period 1971 - 73 and 271 lm and 3320m for the period 1982-
84 (Table 6).
Table 6 Estimates for gene dispersal (d) and effective population density (D) for three time periods in an increasing red fox population. Shown are values for D, o, estimated slope between genetic and spatial distance (blog) and ‘neighbourhood size’ (NS) for two levels (2 x and 3 x) o f assumed population increase in relation to the recent sampling period 2001-2003.
Samplingperiod
Populationincrease
D[Individuals
*generation/knrl
blog NS[Individuals
1
<J [m/generation1:](% deviation)
1 9 7 1 - 7 3 2 x 0 .4 3 5 0 .0 0 9 0 111.1 4 5 0 8 (204.9)3 x 0 .2 9 0 0 .0 0 9 0 111.1 5 5 2 2 (251.0)
1 9 8 2 - 8 4 2 x 0 .4 3 5 0 .0 2 4 9 4 0 .2 2 7 1 1 (123.2)3 x 0 .2 9 0 0 .0 2 4 9 4 0 .2 3 3 2 0 (150.9)
2 0 0 1 - 0 3 - 0 .8 7 0 * 0 .0 1 8 9 5 2 .9 2 2 0 0 -
* D for sampling period 2001-03 was calculated based on demographic data; Chapter 2.
93
CHAPTER 5
Discussion
The main aim of this study was to assess the temporal and spatial population genetic
structure in an Alpine red fox population following and after successful eradication of
a rabies epizootic. Microsatellite data were collected from historic and recent fox
samples spanning three decades. The major result of this chapter is that the observed
temporal and spatial genetic population structure is likely to be the consequence of
changing population density and dispersal distances. This result is discussed separately
for population dynamics, temporal population genetic structure and spatial population
genetic structure.
Population dynamics
According to the hunting records of the Canton Grisons, the red fox population
experienced a two to three fold increase in estimated density following the eradication
of rabies (Figure 2). Although the estimated population density is likely to have
reached pre-rabies abundance within a decade after the first and most severe outbreak
of the disease, it continued in what appears to be a long-term growth. This trend was
consistent with the observation of a generally growing red fox population in
Switzerland and Europe (Breitenmoser unpublished, reviewed in Chautan et al. 2000,
Chapter 3). Rabies induced mortality is thought to be density dependent (e.g. Anderson
et al. 1981). Because fox abundance at lower altitude is higher (Wandeler 1995; e.g.
the Swiss plateau, Chapter 3), the mortality rate following a rabies epizootic can be
expected to be considerably lower in Alpine habitat.
Average generation time for red foxes in Switzerland was estimated to be 2.75 years
based on recent demographic data and assuming an equal reproduction across age
classes and sex (Chapter 2). In addition, the age structure of a red fox population was
found to be altered following a rabies epizootic (Chapter 3). Therefore, a shorter
generation-time than 2.75 years subsequent to the rabies infection can be expected
(Chapter 3). Based on these assumptions, the number of generations between the
sampling periods 1971-73 and 1982-84, and 1982-84 and 2001-03 were approximated
to be between four to six and six to eight generations, respectively. Overall, the
population genetic structure described in this study represented ten to fourteen
generations.
94
CHAPTER 5
Temporal changes in population genetic structure
The observed allele frequencies o f the red fox population changed significantly
between sampling periods in the study area. The potential causes for the temporal
changes in allele frequencies are random genetic drift and migration / immigration.
The red fox population described in the study area is enclosed by topographic features
such as Alpine mountain ridges (Figure 1). Dispersal in red foxes is affected by the
topography based on both direct, demographic methods (Zimen 1984, Funk 1994) and
indirect, genetic methods (Chapter 2). Therefore the examined fox population can be
assumed to be partially isolated from its surrounding populations. Nevertheless, based
on an estimated Ne o f 3907 individuals for the red fox population of the study area (for
details see Chapter 2) and a total sampling period of ten to fourteen generations, the
effect of random genetic drift might be small. Minor effects of genetic drift for the
whole red fox population in the study area were reflected by two marginal pairwise F st
- values computed between the three sampling periods. Despite the assumed smaller
number of generations between the sampling periods 1971-73 and 1982-84 versus
1982-84 and 2001-2004, the observed genetic differentiation ( F s t ) for the earlier time
span was slightly higher. Therefore, the Ne in the 1970s and early 1980s during the
rabies epizootic can be expected to be lower than in the present.
In contrast to the detected minor temporal differences in allele frequencies, the genetic
diversity (estimated by Ho, H e and A) remained constant over time (Table 2, Table 3).
This result confirms previous findings (Chapter 3) where the rabies induced mortality
did not affect the genetic diversity. Analogous to the study area, the control area is
well surrounded by mountains, but smaller in size (Figure 1). Under these
circumstances, a smaller Ne and as a consequence higher random genetic drift in the
fox population could be expected. Nonetheless, no significant changes in allele
frequencies were observed.
Male biased dispersal in red foxes was revealed in the study area by comparing single
locus Fis - values for males and females (Chapter 2). The observed male biased
dispersal not only revealed immigration into the study area but also implies a certain
level of genetic differentiation between the study area and its surroundings (Chapter 2,

CHAPTER 5
Goudet et a l 2002). The level of genetic differentiation expected between the study
area and its surroundings was confirmed by the significant but minor observed genetic
differentiation between the study and the control area. Although the control area
represents only one of several areas from which potential immigrants might originate
from (Figure 2), a similar level of genetic differentiation across the mountain ridges
encompassing the study area can be expected.
The observed genetic differentiation between the study and the control area was
relatively constant over the three decades examined, although the highest genetic
differentiation was calculated for the second time period (1982-84) at the end of the
rabies epizootic. It can be speculated whether this result reflects a lower rate of
migration across the mountain ridge during rabies or increasing genetic drift due to
small effective population size. Recent studies documented higher values of genetic
differentiation between populations due to genetic drift (Goodman et a l 2001, Keller
& Largiader 2003, Johnson et a l 2004). The latter found reduced gene flow and
increased genetic drift between fragmented populations of the endangered greater
prairie-chicken (Tympanuchus cupido) by comparing the population genetics based on
historic (1950) and recent samples. The higher genetic differentiation observed
between the study and control area following the rabies epizootic are therefore
consistent with the expected smaller Ne for the study area based on the temporal
estimates of genetic differentiation. Finally, these results are supported by the
dynamics of the red fox population for the study area as described above.
Spatial genetic structure within the study area
There was clear evidence for spatial genetic structure within the study area. Analyses
revealed differences for the three time periods examined. Whilst significant genic
differentiation and IBD pattern were inferred for the two time periods at the end of the
rabies epizootic (1982-84) and for recent times (2001-03), a lower level of spatial
genetic structure was found for the first sampling period (1971-73).
Several methodological constraints could have affected the temporal variations of the
estimated spatial genetic differentiation. As previously reported, the amount of
extracted nuclear DNA from historic tooth samples in this study correlated negatively
with storage time (Chapter 2). This resulted in a non-random distribution of
96

CHAPTER 5
genotyping success among the three time periods (Table 3). The negative relationship
between genotyping success-rate and storage time was further reflected by the higher
variance of relatedness calculated for the five spatial distance classes in the two earlier
time periods (Figure 4b). A similar pattern was revealed for the computed variance of
the three global Fs-r-values (Figure 3). Given the higher sampling variance, in
particular for the earliest sampling period (1971-73), the non-random distribution of
genotyping success-rate might have therefore affected the power of the applied genic
differentiation and Mantel test.
— □■— 1971-73—A— 1982-84 —• — 2001-030.04 n
y = 0.199 - 0.019 x ; /*= 0.0088
0.02y = 0.098 - 0.009x ; r* = 0.0013 NS
0.00
^ - 0.02 -
LUCO-H -0.04 J c
y = 0.248 - 0.025x ; r2 = 0.0115
(0<DE,(/)C/5CDc■OCD
_ajCDa:
0.06 1
0.04 -
0.02 -
0
- 0.02 -
-0.04 -
-0.06 J<8956m 8956-16317m 1618-29733m 29734 - 54176m > 54176m mean
Spatial distance [m]
Figure 4 Isolation-by-distance for three time periods in a continuous red fox population (Canton Grisons, Switzerland) following a rabies epizootic. Spatial distances accounted for the topography of the study area. (1400m altitude threshold, see text for details) .a) Regression slopes between pairwise spatial distances and relatedness (/?w; Wang 2002) for three time periods, b) Average (± SE; jackknifmg over loci) relatedness across all individuals for five log transformed and a priori defined distance categories (*** ~ p < 0.001; NS = not significant).
97

CHAPTER 5
In contrast to Chapter 2, the geographic origin for individual samples was based on
borough data only and was considerably less accurate. In addition, the clustered
distribution of individual samples for each of the three time periods was not optimal
for representing a ‘continuous’ population. Despite this, a significant IBD pattern was
observed. Furthermore, the estimated slope between geographic and genetic
relatedness (Rw) was considerably steeper in this study than compared to Chapter 2.
This is not unexpected, based on the previously observed variance of computed single
locus slopes in Chapter 2 (Table 3, Appendix) and the selection of microsatellite
markers chosen for this study.
The lack of historic samples for site GR6 for time period 1982-84 and its resulting
effect on the estimated parameters was difficult to assess. However, it is interesting to
note that by calculating the global Fst for the latest time period (2001-03) and across
all sample sites instead for GR1-4 only, the genetic differentiation observed was smaller
(Figure 3). It can be speculated whether the lack of sampling for site GRs could be
account for the somehow steeper slope revealed in the IBD analyses for the time period
1982-84.
A lower level of local genetic drift was revealed for the sampling period 2001-03
compared to the period 1982-84. This is in accordance with the theory of IBD, where a
flatter regression slope between genetic and spatial individual distances can be
expected given an increasing population density and a constant average dispersal
distance. However, there was strong evidence that between 1982 and 2003 average
gene dispersal decreased. Further to this, the computed dispersal distance for sampling
period 1971-73 was substantially longer than for the sampling period 1982-84.
Overall, this result supports the general prediction of a negative correlation between
population density and gene dispersal (Table 6 ) and therefore is in concordance with
theoretical models (Wolff 1997) and Trewhella’s et al. (1988) empirical review of
recovery distance and population density in red foxes.
It is important to point out that average gene dispersal distance per generation72 a does
not directly relate to average natal dispersal distance. Because measuring gene
dispersal in an IBD context estimates the average distance a gene disperses in a
population per generation, this method does not differentiate between the proportion of
98

CHAPTER 5
juveniles dispersing and the distance o f dispersal. In addition, IBD - models can only
help to infer dispersal based on successful reproduction of a dispersed individual at its
new location (Chapter 2). Finally, correlating red fox Ne with census population size or
density is dependent upon the assumption that Ne increases in a linear way with red fox
abundance. However, social systems in red foxes are variable, ranging from
monogamous pairs to complex family groups, and are further thought to be density-
dependent (review in Cavallini 1996). Therefore, the number of breeding individuals
and thus Ne might have increased at a lower rate over the past three decades than the
red fox population density.
Although density is likely to be the most important factor determining the observed
discrepancy in spatial genetic structure over time, the rabies epizootic could have
indirectly altered dispersal pattern. In this context, the higher mortality induced by
rabies could have let to a transiently higher proportion of juveniles to disperse. Rabies
is a contact transmitted disease (Macdonald 1980). Therefore, the probability of
transmitting the disease between neighbours (closely related animals) can be expected
to be more likely than between non-neighbours (less or none-related animals). In
addition, rabies can change behaviour to increase contact rates (Blancou et a l 1991).
As a consequence, this pattern of non-random mortality could decrease the average
relatedness within a rabies-affected population compared to the level of relatedness
before the outbreak of the disease. All three factors have the potential to bias the slope
of the IBD analyses towards zero.
It is difficult to balance the importance of density and non-density dependent effects
on the temporal changes of gene dispersal. Nonetheless, the rabies-related effects are
temporally and spatially limited and thus only partially affect the relationship between
spatial and genetic individual distances in an IBD context. In addition, the annual
number of recorded rabies cases for the study area (Figure 2) was low, even when
taking into account the small likelihood of discovery of a rabid fox (Macdonald &
Voigt 1985). It can thus be hypothesized that the rabies related factors have less impact
than density dependent factors in shaping the spatial genetic structure of the red fox
population examined.
99

CHAPTER 5
This study illustrates the potential of combining historic with recent molecular,
demographic and geographic data in studies of individuals within populations over
several generations. In the near future individual based IBD methods could be
combined with genetic methods estimating the variance Ne from observed changes in
allele frequencies of temporal samples. In this context, two of the most important
demographic parameters, dispersal distance and Nc, could be estimated using genetic
information only. The combination of those two methods, alongside non-invasive
sampling may help to gain central information on the ecology of endangered and
cryptic species.
100
GENERAL DISCUSSION
This study describes the first investigation into the long-term dynamics of genetic
variation in red foxes following a rabies epizootic, based on microsatellites and
demographic data to detail population structure over time and space. Using a large data
set on historic tooth samples, genetic structure could be analysed over 35 years,
representing ten to fourteen generations in red foxes. Furthermore, genetic data were
completed with detailed demographic data. Comprehensive discussions of the results
of this study are provided in each of the four independent chapters. I will therefore
only discuss briefly the general findings of this study and will primarily focus upon
further work extending from it.
Historic samples and population genetics
Using historic samples is a convincing and powerful method to infer changes in
genetic structure of natural populations over time. Museums can provide reference
samples for endangered and fragmented populations (Bouzat et al. 1998) and by
comparing the genetic structure of historic and recent samples, losses of genetic
diversity (e.g. Bouzat et al. 1998, Groombridge et al. 2000) and changes in effective
population size (Ne) can be estimated (e.g. Miller & Waits 2003). Museum samples can
further help to reveal the phylogeny of locally or globally extinct species (e.g.
Hammond et al. 2001). Based on the quality and quantity of sampling and samples
accessible, not only the temporal genetic structure can be assessed but also the
variance in spatial genetic structure between (Johnson et al. 2004) and - as
demonstrated in this study - even within populations. Research based on historic
samples therefore augments studies that reconstruct demographic history based on the
genealogy found in modem samples (e.g. Storz & Beaumont 2002).
Almost all genetic studies in historic samples are based on mitochondrial DNA
sequences or microsatellite genotype data. Because research on historic and
particularly ancient DNA poses substantial technical problems related to the highly
degraded and diluted DNA extracted, guidelines for studies based on mitochondrial
sequences have been established (Cooper & Poinar 2000). Yet, no such guidelines
have been defined for microsatellite studies in historic samples. Whilst the authenticity
of historic samples based on microsatellite can be assessed by testing for the
101

DISCUSSION
probability of identity (Taberlet & Luikart 1999), the likelihood of genotyping errors
due to allelic dropouts and false alleles remains high (Miller & Waits 2003, Chapter 1).
The bases for genotyping errors in historic and non-invasive samples are very similar
and can be explained by the diminutive concentration of template DNA (Morin et al.
2001). This study revealed a strong negative relationship between storage time and
nuclear DNA concentration measured in historic samples. Therefore, differences in the
distribution of genotyping errors between non-invasive and historic samples can be
expected. In addition, microsatellite studies can be biased by null alleles (Callen et a l
1993), homoplasy and complex mutation processes (Estoup et a l 2002), which have
all been shown leading to ambiguity in data analyses {reviewed in Balloux & Lugon-
Moulin 2002, Dakin & Avis 2004). Under these circumstances, studies using historic
samples might benefit in the near future from applying single nucleotide
polymorphisms (SNPs). SNP data can be obtained from very small PCR products
(<80bps) and therefore are in particular suitable for the highly degraded DNA
extracted from ancient and historic samples. Although applications using SNPs can be
biased by the selection of an unrepresentative sample of loci {i.e. ascertainment bias;
Nielsen 2000) genotyping efficiency, data quality and analytical simplicity are superior
to microsatellites (Morin et al. 2004). Consequently, SNPs could soon become the
marker of choice not only in studies based on historic samples but in the broader field
of population genetics (Morin et al. 2004).
The importance of long-term studies in the ecology and evolution of natural systems
has become widely recognized in science, since only long-term research can reveal
unpredictable and slow or even cryptic evolutionary processes (Grant & Grant 2002).
Long-term studies can help to associate evolutionary changes with environmental
factors, rare events such as bottlenecks caused by population crashes and temporally
inconsistent processes such as gene flow (Grant & Grant 2002). In this context,
temporal genetic data based on neutral or selective genetic markers should
significantly help to improve our understanding of the interactions between an
organism and its environment over time. So far, most population genetic studies based
on historic samples focused on describing the dynamic of genetic variation in relation
to changes in population size only (Bouzat et al. 1998, Groombridge et al. 2000,
Nielsen et al. 1999b, Chapter 4). Recently, Hadly et al. (2004) revealed genetic
responses to climate changes in two small and widespread mammalian species
102

DISCUSSION
(Thomomys talpoides and Microtus montanus). By successfully extracting and
sequencing small fragments of mitochondrial DNA from fossil records dating back
over 2500 years, varying effects on the genetic structure among the two species were
revealed. Nonetheless, studies combining environmental (i.e. climatic and habitat
changes) with genetic data over time are rare.
Population genetics at an individual based level
Assessing the spatial genetic pattern at an individual level rather than using a priori-
defined discrete populations has been proposed as a new method to infer how
geographical and environmental features might shape genetic variation in natural
populations (reviewed in Manel et al. 2003). This approach, landscape genetics, should
help to discover discontinuities in population genetic structure by applying statistical
tools such as e.g. Bayesian clustering methods (Prichard et al. 2000) or the Monmonier
algorithm (Manni et al. 2004). The individual based isolation-by-distance (IBD)
analysis chosen in my thesis was different in the way that the best fit between a set of
geographic and genetic distance matrices was inferred rather than genetic
discontinuities explored. Moreover IBD analyses can be easily combined with a
Geographic Information System (GIS) one of the most compelling tools in recent
ecological research. However, IBD analyses based on microsatellites loci and on an
individual level are only applicable in smaller areas due to the high mutation rate of the
genetic markers in use (Leblois et al. 2003). Recent studies (Sumner et al. 2002,
Coulon et al. 2004, Chapter 3 and 5) demonstrated that IBD patterns can be observed
in animals, indicating that continuous populations evolving under IBD might be rather
common. However, if IBD can be expected, current clustering methods applied in
population genetics are not suitable because they do not account for the continuous
change in allele frequencies.
Yang (2004) demonstrated a likelihood-based approach for estimating and testing
general IBD patterns. This method allows the user to combine several explanatory
matrices (e.g. environmental and habitat data) within a single analyses. In addition,
Yang’s (2004) method can test for homogeneity between slopes of different regression
lines. For example, differences in the spatial genetic structure observed between
populations or within a population but estimated for different time periods (e.g.
Chapter 5) can be assessed. Moreover, the computed likelihood values for different
103

DISCUSSION
IBD models can be used to select the best model based on Akaike’s information
criterion and for multimodel inference (Burnham & Anderson 2002). By applying this
approach across the eleven altitude models in Chapter 3, the best model could be
selected based on Akaike weights rather on r - values. Furthermore, model averaging
across all altitude models should improve the slope estimation of the regression line
between genetic and spatial distances and as a consequence the inferred average gene
dispersal distance a.
Taking into account landscape structure for estimating ecological distances between
individuals in a heterogeneous habitat can improve the amount of genetic variation
explained in an IBD context (Coulon et al. 2004, Chapter 3). Although the principle of
cost-friction analyses is straightforward, the difficulty is, however, to assess a species-
specific friction value for a given type of habitat {i.e. the cost for an individual to cross
a specific habitat type relative to all other habitat types). IBD analyses based on such
detailed environmental data therefore require particularly good knowledge of the
ecology of the species of interest.
Probably the weakest element of individual based IBD analyses, however, is the weak
estimation of genetic distance or relatedness between a pair of individuals. In general,
relatedness estimators cannot be used to make a precise statement about the degree of
relatedness between two individuals (Lynch & Ritland 1999). Although a large
proportion of the observed variance between genetic and spatial distances in an IBD
context is explained by Mendelian segregation, a significant proportion of it can be
attributed to the sampling variance of the applied genetic estimators (see Wang 2002
for a discussion on sampling variance in relatedness estimators). Consequently,
simulations are needed to gain a better understanding of how these two parameters
determine the overall variance in an individual based IBD analyses. Furthermore,
studies comparing IBD in natural populations based on molecular and pedigree data
would additionally help to assess the robustness of individual based IBD methods.
The temporal and spatial genetic structure observed in this study has been repeatedly
discussed in relation to past and recent effective population size (Ne). To date, several
statistical methods are available for estimating the variance Nc based on temporal
sampling and neutral genetic markers {e.g. Wang 2001, Berthier et al. 2002, Beaumont
104

DISCUSSION
2003). Therefore, Ne estimations could have been applied in this study. However,
given the complexity of these methods, such analyses could not be realized within the
timeframe of this study.
I can see great potential in the application o f genetic Ne estimations for each of the
three empirical data chapters. In Chapter 3, the demographic estimation of Ne could be
replaced by a genetic estimation of Ne based on temporal changes in allele frequencies
between historic samples from 1982-84 (Chapter 5) and modem samples. Preliminary
results applying Wang’s 2001 pseudo-likelihood approach for the two temporal
samples 1982-84 and 2001-03 using twelve microsatellites revealed a harmonic mean
of 840 individuals (95%CI: 402 - 4829). This reflects a lower estimate of effective
population density (D) and consequently resulted in a larger estimated effective
dispersal distance o of 7’188m (95%CI: 3’044 - 10’376m). By incorporating the
computed Ne estimations into the individual based IBD analyses, the two important
demographic population parameters Ne and dispersal distance can therefore be assessed
based on population genetic data only.
Furthermore, changes in red fox population size during the rabies epizootic in Chapter
4 might be inferred using Beaumont’s (2003) Bayesian approach for estimation
population growth. However, because the expected dispersal rate and average dispersal
distance is likely to have changed over time (Chapter 5), the effect of immigration on
temporal Ne estimation has to be taken into account. Furthermore, the inferred genetic
data on changes in population size could be directly compared with the detailed
demographic population records based on annual roadkill and hunting statistics.
Finally, the conclusions of Chapter 5 could be substantially improved by replacing the
assumed ratio of population growth following rabies (2 and 3 times respectively) with
Ne estimations among the three sampling periods.
Population genetics in red foxes and rabies
Infectious diseases can play a central role in natural systems (Altizer et a l 2003). In
particular diseases can decrease the size of populations substantially and as a
consequence can negatively affect the viability of populations (Woodroffe 1999). In
this study, long-term effects of rabies induced mortality were revealed in population
size and age structure (Chapter 4). However, demographic effects were less apparent
105

DISCUSSION
for the observed temporal and spatial genetic population structure. No long-term trends
in temporal genetic diversity were observed (Chapter 4). More difficult was the
interpretation of the observed dynamic of the fine-scale spatial genetic structure in
respect to population density and rabies (Chapter 5). Rabies is though to change the
behaviour of infected foxes and consequently will increase contact rates between
individuals (Macdonald 1980). For example, a proportion of rabies infected animals,
the so called furious form, can become highly mobile (Macdonald & Voigt 1985).
Further work could therefore assess the spatial genetic structure based on rabies
infected and non-infected foxes within a continuous population.
More generally, the large collection of historic samples analysed here could help to
investigate sex-specific migration patterns in red fox populations with changing
density. Although male biased dispersal was revealed based on autosomal genetic
markers (Chapter 3), the difference in genetic variation revealed between males and
females holds only for one generation. However to assess sex-specific spatial genetic
patterns more in detail, sex-specific genetic markers (mitochondrial DNA and Y-
chromosome) could be applied. In general, a four times smaller Ne for both types of
markers compared with nuclear markers can be assumed when reproductive success
among sexes is equal (Petit et a l 2001). Mitochondrial DNA and Y-chromosome
markers are therefore very sensitive to genetic drift and could help to assess more
effectively the rabies induced demographic effects on the genetic structure between
and within red fox populations.
106

BIBLIOGRAPHY
Alexander KA, Smith JS, Macharia MJ, King AA (1993) Rabies in the Masai-Mara, Kenya - Preliminary-Report. Onderstepoort Journal o f Veterinary Research 60, 411-414.
Allen SH, Sargeant AB (1993) Dispersal patterns of red foxes relative to population density. Journal o f Wildlife Management 57, 526-533.
Altizer S, Harvell D, Friedle E (2003) Rapid evolutionary dynamics and disease threats to biodiversity. Trends in Ecology & Evolution 18, 589-596.
Anderson RM, Jackson HC, May RM, Smith ADM (1981) Populations dynamics of fox rabies in Europe. Nature 289, 765-771.
Artois M, Aubert M, Stahl P (1990) Organization spatiale du renard roux ( Vulpes vulpes L., 1758) en zone d'enzootie de rage en Lorraine. Revue d'Ecologie (La Terre et la Vie) 45, 113-134.
Artois M, Langlais M, Suppo C (1997) Simulation of rabies control within an increasing fox population. Ecological Modelling 97, 23-34.
Baker PJ, Funk SM, Bruford MW, Harris S (2004) Polygynandry in a red fox population: implications for the evolution of group living in canids? Behavioral Ecology 15, 766-778.
Baker PJ, Funk SM, Harris S, White PCL (2000) Flexible spatial organisation of urban foxes (Vulpes vulpes) before and during an outbreak of sarcoptic mange. Animal Behaviour 59, 127-146.
Baker PJ, Robertson CPJ, Funk SM, Harris S (1998) Potential fitness benefits of group living in the red fox, Vulpes vulpes. Animal Behaviour 56, 1411-1424.
Balloux F, Lugon-Moulin N (2002) The estimation of population differentiation with microsatellite markers. Molecular Ecology 11, 155-165.
Beaumont MA (1999) Detecting population expansion and decline using microsatellites. Genetics 153, 2013-2029.
Beaumont MA (2003) Estimation of population growth or decline in genetically monitored populations. Genetics 164, 1139-1160.
Bennetts RE, Nichols JD, Lebreton JD, et al. (2001) Methods for estimating dispersal probabilities and related parameters using marked animals. In: Dispersal (eds. Clobert J, Danchin E, Dhondt AA, Nichols JD), pp. 3-17. Oxford University Press, Oxford.
Berthier P, Beaumont MA, Comuet JM, Luikart G (2002) Likelihood-based estimation of the effective population size using temporal changes in allele frequencies: A genealogical approach. Genetics 160, 741-751.
Blancou J, Aubert MFA, Artois M (1991) Fox rabies. In: The natural history o f rabies (ed. Baer GM), pp. 257-290. CRC Press, Boca Raton.
Bogel K, Arata AA, Moegle H, Knorpp F (1974) Recovery of reduced fox populations in rabies control. Zentralblatt fu r Veterinarmedizin 21, 401-412.
107

Bouzat JL, Lewin HA, Paige KN (1998) The ghost of genetic diversity past: Historical DNA analysis of the greater prairie chicken. American Naturalist 152, 1-6.
Breen M, Jouquand S, Renier C, et al. (2001) Chromosome-specific single-locus FISH probes allow anchorage of an 1800-marker integrated radiation-hybrid/linkage map of the domestic dog genome to all chromosomes. Genome Research 11, 1784-1795.
Breitenmoser U, Muller U, Kappeler A, Zanoni RG (2000) The final phase of the rabies epizootic in Switzerland. Schweizer Archiv fu r Tierheilkunde 142, 447- 454.
Bruford MW, Beaumont MA (1999) Microsatellites in conservation genetics. In: Microsatellites (eds. Goldstein DB, Schlotterer C), pp. 166-180. Oxford University Press, Oxford.
Burnham KP, Anderson DR (2002) Model selection and multimodel inference - a practical information-theoretic approach, 2nd edn. Springer, New York.
Caizergues A, Ratti O, Helle P, et al. (2003) Population genetic structure of male black grouse (Tetrao tetrix L.) in fragmented vs. continuous landscapes. Molecular Ecology 12, 2297-2305.
Callen DF, Thompson AD, Shen Y, et al. (1993) Incidence and origin of null alleles in the (AC)n microsatellite markers. American Journal o f Human Genetics 52, 922-927.
Cavallini P (1996) Variation in the social system of the red fox. Ethology Ecology & Evolution 8, 323-342.
Chautan M, Pontier D, Artois M (2000) Role of rabies in recent demographic changes in red fox (Vulpes vulpes) populations in Europe. Mammalia 64, 391-410.
Clobert J, Wolff JO, Nichols JD, Danchin E, Dhondt AA (2001) Introduction. In: Dispersal (eds. Clobert J, Danchin E, Dhondt AA, Nichols JD), p. xvii. Oxford University Press, Oxford.
Consuegra S, De Leaniz CG, Serdio A, et al. (2002) Mitochondrial DNA variation in pleistocene and modem Atlantic salmon from the Iberian glacial refugium. Molecular Ecology 11, 2037-2048.
Cooper A, Poinar HN (2000) Ancient DNA: Do it right or not at all. Science 289, 1139-1139.
Comuet JM, Piry S, Luikart G, Estoup A, Solignac M (1999) New methods employing multilocus genotypes to select or exclude populations as origins of individuals. Genetics 153, 1989-2000.
Coulon A, Cosson JF, Angibault JM, et al. (2004) Landscape connectivity influences gene flow in a roe deer population inhabiting a fragmented landscape: an individual-based approach. Molecular Ecology 13, 2841-2850.
Crawley MJ (1993) GLIM fo r Ecologist Blackwell Scientific Publications, Oxford.
Dakin EE, Avise JC (2004) Microsatellite null alleles in parentage analysis. Heredity 93, 504-509.
Daszak P, Cunningham AA, Hyatt AD (2000) Wildlife ecology - emerging infectious diseases of wildlife - threats to biodiversity and human health. Science 287, 443-449.
108

Dickman CR, Pressey RL, Lim L, Pamaby HE (1993) Mammals o f particular conservation concern in the Western division of New-South-Wales. Biological Conservation 65, 219-248.
Dieckmann U, O'Hara B, Weisser W (1999) The evolutionary ecology of dispersal. Trends in Ecology & Evolution 14, 88-90.
Ellegren H, Savolainen P, Rosen B (1996) The genetical history of an isolated population of the endangered grey wolf Canis lupus: A study of nuclear and mitochondrial polymorphisms. Philosophical Transactions o f the Royal Society o f London Series B-Biological Sciences 351, 1661-1669.
Englund J (1980) Yearly variations of recovery and dispersal rates of fox cubs tagged in Swedish coniferous forests. In: The red fo x (ed. Zimen E), pp. 195-208. Dr. W. Junk Publishers, The Hague.
ESRI (1996a): Using ArcView GIS: User manual. Redlands, California: Environmental Systems Research Institute.
ESRI (1996b): Using ArcView Spatial Analyst. Redlands, California: Environmental Systems Research Institute.
ESRI.(1996c): Using Avenue. Redlands, California: Environmental Systems ResearchInstitute.
Estoup A, Jame P, Comuet JM (2002) Homoplasy and mutation model at microsatellite loci and their consequences for population genetics analysis. Molecular Ecology 11, 1591-1604.
Falush D, Stephens M, Pritchard JK (2003) Inference o f population structure using multilocus genotype data: Linked loci and correlated allele frequencies. Genetics 164, 1567-1587.
Fenster CB, Vekemans X, Hardy OJ (2003) Quantifying gene flow from spatial genetic structure data in a metapopulation of Chamaecrista fasciculata (Leguminosae). Evolution 57, 995-1007.
Francisco LV, Langston AA, Mellersh CS, Neal CL, Ostrander EA (1996) A class of highly polymorphic tetranucleotide repeats for canine genetic mapping. Mammalian Genome 7, 359-362.
Funk SM (1994) Zur Dichteabhangigkeit der raumlichen und sozialen Organsiation und der Reproduktion beim Rotfuchs (Vulpes vulpes L.): Eine Studie bei zeitlich und raumlich durch Jagd und Tollwut variierenden Populationsdichten in Sudwest- Deutschland und Ost-Frankreich Thesis, Universitat des Saarlandes, Saarbriicken.
Funk SM, Fiorello CV, Cleaveland S, Gompper ME (2001) The role of disease in carnivore ecology and conservation. In: Carnivore Conservation (eds. Gittleman JL, Funk SM), pp. 443-466. Cambridge University Press, Cambridge.
Gagneux P, Boesch C, Woodruff DS (1997) Microsatellite scoring errors associated with noninvasive genotyping based on nuclear DNA amplified from shed hair. Molecular Ecology 6, 861-868.
Gamier-Gere P, Dillmann C (1992) A computer-program for testing pairwise linkage disequilibria in subdivided populations. Journal o f Heredity 83, 239-239.
109
Goldstein H (1995) Multilevel Statistical Models Edward Arnold, London.
Goodman SJ, Tamate HB, Wilson R, et a l (2001) Bottlenecks, drift and differentiation: the population structure and demographic history o f sika deer (Cervus nippon) in the Japanese archipelago. Molecular Ecology 10, 1357- 1370.
Goossens B, Waits LP, Taberlet P (1998) Plucked hair samples as a source of DNA: reliability of dinucleotide microsatellite genotyping. Molecular Ecology 7, 1237-1241.
Goudet J, Perrin N, Waser P (2002) Tests for sex-biased dispersal using bi-parentally inherited genetic markers. Molecular Ecology 11,1103-1114.
Grant PR, Grant BR (2002) Unpredictable evolution in a 30-year study of Darwin's finches. Science 296, 707-711.
Greenwood AD, Capelli C, Possnert G, Paabo S (1999) Nuclear DNA sequences from late Pleistocene megafauna. Molecular Biology and Evolution 16, 1466-1473.
Greenwood PJ (1980) Maiting system, phylopatry, and dispersal in birds and mammals. Animal Behaviour 28, 1140-1162.
Groombridge JJ, Jones CG, Bruford MW, Nichols RA (2000) 'Ghost' alleles of the Mauritius kestrel. Nature 403, 616-616.
Grue H, Jensen B (1973) Annular structures in canine tooth cementum in red foxes {Vulpes vulpes L.) o f known age. Danish Review o f Game Biology 8, 1-12.
Hadly EA, Ramakrishnan U, Chan YL, et a l (2004) Genetic response to climatic change: insights from ancient DNA and phylochronology. PLoS Biology 2, e290.
Hammond RL, Macasero W, Flores B, et a l (2001) Phylogenetic reanalysis of the Saudi gazelle and its implications for conservation. Conservation Biology 15, 1123-1133.
Hanski I (1998) Metapopulation dynamics. Nature 396, 41-49.
Hardy OJ, Vekemans X (2002) SPAGEDi: a versatile computer program to analyse spatial genetic structure at the individual or population levels. Molecular Ecology Notes 2, 618-620.
Harris S (1977) Distribution, habitat utilization and age structure of a suburban fox (Vulpes vulpes) population. Mammal Review 7, 25-39.
Harris S, Smith GC (1987) Demography of two urban fox (Vulpes vulpes) populations. Journal o f Applied Ecology 24, 75-86.
Harris S, Trewhella WJ (1988) An analysis of some of the factors affecting dispersal in an urban fox {Vulpes vulpes) population. Journal o f Applied Ecology 25, 409- 422.
Hartl DL, Clark AG (1997) Principels o f Population Genetics, 3rd edn. Sinauer Associates, Inc., Massachusetts.
Heath DD, Busch C, Kelly J, Atagi DY (2002) Temporal change in genetic structure and effective population size in steelhead trout {Oncorhynchus mykiss). Molecular Ecology 11, 197-214.
110
Heuertz M, Vekemans X, Hausman JF, Palada M, Hardy OJ (2003) Estimating seed vs. pollen dispersal from spatial genetic structure in the common ash. Molecular Ecology 12, 2483-2495.
Hoffeiter M, Serre D, Poinar HN, Kuch M, Paabo S (2001) Ancient DNA. Nature Reviews Genetics 2, 353-359.
Holmes NG, Dickens HF, Parker HL, et a l (1995) 18 Canine microsatellites. Animal Genetics 26, 132-133.
Hoss M (2000) Ancient DNA - Neanderthal population genetics. Nature 404, 453-454.
Hummel S, Schultes T, Bramanti B, Herrmann B (1999) Ancient DNA profiling by megaplex amplications. Electrophoresis 20, 1717-1721.
Ims RA, Hjermann DO (2001) Condition-dependent dispersal. In: Dispersal (eds. Clobert J, Danchin E, Dhondt AA, Nichols JD), pp. 203-216. Oxford University Press, Oxford.
Johnson DL (1977) Inbreeding in populations with overlapping generations. Genetics 87,581-591.
Johnson JA, Bellinger MR, Toepfer JE, Dunn P (2004) Temporal changes in allele frequencies and low effective population size in greater prairie-chickens. Molecular Ecology 13, 2617-2630.
Kappeler A (1985) Untersuchungen zur Altersbestimmung und zur Altersstruktur verschiedener Stichproben am Rotfuchs (Vulpes vulpes L.) in der Schweiz. MSc, University of Bern.
Kappeler A (1991) Die orale Immunisierung von Fiichsen gegen Tollwut in der Schweiz. Thesis, University of Bern.
Keller I, Largiader CR (2003) Recent habitat fragmentation caused by major roads leads to reduction of gene flow and loss of genetic variability in ground beetles. Proceedings o f the Royal Society o f London Series B-Biological Sciences 270, 417-423.
Keller LF, Jeffery KJ, Arcese P, et al. (2001) Immigration and the ephemerality of a natural population bottleneck: evidence from molecular markers. Proceedings o f the Royal Society o f London Series B-Biological Sciences 268, 1387-1394.
Keller LF, Waller DM (2002) Inbreeding effects in wild populations. Trends in Ecology & Evolution 17, 230-241.
Koenig WD, VanVuren D, Hooge PN (1996) Detectability, philopatry, and the distribution of dispersal distances in vertebrates. Trends in Ecology & Evolution 11, 514-517.
Kolb HH (1986) Some Observations on the Home Ranges of Vixens ( Vulpes Vulpes) in the Suburbs of Edinburgh. Journal o f Zoology 210, 636-639.
Lade JA, Murray ND, Marks CA, Robinson NA (1996) Microsatellite differentiation between Phillip island and mainland Australian populations of the red fox Vulpes vulpes. Molecular Ecology 5, 81-87.
Lande R (1988) Genetics and demography in biological conservation. Science 241, 1455-1460.
I l l
Larson S, Jameson R, Etnier M, Fleming M, Bentzen P (2002) Loss of genetic diversity in sea otters (Enhydra lutris) associated with the fur trade of the 18th and 19th centuries. Molecular Ecology 11, 1899-1903.
Leblois R, Estoup A, Rousset F (2003) Influence of mutational and sampling factors on the estimation of demographic parameters in a "continuous" population under isolation by distance. Molecular Biology and Evolution 20, 491-502.
Leblois R, Rousset F, Estoup A (2004) Influence of spatial and temporal heterogeneities on the estimation of demographic parameters in a continuous population using individual microsatellite data. Genetics 166, 1081-1092.
Leblois R, Rousset F, Tikel D, Moritz C, Estoup A (2000) Absence of evidence for isolation by distance in an expanding cane toad (Bufo marinus) population: an individual-based analysis of microsatellite genotypes. Molecular Ecology 9, 1905-1909.
Leonard JA, Wayne RK, Cooper A (2000) Population genetics of Ice age brown bears. Proceedings o f the National Academy o f Sciences o f the United States o f America 97, 1651-1654.
Lindahl T (1993) Instability and decay of the primary structure of DNA. Nature 362, 709-715.
Lindstrom E, Andren H, Angelstam P, et a l (1994) Disease reveals the predator: sarcoptic mange, red fox predation, and prey populations. Ecology 75, 1042- 1049.
Longford NT (1993) Random Coefficient Models Clarendon Press, Oxford.
Luikart G, Comuet JM (1998) Empirical evaluation of a test for identifying recently bottlenecked populations from allele frequency data. Conservation Biology 12, 228-237.
Lynch M, Ritland K (1999) Estimation of pairwise relatedness with molecular markers. Genetics 152, 1753-1766.
Macdonald DW (1979) 'Helpers' in fox society. Nature 282, 69-71.
Macdonald DW (1980) Rabies and Wildlife. A biologist's perspective Oxford University Press, Oxford.
Macdonald DW, Bacon PJ (1982) Fox society, contact rate and rabies epizootiology. Comparative Immunology, Microbiology and Infectious Diseases 5, 247-256.
Macdonald DW, Voigt DR (1985) The biological basis of rabies models. In: Population Dynamics o f Rabies in Wildlife (ed. Bacon PJ), pp. 71-108. Academic Press, London.
Manel S, Bellemain E, Swenson JE, Francois O (2004) Assumed and inferred spatial structure of populations: the Scandinavian brown bears revisited. Molecular Ecology 13, 1327-1331.
Manel S, Schwartz MK, Luikart G, Taberlet P (2003) Landscape genetics: combining landscape ecology and population genetics. Trends in Ecology & Evolution 18, 189-197.
Manni F, Guerard E, Heyer E (2004) Geographic patterns of (genetic, morphologic, linguistic) variation: how barriers can be detected by using Monmonier's algorithm. Human Biology 76, 173-190.
112

Matocq MD, Villablanca FX (2001) Low genetic diversity in an endangered species: recent or historic pattern? Biological Conservation 98, 61-68.
May RM (1988) Conservation and disease. Conservation Biology 2, 28-30.
McCallum H (2000) Population parameters - Estimation fo r Ecological Models Blackwell Science, Oxford.
Meldgaard T, Nielsen EE, Loeschcke V (2003) Fragmentation by weirs in a riverine system: A study of genetic variation in time and space among populations of European grayling (Thymallus thymallus) in a Danish river system. Conservation Genetics 4, 735-747.
Miller CR, Waits LP (2003) The history of effective population size and genetic diversity in the Yellowstone grizzly (Ursus arctos): implications for conservation. Proceedings o f the National Academy o f Sciences o f the United States o f America 100, 4334-4339.
Morin PA, Chambers KE, Boesch C, Vigilant L (2001) Quantitative polymerase chain reaction analysis of DNA from noninvasive samples for accurate microsatellite genotyping of wild chimpanzees (Pan troglodytes verus). Molecular Ecology 10, 1835-1844.
Morin PA, Luikart G, Wayne RK (2004) SNPs in ecology, evolution and conservation. Trends in Ecology & Evolution 19, 208-216.
Murakami H, Yamamoto Y, Yoshitome K, et al. (2000) Forensic study of sex determination using PCR on teeth samples. Acta Medica Okayama 54, 21-32.
Navidi W, Amheim N, Waterman MS (1992) A multiple-tubes approach for accurate genotyping of very small DNA samples by using PCR - statistical considerations. American Journal o f Human Genetics 50, 347-359.
Nei M (1987) Molecular Evolutionary Genetics Columbia University Press, New York.
Nei M, Maruyama T, Chakraborty R (1975) The bottleneck effect and genetic variability in populations. Evolution 29, 1-10.
Neigel JE (1997) A comparison of alternative strategies for estimating gene flow from genetic markers. Annual Review o f Ecology and Systematics 28, 105-128.
Neigel JE (2002) Is Fst obsolete? Conservation Genetics 3, 167-173.
Nielsen EE, Hansen MM, Loeschcke V (1999a) Genetic variation in time and space: Microsatellite analysis of extinct and extant populations of Atlantic salmon. Evolution 53, 261-268.
Nielsen EE, Hansen MM, Loeschcke V (1999b) Analysis of DNA from old scale samples: technical aspects, applications and perspectives for conservation. Hereditas 130, 265-276.
O'Brien SJ, Evermann JF (1988) Interactive influence of infectious-disease and genetic diversity in natural-populations. Trends in Ecology & Evolution 3, 254-259.
O'Brien SJ, Wildt DE, Goldman D, Merril CR, Bush M (1983) The cheetah is depauperate in genetic-variation. Science 221, 459-462.
Ostrander EA, Mapa FA, Yee M, Rine J (1995) 101 New simple sequence repeat- based markers for the Canine genome. Mammalian Genome 6, 192-195.
113

Ostrander EA, Sprague GF, Rine J (1993) Identification and characterization of dinucleotide repeat (CA)n markers for genetic-mapping in dog. Genomics 16, 207-213.
Paetkau D, Calvert W, Stirling I, Strobeck C (1995) Microsatellite analysis of population-structure in Canadian Polar bears. Molecular Ecology 4, 347-354.
Peakall R, Ruibal M, Lindenmayer DB (2003) Spatial autocorrelation analysis offers new insights into gene flow in the Australian bush rat, Rattus fuscipes. Evolution 57, 1182-1195.
Pertoldi C, Hansen MM, Loeschcke V, et al. (2001) Genetic consequences of population decline in the European otter (Lutra lutra): an assessment of microsatellite DNA variation in Danish otters from 1883 to 1993. Proceedings o f the Royal Society o f London Series B-Biological Sciences 268, 1775-1781.
Petit E, Balloux F, Excoffier L (2002) Mammalian population genetics: why not Y? Trends in Ecology & Evolution 17, 28-33.
Pichler FB, Baker CS (2000) Loss of genetic diversity in the endemic Hector's dolphin due to fisheries-related mortality. Proceedings o f the Royal Society o f London Series B-Biological Sciences 267, 97-102.
Piechocki R (1979) Makroskopische Praparationstechnik. Leitfaden fu r das Sammeln, Praparieren und Konservieren, Teil I, Wirbeltiere, 3rd edn. Gustave Fischer Verlag, Stuttgart.
Piry S, Alapetite A, Comuet JM, et al. (2004) GENECLASS2: A software for genetic assignment and first-generation migrant detection. Journal o f Heredity 95, 536- 539.
Pritchard JK, Stephens M, Donnelly P (2000) Inference of population structure using multilocus genotype data. Genetics 155, 945-959.
Prugnolle F, de Meeus T (2002) Inferring sex-biased dispersal from population genetic tools: a review. Heredity 88, 161-165.
Queller DC, Goodnight KF (1989) Estimating relatedness using genetic markers. Evolution 43, 258-275.
Queney G, Ferrand N, Marchandeau S, et al. (2000) Absence of a genetic bottleneck in a wild rabbit (Oryctolagus cuniculus) population exposed to a severe viral epizootic. Molecular Ecology 9, 1253-1264.
Rasbash J, Browne WJ, Healy M, Cameron B, Charlton C (2000) The MLwiN software package version 1.10. Institute of Education, University of London, London.
Raymond M, Rousset F (1995a) An exact test for population differentiation. Evolution 49, 1280-1283.
Raymond M, Rousset F (1995b) Genepop (Version-1.2) - Population-genetics software for exact tests and ecumenicism. Journal o f Heredity 86, 248-249.
Rey N (2002) Cost Distance Matrix, Anthropology and Ecology Departement, Genetics and Biometry Laboratory, University of Geneva (ArcView extension). URL: http://arcscripts.esri.com/details.asp?dbid=l 1192
Rice WR (1989) Analysing tables of statistical tests. Evolution 43, 223-225.
114

Robinson NA, Marks CA (2001) Genetic structure and dispersal of red foxes ( Vulpes vulpes) in urban Melbourne. Australian Journal o f Zoology 49, 589-601.
Rosatte RC (2002) Long distance movement by a coyote, Canis latrans, and red fox, Vulpes vulpes, in Ontario: Implications for disease-spread. Canadian Field- Naturalist 116, 129-131.
Rousset F (1997) Genetic differentiation and estimation o f gene flow from F-statistics under isolation by distance. Genetics 145, 1219-1228.
Rousset F (2000) Genetic differentiation between individuals. Journal o f Evolutionary Biology 13, 58-62.
Rousset F (2001) Genetic approaches to the estimation of dispersal rates. In: Dispersal (eds. Clobert J, Danchin E, Dhondt AA, Nichols JD), pp. 18-29. Oxford University Press, Oxford.
Rousset F, Gandon S (2002) Evolution of the distribution of dispersal distance under distance-dependent cost of dispersal. Journal o f Evolutionary Biology 15, 515- 523.
Rozen S, Skaletsky HJ (2000) Primer3 on the WWW for general users and for biologist programmers. In: Bioinformatics Methods and Protocols: Methods in Molecular Biology (eds. Krawetz S, Misener S), pp. 365-386. Humana Press, Totowa, NJ.
Rueness EK, Jorde PE, Hellborg L, et al. (2003) Cryptic population structure in a large, mobile mammalian predator: the Scandinavian lynx. Molecular Ecology 12, 2623-2633.
Sacks BN, Brown SK, Ernest HB (2004) Population structure of California coyotes corresponds to habitat-specific breaks and illuminates species history. Molecular Ecology 13, 1265-1275.
Schwartz MK, Tallmon DA, Luikart G (1999) Using genetics to estimate the size of wild populations: many methods, much potential, uncertain utility. Animal Conservation 2, 321-323.
Shapiro B, Sibthorpe D, Rambaut A, et a l (2002) Flight of the dodo. Science 295, 1683-1683.
Sillero-Zubiri C, King AA, Macdonald DW (1996) Rabies and mortality in Ethiopian wolves (Canis simensis). Journal o f Wildlife Diseases 32, 80-86.
Smith GR (1982) Animal-disease and conservation. Nature 295, 16-16.
Smith S, Vigilant L, Morin PA (2002) The effects of sequence length and oligonucleotide mismatches on 5 ' exonuclease assay efficiency. Nucleic Acids Research 30, el 11.
Sokal RR, Rohlf FJ (1995) Biometry, 3rd edn. W.H. Freeman and Company, New York.
Spong G, Creel S (2001) Deriving dispersal distances from genetic data. Proceedings o f the Royal Society o f London Series B-Biological Sciences 268, 2571-2574.
Steck F, Wandeler A (1980) The epidemiology of fox rabies in Europe. Epidemiologic Reviews 2, 71-96.
115
Stohr K, Meslin FM (1996) Progress and setbacks in the oral immunisation of foxes against rabies in Europe. Veterinary Record 139, 32-35.
Storz JF, Beaumont MA (2002) Testing for genetic evidence of population expansion and contraction: An empirical analysis of microsatellite DNA variation using a hierarchical Bayesian model. Evolution 56, 154-166.
Sugg DW, Chesser RK, Dobson FS, Hoogland JL (1996) Population genetics meets behavioral ecology. Trends in Ecology & Evolution 11, 338-342.
Sumner J, Rousset F, Estoup A, Moritz C (2001) 'Neighbourhood' size, dispersal and density estimates in the prickly forest skink (Gnypetoscincus queenslandiae) using individual genetic and demographic methods. Molecular Ecology 10, 1917-1927.
Swanson BJ, Fuhrmann RT, Crabtree RL (2005) Elevational isolation of red fox populations in the Greater Yellowstone Ecosystem. Conservation Genetics 6, 123-131.
Taberlet P, Griffin S, Goossens B, et a l (1996) Reliable genotyping of samples with very low DNA quantities using PCR. Nucleic Acids Research 24, 3189-3194.
Taberlet P, Luikart G (1999) Non-invasive genetic sampling and individual identification. Biological Journal o f the Linnean Society 68, 41-55.
Tallmon DA, Luikart G, Beaumont MA (2004) Comparative evaluation of a new effective population size estimator based on approximate Bayesian computation. Genetics 167, 977-988.
Teagle WG (1967) The red fox in the London suburbs. The London Naturalist 46, 44- 68 .
Tessier N, Bematchez L (1999) Stability of population structure and genetic diversity across generations assessed by microsatellites among sympatric populations of landlocked Atlantic salmon (Salmo salar L.). Molecular Ecology 8, 169-179.
Thompson PM, Goodman S (1997) Direct and indirect estimates of dispersal distances. Trends in Ecology & Evolution 12, 195-196.
Tischendorf L, Thulke HH, Staubach C, et a l (1998) Chance and risk of controlling rabies in large-scale and long-term immunized fox populations. Proceedings o f the Royal Society o f London Series B-Biological Sciences 265, 839-846.
Travis JMJ, Murrell DJ, Dytham C (1999) The evolution of density-dependent dispersal. Proceedings o f the Royal Society o f London Series B-Biological Sciences 266, 1837-1842.
Trewhella WJ, Harris S (1988) A simulation model of the pattern of dispersal in urban fox ( Vulpes vulpes) populations and its application for rabies control. Journal o f Applied Ecology 25, 435-450.
Trewhella WJ, Harris S, McAllister FE (1988) Dispersal distance, home-range size and population density in the red fox ( Vulpes vulpes): a quantitaive analysis. Journal o f Applied Ecology 25, 423-434.
Valiere N, Berthier P, Mouchiroud D, Pontier D (2002) GEMINI: software for testing the effects of genotyping errors and multitubes approach for individual identification. Molecular Ecology Notes 2, 83-86.
116

Vekemans X, Hardy OJ (2004) New insights from fine-scale spatial genetic structure analyses in plant populations. Molecular Ecology 13, 921-935.
Vila C, Sundqvist AK, Flagstad O, et a l (2003) Rescue of a severely bottlenecked wolf (Canis lupus) population by a single immigrant. Proceedings o f the Royal Society o f London Series B-Biological Sciences 270, 91-97.
Vitasek J (2004) A review of rabies elimination in Europe. Veterinarni Medicina 49, 171-185.
Voigt DR, Macdonald DW (1984) Variation in the spatial and social behaviour of the red fox, Vulpes vulpes. Acta Zoologica Fennica, 261-265.
Vos AC (1994) Reproductive performance of the Red fox, Vulpes vulpes, in Garmisch- Partenkirchen, Germany, 1987-1992. Zeitschrift fu r Saugetierkunde - International Journal o f Mammalian Biology 59, 326-331.
Vrana P, Wheeler W (1992) Individual Organisms as terminal entities - laying the species problem to rest. Cladistics - the International Journal o f the Willi Hennig Society 8, 67-72.
Wakelin D, Apanius V (1997) Immune defence: genetic control. In: Host-Parasite Evolution - General Principles & Avian Models (eds. Clayton DH, Moore J), pp. 30-58. Oxford University Press, Oxford.
Walker CW, Vila C, Landa A, Linden M, Ellegren H (2001) Genetic variation and population structure in Scandinavian wolverine (Gulo gulo) populations. Molecular Ecology 10, 53-63.
Wandeler A (1995) Vulpes vulpes (L., 1758). In: Saugetiere der Schweiz (ed. Hausser J), pp. 407-411. Birkhauser Verlag, Basel.
Wandeler A, Muller J, Wachendorfer G, et al. (1974) Rabies in wild carnivores in central Europe. III. Ecology and biology of the fox in relation to control operations. Zentralblatt fu r Veterinarmedizin 21, 765-773.
Wandeler Al (2000) Oral immunization against rabies: afterthoughts and foresight. Schweizer Archiv fu r Tierheilkunde 142, 455-462.
Wandeler P, Smith S, Morin PA, Pettifor RA, Funk SM (2003a) Patterns of nuclear DNA degeneration over time-a case study in historic teeth samples. Molecular Ecology 12, 1087-1093.
Wandeler P, Funk SM, Largiader CR, Gloor S, Breitenmoser U (2003b) The city-fox phenomenon: genetic consequences of a recent colonization of urban habitat. Molecular Ecology 12, 647-656.
Wang JL (2001) A pseudo-likelihood method for estimating effective population size from temporally spaced samples. Genetical Research 78, 243-257.
Wang JL (2002) An estimator for pairwise relatedness using molecular markers. Genetics 160, 1203-1215.
Wang JL, Whitlock MC (2003) Estimating effective population size and migration rates from genetic samples over space and time. Genetics 163, 429-446.
Waser PM (1996) Patterns and consequences of dispersal in gregarious carnivores. In: Carnivore Behavior, Ecology, and Evolution (ed. Gittleman JL), pp. 267-295. Cornell University Press, Ithaca.
117

Waser PM, Elliott LF (1991) Dispersal and genetic-structure in kangaroo rats. Evolution 45, 935-943.
Waser PM, Strobeck C (1998) Genetic signatures of interpopulation dispersal. Trends in Ecology & Evolution 13, 43-44.
Weir BS, Cockerham CC (1984) Estimating F-statistics for the analysis of population structure. Evolution 38, 1358-1370.
White PCL, Harris S, Smith GC (1995) Fox contact behaviour and rabies spread: a model for the estimation of contact probabilities between urban foxes at different population densities and its implications for rabies control in Britain. Journal o f Applied Ecology 32, 693-706.
Wolff JO (1997) Population regulation in mammals: an evolutionary perspective. Journal o f Animal Ecology 66, 1-13.
Woodroffe R (1999) Managing disease threats to wild mammals. Animal Conservation 2, 185-193.
Woollard T, Harris S (1990) A behavioural comparision of dispersing and nondispersing foxes ( Vulpes vulpes) and an evaluation of some dispersal hypotheses. Journal o f Animal Ecology 59, 709-722.
Wright S (1943) Isolation by distance. Genetics 28, 114-138.
Wright S (1946) Isolation by distance under diverse systems of mating. Genetics, 39- 59.
Wright S (1977) Evolution and the Genetics o f Populations: Experimental Results and Evolutionary Deductions. The University of Chicago Press, Chicago.
Yang DY, Eng B, Waye JS, Dudar JC, Saunders SR (1998) Technical note: improved DNA extraction from ancient bones using silica-based spin columns. American Journal o f Physical Anthropology 105, 539-543.
Yang RC (2004) A likelihood-based approach to estimating and testing for isolation by distance. Evolution 58, 1839-1845.
Young TP (1994) Natural Die-Offs of Large Mammals - Implications for Conservation. Conservation Biology 8, 410-418.
Zanoni RG, Kappeler A, Muller UM, et a l (2000) Rabies free status of Switzerland after 30 years of fox rabies. Schweizer Archiv Fur Tierheilkunde 142, 423-429.
Zimen E (1982) Tollwut, Fuchs und Mensch. Die Pirsch 34, 352-357,432-435,5lb- 519.
Zimen E (1984) Long range movements of the red fox Vulpes vulpes L. Acta Zoologica Fennica 171, 267-270.
118
APPENDICES
Al: Demographic Ne estimation in populations with overlapping
generations.
To investigate the effective dispersal distance in an isolation-by-distance context in
Chapter 2, an estimate of the effective population size (Ne) for the study area was
needed. Based on Wright’s infinite island model without overlapping generations, Ne
was calculated from demographic data assuming constant population size, sex ratio
and age distribution. In brief, Ne can be estimated in terms of two matrices specifying
the passage of genes between different age groups (and sexes) and the number of
individuals in each age group (Equation 10; Johnson 1977). This model was then
further simplified by assuming a balanced sex ratio and that the reproductive success
for each age group was equal for both sexes. If individuals are retained in the
population for n mating seasons, the population can be divided into i age classes if n >
i > 1. Because reproduction in red foxes occurs once a year, the unit o f time and age
classes are based on years. Let TV, be the number of individuals of age class i and be
the probability that a gene in a newborn individual came from a parent of age class i.
Under these assumptions the effective population size can be derived as
J _ _ _ l _ AL ~ 2 L 7^r+t M0.5 N t tS {0.5N, 0.5 N m )
where N\ equals the number of newborn individuals while the generation interval L is
given by
L = ± i Pi = ± q , .»=1 »=1
To calculate Ne, the red fox abundance was assumed to be constant and that mortality
was human induced only (hunting or roadkill). Consequently, the average recorded
number of foxes killed in the study site in 2001 and 2002 (n = 2412) represents N\ as
the total annual number of newborn individuals. Because accurate age data were not
available for this part of Switzerland, the expected age distribution in the study site
was derived as follows: First, the total number of adult individualsf n \
wasv »=i v
calculated from N\ given the total ratio of recorded juvenile and adult foxes in the
119

APPENDICES
Swiss rabies data base from 1995 onwards (1:1.343; n=4122). Second, the proportion
of adult individuals for each age class i was computed based on the observed age
distribution of 160 accurately aged adult individuals from the canton of Aargau
collected from 1995 onwards (Table A l, for details see Chapter 3). To account for
sampling error in age classes with small samples size (i.e. for i > 3), the proportion for
a given age class i was described using an exponential function (y = 0.5483e'044495'),
which was extrapolated based on the observed age data distribution using S-plus 2000
(Mathsoft). Finally, a second estimate of Nc_m0d was calculated assuming a 50%
reduced reproduction (pimod) in age class / = 1.
Table A l Summary of the parameters needed to calculate Ne from demographic data (Johnson 1977). Shown are the age classes i, the expected number of individuals for each class A;, the probability pi and pi mo<j that a gene in a newborn individual derived from a parent of age class i. and the observed age data for a sample from the Canton of Aargau (for details see text).
Age Class i Ni* Pi Pi mod Observed data1 1 1 6 8 0 . 3 6 0 0 . 1 8 0 7 3
2 7 4 8 0 . 2 3 1 0 . 2 9 6 3 0
3 4 8 0 0 . 1 4 8 0 . 1 9 0 1 4
4 3 0 8 0 . 0 9 5 0 . 1 2 2 1 2
5 1 9 6 0 . 0 6 0 0 . 0 7 7 1 2
6 1 2 6 0 . 0 3 9 0 . 0 5 0 8
7 8 0 0 . 0 2 5 0 . 0 3 2 7
8 5 2 0 . 0 1 6 0 . 0 2 1 2
9 3 4 0 . 0 1 0 0 . 0 1 3 1
1 0 2 2 0 . 0 0 7 0 . 0 0 9 1
1 1 1 4 0 . 0 0 4 0 . 0 0 6 -
1 2 8 0 . 0 0 2 0 . 0 0 3 -
120

APPENDICES
A2: Performance of Di - vs. tetranucleotide microsatellite loci under
IBD.
In Chapter 2, additional analyses revealed a significant difference for the blog - values
between di - and tetranucleotide microsatellite loci (aT: n i = 13, m tetra = 4, W= 140, p
< 0.006; Ryj'. W= 99, p < 0.05; Wilcoxon rank sum tests, Table 3). Although there is a
significant difference, the reason is not clear. It is likely to be a sampling error,
considering the small sample size (n = 4). Therefore, calculations were conducted
using the total data set.
Based on dinucleotide loci only, the regression between pairwise genetic distance aT
and relatedness Rw with Euclidian distance remained significant (aT: p < 0.0001, r2 =
0.0098; R^: blog = - 0.0130,/? < 0.0001, r2 = 0.0050; Mantel test) and further resulted
in steeper multilocus regression slopes (<aT: blog = 0.0113; Rw: blog = - 0.01230).
Hence, the overall blog value calculated on individual genetic distance (aT) revealed a
smaller NS of 88.9 individuals (95% confidence interval = 60.0 - 171.2 individuals)
compared with the mean NS o f 135.1 individuals computed across all seventeen
microsatellites. Finally, the computed measure of fit (r2) for dinucleotide loci between
individual genetic and spatial matrices were consistently higher compared to r2 -
values calculated across all loci {e.g. aT for 1400m altitude threshold: r2 = 0.016).
Given the wide range of single locus He - values for both tetra - and dinucleotides
(Table 2), the dissimilarity between the observed blog - values, was unlikely to be
caused by differences in mutation rates between the two types of microsatellites as
emphasized by Leblois et al. ’s (2003) simulation study. Furthermore, an unintended
swap of individual samples during genotyping of tetranucleotide loci can be ruled out,
because both types of micosatellites were co-amplified within the same PCR reaction.
Based on the small sample size of loci compared in these analyses, the observed
differences between tetra- and dinucleotide loci in relation to IBD , should be thus
interpreted with caution. Nevertheless, comparing different types of microsatellites in
an IBD context might help to improve our understanding of the mutation process in
microsatellites.