spatial and temporal patterns of ch and n o fluxes in ... · ecosystems at global and regional...
TRANSCRIPT
Biogeosciences, 7, 2673–2694, 2010www.biogeosciences.net/7/2673/2010/doi:10.5194/bg-7-2673-2010© Author(s) 2010. CC Attribution 3.0 License.
Biogeosciences
Spatial and temporal patterns of CH4 and N2O fluxes in terrestrialecosystems of North America during 1979–2008: application of aglobal biogeochemistry model
H. Tian1,2, X. Xu1,2, M. Liu 1,2, W. Ren1,2, C. Zhang1, G. Chen1,2, and C. Lu1,2
1Ecosystem Dynamics and Global Ecology (EDGE) Laboratory, School of Forestry and Wildlife Sciences, AuburnUniversity, Auburn, AL, 36849, USA2International Center for Climate and Global Change Research, Auburn University, Auburn, AL, 36849, USA
Received: 16 March 2010 – Published in Biogeosciences Discuss.: 21 April 2010Revised: 30 August 2010 – Accepted: 1 September 2010 – Published: 10 September 2010
Abstract. Continental-scale estimations of terrestrialmethane (CH4) and nitrous oxide (N2O) fluxes over a longtime period are crucial to accurately assess the global bal-ance of greenhouse gases and enhance our understanding andprediction of global climate change and terrestrial ecosys-tem feedbacks. Using a process-based global biogeochem-ical model, the Dynamic Land Ecosystem Model (DLEM),we quantified simultaneously CH4 and N2O fluxes in NorthAmerica’s terrestrial ecosystems from 1979 to 2008. Dur-ing the past 30 years, approximately 14.69± 1.64 T g C a−1
(1 T g = 1012 g) of CH4, and 1.94± 0.1 T g N a−1 of N2Owere released from terrestrial ecosystems in North Amer-ica. At the country level, both the US and Canada actedas CH4 sources to the atmosphere, but Mexico mainly ox-idized and consumed CH4 from the atmosphere. Wetlandsin North America contributed predominantly to the regionalCH4 source, while all other ecosystems acted as sinks for at-mospheric CH4, of which forests accounted for 36.8%. Re-garding N2O emission in North America, the US, Canada,and Mexico contributed 56.19%, 18.23%, and 25.58%, re-spectively, to the continental source over the past 30 years.Forests and croplands were the two ecosystems that con-tributed most to continental N2O emission. The inter-annualvariations of CH4 and N2O fluxes in North America weremainly attributed to year-to-year climatic variability. Whileonly annual precipitation was found to have a significant ef-fect on annual CH4 flux, both mean annual temperature andannual precipitation were significantly correlated to annual
Correspondence to:H. Tian([email protected])
N2O flux. The regional estimates and spatiotemporal pat-terns of terrestrial ecosystem CH4 and N2O fluxes in NorthAmerica generated in this study provide useful informationfor global change research and policy making.
1 Introduction
Methane (CH4) and nitrous oxide (N2O) are two potentgreenhouse gases which in sum contribute to more than onefourth of global warming caused by anthropogenic activities(Forster et al., 2007). Although the concentrations of CH4and N2O in the atmosphere are relatively low, their warm-ing potentials are much higher than that of carbon dioxide(Denman et al., 2007). CH4 and N2O also play significantroles in ozone layer chemistry (Denman et al., 2007; Forsteret al., 2007). Similar to the increase of atmospheric CO2concentration, the concentrations of these two gases dramat-ically increased since the Industrial Revolution (Forster etal., 2007; Tueut et al., 2007; Rigby et al., 2008). Althoughthe importance of CH4 and N2O emissions in changing theEarth’s climate has been recognized, scientific communityhas placed large emphasis on the CO2 problem. Understand-ing and quantifying CH4 and N2O fluxes in terrestrial ecosys-tems at large spatial scales, therefore, becomes an urgent taskfor accurately predicting the future climate change (Rigby etal., 2008; Forster et al., 2007; Sheldon and Barnhart, 2009).
Terrestrial ecosystems could act as either sources or sinksfor atmospheric CH4 and N2O, depending on the timeand location (Liu, 1996; Potter, 1997; Ridgwell et al.,1999; Chapuis-Lardy et al., 2007; Xu et al., 2008). Glob-ally, natural sources from terrestrial ecosystems contribute
Published by Copernicus Publications on behalf of the European Geosciences Union.

2674 H. Tian et al.: Terrestrial fluxes of CH4 and N2O over North America
approximately 40% to the CH4, and more than half to theN2O releases to the atmosphere when removing oceanic con-tribution (Denman et al., 2007). North America, with itslarge land area and high proportion of natural wetland (ap-proximately 30% of the global wetland) (Bridgham et al.,2006; Mitsch and Gosselink, 2007), plays a critical role inglobal carbon cycling (Schimel et al., 2000). However, onlya few studies have investigated CH4 and N2O fluxes overterrestrial ecosystems in North America (Bridgham et al.,2006). For example, Zhuang et al. (2004) estimated thatsoils in Canada and Alaska emitted 7.1 and 3.8 T g CH4 a−1,respectively, during the 1990s. Bridgham et al. (2006) es-timated that CH4 emission in North America’s wetlands is9 T g CH4 a−1. Using a satellite-derived modeling approach,Potter et al. (2006) estimated that the CH4 emission from thenatural wetlands in the conterminous US is 5.5 T g CH4 a−1.Several studies also reported the fluxes of N2O in terrestrialecosystems at global and regional scales using empirical ap-proaches (Xu et al., 2008). While these studies improvedour understanding of CH4 and N2O fluxes in North America,accurate estimations of terrestrial ecosystem CH4 and N2Ofluxes in the entire continent over a long time period are stillneeded (Wofsy and Harriss, 2002).
Many factors can influence CH4 and N2O fluxes in terres-trial ecosystems at site and regional levels, such as elevatedCO2 (Hutchin et al., 1995; Schrope et al., 1999; Phillips etal., 2001a, 2001b), tropospheric ozone pollution (Morsky etal., 2008), nitrogen input (Ding et al., 2004), climate change(Goldberg and Gebauer, 2009) and land cover change (Willi-son et al., 1995; Huang et al., 2010). However, most previousprocess-based modeling efforts did not take into account theconcurrent effects of multiple global change factors (Potter,1997; Cao et al., 1998; Walter et al., 2001; Zhuang et al.,2007, 2004). Large uncertainty still exists in the magnitudes,spatial and temporal patterns of CH4 and N2O fluxes at largescales (Kort et al., 2008; Christensen et al., 1996; Zhuang etal., 2004; Bridgham et al., 2006; Potter et al., 2006).
Recently, we developed a process-based biogeochemistrymodel, the Dynamic Land Ecosystem Model (DLEM), tosimulate biogeochemical cycling of carbon, nitrogen and wa-ter in the land ecosystems. The DLEM considers multiplefactors including climate, atmospheric compositions (CO2,O3), precipitation chemistry (nitrogen composition), natu-ral disturbances (fire, insect/disease, hurricane, etc), land-use/land-cover change, and land management (harvest, ro-tation, fertilization, irrigation, etc.) (Tian et al., 2005, 2008,2010; Ren et al., 2007a, 2007b, 2009; Zhang et al., 2007,2008; Lu, 2009; Liu et al., 2008; Chen et al., 2006; Xu,2010). This model has been successfully applied to simulatethe effects of multiple environmental factors on carbon andwater cycles in China (Ren et al., 2007a, 2007b; Lu, 2009;Liu et al., 2008; Chen et al., 2006; Xu, 2010) and USA (Tianet al., 2008, 2010; Zhang et al., 2007, 2008).
In this study, we enhanced the model’s capability by ad-dressing the biogeochemical processes of CH4 and N2O and
simulated CH4 and N2O fluxes over terrestrial ecosystems inNorth America from 1979 to 2008. The objectives of thisstudy are: (1) to develop the CH4 and N2O modules in theframework of an extant process-based model, DLEM; (2) tocompare modeled results with field observations and otherregional estimates; (3) to estimate CH4 and N2O fluxes inNorth America’s terrestrial ecosystems from 1979 to 2008;and (4) to quantify the contributions of individual countriesand biomes to regional CH4 and N2O fluxes in North Amer-ica.
2 Methodology
2.1 The DLEM model and its trace gas modules
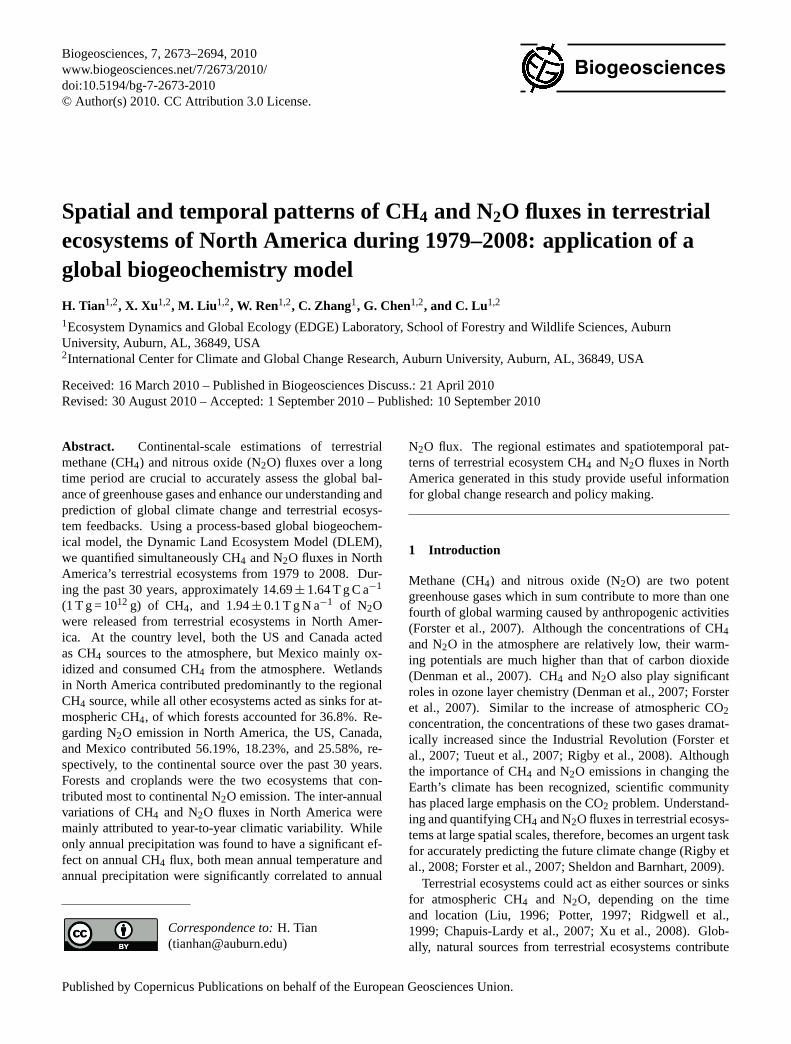
The Dynamic Land Ecosystem Model (DLEM) couples ma-jor biogeochemical cycles, hydrological cycles, and vegeta-tion dynamics to make daily, spatially-explicit estimates ofcarbon, nitrogen, and water fluxes and pool sizes (C andN) in terrestrial ecosystems. There are five core compo-nents in the DLEM: (1) biophysics, (2) plant physiology,(3) soil biogeochemistry, (4) dynamic vegetation, and (5) dis-turbance, land use and management. Briefly, the biophysicscomponent simulates the instantaneous fluxes of energy, wa-ter, and momentum within land ecosystems and their ex-changes with the surrounding environment. The plant phys-iology component simulates major physiological processes,such as plant phenology, C and N assimilation, respiration,allocation, and turnover. The soil biogeochemistry compo-nent simulates the dynamics of nutrient compositions andmajor microbial processes. The biogeochemical processes,including the nutrient mineralization/immobilization, nitrifi-cation/denitrification, decomposition, and methane produc-tion/oxidation are considered in this component. The dy-namic vegetation component simulates the structural dynam-ics of vegetation caused by natural and human disturbances.Two processes are considered: the biogeography redistribu-tion when climate change occurs, and the recovery and suc-cession of vegetation after disturbances. Like most dynamicglobal vegetation models, the DLEM builds on the concept ofplant functional types (PFT) to describe vegetation attributes.The disturbances, land use and management component sim-ulates cropland conversion, reforestation after cropland aban-donment, and forest management practices such as harvest,thinning, fertilization and prescribed fires.
The interactions and feedbacks of various processesamong core components are simulated as controls or materialflows (Fig. 1). The biophysics component yields influenceson plant physiology component through the effects of wa-ter, temperature and radiation, and on soil biogeochemistrycomponent through the effects of soil moisture and temper-ature; the plant physiology component yields influences onthe biophysics component through changes in leaf area in-dex (LAI), canopy conductance, and transpiration, on the soil
Biogeosciences, 7, 2673–2694, 2010 www.biogeosciences.net/7/2673/2010/
H. Tian et al.: Terrestrial fluxes of CH4 and N2O over North America 2675
Fig. 1. Conceptual model of the Dynamic Land Ecosystem Model (DLEM) (Five core components are included in the DLEM).
biogeochemistry component through litter-fall, and on thedynamic vegetation component through biomass growth; thedynamic vegetation component yields influences on the plantphysiology and soil biogeochemistry components throughshifts of plant function type (PFT); the soil biogeochemistrycomponent yields influences on the dynamics vegetation andplant physiology components through nutrient flow; distur-bances, land use and management component yields influ-ences on the other four components through changes in landcover type, PFT and nutrient and water flow (Fig. 1).
Meanwhile, the DLEM uses climate data from regionalclimate and atmosphere chemistry component which couldbe a climate model or input data. The DLEM outputs in-cluding ecosystem carbon and nitrogen pools and fluxes(e.g. greenhouse gases) will enter the atmosphere; and thewater output and associated nutrients from the DLEM willenter water transport module and flow into lake, river andocean. All the components are also linked together by waterand energy fluxes (Fig. 1).
The DLEM emphasizes the modeling and simulationof managed ecosystems including agricultural ecosystems,plantation forests and pastures. The spatial data sets ofland management, such as irrigation, fertilization, rotation,and harvest can be used as input information for simulat-ing influences of land management on the structure andfunctioning of ecosystems. This model has been calibrated
against various field data from US Long-Term EcologicalResearch (LTER) network, AmeriFlux network, and the Chi-nese Ecological Research Network (CERN) which cover var-ious ecosystems, including forests, grasslands, shrub, tundra,desert, wetland, and croplands. The major carbon, nitrogenand water variables have been validated with observationaldata. The simulated results have been compared with inde-pendent field data and satellite products. The DLEM oper-ates at a daily time step and at varied spatial resolutions, frommeters to kilometers, from regional to global. The additionalinformation on the processes, interactions and feedbacks inthe DLEM and associated input/output data (Fig. 1) can befound in our previous studies (Tian et al., 2005, 2008, 2010;Ren et al., 2007a, 2007b, 2009; Zhang et al., 2007, 2008; Lu,2009; Liu et al., 2008; Chen et al., 2006).
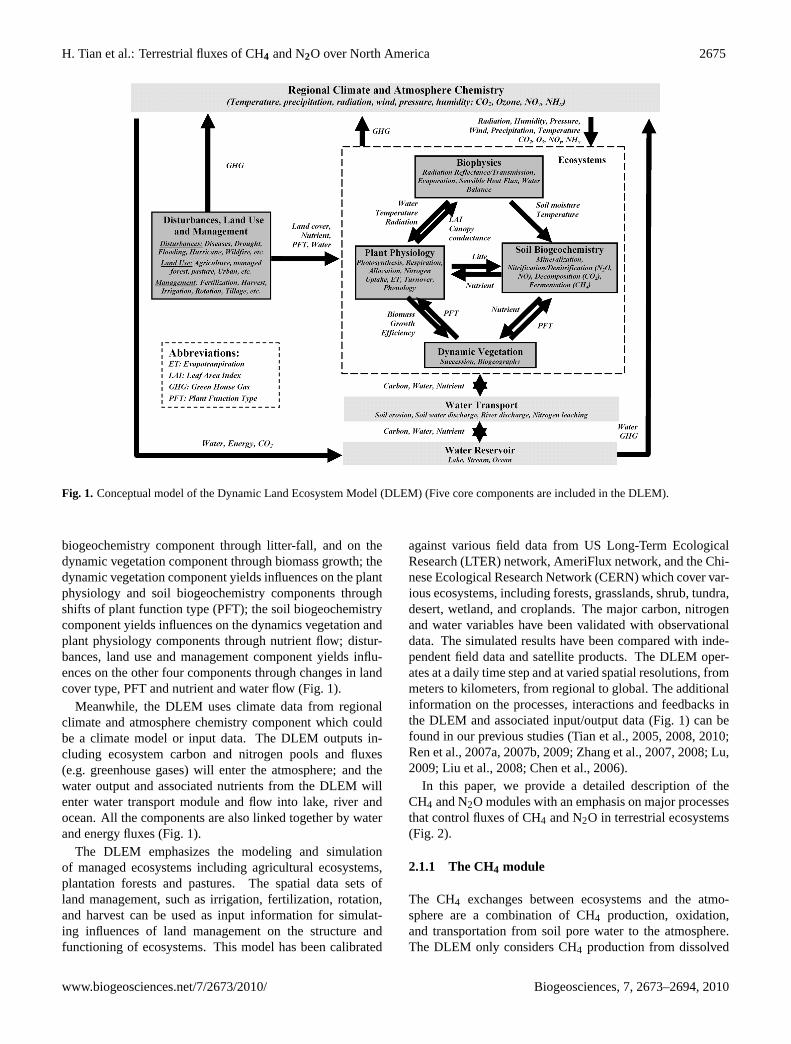
In this paper, we provide a detailed description of theCH4 and N2O modules with an emphasis on major processesthat control fluxes of CH4 and N2O in terrestrial ecosystems(Fig. 2).
2.1.1 The CH4 module
The CH4 exchanges between ecosystems and the atmo-sphere are a combination of CH4 production, oxidation,and transportation from soil pore water to the atmosphere.The DLEM only considers CH4 production from dissolved
www.biogeosciences.net/7/2673/2010/ Biogeosciences, 7, 2673–2694, 2010

2676 H. Tian et al.: Terrestrial fluxes of CH4 and N2O over North America
Fig. 2. Modules of CH4 and N2O in the Dynamic Land Ecosys-tem Model (DLEM) (CH4 production, oxidation, and transport areconsidered in the CH4 module; nitrification and denitrification areconsidered in the N2O module).
organic carbon (DOC), which is indirectly controlled by en-vironmental factors including soil pH, temperature and soilmoisture content. The production of DOC mainly comesfrom two sources: allocation of gross primary production(GPP) and decomposition of litter-fall and soil organic mat-ter. The accumulated DOC is either used as substrate formethane, leaves system as leachate, or enters the atmosphereas CO2 via decomposition. CH4 oxidation, including the ox-idation during CH4 transport to the atmosphere, CH4 oxida-tion in the soil pore water, and atmospheric CH4 oxidation onthe soil surface, is determined by CH4 concentrations in theair or soil pore water, as well as soil moisture, pH, and tem-perature. Most CH4-related biogeochemical reactions in theDLEM are described by using the Michaelis-Menten equa-tion with two coefficients: maximum reaction rate and halfsaturation coefficient. Three pathways for CH4 transportfrom soil to the atmosphere include ebullition, diffusion, andplant-mediated transport. It is assumed that methane-relatedbiogeochemical processes only occur in the top 50 cm of soilprofile. The net CH4 flux between the atmosphere and soil isdetermined by the following equation:
FCH4 = FP + FD + FE − Fair, oxid − Ftrans, oxid (1)
whereFCH4 is the flux of CH4 between soil and the atmo-sphere (g C m−2 d−1); FP is plant-mediated transport fromsoil pore water to the atmosphere (g C m−2 d−1); FD is thediffusive flux of CH4 from water surface to the atmosphere(g C m−2 d−1); FE is the ebullitive CH4 emission to the at-mosphere;Fair, oxid is the rate of atmospheric methane oxi-dation (g C m−2 d−1); Ftrans, oxid is the oxidized CH4 duringplant-mediated transport (g C m−2 d−1).
The concentration of CH4 in the soil pore water was gov-erned by the following equations:
d [CH4]
dt= f ([CH4]) (2)
= CH4prod −FP
H−
FD
H−
FE
H− CH4soil, oxid
where [CH4] is the concentration of CH4 in water (g C m−3);CH4prod is the production of CH4 in soil pore water(g C m−3 d−1); CH4soil, oxid is the oxidation rate of CH4 in soilpore water (g C m−3 d−1); H is the soil depth of the first layerfor methane production and oxidation.
CH4 production
The production of CH4 in soil pore water is controlled by theconcentration of DOC and environmental factors (Eq. 2),
CH4prod = Vprod, max ×[DOC]
[DOC] + Kmprod(3)
× f (Tsoil) × f (pH) × fprod(vwc)
where Vprod, max is the maximum rate of CH4 produc-tion (g C m−3 d−1), [DOC] is the concentration of DOC(g C m−3); Kmprod is the half-saturation coefficient of CH4production (g C m−3); f (Tsoil) is a multiplier that describesthe effect of soil temperature on CH4 production and oxida-tion; f (pH) is a multiplier that describes the effect of soil pHon CH4 production and oxidation;fprod(vwc) is a multiplierthat describes the effect of soil moisture on CH4 production.
CH4 oxidation
Three pathways are considered in the DLEM for CH4 oxi-dation: (1) atmospheric CH4 oxidation, also called the diffu-sion processes of CH4 from the atmosphere to the soil porewater, mainly simulates the oxidation of atmospheric CH4in the soil pore water; (2) the process of CH4 oxidation inthe soil pore water mainly simulates the oxidation of CH4which is dissolved in water or accumulated in soil poros-ity; and (3) the process of CH4 oxidation occurs during theplant-mediated transport of CH4 from soil pore water to theatmosphere. The DLEM assumes that the process of CH4oxidation in soil pore water includes the CH4 oxidation dur-ing ebullition and diffusion because these two processes onlyoccur in water.
Atmospheric CH4 oxidation
Oxidation of atmospheric CH4 is estimated as:
Fair, oxid = Vair, oxid, max ×[Atm CH4]
[Atm CH4] + Kmair, oxid(4)
× f (Tsoil) × f (pH) × foxid(vwc)
where Vair, oxid, max is the maximum oxidation rate of at-mospheric CH4 (g C m−2 d−1); kmair, oxid is the half satu-ration coefficient of atmospheric CH4 oxidation (g C m−3);
Biogeosciences, 7, 2673–2694, 2010 www.biogeosciences.net/7/2673/2010/

H. Tian et al.: Terrestrial fluxes of CH4 and N2O over North America 2677
[Atm CH4] is the atmospheric CH4 concentration (g C m−3);foxid(vwc) is a multiplier that describes the effect of soilmoisture on atmospheric CH4 oxidation. Because the atmo-spheric CH4 oxidation is mainly carried out by soil methan-otrophy, and low soil organic matter means lower soil micro-bial biomass (Conrad, 1996), the DLEM assumes that thereis no atmospheric CH4 oxidation when soil organic matter isless than 10 g C m−2.
CH4 oxidation during plant-mediated transport
During the process of plant-mediated CH4 transport from soilto the atmosphere, portions of CH4 will be oxidized at therate of:
Ftrans, oxid = min (5)(Vtrans, oxid, max ×
FP
FP + Kmtrans, oxid× f (Tair), FP
)whereFtrans, oxid is the oxidation rate of CH4 during plant-mediated transport (g C m−2 d−1); Vtrans, oxid, max is the max-imum rate of CH4 oxidation (g C m−2 d−1); Kmtrans, oxid isthe half saturation coefficient of soil CH4 oxidation duringtransportation (g C m−2); Tair is the air temperature;f (Tair)
is a multiplier that represents the effect of air temperature onthe oxidation of CH4 during plant-mediated transport.
Soil pore water CH4 oxidation
The accumulated CH4 in soil pore water is oxidized at therate of:
CH4soil, oxid = min(Vsoil, oxid, max (6)
×[CH4]
[CH4] + Kmsoil, oxid× f (Tsoil)
× f (pH) × foxid(vwc), [CH4])
whereVsoil, oxid, max andKmsoil, oxid are maximum soil porewater CH4 oxidation rate (g C m−3 d−1) and half saturationcoefficient of CH4 oxidation in soil pore water (g C m−3),respectively; [CH4] is the concentration of CH4 in soil porewater (g C m−3).
CH4 transport
In this model, ebullition, diffusion and plant-mediated trans-port, are considered the three pathways by which CH4 can betransported from soil pore water to the atmosphere.
Ebullition
The ebullition transport of CH4 from water to the atmosphereis estimated as:
FE = max (([CH4] − 6), 0) × H (7)
whereFE is the flux of CH4 from water to the atmospherevia ebullition (g C m−2 d−1); 6 is the threshold value above
which the dissolved CH4 will form bubbles and leave water(g C m−3), and is equals to 0.5 mol CH4 m−3 (Walter et al.,2001). Because this process occurs in very short time (Walteret al., 2001; Zhuang et al., 2004), the DLEM assumes that allthe dissolved CH4 above this threshold value will leave watervia bubbles in one day.
Plant-mediated transport
The plant-mediated CH4 emission from water to the atmo-sphere is estimated as:
FP = Vplant, trans× ([CH4] − [CH4]max) (8)
× min
(GPP
GPPmax, 1
)[CH4]max = [Atm CH4] × β (9)
where FP is the CH4 transport via vascular plant (g Cm−2 d−1); Vplant, trans is the transport coefficient of CH4transportation through plant (m d−1), which is set as 0.68(Kettunen, 2003); [CH4]max is the maximum CH4 concentra-tion in soil solution (g C m−3); GPP is the gross primary pro-ductivity of current day (g C m−2 d−1); GPPmax is the maxi-mum daily GPP (g C m−2 d−1), which is set as 5 in this study;β is the Bunsen solubility coefficient (0.035 ml ml−1) (Ya-mamoto et al., 1976). Since there is no report on the plant-mediated transport of CH4 by woody plant, the DLEM as-sumes that the plant-mediated transport only occurs in herba-ceous biomes;FP is set to zero for all woody ecosystems.
Diffusion
The DLEM treats the top 0.5 m of the soil profile as one layer,and the CH4 generated under water’s surface is assumed tohave a fast diffusion rate to water’s surface. The diffusionestimated here is the exchange of CH4 between the watersurface and the atmosphere.
FD= Vexchange× ([CH4] − [CH4]max) (10)
whereVexhangeis the exchange coefficient of CH4 throughthe interface of soil pore water and the atmosphere (m d−1);it is set as 0.3 m d−1 (Happell and Chanton, 1995).
Environmental factors affecting methane processes
To simulate the environmental effects on methane produc-tion, oxidation and transport, the DLEM considers three en-vironmental factors: soil pH, soil moisture, and temperature.These three factors have been considered as the most impor-tant external factors on CH4 production, consumption, andtransport (Cao et al., 1995; Huang et al., 1998; Mer andRoger, 2001; Zhuang et al., 2004). The line graphs showingthe environmental controls on CH4 production and consump-tion could be found in the Fig. 3.
In the DLEM, the effect of soil pH on methane productionand oxidation (f (pH)) is calculated as a bell shape curve,
www.biogeosciences.net/7/2673/2010/ Biogeosciences, 7, 2673–2694, 2010

2678 H. Tian et al.: Terrestrial fluxes of CH4 and N2O over North America
Fig. 3. Graphs showing environmental effects on methane pro-duction and oxidation –(A) pH effects; (B) Temperature effect;(C) Moisture effects on methane production and oxidation.
following Cao et al. (1995) and Zhuang et al. (2004). Giventhat a number of reports showing CH4 production and con-sumption at the circumstances of pH< 5 or pH> 9 (Amaralet al., 1998; Mer and Roger, 2001; Sorokin et al., 2000),we set the effects of soil pH on CH4 production and oxida-tion to zero when soil pH is smaller than 4 or larger than 10(Eq. 11), which is different from Zhuang et al. (2004) andCao et al. (1995).
f (pH)=
0 pH≤ 4.0 or pH≥ 10.0
1.021+1 000 000×e(−2.5×pH) 4.0<pH<7.0
1.021+1 000 000×e(−2.5×(14.0−pH)) 7.0<pH<10.0
(11)
where pH is the pH value of the soil profile.The effect of temperature on methane processes (f (T ))
is estimated byQ10 response curve which has been used byHuang et al. (1998). The difference between our model andHuang et al.’s (1998) model is that we set theQ10 as 2.5(Song et al., 2009), rather than 3.
f (T ) =
0.0 T < −5
QT − 30
1010 30> T ≥ −5
1 T ≥ 30
(12)
whereQ10 is a scalar for the temperature sensitivity;T istemperature of soil or air.
The effect of soil moisture on methane processes is esti-mated based on the volumetric water content in the top soillayer (50 cm). Methane production and methane oxidationhave reciprocal responsive curves to soil moisture.
fprod(vwc)= (13)0 vwc≤ vwcfc(
vwc−vwcfcvwcsat−vwcfc
)2×0.368×e
(vwc−vwcfc
vwcsat−vwcfc
)vwcfc<vwc<vwcsat
1 vwc≥ vwcsat
foxid (vwc) = 1 − fprod (vwc) (14)
where vwc is the volumetric water content of the top soillayer; vwcfc is the field capacity and vwcsat is the saturatedwater content. It is assumed that when the soil water contentof an upland ecosystem is greater than field capacity, the ex-tra water will percolate or leave the system as base-flow sothat soil moisture is always under saturation.
2.1.2 The N2O module
In the DLEM, both denitrification and nitrification processesare simulated as one-step process because we do not considerthe mid-products in each process.
Nitrification
Nitrification, a process converting ammonium into nitrate, issimulated as a function of soil temperature, moisture, andsoil NH+
4 concentration (Lin et al., 2000).
Nnit = min(Npot, nit, NNH4
)(15)
Npot, nit = Vnit, max ×NNH4
NNH4 + Kmnit(16)
× fnit(Tsoil) × fnit (vwc)
fnit(Tsoil) = Q
(Tsoil−Topt, nit
10
)10nit
(17)
fnit(vwc) =
{1.17×
vwcvwcfc
+ 0.165 vwc< vwcfc
1 − 0.1 ×vwc
vwcfcvwc ≥ vwcfc
(18)
whereNnit is the nitrification rate (g N m−3 d−1); Npot, nitis the potential nitrification rate (g N m−3 d−1); NNH4 is theconcentration of NH+4 in the soil (g N m−3); Vnit, max is a pa-rameter describing potential nitrification rate without limita-tion (g N m−3 d−1); Kmnit is the half-saturation concentrationof soil NH+
4 for the maximum nitrification rate (g N m−3);fnit(Tsoil) is a multiplier that describes the effect of soil tem-perature on nitrification;Tsoil is the soil temperature (◦C);fnit(vwc) is a multiplier that describes the effect of watercontent on nitrification (Lin et al., 2000; Riedo et al., 1998);Q10, nit is the temperature sensitivity of nitrification, which
Biogeosciences, 7, 2673–2694, 2010 www.biogeosciences.net/7/2673/2010/

H. Tian et al.: Terrestrial fluxes of CH4 and N2O over North America 2679
is set as 2;Topt, nit is the optimum temperature for nitrifica-tion, which is set as 20◦C following Rideo et al. (1998) andLin et al. (2000); vwc is the volumetric water content; andvwcfc is the soil field capacity.
Denitrification
Denitrification, through which the nitrate is converted intonitrogen gas, is simulated in the DLEM as a function of soiltemperature, moisture, and soil NO−
3 concentration (Lin etal., 2000).
Ndenit = min(Npot, denit, NNO3
)(19)
Npot, denit = Vdenit, max ×NNO3
NNO3 + Kmdenit(20)
× fdenit(Tsoil) × fdenit(vwc)
fdenit (Tsoil) = Q
Tsoil−Topt, denit10
10,denit (21)
fdenit(vwc) =
{0.0 vwc< vwcfcvwc
vwcfcvwc ≥ vwcfc
(22)
where Ndenit is the denitrification rate (g N m−3 d−1);Npot, denit is the potential nitrification rate (g N m−3 d−1);NNO3 is the concentration of NO−3 in the soil (g N m−3);Vdenit, max is a parameter describing potential denitrificationrate without limitation (g N m−3 d−1); Kmdenit is the half-saturation concentration of soil NO−3 for the maximum den-itrification rate (g N m−3); fdenit(Tsoil) is a multiplier thatdescribes the effect of soil temperature on denitrification;fdenit(vwc) is a multiplier that describes the effect of wa-ter content on denitrification (Lin et al., 2000; Riedo et al.,1998);Q10, denit is the temperature sensitivity of denitrifica-tion, which is set as 3; andTopt, denit is the optimum temper-ature for denitrification, which is set as 25◦C following Linet al. (2000).
N2O emission
All the products of nitrification and denitrification arenitrogen-containing gases. The empirical equation reportedby Davidson et al. (2000) is used to separate N2O from othergases (mainly NO and N2).
FNO2 = (0.001× Nnitrif + Ndenitrif) (23)
×10vwc/Ø×0.026−1.66(
1 + 10vwc/Ø×0.026−1.66)
whereFN2O is the fluxes of N2O from soil to the atmosphere(g N m−3 d−1), 0.001 is the proportion of nitrification prod-uct released as gaseous nitrogen (Lin et al., 2000), and it isconverted to fluxes in the unit area (g N m−2 d−1) by multi-plying the depth of the first soil layer (0.5 m); Ø is the soilporosity.
2.2 Input data preparation, model initialization andsimulation
We developed gridded (32 km× 32 km), geo-referenced,time-series input data sets of climate (including dailytemperature, precipitation, humidity, and solar radia-tion), annual nitrogen deposition rate, annual land-coverchange and land management practices (including fertil-ization, irrigation) for the entire North America (includ-ing Canada, the US, and Mexico). The climate datasetwas generated based on North American Regional Reanaly-sis (NARR) dataset (http://nomads.ncdc.noaa.gov/data.php?name=access#narrdatasets). The maximum, minimum andaverage temperatures were calculated based on the eight 3-haverage in one day. Precipitation, solar radiation, and rela-tive humidity were directly derived from the NARR dataset.Land-use and land-cover change data were extracted from aglobal data set developed by History Database of the GlobalEnvironment (HYDE 3). Ozone data was retrieved fromthe global dataset developed by Felzer et al. (2005) cover-ing 1900–2050. Annual nitrogen deposition data were re-trieved from a global data set that was extrapolated from athree yearly maps (Dentener et al., 2006). Soil propertiesdata, including soil texture, soil pH, soil bulk density, wereextracted from a global data set Global Soil Data Task postedonline in the Oak Ridge National Laboratory (daac.ornl.gov).Fertilization data for North America was developed by com-bining several data sources, including Food and AgricultureOrganization (FAO) country-level data (www.fao.org), UScounty-level data (www.usda.gov), and Canada provincial-level data source (www.cfi.ca). All the datasets were trans-formed and re-projected to a consistent projection system fordriving the DLEM model. The annual atmospheric concen-tration of CO2 before 1959 was estimated by VEMAP (TheVegetation/Ecosystem Modeling and Analysis Project), andthe data after 1959 were provided by National Oceanic andAtmospheric Administration (NOAA) (www.esrl.noaa.gov).The distributional map of contemporary vegetation types(Fig. 4) was developed using different sources of data, in-cluding global land-cover derived from Landsat imagery(De Fries et al., 1998), National Land Cover Dataset 2000(www.usgs.gov), and global database of lakes, reservoirs andwetland (Lehner and Doll, 2004). It is assumed that the ice-covered land is not capable of producing or taking up CH4and N2O, and thus was not considered in present simulation.
The implementation of DLEM simulation includes the fol-lowing runs: (1) equilibrium run, (2) spinning-up run and(3) transient run. In this study, we used potential vegetation,long-term mean climate during 1979–2008, the concentra-tion levels of nitrogen deposition, ozone, atmospheric CO2in the year 1900 to drive the model run to an equilibriumstate (i.e. the inter-annual variations are< 1 g m−2 for carbonstorage,< 0.1 g m−2 for nitrogen storage). After the systemreaches equilibrium state, the model was run with an addi-tion of cropland and urban areas for another 3000 years for
www.biogeosciences.net/7/2673/2010/ Biogeosciences, 7, 2673–2694, 2010

2680 H. Tian et al.: Terrestrial fluxes of CH4 and N2O over North America
Fig. 4. Contemporary vegetation map used in this study (The year2000 is shown).
spinning-up purposes. Finally, the model was run in tran-sient mode with daily climate data, annual CO2 concentra-tion and nitrogen deposition inputs from 1901 to 2008 to sim-ulate CH4 and N2O fluxes. The annual climate data between1901 and 1978 were developed by randomly assigning a yearbetween 1979 and 2008. Only the outputs between 1979 and2008 were analyzed to show the spatial and temporal patternsof CH4 and N2O fluxes in North America’s terrestrial ecosys-tems. Similar to other terrestrial biosphere models (McGuireet al., 2001), urban is treated as grassland.
2.3 Model parameterization
In this study, we used Bayesian calibration for model pa-rameterization, which is to determine the optimal value foreach parameter in the CH4 and N2O modules. A set of ma-jor parameters related to CH4 and N2O processes were listedwith their prior values for simulation (Table 1). Based onthese prior parameters and measured site-level fluxes of CH4(Table 2) and N2O (Table 3), we used Monte Carlo methodto find the optimal value for each parameter (Robert andCasella, 2005; Ricciuto et al., 2008). The parameters thatgive the best fit to the observational fluxes were considered asthe optimal parameters and used for the regional simulation.
Because the site-level climatic data are not always available,we retrieved the site-level data from our regional dataset. Weused measurement data of CH4 and N2O fluxes from fieldsites outside North America if the site-specific data of thesefluxes for a specific ecosystem type are not available in NorthAmerica. The sites chosen for model parameterization in-cluded 20 sites for CH4 fluxes (Table 2), and 18 sites for N2Ofluxes (Table 3). Finally, a suite of parameters (eight for CH4module, and four for N2O module) for each plant functionaltype were identified for regional model simulation (Tables 4and 5).
2.4 Model verification
Two forest sites (Durham forest and Hubbard Brook for-est) and two wetland sites (Alaska wetland and Sallie’s fen)not used in model parameterization were selected for site-level model verification (Fig. 5). We obtained the observa-tional flux data from various sources including The US TraceGas Network (TRAGNET) online dataset (http://www.nrel.colostate.edu/projects/tragnet/), field observations in Hub-bard Brook forest by Groffman et al. (2006, 2009) and Sal-lie’s fen (P. Crill, personal communication, 2008). Foursimulations for CH4 and one for N2O showed that modelresults are significantly correlated with observational dataeven though the DLEM model underestimated some fluxes(Fig. 5a–e). While the general seasonal patterns of CH4flux at these sites were consistent with the observations, theDLEM model did not capture a few CH4 flux pulses duringthe peak growing season in the Sallie’s fen (Fig. 5c), andunderestimated CH4 flux at Alaskan wetland site (Fig. 5b).For the N2O flux, the DLEM model well captured the sea-sonal pattern and annual flux of N2O in Hubbard Brook for-est, but missed several spikes in observational data (Fig. 5e).This phenomenon of peak fluxes in CH4 and N2O has beenobserved in a number of field studies (Chapuis-Lardy et al.,2007; Song et al., 2009), but the underlying mechanisms stillremain unknown.
The quantitatively point-to-point comparisons of the mod-eled and observed data also show that the DLEM capturedthe seasonal patterns of CH4 and N2O fluxes in terrestrialecosystems at site level. The statistical results could be foundin Fig. 5. Comparisons between CH4 flux with soil tempera-ture and precipitation indicate that the soil temperature is themajor factor controlling CH4 and N2O fluxes at site-level.The soil temperature is negatively correlated with CH4 up-take at Durham forest and Hubbard forest sites; while theprecipitation events did cause some spikes in CH4 emission(Fig. 5). For the Alaska wetland and Sallie’s fen, temper-ature control on CH4 emission was obvious, while the pre-cipitation did not show apparent effects on CH4 emission.For the N2O emission, temperature effect was shown at sea-sonal scale, while the precipitation effect appeared at dailyscale. This hierarchical control on N2O emission was con-sistent with a field study (Brumme et al., 1999).
Biogeosciences, 7, 2673–2694, 2010 www.biogeosciences.net/7/2673/2010/

H. Tian et al.: Terrestrial fluxes of CH4 and N2O over North America 2681
Fig. 5. Comparison of the DLEM-estimated CH4 and N2O fluxes with field observations –(A) CH4 flux in Durham Forest (42◦ N, 73◦ W)(TRAGNET); (B) CH4 flux in Alaska wetland (64.8◦ N, 147.7◦ W) (TRAGNET); (C) CH4 flux in Sallie’s fen (43.21◦ N, 71.05◦ W) ;(D) CH4 flux in Hubbard Brook Forest (43.95◦ N, 71.74◦ W) (Groffman et al., 2006, 2009);(E) N2O flux in Hubbard Brook Forest (43.95◦ N,71.74◦ W) (Groffman et al., 2006, 2009). The error bars in Fig. 4d and e represent the standard deviations of four or five replicated obser-vations; the regression models for these five site-level validations are: Modeled = 0.9389× observed,r = 0.562,P < 0.001 for (A); Mod-eled = 0.5882× observed,r = 0.628,P < 0.001 for (B); Modeled = 0.8795× observed,r = 0.502,P < 0.001 for (C) when fluxes higher than1000 mg C m−2 day−1 were removed; Modeled = 0.7937× observed,r = 0.595,P < 0.001 for (D); Modeled = 0.7042× observed,r = 0.633,P < 0.001 for (E)
Although the reliability of simulated CH4 and N2Ofluxes was shown as the comparison with observational data(Fig. 5), inconsistencies exist, i.e. the underestimation ofCH4 emission in Sallie’s fen and simulated peak in CH4 fluxthat were rarely shown in observational data for Durham for-est (Fig. 5). For the simulated CH4 peak while rarely shownin observations, it might due to the low sampling frequencyof field work. The underestimation of CH4 emission in Sal-lie’s fen might be due to either the external environmental
trigger which are not included in the model (Tokida et al.,2007; Shoemaker and Schrag 2010), or the contribution toCH4 from the microbial mat systems during summer season(Shoemaker and Schrag, 2010).
www.biogeosciences.net/7/2673/2010/ Biogeosciences, 7, 2673–2694, 2010

2682 H. Tian et al.: Terrestrial fluxes of CH4 and N2O over North America
Table 1. Prior estimates of the major parameters for methane and nitrous oxide modules in the Dynamics Land Ecosystem Model (DLEM).
Parameter Category Value Range Literature
VCH4ProMax (g C m−3 day−1) Aerobic 0.0207 0.0033–0.1306 Segers, 1998Intermediate 0.4 0.0394–3.9418 Segers, 1998Anaerobic 0.75 0.0313–4.9624 Segers, 1998
VCH4OxidairMax (g C m−3 day−1) 0.10 < 0.001-103.7 Sitaula et al., 1995; Segers, 1998;Saari et al., 2004
VCH4OxidtransMax(g C m−3 day−1) 0.5 0->51.84 Segers, 1998
VCH4Oxidsoilmax(g C m−3 day−1) 0.5 0->51.84 Segers, 1998
KmCH4Prod (g C m−3) 10 1.68–91.2 Lokshina et al., 2001
KmCH4Oxidair (ppm) 10 5–18 Nedwell and Watson, 1995;Arah and Stephen, 1998;Saari et al., 2004
KmCH4Oxidtrans(g C m−3) 5 0.33–19.95 Harrison, 1973; Joergensen, 1985;Linton and Buckee, 1977; Lamb andGarver, 1980;Nagai et al., 1973;O’Neill and Wilktnson, 1977;Ferenci et al., 1975
KmCH4Oxidsoil (g C m−3) 10 0.33–19.95 Ferenci et al., 1975; Nagai et al.,1973; Linton and Buckee, 1977;Lamb and Garver, 1980; Joergensen,1985; Harrison, 1973; O’Neilland Wilktnson, 1977
Vmax, denit (g N m−3 day−1) Natural 0.01 0–0.109 Kim et al., 1997; Garcia-Ruizecosystems et al., 1998; Starry
et al., 2005Cropland 0.05 0–1.0*
Kdenit (g N m−3) Natural 0.75 0.183–6.5 Garcia-Ruiz et al., 1998;ecosystems Yu et al., 2006Cropland 1.5 1–10**
Vmax, nit (g N m−3 day−1) Natural 0.02 0–2.18 Kim et al., 1997;ecosystems Sheibley et al., 2003Cropland 0.05 0–5*
Knit (g N m−3) Natural 0.75 0.21–1.11 Sheibley et al., 2003ecosystemsCropland 1.5 1–10**
∗ Assume cropland has two time higher maximum rate for nitrification and denitrification, and higher half-saturation coefficient than natural ecosystems based on Wang et al.’s (2009)
study.∗∗ Assume cropland has higher half-saturation coefficient for nitrification and denitrification than natural ecosystems.
3 Results and analyses
3.1 Temporal patterns of CH4 and N2O fluxes in NorthAmerica
The annual fluxes of CH4 and N2O over the entire NorthAmerica showed significant fluctuations during 1979–2008.The highest CH4 emission was 18.42 T g C a−1 in 2005,and the lowest was 11.74 T g C a−1 in 1998. Before 2001,
the annual CH4 flux was relatively constant with no obvi-ous trend of change; however, since 2002 the CH4 emis-sion rate increased rapidly, reached the maximum in 2005,and decreased slightly since then (Fig. 6). The overall in-creasing rate of CH4 flux was 0.10 T g C a−1 over the past30 years. The highest N2O emission was 2.25 T g N a−1 in2007, and the lowest was 1.66 T g N a−1 in 1999 (Fig. 6).The overall increasing rate of N2O was 0.01 T g C a−1 over
Biogeosciences, 7, 2673–2694, 2010 www.biogeosciences.net/7/2673/2010/

H. Tian et al.: Terrestrial fluxes of CH4 and N2O over North America 2683
Table 2. Study sites from which CH4 and auxiliary data were collected and used in the calibration of the Dynamics Land Ecosystem Model(DLEM).
Site Vegetation type Location Reference
Glacier Lakes Ecosystem Subalpine meadow (tundra) 41.33◦ N, 106.22◦ W Mosier et al., 1993Experiment Site*Bonanza Creek Boreal broad leaf deciduous forest 64.8◦ N, 148.0◦ W Whalen et al., 1991Experimental ForestBonanza Creek Boreal needle leaf evergreen forest 64.8◦ N, 148.0◦ W Whalen et al., 1991Experimental ForestSaskatchewan boreal forest* Boreal needle leaf evergreen forest 53.92◦ N, 104.69◦ W Matson, 2008Konstanz*,** Temperate broad leaf deciduous forest 49,00◦ N, 8.00◦ E Koschorreck and
Conrad, 1993Weiherbach*,** Temperate broad leaf deciduous forest 49.17◦ N, 8.72◦ E Dorr et al., 1993Changbaishan** Temperate broad leaf deciduous forest 46.6◦ N, 128.47◦ E Xiao et al., 2004Changbaishan** Temperate broad leaf evergreen forest 46.6◦ N, 128.47◦ E Xiao et al., 2004Gongga Mountain** Temperate needle leaf evergreen forest 29.0∼ 30.33◦ N, 101.5∼ 102.25◦ E Dong et al., 2003Pujo*,** Tropical dry forest 1.39◦ S, 78.00◦ W Dorr et al., 1993Congo river basin*,** Tropical rain forest 1.5◦ N, 18.0◦ E Tathy et al., 1992Konstanz*,** Temperate mixed forest 49,00◦ N, 8.00◦ E Koschorreck and Conrad, 1993Sanjiang** Deciduous shrub 47.69◦ N, 133.52◦ E Song et al., 2009“Castel Volturno” Nature Evergreen shrub 40.95◦ N, 1.55◦ E Castaldi and Fierro, 2005Reserve*,**Central Plains C3 grassland 40.8◦ N, 104.75◦ W Mosier et al., 1996Experimental RangeCentral Plains C4 grassland 40.83◦ N, 104.7◦ W Mosier et al., 2002Experimental RangeSanjiang** Herbaceous wetland 47.69◦ N, 133.52◦ E Song et al., 2009Marcell Experimental Forest* Woody wetland 47.53◦ N, 93.47◦ W Dise, 1991High Plains Agricultural Cropland 41.23◦ N, 103.00◦ W Kessavalou et al., 1998Research Laboratory*Mojave Desert* Desert 37◦ N, 116◦ W Strieg et al., 1992
* Indicates portions of model-driven forces from regional dataset; ** indicates site outside of the continental North America.
Fig. 6. CH4 and N2O fluxes in North America’s terrestrial ecosys-tems by countries during 1979–2008.
the past 30 years. The mean annual fluxes over the past30 years in North America’s terrestrial ecosystems were14.69± 1.64 T g C a−1 for CH4 and 1.94± 0.16 T g N a−1 forN2O, respectively.
3.2 Spatial distributions of CH4 and N2O fluxes inNorth America
The CH4 and N2O fluxes over the entire continent of NorthAmerica showed significant spatial variations (Fig. 7). Thespatial pattern of CH4 fluxes was mostly dependent on thebiome distribution, with a major source located in northwest-ern part of North America, a region mainly featuring naturalwetland. The southwestern part of North America acted asa sink for atmospheric CH4. A weak sink of CH4 was alsoshown in the northeastern part of North America.
All terrestrial ecosystems in North America acted assources for atmospheric N2O. The strong sources in south-eastern part of North America included the southeasternUS and entire Mexico, where N2O emission reached ashigh as 0.8 g N m−2 a−1. The weak N2O sources were ob-served in other areas, for example, the north part of North
www.biogeosciences.net/7/2673/2010/ Biogeosciences, 7, 2673–2694, 2010

2684 H. Tian et al.: Terrestrial fluxes of CH4 and N2O over North America
Table 3. Study sites from which N2O and auxiliary data were collected and used in the calibration of the Dynamics Land Ecosystem Model(DLEM).
Site Vegetation type Location Reference
Glacier Lakes Ecosystem Tundra 41.33◦ N, 106.33◦ W Sommerfeld et al., 1993Experiment Site*Saskatchewan boreal forest* Boreal broad leaf deciduous forest 53.92◦ N, 104.69◦ W Matson, 2008Saskatchewan boreal forest* Boreal needle leaf evergreen forest 53.92◦ N, 104.69◦ W Matson, 2008Changbaishan** Temperate broad leaf deciduous 46.6◦ N, 128.47◦ E Xiao et al., 2004forestChangbaishan** Temperate broad leaf evergreen 46.6◦ N, 128.47◦ E Xiao et al., 2004forestGongga Mountain** Temperate needle leaf evergreen 29.0∼ 30.33◦ N, 101.5∼ 102.25◦ E Dong et al., 2003forestRondnia*,** Tropical dry forest 10.5◦ S, 62.5◦ W Garcia-Montiel et al., 2002Rondnia*,** Tropical rain forest 10.5◦ S, 62.5◦ W Garcia-Montiel et al., 2002Changbaishan** Temperate mixed forest 46.6◦ N, 128.47◦ E Xiao et al., 2004Sanjiang** Deciduous shrub 47.69◦ N, 133.52◦ E Song et al., 2009Arid Lands Ecology Reserve*,** Evergreen shrub 46.37◦
∼ 46.56◦ N, 119.47◦ ∼ 119.78◦ W Mummey et al., 1997Neimenggu** C3 grassland 43.03◦ N, 119.15◦ E Huang et al., 2003Central Plains C4 grassland 40.83◦ N, 104.7◦ W Mosier et al., 2002Experimental RangeSanjiang** Herbaceous wetland 47.69◦ N, 133.52◦ E Song et al., 2009Saskatchewan boreal forest* Woody wetland 53.63◦ N, 106.20◦ W Matson, 2008Arthur Post Farm in Bozeman* Cropland 45.67◦ N, 111.15◦ W Dusenbury et al., 2008High Plains Agricultural Cropland 41.23◦ N, 103.00◦ W Kessavalou et al., 1998Research Laboratory*Mojave Desert* Desert 36.82◦ N,115.92◦ W Billings et al., 2002
* Indicates portions of model-driven forces from regional dataset; ** indicates site outside of the continental North America.
Fig. 7. Spatial distribution of(A) CH4 and(B) N2O fluxes in North America’s terrestrial ecosystems during 1979–2008.
America where N2O was released at a rate of approximately0.01 g N m−2 a−1.
3.3 CH4 and N2O fluxes in different countries
The US, Canada, and Mexico are three diverse countrieswith different landscapes and anthropogenic activities,
resulting in various CH4 and N2O flux regimes. Atthe country level, CH4 flux was 7.16± 0.58 T g C a−1
for the US, 7.68± 1.59 T g C a−1 for Canada, and−0.15± 0.03 T g C a−1 for Mexico. The US and Canadaaccounted for 48.76% and 52.29%, respectively, andMexico captured 1.05% of the continental emissionof CH4 (Fig. 6). The country level N2O flux was
Biogeosciences, 7, 2673–2694, 2010 www.biogeosciences.net/7/2673/2010/

H. Tian et al.: Terrestrial fluxes of CH4 and N2O over North America 2685
Table 4. Values of the major parameters for different ecosystem types in methane module after the Bayesian calibration.
Major ecosystem type VCH4ProMax VCH4OxidairMax VCH4Oxidtrans VCH4Oxidsoilmax KmCH4Prod KmCH4Oxidair KmCH4Oxidtrans KmCH4Oxidsoil(g C m−3 day−1) (g C m−3 day−1) (g C m−3 day−1) (g C m−3 day−1) (g C m−3) (ppm) (g C m−3) (g C m−3)
Tundra 0.25 0.085 0.1 0.1 10 10 2.5 3Boreal broad leaf 0.35 0.08 0.1 0.1 10 10 2.5 3deciduous forestBoreal needle leaf 0.35 0.071 0.1 0.1 10 10 2.5 3evergreen forestTemperate broad leaf 0.25 0.042 0.2 0.1 15 10 2.5 3deciduous forestTemperate broad leaf 0.4 0.027 0.1 0.1 15 10 2.5 3evergreen forestTemperate needle leaf 0.65 0.039 0.1 0.1 15 10 2.5 3evergreen forestTropical dry forest 0.5 0.02 0.1 0.1 15 10 2.5 3Tropical rain forest 0.45 0.015 0.1 0.1 15 10 2.5 3Temperate mixed forest 0.65 0.048 0.1 0.1 15 10 2.5 3Deciduous shrub 0.5 0.031 0.25 0.1 15 10 2.5 3Evergreen shrub 0.25 0.02 0.2 0.1 15 10 2.5 3C3 grassland 0.5 0.03 0.2 0.1 15 10 2.5 3C4 grassland 0.6 0.02 0.1 0.1 15 10 2.5 3Herbaceous wetland 1.45 0.032 5 2.5 5 10 3.5 3.5Woody wetland 0.55 0.032 5 2.5 5 10 3.5 3.5Cropland (dry land) 0.4 0.02 0.3 0.35 15 10 10 12Desert 0.25 0.05 0.25 0.1 15 10 2.5 3
Table 5. Values of the major parameters for different ecosystem types in nitrous oxide module after the Bayesian calibration.
Major ecosystem type Vdenimax Kdeni Vnitmax Knit(g Nm−3 day−1) (g Nm−3) (g Nm−3 day−1) (g Nm−3)
Tundra 0.03 0.15 0.008 1Boreal broad leaf 0.013 0.035 0.0025 1deciduous forestBoreal needle leaf 0.05 0.05 0.003 1evergreen forestTemperate broad leaf 0.012 0.15 0.0025 1deciduous forestTemperate broad leaf 0.007 0.75 0.03 1evergreen forestTemperate needle leaf 0.012 0.15 0.01 1evergreen forestTropical dry forest 0.008 0.25 0.004 1Tropical rain forest 0.0065 0.15 0.006 1Temperate mixed forest 0.012 0.15 0.01 1Deciduous shrub 0.055 0.5 0.005 1Evergreen shrub 0.16 0.75 0.0025 1C3 grassland 0.055 0.75 0.005 1C4 grassland 0.035 0.75 0.0035 1Herbaceous wetland 0.007 0.5 0.005 1Woody wetland 0.0013 0.35 0.005 1Cropland (dry land) 0.052 4.5 0.25 5Desert 0.01 0.05 0.005 1
1.09± 0.08 T g N a−1 for the US, 0.35± 0.04 T g N a−1
for Canada, and 0.50± 0.08 T g N a−1 for Mexico. The US,Canada, and Mexico accounted for 56.19%, 18.23%, and25.58%, respectively, of the continental emission of N2O(Fig. 6).
The rate of changes in CH4 and N2O fluxes varied amongcountries. Based on the regression analysis, we estimatedthat over the past 30 years, CH4 emission increased at ratesof 5.7 G g C a−1 (1 G g = 109 g) in the US and 91.7 G g C a−1
in Canada, while CH4 consumption increased 0.2 G g C a−1
www.biogeosciences.net/7/2673/2010/ Biogeosciences, 7, 2673–2694, 2010

2686 H. Tian et al.: Terrestrial fluxes of CH4 and N2O over North America
Table 6. Biome contributions to the terrestrial fluxes of CH4 and N2O over continental North America (The fluxes are shown as mean plusand minus standard deviation).
Tundra Forest Grassland Shrub Wetland Cropland Desert and others
CH4 Flux (T g C a−1) −0.41± 0.03 −1.13± 0.07 −0.47± 0.03 −0.64± 0.02 17.75± 1.63 −0.32± 0.03 −0.10± 0.01Percentage −2.79% −7.67% −3.19% −4.34% 120.86% −2.17% −0.70%
N2O Flux (T g N a−1) 0.07± 0.01 0.63± 0.03 0.22± 0.04 0.25± 0.03 0.19± 0.01 0.56± 0.07 0.03± 0.004Percentage 3.68% 32.21% 11.24% 12.72% 9.78% 28.82% 1.55%
Biome-based estimates may not sum to totals because of the effects of rounding in reporting those estimates.
in Mexico. Our results also indicate that N2O emission in-creased at rates of 4.2 G g N a−1 in the US, 2.9 G g N a−1 inCanada and 2.9 G g N a−1 in Mexico, respectively, during thepast 30 years.
3.4 CH4 and N2O fluxes in different biomes
CH4 and N2O fluxes varied remarkably among differentecosystems. Due to the perennial or ephemeral inundatedcondition, wetlands dominate CH4 emissions in North Amer-ica with a source of 17.75± 1.63 T g C a−1 (Table 6). Allthe other ecosystems acted as sinks for atmospheric CH4with a total sink of 3.06± 0.14 g C a−1, of which forest andshrub contributed 36.93% and 20.92%, respectively. Allecosystems functioned as sources of N2O. Forest, grassland,shrub, and cropland contributed 32.21%, 11.24%, 12.72%,and 28.82%, respectively, for the N2O emission in NorthAmerica’s terrestrial ecosystems (Table 6).
The fluxes of CH4 and N2O in each biome over thepast 30 years varied significantly. From 1979 to 2008, theCH4 emission increased at a rate of 103.9 G g C a−1 in nat-ural wetland, and the CH4 oxidation increased at rates of2.5 G g C a−1 in forests, 0.8 G g C a−1 in shrub, 0.8 G g C a−1
in grassland, and 0.6 G g C a−1 in desert and others, respec-tively. No significant changes were found for other ecosys-tem types. For the same time period, the N2O emission in-creased at rates of 5.5 G g N a−1 in cropland, 1.5 G g N a−1
in grassland, 0.8 G g N a−1 in tundra, and 0.3 G g N a−1 indesert and others. We did not find significant changes forother ecosystem types.
4 Discussion
4.1 Regional comparison to other studies
We estimated annual fluxes of CH4 and N2O in terrestrialecosystems of North America with a spatial resolution of32 km× 32 km for the past 30 years. Wetlands predomi-nately account for the continental CH4 emission. Puttingour estimate at the global context (Denman et al., 2007), itaccounted for less than 20% of the global CH4 emissionsfrom natural wetlands at 100–231 T g CH4 a−1 (Denman et
al., 2007), which is lower than its areal portion of global nat-ural wetland. This may be due to less tropical natural wet-lands and rice paddies in this region, which are two strongemitters of CH4 (Denman et al., 2007; Mitsch and Gos-selink, 2007). While our regional estimations of CH4 andN2O in North America’s terrestrial ecosystems were compa-rable to previous studies, we found that there were differ-ences at some specific areas or ecosystems. For example,Zhuang et al. (2007) used a process-based model (Terres-trial Ecosystem Model) to estimate that the CH4 emissionin Alaska was 2.35 T g C a−1 for the period of 1980–1996,which is 12% higher than our estimation of 2.10 T g C a−1
for the same time period. However, their estimation of CH4emissions in Canada of 5.33 T g C a−1 (Zhuang et al., 2004)is 26% lower than our estimation of 7.23 T g C a−1 for the1990s. Combining satellite imageries and a process-basedecosystem model, Potter et al. (2006) estimated that CH4emission from natural wetland in conterminous US during1996–2005 was 4.13 T g C a−1, which is 35% lower thanour estimate of 6.34 T g C a−1 for the same time period.In addition, a recent synthesis by Bridgham et al. (2006)indicated that CH4 emission in North America’s wetlandsis 6.75 T g C a−1, which is only 38% of our estimation(17.75± 1.63 T g C a−1). Bridgham et al. (2006) used sitespecific estimates of CH4 fluxes from literature to extrapolateto the wetlands of the entire North America. In Bridgham etal.’s study, they made the simplifying assumption that wet-lands, soils and climate are uniform across the North Amer-ica for the period of interest. In contrast, the DLEM estimatesaccount for spatial variability of wetlands, soils and climatethat give rise to place to place differences in CH4 fluxes overa time period of 30 years. The difference in up-scaling meth-ods used and the time periods examined in the two studiesmight explain this large discrepancy given the large range ofCH4 flux in different wetland types, soils and climate zones(Bridgham et al., 2006; Barlett and Harriss, 1993; Song et al.,2009). The differences between these estimates were causedlargely by the data and models used for their estimations.Using an improved process-based ecosystem model and themost up-to-date and detailed input data, our modeling ap-proach addressed various ecosystem processes and multiple
Biogeosciences, 7, 2673–2694, 2010 www.biogeosciences.net/7/2673/2010/

H. Tian et al.: Terrestrial fluxes of CH4 and N2O over North America 2687
Table 7. Comparison of the DLEM-derived CH4 and N2O fluxes with other estimates at the regional scale (DLEM simulations were at aresolution of 32 km× 32 km).
Method Period Domain CH4 (T g C a−1) N2O (T g N a−1) Source
Satellite-based empirical method Wetlands in the continental US 4.13 Potter et al., 2006DLEM 1996–2005 Wetlands in the continental US 6.34± 0.43 This studyProcess-based model 1990s Canada 5.33 Zhuang et al., 2004DLEM 1990s Canada 7.23± 1.11 This studyProcess-based model 1980–1996 Alaska 2.35 Zhuang et al., 2007DLEM 1980-1996 Alaska 2.10± 0.27 This studyDNDC at State level 1990 Cropland in the continental US 0.50–0.74 Li et al., 1996DLEM 1990 Cropland in the continental US 0.350 This studyEmpirical method at half degree 1980–2000 North America 2.08± 0.048 Xu et al., 2008DLEM 1980–2000 North America 1.85± 0.11 This studyDNDC 1970–1999 Agricultural soils in Canada 0.020–0.077 (0.0399)* Smith et al., 2004DLEM 1979–1999 Agricultural soils in Canada 0.031–0.055 (0.042)* This studyDAYCENT at 63 minor regions at county level 1991–2000 Major crop in USA ∼ 0.30** Del Grosso et al., 2005DLEM 1991-2000 All crops in USA 0.367± 0.048 This study
* Range is shown first and then the mean in bracket; **Data are read from a figure.
environmental factors that control CH4 and N2O fluxes interrestrial ecosystems.
There are only a few studies of N2O at large spatial andtemporal scales (Smith et al., 2004; Liu, 1996; Li et al.,1996; Zhuang et al., 2004; Del Grosso et al., 2005; Xu et al.,2008). The DLEM simulated N2O emission in North Amer-ica’s terrestrial ecosystems was consistent with a few otheravailable studies. In the time period of 1980–2000, DLEM-modeled N2O flux was 1.85± 0.11 T g N a−1, comparable to2.08± 0.05 T g N a−1 estimated by Xu et al. (2008) (Fig. 8).Inter-annual variations of N2O fluxes also showed a goodagreement between these two studies (R2 = 0.39;P < 0.01).The spatial correlation of N2O fluxes between these two stud-ies showed a correlation coefficient of 0.54 (N = 7691). Theclose agreement between these two studies indicated thatDLEM reasonably captured the temporal and spatial patternsof N2O emission in North America’s terrestrial ecosystems.At the same spatial scale and over the same time period,the DLEM-simulated N2O emission from cropland in USis higher than Del Grosso et al’s estimate for major crops(2005), but is lower than Li et al’s estimate for cropland inthe continental US (1996) (Table 7). Putting our estimate atthe global context, DLEM-estimated N2O flux from NorthAmerica accounted for 20% of the global N2O source of9.4 T g N a−1 from natural vegetation and agricultural land(Denman et al., 2007). This is proportional to the areal per-centage of North America in the global land surface area.
There are also a few inverse estimates on CH4 and N2O(Hein et al., 1997; Hirsch et al., 2006; Kort et al., 2008; Chenand Prinn, 2006), and only one study reported the inverse re-sults for natural fluxes from natural wetlands in North Amer-ica at 9± 4.5 T g C a−1 (Chen and Prinn, 2006). However,their estimate did not consider the CH4 flux from lower lati-tude, i.e. Mexico.
Fig. 8. Comparison of the DLEM-derived N2O fluxes with the es-timations by an empirical model (Xu et al., 2008). The regressionmodel is: the DLEM-derived N2O = 0.8887× Empirically-modeledN2O, R2 = 0.39;P < 0.01.
4.2 Biome comparison to other studies
The model results showed that wetland ecosystems releasedCH4 to the atmosphere while all other ecosystems acted assinks for CH4 (Table 8). Herbaceous wetland released CH4at a rate of 9.99± 0.93 g C m−2 a−1 and woody wetland at arate of 7.87± 0.81 g C m−2 a−1. The strongest sink residedin subtropical/tropical dry forest, and rain forest, followedby grassland, shrub, and desert. The CH4 emission and con-sumption in these ecosystems were comparable to other stud-ies (Table 8). For example, the DLEM-estimated CH4 up-take rate by boreal forest is 0.13± 0.01 g C m−2 a−1, whichis close to Curry’s (2007) estimate at 0.13 g C m−2 a−1, andRidgwell et al.’s (1999) estimate at 0.14 g C m−2 a−1, yetis slightly lower than Dutaur and Verchot’s (2007) estimateat 0.20 g C m−2 a−1; the DLEM-estimated CH4 uptake rateby grassland is 0.18± 0.01 g C m−2 a−1, which is consistentwith Curry et al.’s (2007) estimate at 0.17 g C m−2 a−1 andDutaur and Vechot’s (2007) estimate at 0.17 g C m−2 a−1, yet
www.biogeosciences.net/7/2673/2010/ Biogeosciences, 7, 2673–2694, 2010

2688 H. Tian et al.: Terrestrial fluxes of CH4 and N2O over North America
Table 8. Comparison of the DLEM-estimated CH4 emission rate (g C m−2 a−1) with other studies at biome level (Positive values representCH4 emission, and negative values represent CH4 uptake).
Biome type This study Bridgham et al., 2006 Barlett and Harriss, 1993 Curry, 2007 Dutaur and Verchot, 2007 Ridgwell et al., 1999
Tundra −0.101± 0.006 −0.055∼ −0.575 −0.109 −0.112 −0.075Boreal forest −0.128± 0.010 −0.074∼ −0.430 −0.125 −0.198 −0.140Temperate forest −0.178± 0.012 −0.068∼ −1.15 −0.155 −0.428 −0.181Tropical dry forest −0.244± 0.013 −0.082∼ −0.520 −0.199 −0.250 −0.354Tropical rain forest −0.221± 0.025 −0.202 −0.250 −0.260Shrub −0.178± 0.006 −0.169 −0.206Grassland −0.178± 0.010 −0.167 −0.174 −0.238Desert −0.185± 0.004 −0.129 −0.803 −0.172Cropland −0.125± 0.014Herbaceous 9.985± 0.933 Arithmetic: 26.28 for arctic wetlands; 23.82wetland 24.075± 5.925 for boreal wetlands; 36.96 forWoody wetland 7.871± 0.807 Geometric: temperate bogs and fens; 20.52
6.075± 1.575 for temperate swamps; 19.16 fortemperate marshes; 13.14 fortemperate floodplains
Table 9. Comparison of the DLEM-estimated N2O emission rate (g N m−2 a−1) with other studies at biome level (Positive values representN2O emission).
Biome type This study Potter et al., 1996 Recalculated fromXu et al., 2008
Process-based model Process-based model Empirical modelwith remote sensing data
Tundra 0.018± 0.002 0.003–0.011 0.002–0.251Boreal forest 0.047± 0.006 0.018 0.016–1.217Temperate forest 0.107± 0.007 0.042–0.064 0.016–1.217Tropical dry forest 0.110± 0.020 0.105 0.175–0.613Tropical rain forest 0.246± 0.039 0.136 0.006–1.060Shrub 0.061± 0.012 0.031Grassland 0.094± 0.010 0.016 0.004–0.107*Desert 0.015± 0.003 0.004Cropland 0.220± 0.030 0.081** 0.010–0.725Herbaceous wetland 0.169± 0.014 0.002–0.251Woody wetland 0.053± 0.005 0.002–0.251
* Temperate grassland and tropical savanna and grassland; ** Without fertilization
is slightly lower than Ridgwell et al.’s (1999) estimate as0.24 g C m−2 a−1; the DLEM-estimated CH4 uptake rate bycropland is 0.12± 0.01 g C m−2 a−1, which is close to 0.11–0.15 g C m−2 a−1 (Dobbie et al., 1996; Mosier et al., 1998).The DLEM-estimated CH4 sink strengths for tundra, temper-ate forest, shrub, cropland, herbaceous wetland and woodywetland fall in the range of others’ estimates (Table 8).
The modeled biome-level fluxes of N2O are comparableto other studies (Table 9). For almost all biome types, ourmodeled results are much higher than those estimated byPotter et al. (1996), yet in the lower end of the summarizedranges from Xu et al. (2008). For example, the average N2Oflux from tundra is estimated at 0.018± 0.002 g N m−2 a−1
in this study, which is more than 50% higher than Potter etal.’s (1996) estimation at 0.003–0.011 g N m−2 a−1; while it
is in the lower end of 0.002–0.251 g N m−2 a−1 summarizedin Xu et al. (2008). It is same for boreal and temperate forest,shrub, grassland, and tropical rain forest. However, our esti-mate of N2O flux from tropical rain forest is identical to Pot-ter et al.’s (1996) estimate (Table 9). The DLEM-estimatedN2O flux from desert is 0.015± 0.003 g N m−2 a−1, whichis almost three times of Potter et al.’s (1996) estimate; how-ever, it is still reasonable comparing with the field observa-tion of 0.04 g N m−2 a−1 at Sonoran Desert (Guilbault andMatthias, 1998). Our estimated N2O fluxes from herbaceousand woody wetland are in the middle of summarized rangefrom Xu et al. (2008). Given the reported high (Song etal., 2009) or low (Martikainen et al., 1993) N2O emissionfrom wetland, and current state of lacking regional estima-tion of N2O from wetland, it is highly needed to have further
Biogeosciences, 7, 2673–2694, 2010 www.biogeosciences.net/7/2673/2010/

H. Tian et al.: Terrestrial fluxes of CH4 and N2O over North America 2689
efforts on this issue. Emission of N2O from croplands in theUS in 1990 (0.187± 0.139 g N m−2 a−1) was also compara-ble to another estimates of 0.186–0.204 g N m−2 a−1 by Li etal. (1996).
4.3 Changes in CH4 and N2O fluxes among countries
The CH4 and N2O fluxes varied substantially among threecountries. Canada had the highest flux and the highest in-creasing rate in CH4 emission during 1979–2008, whichmight be due to its large area of wetland and the high increas-ing rate of CH4 production in wetland (Sect. 3.4). The high-est increasing rate of N2O emission from the US was prob-ably caused by large amount of cropland, which was an ma-jor source for atmospheric N2O (Li et al., 1996) (Sect. 3.3.).Mexico showed relatively high N2O emission, while actingas a sink for atmospheric CH4. This decoupling was causedby the landscape composition; the relatively dense croplandmade it a major source of N2O, while small area of wetlandemitted little CH4 to the atmosphere, lower than atmosphericCH4 consumption by cropland, grassland, and forest (Fig. 4).
4.4 Environmental controls on CH4 and N2O fluxes
Inter-annual fluctuation of CH4 and N2O fluxes in NorthAmerica’s terrestrial ecosystems was highly correlated withclimate factors, especially the mean annual temperature andannual precipitation (Fig. 9). A recent study showed that adrought could reduce N2O emission from a European spruceforest (Goldberg and Gebauer, 2009); this is consistent withour study, which shows that the droughts in 1994, 1999, and2002 resulted in relative low N2O emissions, due to the soilmoisture control on denitrification process (see Eq. 15) (Con-rad, 1996). Nitrogen input, including nitrogen depositionand nitrogen fertilizer application, might increase or decreaseCH4 and N2O fluxes (Steudler et al., 1989; Ding et al., 2004;Liu and Greaver, 2009), while rising atmospheric CO2 in-creased CH4 emission (Hutchin et al., 1995) yet decreasedN2O emissions (Phillips et al., 2001a). Ozone pollution de-creased CH4 emission (Morsky et al., 2008) while increasingor decreasing N2O emission (Kanerva et al., 2007). The ef-fects of land-cover change are complicated, depending on thedirection of the conversion (Willison et al., 1995; Huang etal., 2010). To accurately assess CH4 and N2O fluxes in ter-restrial ecosystems, it is essential to better understand the un-derlying mechanisms and attribute the variations in terrestrialecosystem CH4 and N2O fluxes to relative role of various en-vironmental factors.
4.5 Uncertainties in this study and the way forward
We provided regional estimations of CH4 and N2O fluxes inNorth America’s terrestrial ecosystems by using an improvedprocess-based biogeochemical model driven by multiple-global change factors. Due to the complexity of the bio-geochemical processes related to these two greenhouse gases
Fig. 9. Correlation between annual CH4 and N2O fluxes and meanannual temperature and annual precipitation –(A) Correlation be-tween CH4 flux and mean annual temperature;(B) Correlation be-tween CH4 flux and annual precipitation;(C) Correlation betweenN2O flux and mean annual temperature;(D) Correlation betweenN2O flux and annual precipitation)
(Conrad, 1996; Xu et al., 2008), some uncertainties needto be considered when interpreting the results. At the firstplace, only CH4 production from DOC was considered inthe current model. Other substrates may need to be included,for example, the CH4 production from acetate could con-tribute nearly 20% to CH4 production (Conrad, 1996; Merand Roger, 2001). It might be better to include more com-ponents in CH4 production, oxidation, and transport, if thesesubstrates can be quantified. Similarly, improvement of ourknowledge and inclusion of more processes in simulatingN2O production and oxidation may be needed. Secondly,current simulation of CH4 and N2O fluxes could be under-estimated, as the DLEM runs at daily time step and mightignore some possible high pulses in CH4 and N2O fluxes atthe time step of minute or hour. These high pulses may pro-vide a substantial contribution to the annual fluxes (Brummeet al., 1999). In addition, the availability of soil moisturecould turn CH4 production on and off at the minute or hourtime step (Moosavi et al., 1996). Third, the uncertainties inbiogeochemical processes and model parameters need to beevaluated. For example, several studies have found the ebul-lition process might be different from the mechanism appliedin the DLEM model (Baird et al., 2004; Kellner et al., 2005;Strack et al., 2005); although these studies pointed out thepossible drawback of current representation for this processin process-based model, yet did not provide more reliablemethod as a replacement. This calls for additional field orexperimental investigation before the process can be betteraddressed in the model.
www.biogeosciences.net/7/2673/2010/ Biogeosciences, 7, 2673–2694, 2010

2690 H. Tian et al.: Terrestrial fluxes of CH4 and N2O over North America
Fourth, wetland area and classification could bring uncer-tainties to regional estimation of CH4 and N2O fluxes. Thefluxes of CH4 and N2O have been reported at an order differ-ence in magnitude among different wetland classes (Barlettand Harriss, 1993; Song et al., 2009), thus the small discrep-ancy in wetland area and wetland classification could leadto a substantial difference in regional estimation. Fifth, it isimportant to take into account different mechanisms that con-trol methane production and oxidation in tropical and north-ern wetlands even though the mechanisms for the differencesbetween tropical and northern wetlands are still not well doc-umented (Blais et al., 2005). Lastly but not least, N2O emis-sion from pasture may contribute a great proportion to thecontinental flux of N2O (Li et al., 1996; Ambus et al., 2006;Livesley et al., 2009). But N2O emission from managed pas-ture was not simulated in current model, due to a lack ofspatially-explicit information on pasture management.
5 Conclusions
Using the improved DLEM model, we estimated terrestrialecosystem CH4 and N2O fluxes in North America over thepast 30 years as a result of multiple global change factors in-cluding rising atmospheric CO2 concentration, ozone pollu-tion, climate change, nitrogen deposition, land-use change,and management. The continental-, country- and biome-level fluxes of CH4 and N2O during the past three decadeswere reported.
This study indicated that approximately 14.69± 1.64 Tg C a−1 of CH4, and 1.94± 0.16 T g N a−1 of N2O were re-leased from terrestrial ecosystems in North America during1979–2008. Both the US and Canada acted as CH4 sources tothe atmosphere, but Mexico mainly oxidized and consumedCH4 from the atmosphere; and all three countries releasedN2O to the atmosphere. Forests and croplands were the twoecosystems that contributed most to continental N2O emis-sion.
This study provided, to the best of our knowledge, thefirst continental-level simultaneous quantification and mapsat 32 km× 32 km resolution of annual CH4 and N2O fluxesin North America’s terrestrial ecosystems over the past threedecades. While there are some uncertainties related to the es-timation of CH4 and N2O fluxes due to the simplification ofthe relevant biogeochemical processes in the model, we be-lieve that this study might provide some useful informationfor policy making on greenhouse gas mitigation and manage-ment. To reduce uncertainties in regional estimation of CH4and N2O fluxes, it is needed to further improve the represen-tation of additional biogeochemical processes in the DLEMand the spatial data sets of wetland area and pasture man-agement; the future incorporation of pasture into the DLEMsimulation might be another way to reduce uncertainty of re-gional estimation of N2O flux. We also face several key chal-lenges that include attributing the mechanisms responsible
for CH4 and N2O fluxes and up-scaling from a modeled gridto continental scales.
Acknowledgements.This study has been supported by NASAAtmospheric Composition: Modeling and Analysis Program(NNH10CC80C), NASA terrestrial ecology program, and DOENational Institute of Climate Change Research (DUKE UN-07-SC-NICCR-1016). This study contributes to the NACP Non-CO2Greenhouse Gases Synthesis led by Steven Wofsy at HarvardUniversity. We thank the TRAGNET program for making obser-vational data available. We are also grateful for Peter Groffman atthe Hubbard Brook Ecosystem Study to share his data with us formodel validation. We thank Patrick Crill at Stockholm Universityfor sharing his observational data for our model validation,Louis Verchot at the Center for International Forestry Research inIndonesia for sharing his collection of CH4 flux around the globe,and Dennis Baldocchi, Dafeng Hui, Yao Huang, Steven Wofsy andtwo anonymous for constructive comments.
Edited by: M. Dai
References
Amaral, J. A., Ren, T., and Knowles, R.: Atmospheric methaneconsumption by forest soils and extracted bacteria at differentpH values, Appl. Environ. Microbiol., 64, 2397–2402, 1998.
Ambus, P., Zechmeister-Boltenstern, S., and Butterbach-Bahl, K.:Sources of nitrous oxide emitted from European forest soils, Bio-geosciences, 3, 135–145, doi:10.5194/bg-3-135-2006, 2006.
Arah, J. R. M. and Stephen, K. D.: A model of the processes leadingto methane emission from peatland, Atmos. Environ., 32, 3257–3264, 1998.
Baird, A. J., Beckwith, C. W., Waldron, S., and Waddington, J.M.: Ebullition of methane-containing gas bubbles from near-surface Sphagnum peat, Geophys. Res. Lett., 31, L21505,doi:10.1029/2004GL021157, 2004.
Barlett, K. B. and Harriss, R. C.: Review and assessment ofmethane emissions from wetlands, Chemosphere, 26, 261–320,1993.
Billings, S. A., Schaeffer, S. M., and Evans, R. D.: Trace N gaslosses and N mineralization in Mojave desert soils exposed toelevated CO2, Soil Biol. Biochem., 34, 1777–1784, 2002.
Blais, A. M., Lorrain, S., and Tremblay, A.: Greenhouse gas fluxes(CO2, CH4 and N2O) in forests and wetlands of boreal, temper-ate and tropical regions, in: Greenhouse gas emissions-fluxes andprocesses: hydroelectric reservoirs and natural environments,edited by: Bremblay, A., Varfalvy, L., Roehm, C., and Garneau,M., Springer Press, New York, 2005.
Bridgham, S. D., Megonigal, J. P., Keller, J. K., Bliss, N. B., andTrettin, C.: The carbon balance of North American Wetlands,Wetlands, 26, 889–916, 2006.
Brumme, R., Borken, W., and Finke, S.: Hierarchical control on ni-trous oxide emission in forest ecosystems, Global Biogeochem.Cy., 13, 1137–1148, 1999.
Cao, M. K., Dent, J. B., and Heal, O. W.: Modeling methane emis-sions from rice paddies, Global Biogeochem. Cy., 9, 183–195,1995.
Biogeosciences, 7, 2673–2694, 2010 www.biogeosciences.net/7/2673/2010/

H. Tian et al.: Terrestrial fluxes of CH4 and N2O over North America 2691
Cao, M. K., Gregson, K., and Marshall, S.: Global methane emis-sion from wetlands and its sensitivity to climate change, Atmos.Environ., 32, 3293–3299, 1998.
Castaldi, S. and Fierro, A.: Soil-atmosphere methane exchange inundisturbed and burned Mediterranean shrubland of SouthernItaly, Ecosystems, 8, 182–190, 2005.
Chapuis-Lardy, L., Wrage, N., Metay, A., Chotte, J. L., andBernoux, M.: Soils, a sink for N2O? A review, Global ChangeBiol., 13, 1–17, doi:10.1111/j.1365-2486.2006.01280.x, 2007.
Chen, G., Tian, H., Liu, M., Ren, W., Zhang, C., and Pan, S.:Climate impacts on China’s terrestrial carbon cycle: an assess-ment with the dynamic land ecosystem model, in: EnvironmentalModelling and Simulation, edited by: Tian, H. Q., ACTA Press,Anahiem/Calgary/Zurich, 56–70, 2006.
Chen, Y. H. and Prinn, R. G.: Estimation of atmospheric methaneemissions between 1996 and 2001 using a three-dimensionalglobal chemical transport model, J. Geophys. Res.-Atmos., 111,D10307, doi:10.1029/2005JD006058, 2006.
Christensen, T. R., Prentice, I. C., Kaplan, J. O., Haxeltine, A., andSitch, S.: Methane flux from northern wetlands and tundra anecosystem source modeling approach, Tellus B, 48, 652–661,1996.
Conrad, R.: Soil microorganisms as controllers of atmospheric tracegases (H2, CO, CH4, OCS, N2O, and NO), Microbiol. Rev., 60,609–640, 1996.
Curry, C. L.: Modeling the soil consumption of atmosphericmethane at the global scale, Global Biogeochem. Cy., 21,GB4012, doi:10.1029/2006GB002818, 2007.
Davidson, E. A., Keller, M., Erickson, H. E., Verchot, L. V., andVeldkamp, E.: Testing a conceptual model of soil emissions ofnitrous and nitric oxides, Bioscience, 50, 667–680, 2000.
De Fries, R., Hansen, M., Townshend, J., and Sohlberg, R.: Globalland cover classifications at 8 km spatial resolution: the use oftraining data derived from Landsat imagery in decision tree clas-sifiers, Int. J. Remote Sens., 19, 3141–3168, 1998.
Del Grosso, S. J., Mosier, A. R., Parton, W. J., and Ojima, D. S.:DAYCENT model analysis of past and contemporary soil N2Oand net greenhouse gas flux for major crops in the USA, Soil Till.Res., 83, 9–24, 2005.
Denman, K. L., Brasseur, G., Chidthaisong, A., Ciais, P., Cox, P.M., Dickinson, R. E., Hauglustaine, D., Heinze, C., Holland, E.,Jacob, D., Lohmann, U., Ramachandran, S., da Silva Dias, P. L.,Wofsy, S. C., and Zhang, X.: Couplings between changes in theclimate system and biogeochemistry, in: Climate change 2007:The physical science basis. Contribution of working group I tothe fouth assessment report of the intergovernmanetal panel onclimate change, edited by: Solomon, S., Qin, D., Manning, M.,and Chen, Z., Cambridge Univeristy Press, Cambridge, UK andNew York, USA, 2007.
Dentener, F., Drevet, J., Lamarque, J., Bey, I., Eickhout, B., Fiore,A., Hauglustaine, D., Horowitz, L., Krol, M., and Kulshrestha,U.: Nitrogen and sulfur deposition on regional and global scales:A multimodel evaluation, Global Biogeochem. Cy., 20, GB4003,doi:10.1029/2005GB002672, 2006.
Ding, W. X., Cai, Z. C., and Tsuruta, H.: Cultivation, nitrogen fer-tilization, and set-aside effects on methane uptake in a drainedmarsh soil in Northeast China, Global Change Biol., 10, 1801–1809, 2004.
Dise, N. B.: Methane emission from peatlands in Northern Min-nesota, Ph.D., University of Minnesota, Minneapolis, 138 pp.,1991.
Dobbie, K. E., Smith, K. A., Prieme, A., Christensen, S., Degorska,A., and Orlanski, P.: Effect of land use on the rate of methaneuptake by surface soils in northern Europe, Atmos. Environ., 30,1005–1011, 1996.
Dong, Y., Qi, Y., and Luo, J.: Experimental study on N2O andCH4 fluxes from the dark coniferous forest zone soil of GonggaMountain, China, Sci. China Ser. D, 48, 285–295, 2003.
Dorr, H., Katruff, L., and Levin, I.: Soil texture parameterization ofthe methane uptake in aerated soils, Chemosphere, 26, 697–713,1993.
Dusenbury, M. P., Engel, R. E., Miller, P. R., Lemke, R. L., andWallander, R.: Nitrous Oxide Emissions from a Northern GreatPlains Soil as Influenced by Nitrogen Management and CroppingSystems, J. Environ. Qual., 37, 542–550, 2008.
Dutaur, L. and Verchot, L. V.: A global inventory of thesoil CH4 sink, Global Biogeochem. Cy., 21, GB4013,doi:10.1029/2006GB002734, 2007.
Felzer, B., Reilly, J., Melillo, J., Kicklighter, D., Sarofim, M.,Wang, C., Prinn, R., and Zhuang, Q.: Future effects of ozoneon carbon sequestration and climate change policy using aglobal biogeochemical model, Climatic Change, 73, 345–373,doi:10.1007/s10584-005-6776-4, 2005.
Ferenci, T., Strom, T., and Quayle, J. R.: Oxidation of carbonmonoxide and methane by Pseudomonas methanica, Microbiol-ogy, 91, 79–91, 1975.
Forster, P., Ramaswamy, V., Artaxo, P., Berntsen, T., Betts, R.,Fahey, D. W., Haywood, J., Lean, J., Lowe, D. C., Myhre, G.,Nganga, J., Prinn, N. R., Raga, G., Schulz, M., and Dorland, R.V.: Changes in atmospheric constituents and in radiative forcing,in: Climate change 2007: The physical science basis. Contribu-tion of working group I to the fouth assessment report of the in-tergovernmanetal panel on climate change, edited by: Solomon,S., Qin, D., Manning, M., and Chen, Z., Cambridge UniveristyPress, Cambridge, UK and New York, USA, 2007.
Garcia-Montiel, D. C., Melillo, J. M., Steudler, P. A., Neill, C.,Feigl, B. J., and Cerri, C. C.: Relationship between N2O andCO2 emissions from the Amazon Basin, Geophys. Res. Lett.,29, 1090, doi:10.1029/2002GL013830, 2002.
Garcia-Ruiz, R., Pattinson, S. N., and Whitton, B. A.: Kinetic pa-rameters of denitrification in a river continuum, Appl. Environ.Microbiol., 64, 2533–2538, 1998.
Goldberg, S. D. and Gebauer, G.: Drought turns a Central EuropeanNorway spruce forest soil from an N2O source to a transient N2Osink, Global Change Biol., 15, 850–860, doi:10.1111/j.1365-2486.2008.01752.x, 2009.
Groffman, P. M., Hardy, J. P., Driscoll, C. T., and Fahey, T. J.: Snowdepth, soil freezing and trace gas fluxes in a northern hardwoodforest, Global Change Biol., 15, 850–860, 2006.
Groffman, P. M., Hardy, J. P., Fisk, M. C., Fahey, T. J., and Driscoll,C. T.: Climate variation and soil carbon and nitrogen cyclingprocesses in a northern hardwood forest, Ecosystems, 12, 927–943, 2009.
Guilbault, M. R. and Matthias, A. D.: Emissions of N2O fromSonoran Desert and effluent-irrigated grass ecosystems, J. AridEnviron., 38, 87–98, 1998.
www.biogeosciences.net/7/2673/2010/ Biogeosciences, 7, 2673–2694, 2010

2692 H. Tian et al.: Terrestrial fluxes of CH4 and N2O over North America
Happell, J. D. and Chanton, J. P.: Methane transfer across the water-air interface in stagnant wooded swamps of Florida: Evaluationof mass-transfer coefficients and isotopic fractionation, Limnol.Oceanogr., 40, 290–298, 1995.
Harrison, D. E. F.: Studies on the affinity of methanol- and methane-utilising bacteria for their carbon substrates, J. Appl. Bacteriol.,36, 301–308, 1973.
Hein, R., Crutzen, P., and Heimann, M.: An inverse modelingapproach to investigate the global atmospheric methane cycle,Global Biogeochem. Cy., 11, 43–76, 1997.
Hirsch, A. I., Michalak, A. M., Bruhwiler, L. M., Peters, W., Dlu-gokencky, E. J., and Tans, P. P.: Inverse modeling etimates of theglobal nitrous oxide surface flux from 1998–2001, Global Bio-geochem. Cy., 20, GB1008, doi:10.1029/2004GB002443, 2006.
Huang, B., Chen, G., Huang, G., and Hauro, T.: Nitrous oxide emis-sion from temperate meadow grassland and emission estimationfor temperate grassland of China, Nutr. Cycl. Agroecosys., 67,31–36, 2003.
Huang, Y., Sass, R. L., and Fisher, F. M.: A semi-empirical model ofmethane emission from flooded rice paddy soils, Global ChangeBiol., 4, 247–268, 1998.
Huang, Y., Sun, W., Zhang, W., Yu, Y., Su, Y., and Song, C.: Marsh-land conversion to cropland in northeast China from 1950 to2000 reduced the greenhouse effect, Global Change Biol., 16,680–695, doi:10.1111/j.1365-2486.2009.01976.x, 2010.
Hutchin, P. R., Press, M. C., Lee, J. A., and Ashenden, T. W.: El-evated concentrations of CO2 may double methane emissionsfrom mires, Global Change Biol., 1, 125–128, 1995.
Joergensen, L.: The methane mono-oxygenase reaction systemstudied in vivo by membrane-inlet mass spectrometry, Biochem.J., 225, 441–448, 1985.
Kanerva, T., Regina, K., Ramo, K., Ojanpera, K., and Manninen, S.:Fluxes of N2O, CH4 and CO2 in a meadow ecosystem exposedto elevated ozone and carbon dioxide for three years, Environ.Pollut., 145, 818–828, 2007.
Kellner, E., Waddington, J. M., and Price, J. S.: Dynamics ofbiogenic gas bubbles in peat: potential effects on water stor-age and peat deformation, Water Resour. Res., 41, W08417,doi:10.1029/2004WR003732, 2005.
Kessavalou, A., Mosier, A. R., Doran, J. W., Drijber, R. A., Lyon,D. J., and Heinemeyer, O.: Fluxes of carbon dioxide, nitrousoxide, and methane in grass sod and winter wheat-fallow tillagemanagement, J. Environ. Qual., 27, 1094–1104, 1998.
Kettunen, A.: Connecting methane fluxes to vegetationcover and water table fluctuations at microsite level:a modeling study, Global Biogeochem. Cy., 17, 1051,doi:10.1029/2002GB001958, 2003.
Kim, D.-H., Matsuda, O., and Yamamoto, T.: Nitrification, denitri-fication and nitrate reduction rates in the sediment of HiroshimaBay, Japan, J. Oceanogr., 53, 317–324, 1997.
Kort, E. A., Eluszkiewica, J., Stephens, B. B., Miller, J. B., Gerbig,C., Nehrkorn, T., Daube, B. C., Kaplan, J. O., Houweling, S., andWofsy, S. C.: Emissions of CH4 and N2O over the United Statesand Canada based on a receptor-oriented modeling frameworkand COBRA-NA atmospheric observations, Geophys. Res. Lett.,35, L18808, doi:10.1029/2008GL034031, 2008.
Koschorreck, M. and Conrad, R.: Oxidation of atmosphericmethane in soil: measurements in the field, in soil cores and insoil samples, Global Biogeochem. Cy., 7, 109–121, 1993.
Lamb, S. C. and Garver, J. C.: Interspecific interactions in amethane-utilizing mixed culture, Biotechnol. Bioeng., 22, 2119–2135, 1980.
Lehner, B. and Doll, P.: Development and validation of a globaldatabase of lakes, reservoirs and wetlands, J. Hydrol., 296, 1–22,2004.
Li, C. S., Narayanan, V., and Harriss, R. C.: Model estimates ofnitrous oxide emissions from agricultural lands in the UnitedStates, Global Biogeochem. Cy., 10, 297–306, 1996.
Lin, B. H., Sakoda, A., Shibasaki, R., Goto, N., and Suzuki, M.:Modeling a global biogeochemical nitrogen cycle in terrestrialecosystems, Ecol. Modell., 135, 89–110, 2000.
Linton, J. D. and Buckee, D. C.: Interaction in a methane-utilisingmixed bacterial culture in a chemostat, J. Gen. Microbiol., 101,219–225, 1977.
Liu, L. and Greaver, T.: A review of nitrogen enrichment effectson three biogenic GHGs: the CO2 sink may be largely offset bystimulated N2O and CH4 emission, Ecol. Lett., 12, 1103–1117,2009.
Liu, M., Tian, H., Chen, G., Ren, W., Zhang, C., and Liu, J.: Ef-fects of land-use and land-cover change on evapotranspirationand water yield in China during 1900–2000, J. Am. Water Re-sour. Assoc., 44, 1193–1207, 2008.
Liu, Y.: Modeling the emissions of nitrous oxide (N2O) andmethane (CH4) from the terrestrial biosphere to the atmosphere,Doctor of Philisophy in Global Change Science, Department ofEarth, Atmospheric and Planetary Sciences, Massachusetts Insti-tute of Technology, Boston, 1996.
Livesley, S. J., Kiese, R., Miehle, P., Weston, C. J., Butterbach-Bahl, K., and Arndt, S. K.: Soil-atmosphere exchange of green-house gases in aEucalyptus marginatawoodland, a clover-grasspasture, andPinus radiataandEucalyptus globulesplantations,Global Change Biol., 15, 425–440. 2009.
Lokshina, L. Y., Vavilin, V. A., Kettunen, R. H., Rintala, J. A., Hol-liger, C., and Nozhevnikova, A. N.: Evaluation of kinetic co-efficients using integrated Monod and Haldane models for low-temperature acetoclastic methanogenesis, Water Res., 35, 2913–2922, 2001.
Lu, C.: Atmospheric nitrogen deposition and terrestrial ecosystemcarbon cycle in China, Dissertation, Doctor of Philosophy, Chi-nese Academy of Sciences, Beijing, 2009.
Martikainen, P. J., Nykanen, H., Crill, P., and Silvola, J.: Effectof a lowered water table on nitrous oxide fluxes from northernpeatlands, Nature, 366, 51–53, 1993.
Matson, A. L.: Greenhouse gas exchange and nitrogen cycling inSaskatchewan boreal forest soils, Master, Department of SoilScience, University of Saskatchewan, Saskatoon, 98 pp., 2008.
McGuire, A., Sitch, S., Clein, J., Dargaville, R., Esser, G., Foley,J., Heimann, M., Joos, F., Kaplan, J., and Kicklighter, D.: Car-bon balance of the terrestrial biosphere in the twentieth century:Analyses of CO2, climate and land use effects with four process-based ecosystem models, Global Biogeochem. Cy., 15, 183–206,2001.
Mer, J. L. and Roger, P.: Production, oxidation, emission and con-sumption of methane by soils: a review, Eur. J. Soil Biol., 37,25–50, 2001.
Mitsch, W. J. and Gosselink, J. G.: Wetlands, 4th edition, John Wi-ley & Sons, Inc., New York, 2007.
Biogeosciences, 7, 2673–2694, 2010 www.biogeosciences.net/7/2673/2010/

H. Tian et al.: Terrestrial fluxes of CH4 and N2O over North America 2693
Moosavi, S. C., Crill, P. M., Pullman, E. R., Funk, D. W., and Pe-terson, K. M.: Controls on CH4 flux from an Alaskan borealwetland, Global Biogeochem. Cy., 10, 287–296, 1996.
Morsky, S., Haapala, J. K., Rinnan, R. A., Tiiva, P., Saarnio, S.,Silvola, J., Holopalinen, T., and Martikainen, P. J.: Long-termozone effects on vegetation, microbial community and methanedyanmics of boreal peatland microcosms in open-field condi-tions, Global Change Biol., 14, 1891–1903, doi:10.1111/j.1365-2486,2008.01615.x, 2008.
Mosier, A. R., Klemedtsson, L. K., Sommerfeld, R. A., and Mus-selman, R. C.: Methane and nitrous oxide flux in a Wyomingsubalpine meadow, Global Biogeochem. Cy., 7, 771–784, 1993.
Mosier, A. R., Parton, W. J., Valentine, D. W., Ojima, D. S.,Schimel, D. S., and Delgado, J. A.: CH4 and N2O fluxes in theColorado shortgrass steppe: 1. Impact of landscape and nitrogenaddition, Global Biogeochem. Cy., 10, 387–399, 1996.
Mosier, A. R., Duxbury, J. M., Freney, J. R., Heinemeyer, O., Mi-nami, K., and Johnson, D. E.: Mitigating agricultural emissionsof methane, Climatic Change, 40, 39–80, 1998.
Mosier, A. R., Morgan, J. A., King, J. Y., LeCain, D., and Milchu-nas, D. G.: Soil-atmosphere exchange of CH4, CO2, NOx, andN2O in the Colorado shortgrass steppe under elevated CO2, PlantSoil, 240, 201–211, 2002.
Mummey, D. L., Smith, J. L., and Bolton, H.: Small-scale spatialand temporal variability of N2O flux from a shrub-steppe ecosys-tem, Soil Biol. Biochem., 29, 1699–1706, 1997.
Nagai, S., Mori, T., and Aiba, S.: Investigation of the energet-ics of methane-utilizing bacteria in methane-and oxygen-limitedchemostat cultures, J. Appl. Biotechnol., 27, 893–903, 1973.
Nedwell, D. B. and Watson, A. J.: CH4 production, oxidation andemission in a UK ombrotrophic peat bog: Influence of SO2−
4from acid rain, Soil Biol. Biochem., 23, 549–562, 1995.
O’Neill, J. G. and Wilktnson, J. F.: Oxidation of ammoniaby methane-oxidizing bacteria and the effects of ammonia onmethane oxidation, J. Gen. Microbiol., 100, 407–412, 1977.
Phillips, R., Whalen, S., and Schlesinger, W.: Influence of atmo-spheric CO2 enrichment on nitrous oxide flux in a temperate for-est ecosystem, Global Biogeochem. Cy., 15, 741–752, 2001a.
Phillips, R. L., Whalen, S. C., and Schlesinger, W. H.: Influenceof atmospheric CO2 enrichment on methane consumption in atemperate forest soil, Global Change Biol., 7, 557–563, 2001b.
Potter, C. S., Matson, P. A., Vitousek, P. M., and Davidson, E. A.:Process modeling of controls on nitrogen trace gas emissionsfrom soils worldwide, J. Geophys. Res., 101, 1361–1377, 1996.
Potter, C. S.: An ecosystem simulation model for methane produc-tion and emission from wetlands, Global Biogeochem. Cy., 11,495–506, 1997.
Potter, C. S., Klooster, S., Hiatt, S., Fladeland, M., Genovese, V.,and Cross, P.: Methane emissions from natural wetlands in theUnited States: satellite-derived estimation based on ecosystemcarbon cycling, Earth Interact., 10, Paper 10-022, 2006.
Ren, W., Tian, H., Chen, G., Liu, M., Zhang, C., Chappelka, A.H., and Pan, S.: Influence of ozone pollution and climate vari-ability on net primary productivit and carbon storage in China’sgrassland ecosystems from 1961 to 2000, Environ. Pollut., 149,327–335, doi:10.1016/j.envpol.2007.05.029, 2007a.
Ren, W., Tian, H., Liu, M., Zhang, C., Chen, G., Pan, S.,Felzer, B., and Xu, X.: Effects of tropospheric ozone pollu-tion on net primary productivity and carbon storage in terrestrial
ecosystems of China, J. Geophys. Res.-Atmos., 112, D22S09,doi:10.1029/2007jd008521, 2007b.
Ren, W.: Effects of Ozone Pollution and Climate Variabil-ity/Change on Spatial and Temporal Patterns of Terrestrial Pri-mary Productivity and Carbon Storage in China, Dissertation,Doctor of Philosophy, School of Forestry and Wildlife Science,Auburn University, Auburn, 202 pp., 2009.
Ricciuto, D. M., Davis, K. J., and Keller, K.: A bayesian calibrationof a simple carbon cycle model: the role of observations in es-timating and reducing uncertainty, Global Biogeochem. Cy., 22,GB2030, doi:10.1029/2006GB002908, 2008.
Ridgwell, A. J., Marshall, S. J., and Gregson, K.: Consumption ofatmospheric methane by soils: a process-based model, GlobalBiogeochem. Cy., 13, 59–70, 1999.
Riedo, M., Grub, A., Rosset, M., and Fuhrer, J.: A pasture sim-ulation model for dry matter production, and fluxes of carbon,nitrogen, water and energy, Ecol. Modell., 105, 141–183, 1998.
Rigby, M., Prinn, R. G., Fraser, P. J., Simmonds, P. G., Lan-genfelds, R. L., Huang, J., Cunnold, D. M., Steele, L. P.,Krummel, P. B., Weiss, R. F., O’Doherty, S., Salameh, P. K.,Wang, H. J., Harth, C. M., Muhle, J., and Porter, L. W.: Re-newed growth of atmospheric methane, Geophys. Res. Lett., 35,L22805, doi:10.1029/2008GL036037., 2008.
Robert, C. and Casella, G.: Monte Carlo statistical methods,Springer Verlag, 2005.
Saari, A., Rinnan, R. A., and Martikainen, P. J.: Methane oxidationin boreal forest soils: kinetics and sensitivity to pH and ammo-nium, Soil Biol. Biochem., 36, 1037–1046, 2004.
Schimel, D., Melillo, J. M., Tian, H., McGuire, A. D., Kicklighter,D. W., Kittel, T., Rosenbloom, N., Running, S., Thornton, P.,and Ojima, D.: Contribution of increasing CO2 and climate tocarbon storage by ecosystems in the United States, Science, 287,2004–2006, 2000.
Schrope, M. K., Chanton, J. P., Allen, L. H., and Baker, T. J.: Effectof CO2 enrichment and elevated temperature on methane emis-sions from rice, Oryza sativa, Global Change Biol., 5, 587–599,1999.
Segers, R.: Methane production and methane consumption: a re-view of processes underlying wetland methane fluxes, Biogeo-chemistry, 41, 23–51, 1998.
Sheibley, R. W., Jackman, A. P., Duff, J. H., and Triska, F. J.: Nu-merical modeling of coupled nitrification – denitrification in sed-iment perfusion cores from the hyporheic zone of the ShingobeeRiver, MN, Adv. Water Resour., 26, 977–987, 2003.
Sheldon, A. I. and Barnhart, E. P.: Nitrous oxide emissions researchprogress, Environmental science, engineering, and technology,Nova Science Publishers, Hauppauge, NY, 2009.
Shoemaker, J. K. and Schrag, D. P.: Subsurface characteriza-tion of methane production and oxidation from a New Hamp-shire wetland, Geobiology, 8, 234–243, doi:10.1111/j.1472-4669.2010.00239.x, 2010.
Sitaula, B. K., Bakken, L. R., and Abrahamsen, G.: CH4 uptake bytemperate forest soil: effect of N input and soil acidification, SoilBiol. Biochem., 27, 871–880, 1995.
Smith, W. N., Grant, B., Desjardins, R. L., Lemke, R., and Li, C.:Estimates of the interannual variations of N2O emissions fromagricultural soils in Canada, Nutr. Cycl. Agroecosys., 68, 37–45,2004.
www.biogeosciences.net/7/2673/2010/ Biogeosciences, 7, 2673–2694, 2010
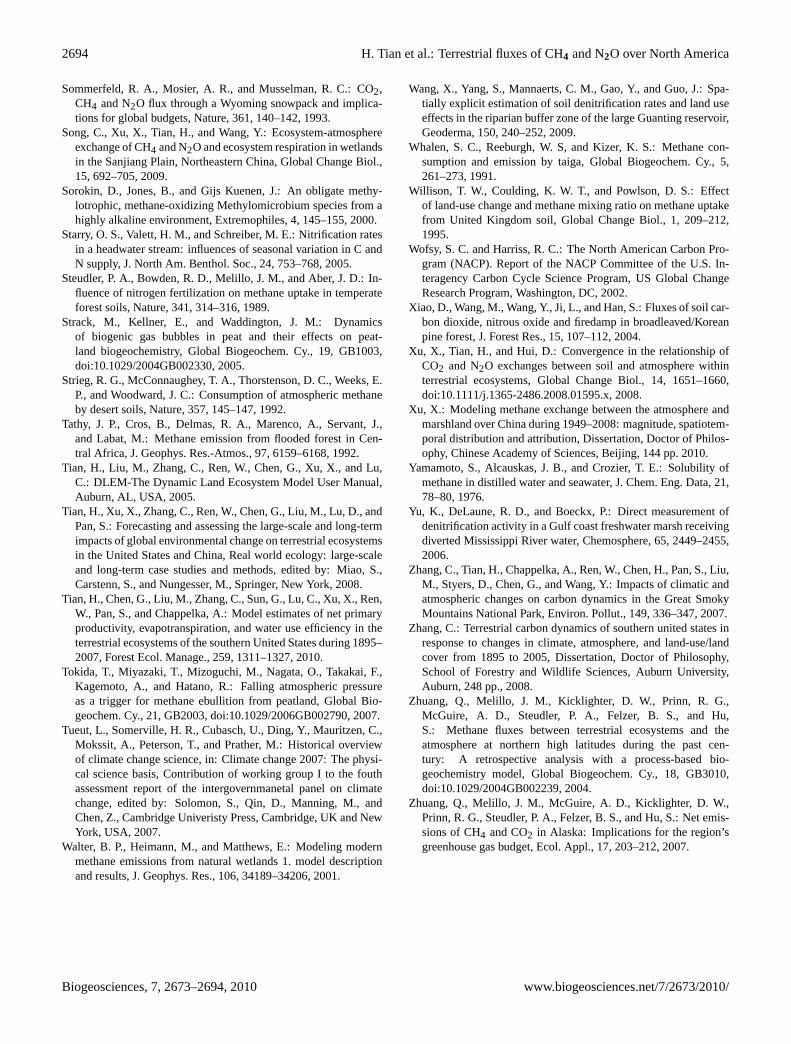
2694 H. Tian et al.: Terrestrial fluxes of CH4 and N2O over North America
Sommerfeld, R. A., Mosier, A. R., and Musselman, R. C.: CO2,CH4 and N2O flux through a Wyoming snowpack and implica-tions for global budgets, Nature, 361, 140–142, 1993.
Song, C., Xu, X., Tian, H., and Wang, Y.: Ecosystem-atmosphereexchange of CH4 and N2O and ecosystem respiration in wetlandsin the Sanjiang Plain, Northeastern China, Global Change Biol.,15, 692–705, 2009.
Sorokin, D., Jones, B., and Gijs Kuenen, J.: An obligate methy-lotrophic, methane-oxidizing Methylomicrobium species from ahighly alkaline environment, Extremophiles, 4, 145–155, 2000.
Starry, O. S., Valett, H. M., and Schreiber, M. E.: Nitrification ratesin a headwater stream: influences of seasonal variation in C andN supply, J. North Am. Benthol. Soc., 24, 753–768, 2005.
Steudler, P. A., Bowden, R. D., Melillo, J. M., and Aber, J. D.: In-fluence of nitrogen fertilization on methane uptake in temperateforest soils, Nature, 341, 314–316, 1989.
Strack, M., Kellner, E., and Waddington, J. M.: Dynamicsof biogenic gas bubbles in peat and their effects on peat-land biogeochemistry, Global Biogeochem. Cy., 19, GB1003,doi:10.1029/2004GB002330, 2005.
Strieg, R. G., McConnaughey, T. A., Thorstenson, D. C., Weeks, E.P., and Woodward, J. C.: Consumption of atmospheric methaneby desert soils, Nature, 357, 145–147, 1992.
Tathy, J. P., Cros, B., Delmas, R. A., Marenco, A., Servant, J.,and Labat, M.: Methane emission from flooded forest in Cen-tral Africa, J. Geophys. Res.-Atmos., 97, 6159–6168, 1992.
Tian, H., Liu, M., Zhang, C., Ren, W., Chen, G., Xu, X., and Lu,C.: DLEM-The Dynamic Land Ecosystem Model User Manual,Auburn, AL, USA, 2005.
Tian, H., Xu, X., Zhang, C., Ren, W., Chen, G., Liu, M., Lu, D., andPan, S.: Forecasting and assessing the large-scale and long-termimpacts of global environmental change on terrestrial ecosystemsin the United States and China, Real world ecology: large-scaleand long-term case studies and methods, edited by: Miao, S.,Carstenn, S., and Nungesser, M., Springer, New York, 2008.
Tian, H., Chen, G., Liu, M., Zhang, C., Sun, G., Lu, C., Xu, X., Ren,W., Pan, S., and Chappelka, A.: Model estimates of net primaryproductivity, evapotranspiration, and water use efficiency in theterrestrial ecosystems of the southern United States during 1895–2007, Forest Ecol. Manage., 259, 1311–1327, 2010.
Tokida, T., Miyazaki, T., Mizoguchi, M., Nagata, O., Takakai, F.,Kagemoto, A., and Hatano, R.: Falling atmospheric pressureas a trigger for methane ebullition from peatland, Global Bio-geochem. Cy., 21, GB2003, doi:10.1029/2006GB002790, 2007.
Tueut, L., Somerville, H. R., Cubasch, U., Ding, Y., Mauritzen, C.,Mokssit, A., Peterson, T., and Prather, M.: Historical overviewof climate change science, in: Climate change 2007: The physi-cal science basis, Contribution of working group I to the fouthassessment report of the intergovernmanetal panel on climatechange, edited by: Solomon, S., Qin, D., Manning, M., andChen, Z., Cambridge Univeristy Press, Cambridge, UK and NewYork, USA, 2007.
Walter, B. P., Heimann, M., and Matthews, E.: Modeling modernmethane emissions from natural wetlands 1. model descriptionand results, J. Geophys. Res., 106, 34189–34206, 2001.
Wang, X., Yang, S., Mannaerts, C. M., Gao, Y., and Guo, J.: Spa-tially explicit estimation of soil denitrification rates and land useeffects in the riparian buffer zone of the large Guanting reservoir,Geoderma, 150, 240–252, 2009.
Whalen, S. C., Reeburgh, W. S, and Kizer, K. S.: Methane con-sumption and emission by taiga, Global Biogeochem. Cy., 5,261–273, 1991.
Willison, T. W., Coulding, K. W. T., and Powlson, D. S.: Effectof land-use change and methane mixing ratio on methane uptakefrom United Kingdom soil, Global Change Biol., 1, 209–212,1995.
Wofsy, S. C. and Harriss, R. C.: The North American Carbon Pro-gram (NACP). Report of the NACP Committee of the U.S. In-teragency Carbon Cycle Science Program, US Global ChangeResearch Program, Washington, DC, 2002.
Xiao, D., Wang, M., Wang, Y., Ji, L., and Han, S.: Fluxes of soil car-bon dioxide, nitrous oxide and firedamp in broadleaved/Koreanpine forest, J. Forest Res., 15, 107–112, 2004.
Xu, X., Tian, H., and Hui, D.: Convergence in the relationship ofCO2 and N2O exchanges between soil and atmosphere withinterrestrial ecosystems, Global Change Biol., 14, 1651–1660,doi:10.1111/j.1365-2486.2008.01595.x, 2008.
Xu, X.: Modeling methane exchange between the atmosphere andmarshland over China during 1949–2008: magnitude, spatiotem-poral distribution and attribution, Dissertation, Doctor of Philos-ophy, Chinese Academy of Sciences, Beijing, 144 pp. 2010.
Yamamoto, S., Alcauskas, J. B., and Crozier, T. E.: Solubility ofmethane in distilled water and seawater, J. Chem. Eng. Data, 21,78–80, 1976.
Yu, K., DeLaune, R. D., and Boeckx, P.: Direct measurement ofdenitrification activity in a Gulf coast freshwater marsh receivingdiverted Mississippi River water, Chemosphere, 65, 2449–2455,2006.
Zhang, C., Tian, H., Chappelka, A., Ren, W., Chen, H., Pan, S., Liu,M., Styers, D., Chen, G., and Wang, Y.: Impacts of climatic andatmospheric changes on carbon dynamics in the Great SmokyMountains National Park, Environ. Pollut., 149, 336–347, 2007.
Zhang, C.: Terrestrial carbon dynamics of southern united states inresponse to changes in climate, atmosphere, and land-use/landcover from 1895 to 2005, Dissertation, Doctor of Philosophy,School of Forestry and Wildlife Sciences, Auburn University,Auburn, 248 pp., 2008.
Zhuang, Q., Melillo, J. M., Kicklighter, D. W., Prinn, R. G.,McGuire, A. D., Steudler, P. A., Felzer, B. S., and Hu,S.: Methane fluxes between terrestrial ecosystems and theatmosphere at northern high latitudes during the past cen-tury: A retrospective analysis with a process-based bio-geochemistry model, Global Biogeochem. Cy., 18, GB3010,doi:10.1029/2004GB002239, 2004.
Zhuang, Q., Melillo, J. M., McGuire, A. D., Kicklighter, D. W.,Prinn, R. G., Steudler, P. A., Felzer, B. S., and Hu, S.: Net emis-sions of CH4 and CO2 in Alaska: Implications for the region’sgreenhouse gas budget, Ecol. Appl., 17, 203–212, 2007.
Biogeosciences, 7, 2673–2694, 2010 www.biogeosciences.net/7/2673/2010/