spatial and temporal gene expression patterns …the plant cell, vol. 4, 1549-1559, december 1992 o...
TRANSCRIPT

The Plant Cell, Vol. 4, 1549-1559, December 1992 O 1992 American Society of Plant Physiologists
Spatial and Temporal Gene Expression Patterns Occur during Corm Development
Luiz A.B. de Castro, Mauro Carneiro, Damares de C.M. Neshich, and Genaro R. de Paiva’I2 Centro Nacional de Recursos Genbticos e Biotecnologia, C.P. 102372, Brasilia DF, 70770, Brazil
We investigated gene expression patterns that occur during taro corm development. Two-dimensional gel electrophore- sis identified severa1 different prevalent proteins that accumulate during corm development. Microsequencing studies indicated that some of these proteins are related to taste-modifying proteins, such as curculin and miraculin, and pro- teins found in other storage organs, such as sporamin and the Kunitz trypsin inhibitor. A curculin-encoding cDNA clone, designated as TC1, was identified that corresponds to a highly prevalent 1-kb corm mRNA. The TC1 mRNA accumulates during corm development, is more prevalent in corm apical than basal regions, and is either absent, or present at low concentrations, in other vegetative organs such as the leaf and root. In situ hybridization experiments showed that the TC1 mRNA is highly concentrated in corm storage parenchyma cells and is absent, or present in reduced concentrations, in other corm cells and tissues. Our results show that corm development is associated with the differentiation of special- ized cells and tissues, and that these differentiation events are coupled with the temporal and spatial expression of corm-specific genes.
INTRODUCTION
Vegetative propagation is an important reproductive strategy in flowering plants that involves the generation and dispersa1 of genetically identical individuals, or clones. Generally, vegeta- tive propagules are derived from axillary buds on aerial stems or from specialized underground storage stems, such as tubers, rhizomes, and corms (Richards, 1986).
Corms are perennial underground storage stems that have meristematic zones which can differentiate into roots, stems, and leaves (Raven et al., 1986). The taro plant has a well- differentiated corm and grows abundantly in tropical regions where it is used as a food source (Pate and Dixon, 1982). Corms accumulate storage proteins and carbohydrates that are in- volved in the maintenance of the developing sporophyte, as well as in supporting the morphogenetic events that are re- quired for Vegetative propagation. The deposition of corm storage products is under developmental control (Strauss et al., 1980; Wills et al., 1983); however, the mechanisms and genes that control storage product accumulation are not known.
In this study, we investigated the gene expression patterns that occur during talo corm development. Our results show that differentiation events occur early in corm development to establish a precise pattern of specialized cells and tissues within this underground stem. The differentiation of storage parenchymal cells is associated with the accumulation of
’ Current address: Department of Biology, University of California, Los Angeles, CA 90024-1606.
To whom correspondence should be addressed at current address.
prevalent proteins and mRNAs, some of which are related to taste-modifying and sweetener proteins present in other tropi- cal plants. One mRNA, designated as TC1, encodes a corm globulin protein related to curculin. The TC1 mRNA is corm specific, accumulates preferentially in apical regions early in development, and is localized specifically within storage pa- renchymal cells. Our findings indicate that corm development is associated with the temporal and spatial expression of corm- specific genes.
RESULTS
Growth and Development of Taro Corms
Taro is the most prominent of the edible aroid crops. It has an herbaceous appearance with a few large leaves and one or more specialized underground stems, or corms (Wang, 1983). A typical taro plant is shown in Figure 1A. It contains a leaf blade (LB), leaf petioles (LP), roots (R), and corms at three different developmental stages (C2, C3, and C5). We divided corm development into five stages, designated as C1 to C5, on the basis of size, growth, externa1 morphology, pres- ente of young corms, and tissue patterns. Corms at stages C1 to C5 are shown in Figures 1B to lE, and bright-field photo- graphs of C1 to C4 corm sections are shown in Figure 2. Developmental markers characteristic of each stage of corm development are summarized in Table 1.
1550 The Plant Cell
C3
C4
}C2
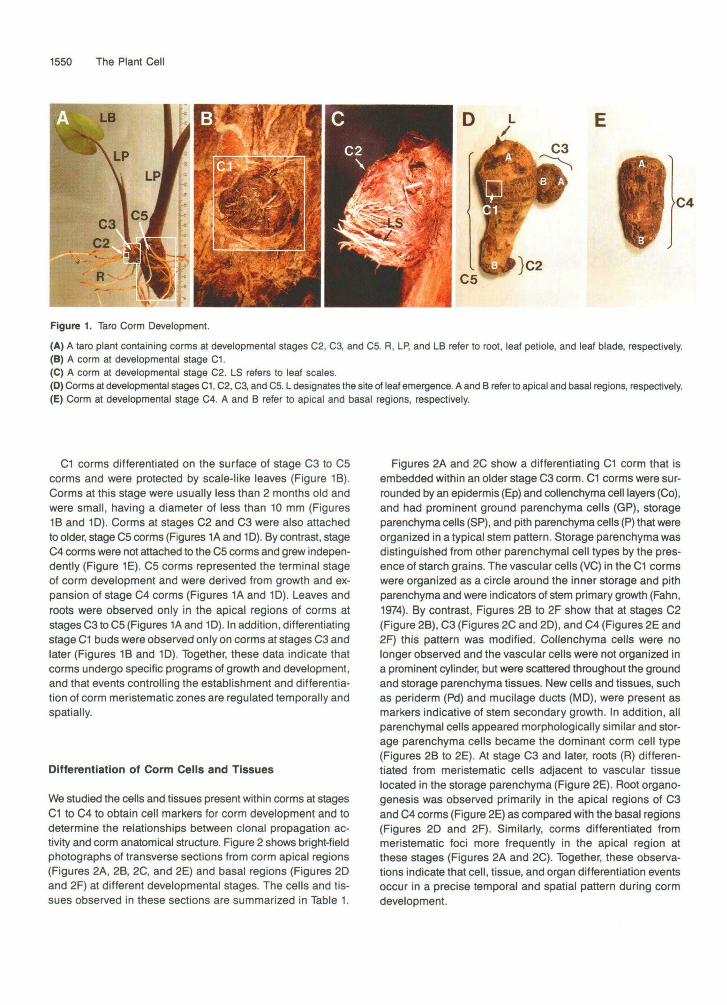
Figure 1. Taro Corm Development.
(A) A taro plant containing corms at developmental stages C2, C3, and C5. R, LR and LB refer to root, leaf petiole, and leaf blade, respectively.(B) A corm at developmental stage C1.(C) A corm at developmental stage C2. LS refers to leaf scales.(D) Corms at developmental stages C1, C2, C3, and C5. L designates the site of leaf emergence. A and B refer to apical and basal regions, respectively.(E) Corm at developmental stage C4. A and B refer to apical and basal regions, respectively.
C1 corms differentiated on the surface of stage C3 to C5corms and were protected by scale-like leaves (Figure 1B).Corms at this stage were usually less than 2 months old andwere small, having a diameter of less than 10 mm (Figures1B and 1D). Corms at stages C2 and C3 were also attachedto older, stage C5 corms (Figures 1A and 1D). By contrast, stageC4 corms were not attached to the C5 corms and grew indepen-dently (Figure 1E). C5 corms represented the terminal stageof corm development and were derived from growth and ex-pansion of stage C4 corms (Figures 1A and 1D). Leaves androots were observed only in the apical regions of corms atstages C3 toC5 (Figures 1Aand 1D). In addition, differentiatingstage C1 buds were observed only on corms at stages C3 andlater (Figures 1B and 1D). Together, these data indicate thatcorms undergo specific programs of growth and development,and that events controlling the establishment and differentia-tion of corm meristematic zones are regulated temporally andspatially.
Differentiation of Corm Cells and Tissues
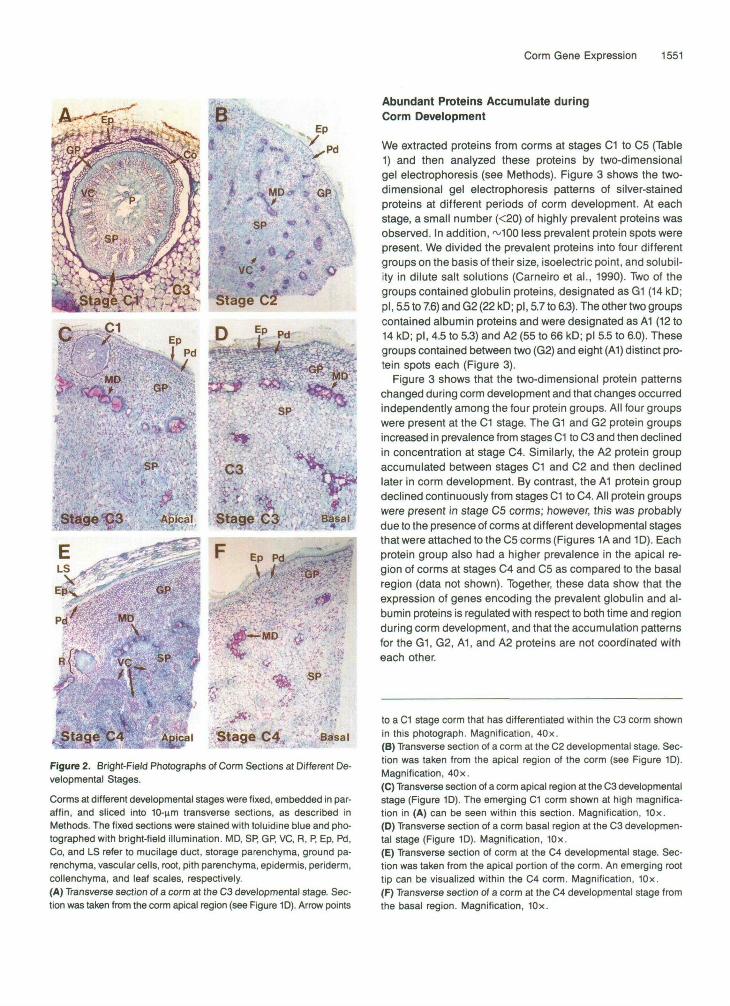
We studied the cells and tissues present within corms at stagesC1 to C4 to obtain cell markers for corm development and todetermine the relationships between clonal propagation ac-tivity and corm anatomical structure. Figure 2 shows bright-fieldphotographs of transverse sections from corm apical regions(Figures 2A, 2B, 2C, and 2E) and basal regions (Figures 2Dand 2F) at different developmental stages. The cells and tis-sues observed in these sections are summarized in Table 1.
Figures 2A and 2C show a differentiating C1 corm that isembedded within an older stage C3 corm. C1 corms were sur-rounded by an epidermis (Ep) and collenchyma cell layers (Co),and had prominent ground parenchyma cells (GP), storageparenchyma cells (SP), and pith parenchyma cells (P) that wereorganized in atypical stem pattern. Storage parenchyma wasdistinguished from other parenchymal cell types by the pres-ence of starch grains. The vascular cells (VC) in the C1 cormswere organized as a circle around the inner storage and pithparenchyma and were indicators of stem primary growth (Fahn,1974). By contrast, Figures 2B to 2F show that at stages C2(Figure 2B), C3 (Figures 2C and 2D), and C4 (Figures 2E and2F) this pattern was modified. Collenchyma cells were nolonger observed and the vascular cells were not organized ina prominent cylinder, but were scattered throughout the groundand storage parenchyma tissues. New cells and tissues, suchas periderm (Pd) and mucilage ducts (MD), were present asmarkers indicative of stem secondary growth. In addition, allparenchymal cells appeared morphologically similar and stor-age parenchyma cells became the dominant corm cell type(Figures 2B to 2E). At stage C3 and later, roots (R) differen-tiated from meristematic cells adjacent to vascular tissuelocated in the storage parenchyma (Figure 2E). Root organo-genesis was observed primarily in the apical regions of C3and C4 corms (Figure 2E) as compared with the basal regions(Figures 2D and 2F). Similarly, corms differentiated frommeristematic foci more frequently in the apical region atthese stages (Figures 2A and 2C). Together, these observa-tions indicate that cell, tissue, and organ differentiation eventsoccur in a precise temporal and spatial pattern during cormdevelopment.
Corm Gene Expression 1551
SP C3
'Apical Stage C3
(**~ .'•> ik " V
Apical Stage C4 Sdsai
Figure 2. Bright-Field Photographs of Corm Sections at Different De-velopmental Stages.Corms at different developmental stages were fixed, embedded in par-affin, and sliced into 10-nm transverse sections, as described inMethods. The fixed sections were stained with toluidine blue and pho-tographed with bright-field illumination. MD, SP, GP, VC, R, P, Ep, Pd,Co, and LS refer to mucilage duct, storage parenchyma, ground pa-renchyma, vascular cells, root, pith parenchyma, epidermis, periderm,collenchyma, and leaf scales, respectively.(A) Transverse section of a corm at the C3 developmental stage. Sec-tion was taken from the corm apical region (see Figure 1D). Arrow points
Abundant Proteins Accumulate duringCorm Development
We extracted proteins from corms at stages C1 to C5 (Table1) and then analyzed these proteins by two-dimensionalgel electrophoresis (see Methods). Figure 3 shows the two-dimensional gel electrophoresis patterns of silver-stainedproteins at different periods of corm development. At eachstage, a small number (<20) of highly prevalent proteins wasobserved. In addition, ^100 less prevalent protein spots werepresent. We divided the prevalent proteins into four differentgroups on the basis of their size, isoelectric point, and solubil-ity in dilute salt solutions (Carneiro et al., 1990). Two of thegroups contained globulin proteins, designated as G1 (14 kD;pi, 5.5 to 7.6) and G2 (22 kD; pi, 5.7 to 6.3). The other two groupscontained albumin proteins and were designated as A1 (12 to14 kD; pi, 4.5 to 5.3) and A2 (55 to 66 kD; pi 5.5 to 6.0). Thesegroups contained between two (G2) and eight (A1) distinct pro-tein spots each (Figure 3).
Figure 3 shows that the two-dimensional protein patternschanged during corm development and that changes occurredindependently among the four protein groups. All four groupswere present at the C1 stage. The G1 and G2 protein groupsincreased in prevalence from stages C1 to C3 and then declinedin concentration at stage C4. Similarly, the A2 protein groupaccumulated between stages C1 and C2 and then declinedlater in corm development. By contrast, the A1 protein groupdeclined continuously from stages C1 to C4. All protein groupswere present in stage C5 corms; however, this was probablydue to the presence of corms at different developmental stagesthat were attached to the C5 corms (Figures 1Aand 1D). Eachprotein group also had a higher prevalence in the apical re-gion of corms at stages C4 and C5 as compared to the basalregion (data not shown). Together, these data show that theexpression of genes encoding the prevalent globulin and al-bumin proteins is regulated with respect to both time and regionduring corm development, and that the accumulation patternsfor the G1, G2, A1, and A2 proteins are not coordinated witheach other.
to a C1 stage corm that has differentiated within the C3 corm shownin this photograph. Magnification, 40x.(B) Transverse section of a corm at the C2 developmental stage. Sec-tion was taken from the apical region of the corm (see Figure 1D).Magnification, 40x.(C) Transverse section of a corm apical region at the C3 developmentalstage (Figure 1D). The emerging C1 corm shown at high magnifica-tion in (A) can be seen within this section. Magnification, 10x.(D) Transverse section of a corm basal region at the C3 developmen-tal stage (Figure 1D). Magnification, 10x.(E) Transverse section of corm at the C4 developmental stage. Sec-tion was taken from the apical portion of the corm. An emerging roottip can be visualized within the C4 corm. Magnification, 10x.(F) Transverse section of a corm at the C4 developmental stage fromthe basal region. Magnification, 10x.

1552 The Plant Cell
Table 1. Major Events during Taro Corm Development
Stage Diameter8 Weight" Growth0 Tissues Present" Morphological and Anatomical Markers
C1 <10 ND <2 Ep,Co,GP,SP,VC,P
C2 10-20 1 2-3 Ep,Pd,GP,SP,VB,MD,P
C3 20-30 10-30 3-6 Ep,Pd,GP,SP,MD,VB,P
C4 30-40 30-50 6-9 Ep,Pd,GP,SP,MD,VB,P
C5 >40 >50 >9 Not Analyzed
Observed as buds in stages C3 through C5 parental corms. Stemprimary growth characterized by the presence of collenchymatissue and distinct cell types in cortical and core parenchyma tis-sues. Cylindrical arrangement of vascular cells and tissues.Roots and leaves absent.
Attached to parental corms at stage C5. Stem secondary growthcharacterized by the presence of periderm, mucilage ducts, andvascular bundles. Leaves and roots absent.
Attached to corms at stage C5. Storage parenchyma heavily vas-cularized. Roots emerging from the storage parenchyma primarilyfrom the corm apical region. C1 corms differentiating from corti-cal parenchyma. Leaves present.
Corm grows independently. No significantly different anatomicalmarkers compared to C3. C1 corms visible at the surface of thecorm.
Corm has several cormel stages, such as C2 and C3, growing atthe surface. Leaves and roots present.
* Range of size of >10 individual corms expressed in millimeters. Corms at each stage shown in Figure 1.b Range of weights of >10 individuals expressed in grams. C1 weight was not determined (ND).c Expressed in months." Ep, epidermis; Co, collenchyma; GP, ground parenchyma; SP, storage parenchyma; VC, vascular cells; P, pith; Pd, periderm; VB, vascularbundle; MD, mucilage duct. Information was taken from the histological sections shown in Figures 2 and 7.
Corm Globulins Are Related to Taste-Modifying andStorage-Organ Proteins
We sequenced the N-terminal amino acids of the corm G1 andG2 globulin proteins (Figure 3) to compare their sequence rela-tionships and to determine whether they were related to
other known proteins (see Methods). Figure 4A presents theN-terminal amino acid sequences of the G1a, G1b, G1c, G1d,G2a, and G2b proteins (Figure 3). No amino acid pomologieswere observed between the N termini of proteins in the G1and G2 globulin groups (Figure 4A). By contrast, significantamino acid homologies were observed between the N termini
Cl C3
Al
14-
C4 C5
i i i i l lpH 7.97.2 6.8 6.0 5.0 4.6
Figure 3. Two-Dimensional Gel Electrophoresis Patterns of Prevalent Corm Proteins.
Corm proteins from the designated stages were fractionated by two-dimensional gel electrophoresis and stained with silver, as described in Methods.Approximately 60 ng of protein was utilized for each stage. Isoelectric focusing (IEF) and SDS gel electrophoresis directions are indicated byarrows. Molecular weight markers are shown in kilodaltons (kD); C1 to C5 designate corm developmental stages (Table 1). G1, and G2, A1 andA2 designate globulin (G) and albumin (A) protein groups, respectively, a, b, c, and d refer to proteins within each group that were sequenced.
Corm Gene Expression 1553
A G l a
G l c
G l b
G l d
G 2 a
G 2 b
B G l d
C u r
C 02 a
10 20 30 NIPFTDNLLPSGQVLYGDGRLTAKNHQLVMQDGC
* * * * * * * * * * * * * * * * * * * * * *a* . ****** ,* NIPPTNNLLPSGQVLYGDGRLTAKH-QLVMQGDC
10 20 LGTNYLLSGQTLDTDGHLKNGDFDLVMQNI **.***********+*+**+**** LGTNYLLSGQTLNTDGHLKNGDFD
10 20 ANPILDVDGDELRPGHHRYAISEGRPVXG * * * * * * * * * * * * * * * * * **** ANPVLDVDGGELRRGNRYYAISLRR
10 20 LGTNYLLSGQTLNTDGHLKNGDFD
.* * * * * * e * * * * * . . * * * *
DNVLLSGQTLHADHSLQAGAYT
10 20 ANPILDVDGDERRPGHHRYAISEGRPVXG
* * * * * , * * * . . .. * * Mlr DSAPNPVLDIDGEKLRTGTNYYIVPVLRDHGG
* * , * * * * * * * * * e . * * * .., * G 2 b ANPILDVDGGELRRGNRYYAISLRR
10 20 G 2 a ANPILDVDGDERRPGHHRYAISEGRPVXG
..*.**..**e ***.. * .*. . . Spr ASSETPVLDINGDEVRAGENYYIVSAIWGAGG
G 2 b ANPILDVDGGELRRGNRYYAISLRR ..*.**..*.*.* *..** .* .
10 20 G 2 a ANPILDVDGDERRPGHHRYAISEGRPVXG
..e.**.**** ..* . *..*. . . Ktl NAANSPVLDTDGDELQTGVQYYVLSSISGAGG
G2b ANPILDVDGGELRRGNRYYAISLRR **,**,**.**. * e * , * *
D 10 20 G l d LGTNYLLSGQTLNTDGHLKNGDFD
. . . . . . . . . . . . . . . . . . . . . . . . T C 1 LGTNYLLSGQTLNTDGHLKNGDFD
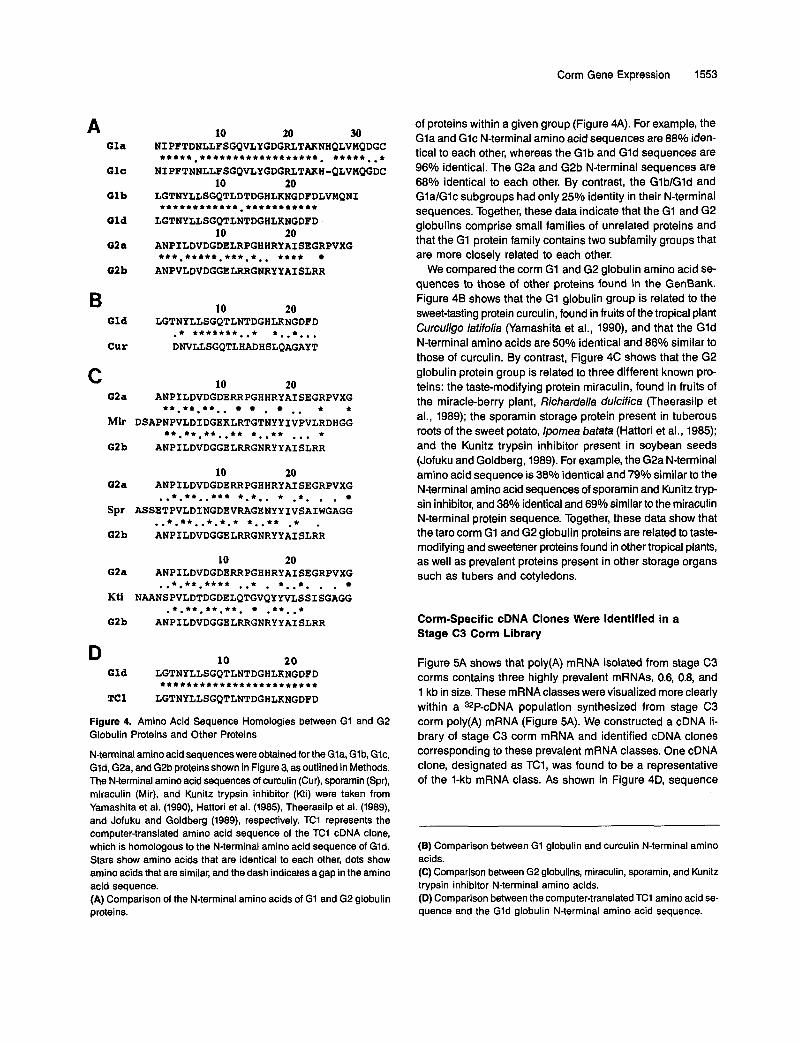
Figure 4. Amino Acid Sequence Homologies between G1 and G2 Globulin Proteins and Other Proteins
N-terminal amino acid sequences were obtained for the Gla, Glb, Glc, Gld, G2a, and G2b proteins shown in Figure 3, as outlined in Methods. The N-terminal amino acid sequences of curculin (Cur), sporamin (Spr), miraculin (Mir), and Kunitz trypsin inhibitor (Kti) were taken from Yamashita et al. (1990), Hattori et al. (1985), Theerasilp et al. (1989). and Jofuku and Goldberg (1989), respectively. TCI represents the computer-translated amino acid sequence of the TC1 cDNA clone, which is homologous to the N-terminal amino acid sequence of Gld. Stars show amino acids that are identical to each other, dots show amino acids that are similar, and the dash indicates a gap in the amino acid sequence. (A) Comparison of the N-terminal amino acids of G1 and G2 globulin proteins.
of proteins within a given group (Figure 4A). For example, the Gla and Glc N-terminal amino acid sequences are 88% iden- tical to each other, whereas the Glb and Gld sequences are 96% identical. The G2a and G2b N-terminal sequences are 68% identical to each other. By contrast, the GlblGld and GlalGlc subgroups had only 25% identity in their N-terminal sequences. Together, these data indicate that the G1 and G2 globulins comprise small families of unrelated proteins and that the G1 protein family contains two subfamily groups that are more closely related to each other.
We compared the corm G1 and G2 globulin amino acid se- quences to those of other proteins found in the GenBank. Figure 48 shows that the G1 globulin group is related to the sweet-tasting protein curculin, found in fruits of the tropical plant Curculigo latifolia (Yamashita et al., 1990), and that the Gld N-terminal amino acids are 50% identical and 86% similar to those of curculin. By contrast, Figure 4C shows that the G2 globulin protein group is related to three different known pro- teins: the taste-modifying protein miraculin, found in fruits of the miracle-berry plant, Richardella dulcifica (Theerasilp et al., 1989); the sporamin storage protein present in tuberous roots of the sweet potato, lpomea batata (Hattori et al., 1985); and the Kunitz trypsin inhibitor present in soybean seeds (Jofuku and Goldberg, 1989). For example, the G2a N-terminal amino acid sequence is 38% identical and 79% similar to the N-terminal amino acid sequences of sporamin and Kunitz tryp- sin inhibitor, and 38% identical and 69% similar to the miraculin N-terminal protein sequence. Together, these data show that the taro corm G1 and G2 globulin proteins are related to taste- modifying and sweetener proteins found in other tropical plants, as well as prevalent proteins present in other storage organs such as tubers and cotyledons.
Corm-Specific cDNA Clones Were ldentified in a Stage C3 Corm Library
Figure 5A shows that poly(A) mRNA isolated from stage C3 corms contains three highly prevalent mRNAs, 0.6, 0.8, and 1 kb in size. These mRNA classes were visualized more clearly within a 3*P-cDNA population synthesized from stage C3 corm poly(A) mRNA (Figure 5A). We constructed a cDNA li- brary of stage C3 corm mRNA and identified cDNA clones corresponding to these prevalent mRNA classes. One cDNA clone, designated as TC1, was found to be a representative of the 1-kb mRNA class. As shown in Figure 4D, sequence
(B) Comparison between G1 globulin and curculin N-terminal amino acids. (C) Comparison between G2 globulins, miraculin, sporamin, and Kunitz trypsin inhibitor N-terminal amino acids. (D) Comparison between the computer-translated TCl amino acid se- quence and the Gld globulin N-terminal amino acid sequence.

1554 The Plant Cell
LB LP C3kb
l.O
C4 C5
Figure 5. TC1 Gene Expression during Taro Corm Development.
Total and poly(A) mRNAs were isolated from leaf blades (LB), leaf peti-oles (LP), roots (R), and corms at designated developmental stages(C). The RNAs were fractionated by denaturing gel electrophoresis,transferred to nitrocellulose, and hybridized with a labeled TC1 cDNAplasmid probe, as described in Methods.(A) Presence of prevalent sequences in corm mRNA and cDNA. rRNA(3 ng) and poly(A) mRNA (3 ng) from stage 3 corms were fractionatedby denaturing gel electrophoresis and then stained with ethidium bro-mide to visualize RNA bands. 32P-cDNA was synthesized from stage3 corm poly(A) mRNA and then fractionated by electrophoresis on anondenaturing agarose gel. Lanes 1, 2, and 3 contain rRNA, poly(A)mRNA, and 32P-cDNA, respectively. Dots highlight the prevalentmRNA and cDNA classes. Sizes are given in kilobases (kb).(B) Hybridization of the TC1 cDNA plasmid probe with leaf and rootpoly(A) mRNAs (5 ng). The C3 lane contains an equivalent amountof poly(A) mRNA from stage C3 corm. Autoradiogram was exposedfor 24 hr.(C) Hybridization of the TC1 cDNA plasmid probe with corm total RNAs(10 ng) at different developmental stages (C). A and B refer to RNAsisolated from the apical and basal corm regions, respectively (Figure1). Autoradiogram was exposed for 96 hr.
We hybridized the TC1 cDNA plasmid with corm total RNAsfrom different developmental stages, as well as with total RNAsfrom corm apical and basal regions (Figure 1). Figure 5C showsthat the TC1 globulin G1d mRNA accumulated from stage C1to C2 and then decreased slightly in prevalence at later stagesof corm development. In addition, the TC1 globulin G1d mRNAwas highly prevalent in corm apical regions at stages C3, C4,and C5 and was either absent or present at a much reducedlevel in the basal regions of corms at the same developmentalstages (Figure 5C). Together, these data show that the TC1globulin G1d mRNA is corm specific and that the accumula-tion of this mRNA is regulated with respect to both region andtime during corm development.
TC1 Globulin G1d mRNA Is Present in Specific CormCell Types
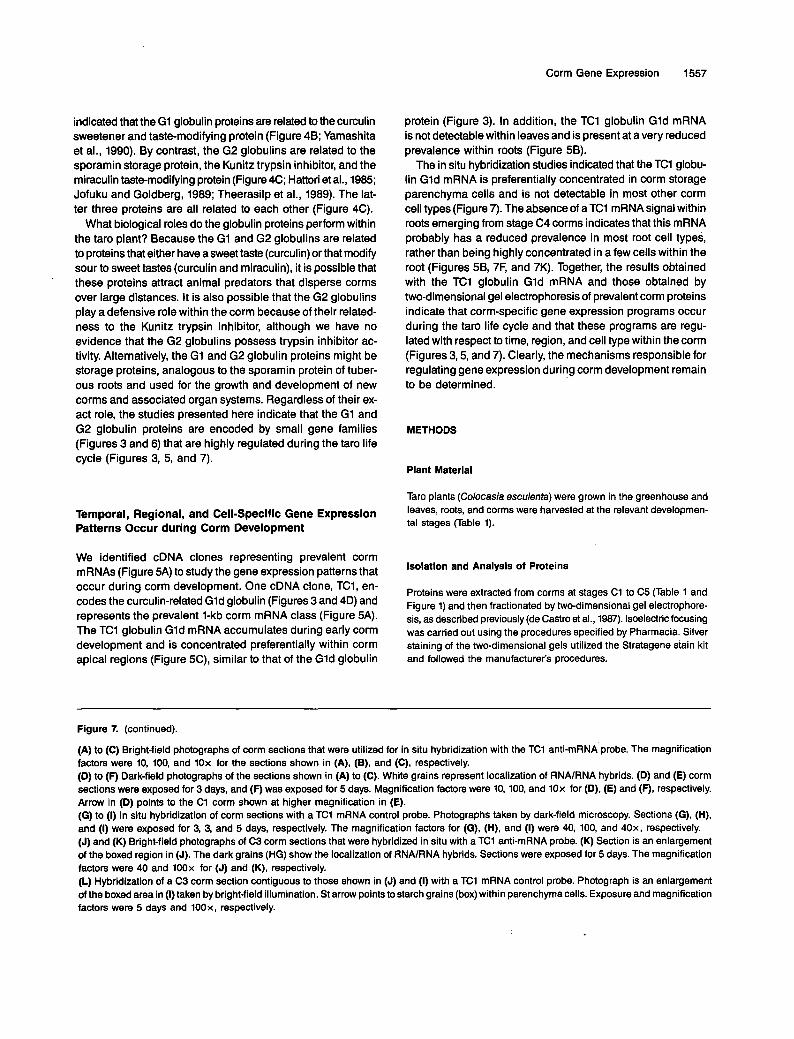
We hybridized a labeled TC1 anti-mRNA probe with corm sec-tions in situ to localize TC1 globulin G1d mRNA sequenceswithin corm cell types at different developmental stages.Figures 7A to 7C show bright-field photographs of stage C1and C3 corm transverse sections used for in situ hybridiza-tion. Figures 7D and 7E show that the TC1 anti-mRNA probeproduced an intense hybridization signal over the storage pa-renchyma of stage C1 corms. No hybridization grains abovebackground levels were observed within the pith, vascular tis-sue, ground parenchyma, or surrounding collenchyma celllayers. Figures 7D and 7F show that the TC1 anti-mRNA probealso produced an intense hybridization signal within storageparenchyma cells of stage C3 corms and to a lesser extentwithin ground parenchyma cells. No detectable hybridizationsignal was observed within mucilage ducts, vascular bundles,
analysis of the TC1 cDNA clone indicated that it encoded thecurculin-related, G1d globulin protein. We hybridized a cormDNA gel blot with a TC1 cDNA plasmid probe to determinethe representation of TC1 sequences in the taro genome. Asseen in Figure 6, the TC1 probe reacted with single-copy in-tensity to three or four Hindlll and EcoRI DNA fragments. Theseresults, and the two-dimensional protein gels presented in Fig-ure 3, indicate that the corm G1 globulin group is encoded bya small gene family.
TC1 Globulin G1d mRNA Is Corm Specific and HighlyRegulated during Taro Development
We hybridized the TC1 cDNA plasmid with gel blots contain-ing stage C3 corm, root, leaf blade, and leaf petiole mRNAs.Figure 5B shows that a strong 1-kb hybridization signal wasobtained with corm poly(A) mRNA and a 100-fold weaker sig-nal was observed with root poly(A) mRNA. By contrast, nodetectable hybridization signals were observed with either leafpetiole or leaf blade poly(A) mRNAs (Figure 5B).
H E+H
2.0 — 9
Figure 6. Representation of TC1 DNA Sequences in the Taro Genome.
Taro DNA was digested with either EcoRI (E), Hindlll (H), or both en-zymes (E + H), fractionated by electrophoresis, transferred tonitrocellulose, and hybridized with a labeled TC1 cDNA plasmid probe,as described in Methods. Size calibrations are given in kilobases (kb).

Corm Gene Expression 1555
periderm, or epidermis (Figure 7D). In addition, the TC1 anti-mRNA probe did not hybridize detectably with a differen- tiating root emerging from the stage C3 corm apical region (Figure 7F).
Figures 7G to 71 show results obtained with a TC1 mRNA control probe used to monitor background hybridization. No detectable hybridization grains were observed over any corm tissues (Figures 7G and 7H) or over an emerging root (Figure 71). However, white patches were observed with this probe un- der dark-field illumination over storage parenchyma tissue (Figures 7G and 71). Figures 7J and 7K show similar sections that were hybridized with the TC1 anti-mRNA probe and pho- tographed by bright-field illumination. Dark hybridization grains (HG), representing RNAlRNA hybrids, were visualized spe- cifically within storage parenchyma cells (Figure 7K). By contrast, Figure 7L shows a bright-field photograph of an anal- ogous section that was hybridized with the TC1 mRNA control probe. Starch grains were visualized within the storage pa- renchyma cells (boxed area), but dark grains representing RNAlRNA hybrids were not present. This indicates that the white patches observed with the TC1 mRNA control probe un- der dark-field illumination were due to dark-field scattering effects by the starch grain-filled storage parenchyma cells. Together, these results show that the TC1 globulin Gld mRNA is localized preferentially within storage parenchyma cells of stage C1 and C3 corms and to a lesser extent within the ground parenchyma at the C3 stage of development.
DISCUSSION
Vegetative propagation is a widespread reproductive strategy among vascular and nonvascular plants (Silander, 1985). Al- though flowering plants may utilize different organs for somatic propagation, the establishment and dispersa1 of genetic clones in higher plants are carried out frequently by specialized un- derground stems, such as tubers, rhizomes, and corms (Richards, 1986). A corm is a short, swollen, modified stem that develops in a vertical position at or below ground leve1 (Bell, 1991). Corms generate scale and foliage leaves, roots, and new corms from localized meristematic zones. These specialized stems are found among both monocots and dicots. In this investigation, we studied the morphological and gene expression patterns that occur during corm development.
and the absence of organogenesis and new corm propagules (Figures 1B and 2A). The C2 stage corms are present on the surface of C5 stage corms (Figures lA, lC, and 1D). Although no leaf or root primordia are present at the C2 stage (Figure 2B), cells and tissues that are markers of stem secondary growth are present (Figure 2B and Table 1). Later stages of development, represented by stages C3 through C5, are characterized by increasing independence from the parental corm (Table 1, Figures 1D and 1E). The deposition of storage products (starch and proteins) in parenchyma cells, the ap- pearance of young corms within the cortical parenchyma, and the generation of roots and leaves contribute to the establish- ment of a fully independent, self-propagating corm (Figures 1D and 2E). These results suggest that corm development is characterized by two phases, an early phase, in which the cel- lular pattern of the corm is established, including lateral meristems which give rise to new corms later in development, and a late phase, which is characterized by the developing corm as an independent propagative center.
Clonal Propagation Occurs within Corm Cortical Parenchyma Tissue
Corm clonal propagation results from localized meristematic activities (Figures 1A and 2C). C1 stage corms are found ex- clusively among the cortical parenchyma cells of parental corms at stages C3 or later (Figures 2A and 2C). No develop- ing corms were detected within the storage parenchyma or other tissue layers of the parental corm (Figures 2A and 2C). These observations indicate that the establishment of corm primordia is both spatially and temporally controlled during corm development. In addition, root and leaf development are uncoupled spatially from corm specification. Leaf differentia- tion is restricted to the upper apical region of the parental corm (Figure lD), and root primordia are adjacent to vascular bun- dles embedded within the core, or storage parenchyma tissue (Figure 2E). These data indicate that (1) independent meri- stematic activities are responsible for establishing roots, leaves, and new cormels from the parental corm; and (2) a mature, differentiated corm is a complex structure, in which meri- stematic centers directly related to vegetative propagation are developmentally distinct from foci controlling the establishment of organs involved in the maintenance of the parental corm (e.g., roots and leaves).
Corm Globulin Proteins Are Related to Taste-Modifying and Sweetener Proteins Found in Other Tropical Plants
We identified four prevalent protein groups that are regulated during corm development (Figure 3). These protein groups are concentrated preferentially within corm apical regions (Figures 1 and 2), suggesting that they are localized primarily with- in the storage parenchyma (Figure 2). Sequencing studies
Corm Clonal Propagation 1s a Late Developmental Event
We divided corm development into five different stages (Fig- ure 1 and Table 1). The C1 stage corm is typical of an early developing mrm and is localized inside an older, parental corm. C1 corms are characterized by the presence of primary tissues

1556 The Plant Cell
V*
Stage C3
Figure 7. Localization of TC1 mRNA within Developing Corms.
Corms at the designated developmental stages were fixed, embedded in paraffin, sliced into 10-nm sections, and hybridized with TC1 single-stranded ^S-RNA probes, as outlined in Methods. Corm developmental stages are described in Table 1 and shown in Figures 1 and 2. Ep, Pd,GP, MD, SP, Co, P, R, HG, VB, VC, and St refer to epidermis, periderm, ground parenchyma, mucilage duct, storage parenchyma, collenchyma,pith, root, hybridization grains, vascular bundle, vascular cells, and starch grains, respectively.
Corm Gene Expression 1557
indicated that the G1 globulin proteins are related to the curculin sweetener and taste-modifying protein (Figure 48; Yamashita et al., 1990). By contrast, the G2 globulins are related to the sporamin storage protein, the Kunitz trypsin inhibitor, and the miraculin taste-modifying protein (Figure 4C; Hattori et al., 1985; Jofuku and Goldberg, 1989; Theerasilp et al., 1989). The lat- ter three proteins are all related to each other (Figure 4C).
What biological roles do the globulin proteins perform within the taro plant? Because the G1 and G2 globulins are related to proteins that either have a sweet taste (curculin) or that modify sour to sweet tastes (curculin and miraculin), it is possible that these proteins attract animal predators that disperse corms over large distances. It is also possible that the G2 globulins play a defensive role within the corm because of their related- ness to the Kunitz trypsin inhibitor, although we have no evidence that the G2 globulins possess trypsin inhibitor ac- tivity. Alternatively, the G1 and G2 globulin proteins might be storage proteins, analogous to the sporamin protein of tuber- ous roots and used for the growth and development of new corms and associated organ systems. Regardless of their ex- act role, the studies presented here indicate that the G1 and G2 globulin proteins are encoded by small gene families (Figures 3 and 6) that are highly regulated during the taro life cycle (Figures 3, 5, and 7).
Temporal, Regional, and Cell-Specific Gene Expression Patterns Occur during Corm Development
We identified cDNA clones representing prevalent corm mRNAs (Figure 5A) to study the gene expression patterns that occur during corm development. One cDNA clone, TC1, en- codes the curculin-related Gld globulin (Figures 3 and 4D) and represents the prevalent 1-kb corm mRNA class (Figure 5A). The TC1 globulin G ld mRNA accumulates during early corm development and is concentrated preferentially within corm apical regions (Figure 5C), similar to that of the Gld globulin
protein (Figure 3). In addition, the TCl globulin G ld mRNA is not detectable within leaves and is present at a very reduced prevalence within roots (Figure 58).
The in situ hybridization studies indicated that the TC1 globu- lin G ld mRNA is preferentially concentrated in corm storage parenchyma cells and is not detectable in most other corm cell types (Figure 7). The absence of a TC1 mRNA signal within roots emerging from stage C4 corms indicates that this mRNA probably has a reduced prevalence in most root cell types, rather than being highly concentrated in a few cells within the root (Figures 56, 7F, and 7K). Together, the results obtained with the TC1 globulin G ld mRNA and those obtained by two-dimensional gel electrophoresis of prevalent corm proteins indicate that corm-specific gene expression programs occur during the taro life cycle and that these programs are regu- lated with respect to time, region, and cell type within the corm (Figures 3,5, and 7). Clearly, the mechanisms responsible for regulating gene expression during corm development remain to be determined.
METHODS
Plant Material
Taro plants (Colocasia esculenta) were grown in the greenhouse and leaves, roots, and corms were harvested at the relevant developmen- tal stages (Table 1).
lsolatlon and Analysls of Proteins
Proteins were extracted from corms at stages C1 to C5 (Table 1 and Figure 1) and then fractionated by two-dimensional gel electrophore- sis, as described previously (de Castro et al., 1987). lsoelectric focusing was carried out using the procedures specified by Pharmacia. Silver staining of the two-dimensional gels utilized the Stratagene stain kit and followed the manufacturer’s procedures.
Figure 7. (continued).
(A) to (C) Bright-field photographs of corm sections that were utilized for in situ hybridization with the TC1 anti-mRNA probe. The magnification factors were 10. 100, and 1Ox for the sections shown in (A), (B), and (C), respectively. (D) to (F) Dark-field photographs of the sections shown in (A) to (C). White grains represent localization of RNAlRNA hybrids. (D) and (E) corm sections were exposed for 3 days, and (F) was exposed for 5 days. Magnification factors were 10, 100, and 1Ox for (D), (E) and (F), respectively. Arrow in (D) points to the C1 corm shown at higher magnification in (E). (G) to (I) In situ hybridization of corm sections with a TC1 mRNA control probe. Photographs taken by dark-field microscopy. Sections (G), (H), and (I) were exposed for 3, 3, and 5 days, respectively. The magnification factors for (G), (H), and (I) were 40, 100, and 40x, respectively. (J) and (K) Bright-field photographs of C3 corm sections that were hybridized in situ with a TC1 anti-mRNA probe. (K) Section is an enlargement of the boxed region in (J). The dark grains (HG) show the localization of RNAlRNA hybrids. Sections were exposed for 5 days. The magnification factors were 40 and lOOx for (J) and (K), respectively. (L) Hybridization of a C3 corm section contiguous to those shown in (J) and (I) with a TC1 mRNA control probe. Photograph is an enlargement of the boxed area in (I) taken by bright-field illumination. St arrow points tostarch grains (box) within parenchyma cells. Exposure and magnification factors were 5 days and l O O x , respectively.
1558 The Plant Cell
Proteins used for sequencing were fractionated by two-dimensional gel electrophoresis and then transferred overnight to Bio-Rad PVDF membranes, as outlined by Bio-Rad. Protein microsequencing was performed by an Applied Biosystem 4758 gas-phase protein sequencer at the UCLA Protein Microsequencing Facility using 500 pmoles per sample. Homology comparisons were carried out using the GenBank data base (Pearson and Lipman, 1988).
lsolation and Analysis of RNA
a Conselho Nacional de Pesquisa Predoctoral Fellowship from the Brazilian government and by a UCLA Biotechnology Predoctoral Traineeship. We express our gratitude to Audrey Fowler of the UCLA Protein Microsequencing Facilify for carrying out the protein sequencing analysis and to Margaret Kowalczyk for preparing the figures shown in this paper. We also express our thanks to Mr. Dan Horowitz of the UCLA Biology Department for administering the Rockefeller Founda- tion funds that supported this research.
Polysomal mRNAs were isolated according to the procedures of Kamalay and Goldberg (1980). Poly(A) mRNAs were selected by oligo(dT)-cellulose chromatography (Davis et al., 1986). Total RNAs were prepared as described by Cox and Goldberg (1988). RNAs were size fractionated by denaturing gel eiectrophoresis following the glyoxal method of McMaster and Carmichael (1977), or the formaldehyde method of Berger and Kimmell(1987). RNA gel blot analysis was car- ried out according to the procedures of Davis et al. (1986) for the nitrocellulose and glyoxal gel analysis, or the procedures outlined by Schleicher & Schuell for the Nytran and formaldehyde gel analysis.
Construction and Screening of a Corm cDNA Library
A cDNA library was constructed for stage C3 corm polysomal poly(A) mRNA utilizing the the Amersham cDNA cloning system and manufac- turer's procedures.. Double-stranded cDNA was tailed with poly(dG) and annealed with poly(dC)-tailed, Pstl-digested pBR329 plasmid DNA as described by Berger and Kimmell(1987). Transformation of Esche- richia coli HBlOl cells with the recombinant cDNA plasmids followed the protocol outlined by Bethesda Research Laboratories Life Tech- nologies. TetR AmpS recombinant cDNA clones were digested with Pstl and analyzed by agarose gel electrophoresis. Plasmids contain- ing cDNA inserts greater than 0.3 kb were chosen for further study. Ten cDNA clones were digested, labeled by nick translation using the Amersham kit following the manufacturer's procedures, and hybrid- ized with C3 corm mRNA gel blots to identify clones corresponding to the prevalent mRNAs and cDNAs obsewed in Figure 6A. One clone, designated as TCI, represented the prevalent I-kb corm mRNA class and was chosen for further analysis.
Received October 1, 1992; accepted November 2, 1992.
REFERENCES
Bell, A.D. (1991). Plant Form. (Oxford: Oxford University Press).
Berger, S.L., and Kimmell, A.R. (1987). Guide to Molecular Cloning Techniques. Methods in Enzymology. (New York: Academic Press).
Carneiro, M., Coutinho, M.V., Rodrigues, CA., and de Castro, L.A.B. (1990). lsolation and characterization of the major albumin from Colocasia esculenta corms. Plant Sci. 67, 39-46.
Cox, K.H., and Goldberg, R.B. (1988). Analysis of plant gene expres- sion. In Plant Molecular Biology: A Practical Approach. C.H. Shaw, ed (Oxford: IRL Press), pp. 1-34.
Davis, L.G., Dibner, M.D., and Battey, J.F. (1986). Basic Methods in Molecular Biology. (New York Elsevier), pp. 136-142.
de Castro, L.A.B., Lacerda, Z., Aramayo, R.A., Sampalo, M. J.A.M., and Gander, E.S. (1987). Evidence for a precursor molecule of Bra- zil nut 2s seed protein from biosynthesis and cDNA analysis. MOI. Gen. Genet. 206, 338-343.
Fahn, A. (1974). Plant Anatomy. (New York: Pergamon Press). Hattori, T., Nakagawa, T., Maeshima, M., Nakamura, K., and Asahi,
T. (1985). Molecular cloning and nucleotide sequence of a cDNA for sporamin, the major soluble protein of Sweet tuberous roots. Plant MOI. Biol. 5, 313-320.
Jofuku, K.D., and Goldberg, R.B. (1988). Analysis of plant gene struc- ture. In Plant Molecular Biology: A Practical Approach, C.H. Shaw, ed (Oxford: IRL Press), pp. 37-66.
Corm Anatomical Sections and In Situ Hybridization
In situ hybridization experiments were performed as described by Cox and Goldberg (1988) and by Perez-Grau and Goldberg (1989). Corm histological sections were made according to the procedures of Cox and Goldberg (1988). Single-stranded 35S-RNA probes were synthe- sized using the Promega pGEM transcription system.
Jofuku, K.D., and Goldberg, R.B. (1989). Kunitz trypsin inhibitor genes are differentially expressed during the soybean life cycle and in trans- formed tobacco plants. Plant Cell 1, 1079-1093.
Kamalay, J.K., and Goldberg, R.B. (1980). Regulation of structural gene expression in tobacco. Cell 19, 934-946.
Koltunow, A.M., Truettner, J., Cox, K.H., Wallroth, M., and Goldberg, R.B. (1990). Different temporal and spatial gene expression patterns occur during anther development. Plant Cell 2, 1201-1224.
McMaster, G.K., and Carmichael, G.G. (1977). Analysis of single- stranded nucleic acid on polyacrylamide and agarose gels by using glyoxal acid and acridine orange. Proc. Natl. Acad. Sci. USA 74,
Pate, J.S., and Dixon, K.W. (1982). Tuberous, Cormous, and Bulbous Plants. Biology of an Adaptative Strategy in Western Australia. (Nedlands: University of Western Australia Press).
DNA lsolation and Gel Blot Analysis
Taro DNA was isolated as described by Jofuku and Goldberg (1988).
Koltunow et al. (1990). DNA gel blot analysis was carried out according to the method of 4835-4838.
ACKNOWLEDGMENTS Pearson, W.R., and Lipman, D.J. (1988). lmproved tools for biologi- cal sequence comparison. Proc. Natl. Acad. Sci. USA 85,2444-2448.
Perez-Grau, L., and Goidberg, R.B. (1989). Soybean seed protein genes are regulated spatially during embryogenesis. Plant Cell 1, L.A.B. d. C. was funded by a Rockefeller Foundation Biotechnology
Fellowship and by EMBRAPAKENARGEN. G.R.d.l? was funded by 1095-1109.
Corm Gene Expression 1559
Raven, P.H., Evert, R.F., and Eichhorn, S.E. (1986). Biologyof Plants. (New York: Worth).
Richards, A.J. (1986). Plant Breeding Systems. (London: Unwin Hy- man Ltd.).
Silander, J.A. (1985). Microevolution in clonal plants. In Population Biology and Evolution of Clonal Organisms. J.B.C. Jackson, L.W. Buss, and R. Cook, eds (New Haven: Yale University Press), pp.
Strauss, M.S., Stephens, G.C., Gonales, G.J., and Ardltti, J. (1980). Genetic variability in taro, Colocasia esculenta. Ann. Bot. 45,429-4s.
Theerasilp, S., Hitotsuya, H., Nakajo, S., Nakaya, K., Nakamura, Y., and Kurihara, Y. (1989). Complete amino acid sequence and
107-152.
structural characterization of the taste-modifying protein, miracu- lin. J. Biol. Chem. 264, 6655-6659.
Yamashita, H., Theerasilp, S., Aluchy, T., Nakaya, K., Nakamura, N., and Kurihara, Y. (1990). Purification and complete amino acid sequence of a new type of sweet protein with taste-modifying activ- ity, curculin. J. Biol. Chem. 265, 15770-15775.
tial. (Honolulu: University of Hawaii Press).
Wllls, R.B., Lim, J.S.K., Greenfield, H., and Bayliss-Smith, T. (1983). Nutrient composition of taro (Colocasia esculenta) cultivars from the Papua New Guinea Highlands. J. Sci. Food Agric. 34, 1137-1142.
Wang, J.K. (1983). Taro-a review of Colocasia esculenta and its poten-

DOI 10.1105/tpc.4.12.1549 1992;4;1549-1559Plant Cell
L A de Castro, M Carneiro, D de C Neshich and G R de PaivaSpatial and temporal gene expression patterns occur during corm development.
This information is current as of April 5, 2020
Permissions https://www.copyright.com/ccc/openurl.do?sid=pd_hw1532298X&issn=1532298X&WT.mc_id=pd_hw1532298X
eTOCs http://www.plantcell.org/cgi/alerts/ctmain
Sign up for eTOCs at:
CiteTrack Alerts http://www.plantcell.org/cgi/alerts/ctmain
Sign up for CiteTrack Alerts at:
Subscription Information http://www.aspb.org/publications/subscriptions.cfm
is available at:Plant Physiology and The Plant CellSubscription Information for
ADVANCING THE SCIENCE OF PLANT BIOLOGY © American Society of Plant Biologists