spatial analysis of winter forage cropping in … library/research and reports/land...spatial...
TRANSCRIPT

Spatial analysis of winter forage cropping in Southland and the
implications for water quality
management Technical Report
November 2016
Lisa Pearson, Soil and Freshwater Scientist,
Matt Couldrey, Scientific Officer, Geospatial Specialist, and Ewen Rodway, Chemistry and Groundwater Environmental Scientist
SRC Publication No 2016-13
2
Document Quality Control
Environment Southland Division:
Environmental Information
Report reference: Title: Spatial analysis of winter forage cropping in Southland and the implications for water quality management
No: 2016-13
Prepared by:
Lisa Pearson, Soil and Freshwater Scientist
Matt Couldrey, Scientific Officer – Geospatial Specialist
Ewen Rodway, Chemistry and Groundwater Environmental Scientist
Reviewed by:
Nick Ward, Team Leader – Marine and Freshwater Scientist
Roger Hodson, Water Quality Scientist
Claire Jordan, Senior Policy Planner
Approved for issue by:
Graham Sevicke-Jones, Director of Science and Information
Date issued: November 2016 Project Code: 4065.1452.940
Document History
Version: 1 Status: Final
Date: November 2016
Doc ID: 2016-13
Acknowledgements The authors would like to thank Dr. Clint Rissmann (Land and Water Science Ltd) and Environment Southland staff Emma Moran and Sam Dixon for the useful discussions and advice provided during the preparation of this report. Cover photo acknowledgement: Michael Killick
© All rights reserved.
This publication may not be reproduced or copied in any form, without the permission of Environment Southland.
This copyright extends to all forms of copying and any storage of material in any kind of information retrieval system.

Page 3
Executive Summary
During winter in Southland, when there is little pasture growth, cattle, sheep and deer are often break-fed on forage crops (winter grazing). Winter grazing activities are recognised as a critical source area for contaminants from agricultural areas. Winter grazing of stock on forage crops can account for a significant proportion of annual nutrient and sediment loss from the farm system, as well as causing damage to the soil through pugging and compaction. Therefore, knowing where the activity occurs and the potential impacts on water quality from contaminant loss are essential for a regional council working under the National Policy Statement for Freshwater Management (2014) and other legislative requirements. This report documents recent work by Landcare Research and Environment Southland to understand the extent of winter forage crops in Southland, and collates advice and technical information on risks to water quality, which were used in the formulation of the proposed Southland Water and Land Plan. To build this knowledge, Environment Southland contracted Landcare Research to construct a map of livestock forage locations throughout winter of 2014 for the entire Southland region. Environment Southland reprocessed the map from a raster image into polygons using ArcGIS, and refined the output using Land Cover Database (LCDB v4.1), the Digital Elevation Model (DEM, 8m resolution), Southland Physiographic Zones and the Southland Land Use Map. A minimum size of crop area of 1 ha was applied to minimise single pixel errors. The extent of winter forage crops in Southland is reported by forage crop area on a property, by land use classification and by physiographic zone. This method identified 68,155 ha of winter forage crop in Southland in 2014, which could be located to properties using the Southland Land Use Map. However, this assessment is likely to be conservative due to the resolution of the pixel based classification. The Oxidising, Old Mataura, and Peat Wetlands Physiographic Zones have been identified as the most susceptible to nutrient (N and P), sediment and microbial loss and water quality degradation resulting from winter grazing. In agricultural areas, the shallow groundwater below the Old Mataura and Oxidising Zones have elevated concentrations of nitrogen compared to other areas, while the Peat Wetlands has elevated risk for phosphorus loss. Approximately 20,715 ha of forage crop were grown in these zones in 2014. The Riverine Physiographic Zone is also susceptible to nutrient loss, especially nitrogen leaching, however, contaminants do not accumulate to high concentrations in the groundwater due to the large flushing potential (diluting contaminants) provided from alpine and bedrock river recharge. Bedrock/Hill country physiographic zone could also be considered high risk due to the large amount of crop grown in this unit, especially on sloping land, which increases the potential for sediment, phosphorus and microbial contaminant loss. Winter grazing in these zones contributes to the contaminant load transported to the receiving environments. The potential for contaminant dilution by the Riverine and Bedrock/Hill country zones are reduced with increased contaminant concentrations and total load increases from these zones. The proposed Southland Water and Land Plan (2016) would require approximately 308 properties to obtain resource consent to continue their current wintering practices. This represents approximately 46% of the total winter forage crop area in Southland estimated from this 2014 survey. The estimates of policy implications are to be used as a guide only. To improve certainty around the analysis, data from multiple years would be required. This
Page 4
assessment is also limited by identification of properties in the Southland Land Use Map, where legal property boundaries are used (Pearson and Couldrey, 2016). For future assessments, the procurement of higher frequency imagery over an extended time period would increase certainty around environmental impact and policy implications. It is recommended higher resolution imagery is collected over a longer time period, or whenever conditions are suitable (cloud free days) if using open source data over the entire year. Additional benefits to collecting imagery over the course of a year are cultivation, crop rotations and pasture renewal practices can be better understood. These are all activities which disturb and remove soil cover, which increase nutrient and sediment loss from the paddock without careful management. Monitoring of where these activities take place and frequency will aid Environment Southland in developing policy, assessing implications and policy effectiveness.
Page 5
Table of Contents
Executive Summary ................................................................................................................ 3
Table of Contents ................................................................................................................... 5
List of Figures ......................................................................................................................... 6
List of Tables .......................................................................................................................... 8
1. Introduction ................................................................................................................... 9
2. Objectives .................................................................................................................... 10
3. Background .................................................................................................................. 10
3.1 Landcare Research – Winter forage map ........................................................................ 10
3.2 Proposed Southland Water and Land Plan ..................................................................... 15
3.2.1 Working Draft Water and Land – Community consultation document ................. 15 3.2.2 Proposed Southland Water and Land Plan – Rule 23 Intensive winter grazing ..... 15 3.2.3 Rule Scenarios......................................................................................................... 16
4. Methodology ................................................................................................................ 17
4.1 Accuracy assessment ..................................................................................................... 17
4.2 Winter forage map refinement method ........................................................................ 18
4.2.1 Polygon conversion ................................................................................................ 18 4.2.2 Land Cover Database (version 4.1) ......................................................................... 20 4.2.3 Topography (slope) ................................................................................................. 20 4.2.4 Physiographic Zones ............................................................................................... 20 4.2.5 Land Use ................................................................................................................. 21
4.3 Property scale and percentage of a landholding ........................................................... 21
4.3.1 Classifying winter forage area in hectares ............................................................. 21 4.3.2 Classifying winter forage by property area ............................................................ 22
5. Results and Discussion .................................................................................................. 22
5.1 Data correction .............................................................................................................. 22
5.2 Winter forage distribution ............................................................................................. 24
5.2.1 Land Use ................................................................................................................. 24 5.2.2 Property area .......................................................................................................... 29 5.2.3 Physiographic Zones ............................................................................................... 31
5.3 Estimation of dairy support on non-dairy properties .................................................... 33
5.4 Implications for water quality ........................................................................................ 34
5.4.1 Southland Physiographic Zones .............................................................................. 35 5.4.2 Soils ......................................................................................................................... 39
5.5 Policy implications .......................................................................................................... 40
6. Summary and Recommendations .................................................................................. 44
7. References ................................................................................................................... 46
Appendix 1: Data refinement process ................................................................................... 49
Appendix 2: Winter forage on Land Use - Statistics ............................................................... 52
Appendix 3: ArcMap Definition Queries for Policy Analysis ................................................... 57
Page 6
List of Figures
Figure 1: Southland Region, 2014 – map of agricultural land under winter livestock forage
crops, plus other non-forage land. Enlarged areas (a) and (b) are shown in Figure 2 (North & Belliss, 2015).................................................................................................. 12
Figure 2: Enlarged areas outlined in Figure 1 (North & Belliss, 2015). Classifications are from: a)
good image coverage, where there are 2-5 autumn (pre-grazing) images (2-3 of these high-trust) and 2-4 spring (post grazing) images (2-3) of these high trust; b) poor image coverage, where there are 1-2 autumn images (0-2 of these high-trust) and 1-2 spring images (0-1 high-trust). ..................................................................................... 13
Figure 3: Examples of potential errors over aerial photography a) scrub and stream beds, b)
gardens/houses of lifestyle blocks, c) road verges, and d) wetland and scrub cover. Dark blue areas symbolise the paddocks of winter forage – swede/brassica, light blue is lower certainty winter forage - swede/brassica, green areas are paddocks of pasture/other, bare soil in spring, and pink is newly planted pasture or crop. ........... 18
Figure 4: Process of converting the Winter Fodder Crop raster image to polygons a) shows the
original output of the Landcare Research winter forage map (multitemp_classn1.tif) where the blue areas symbolise the paddocks of winter forage – swede/brassica, light green areas are paddocks of pasture and pink is newly planted pasture or crop, b) is the result of the conversion of the raster image to a polygon format highlighting the multiple classifications that determine ‘Winter Forage’, c) displays the output of the ‘Dissolve’ with <1 ha errors still present and d) shows the final result of the polygon conversion methodology (scale 1:20,000). .................................................................. 19
Figure 5: Examples of likely spectral errors over aerial photography (a and b) and the end result
of data refinement for the same areas (c and d). Dark blue areas symbolise the paddocks of winter forage – swede/brassica, light blue is lower certainty winter forage - swede/brassica, green areas are paddocks of pasture/other, with bare soil in spring, and pink is newly planted pasture or crop. Example a) shows gardens/houses of lifestyle blocks and b) scrub, stream beds, wetlands, and road verges. ................. 23
Figure 6: a) Area of crop on a property and b) percentage of a property in crop by industry
group. The y-axis scale of a) has been adjusted to represent the majority of the data range. The upper quartile range (maximum value) is outside the scale range and is presented as a value next to the error bar................................................................... 26
Figure 7: Winter forage crop area displayed by land use as defined in Pearson and Couldrey,
2016. The pastoral cover category shows area of grassland in Southland from LCDB v4.1. .............................................................................................................................. 27
Figure 8: The blue insert (top) shows paddocks of winter forage grown in northern Southland
and the red insert (bottom) shows paddocks of winter forage grown on the Otautau Plains, representative of lowland Southland................................................................ 28
Figure 9: Area of winter forage crop to other land covers by industry area. Pasture, cropping
and forest land covers obtained from LCDB4.1, with winter forage crop area from this study subtracted from the area of intensive pasture. ................................................. 29

Page 7
Figure 10: Amount of winter forage crop on a property represented by the total area of the property. ....................................................................................................................... 30
Figure 11: Percentage of winter crop on a property. ..................................................................... 31 Figure 12: Wintering systems of 204 farms in South Otago and Southland – 2010 (Tarbotton et
al., 2012). ...................................................................................................................... 34 Figure 13: Southland soils vulnerable to compaction and water logging. The location of winter
forage crops across the region are shown in black. ..................................................... 40 Figure 14: Properties likely to be affected by Rule 23 in the notified Water and Land Plan.
Sensitive Physiographic Zones for winter forage cropping are Old Mataura and Peat Wetlands. A total of 308 properties will be affected, 23 properties >20 ha on vulnerable Physiographic Zones, 266 properties >50 ha of winter forage in total, and 19 properties exceed both thresholds. ........................................................................ 43
Page 8
List of Tables
Table 1: Total pixel count of each classification and the calculated area (adapted from: North
& Belliss, 2015). ............................................................................................................ 11 Table 2: Classes in LCR winter forage map used for the accuracy assessment (North & Belliss,
2015). The highlighted classes are those used by Environment Southland for further analysis. ........................................................................................................................ 14
Table 3: Summary of LRC winter forage map showing area (ha) and percentage of total
mapped area/total agricultural land (excluding the no data/masked out area). The percentage of agricultural land is displayed in brackets. ............................................. 14
Table 4: Final estimated amount of winter forage in Southland for 2014 by crop type
classification and slope classes. .................................................................................... 24 Table 5: Final estimated amount of winter forage in Southland for 2014 by Landcare Research
(North and Belliss, 2015) and Environment Southland. ............................................... 24 Table 6: Final estimated amount of winter forage in Southland by area, average area, and
percentage of total forage crop. Total area of land use includes non-pastoral and ineffective areas. Number of properties represents the number of properties with forage crop in Southland. Property area and land use area as identified from the Southland Land Use Map (Pearson and Couldrey, 2016) ............................................. 25
Table 7: Winter forage area (hectares) in 2014 by Physiographic Zone and land use. ............. 32 Table 8: Winter forage area (hectare) in 2014 by Physiographic Zone and slope. .................... 33 Table 9: Dry matter content of different forage crops grown in Southland (adapted from
Fielden & Smith, 1998 and Agricom, 2015*). ............................................................... 33 Table 10: Winter forage crop area on soils vulnerable to structural compaction and
waterlogging. ................................................................................................................ 39 Table 11: Outcomes of potential policy scenarios for winter grazing in Southland based on the
2014 winter grazing survey. ......................................................................................... 42
Page 9
1. Introduction
Wintering livestock by break-feeding on forage crops is common practice in Southland as pasture growth over winter is minimal. Kale (Brassica oleracea), swedes (B. napobrassica) and turnips (B. rapa) are commonly used as winter livestock forage crops in Southland along with other brassica varieties, fodder beet (Beta vulgaris), and oats (Avena sativa). Recent research has highlighted that on-paddock grazing of stock on forage crops over the months of May-September (inclusive) contributes a disproportionately large proportion of nutrient losses from the whole farm system through nitrogen leaching in excess of 60kg N ha/yr, P losses of over 2 kg P ha/yr and up to 5000 kg/ha/yr of sediment on vulnerable soil types (McDowell & Stevens, 2008; McDowell & Houlbrooke, 2008; Smith et al., 2008; de Klein et al. 2010; Monaghan et al., 2010, Shepherd et al. 2012; Monaghan and Smith, 2012; Smith et al. 2012; Monaghan et al. 2013; Malcom et al., 2015; McDowell & Monaghan 2015; Cichota et al., 2016; Malcolm et al. 2016). In addition to nutrient and sediment losses, significant structural damage to the soil can also occur through pugging and compaction (Beare and Tregurtha, 2004; Drewry and Paton, 2005). The National Policy Statement for Freshwater Management (NPS-FM, 2014) sets out a framework for regional councils to manage water quality and water quantity. It includes requirements to protect the life-supporting capacity of water, maintain water quality and improve it where it is degraded and avoid over-allocating water. The introduction of the NPS-FM has initiated the development of a new regional plan, the proposed Southland Water and Land Plan (pSWLP). As wintering of stock on forage crops has been identified as a high loss activity, the need to understand the spatial extent of where this activity is occurring and the implications for water quality management are necessary to aid Council decisions. The pSWLP introduces rules aimed at managing wintering of stock, with more stringent requirements on the most vulnerable physiographic zones (Hughes et al. 2016). Environment Southland contracted Landcare Research to construct a map of forage crop locations throughout winter of 2014 (North & Belliss, 2015). The forage map was compared with aerial photography imaged the previous year to assess the accuracy of the mapping exercise. Large areas of crop (spanning multiple pixels) were identified well, however, for smaller areas (<1 ha) the spectral signature appearance identified a number of pixels in error. The causes of the error in pixel classification could be associated with interference from a poor quality base image, sun glare, or remnant cloud cover after the radiometric calibration of the cloud cover. Most likely, these errors occurred as a result of areas of scrub and long grass etc. having a spectral signature similar to that of the swede/brassica and cereal crops (North & Belliss, 2015). Before further use of the image by Environment Southland single pixel and incorrect classification errors would need to be resolved/minimised. This technical report details the methodology Environment Southland used to reprocess the original image into polygons using Arc GIS, which can be attributed to a specific property using the 2015 Southland Land Use Map (Pearson and Couldrey, 2016). The land use and physiographic zone under which the forage cropping activity is undertaken have different levels of risk for water quality. This report collates advice and technical information on risks to water quality from a land use and physiographic perspective, which were used in the formulation of the proposed Southland Water and Land Plan. An assessment of the likely number of properties and amount of forage crop area requiring resource consent by the proposed Southland Water and Land Plan, as well as additional scenarios raised during the submission process, was undertaken.

Page 10
2. Objectives
To reprocess the Landcare Research forage map raster image into GIS polygons defined by property boundaries.
Determine the extent of winter forage crops grown on a property (hectares and percentage of the property), by land use and Southland physiographic zones.
Assess the number and spatial location of properties that would potentially require resource consent to continue their current activities, under the proposed Southland Water and Land Plan in 2018, along with other possible policy scenarios from the consultation and submission process.
3. Background
3.1 Landcare Research – Winter forage map
A proof of concept investigation was undertaken by Landcare Research during the winter of 2013, focusing on the farmland surrounding Gore and Mataura townships (North et al., 2014). Following this investigation, Landcare Research was contracted by Environment Southland (ES) to map winter livestock forage for the whole Southland region (excluding Stewart Island and Fiordland) throughout winter of 2014 (North & Belliss, 2015). This was achieved by using time-series Landsat satellite imagery (pre-grazing - March/April, post grazing – August/September), calibrated to remove cloud cover (using radiometric calibration). For areas of insufficient coverage, images collected between May and July were used to improve coverage. Non-agricultural areas (i.e. forest, scrub, sea, rivers and urban areas) were masked out so that only agricultural land (approximately 1 million hectares) was analysed. The corrected satellite imagery was reclassified using derived spectral signatures that defined forage, non-forage, and bare ground classes. These were subsequently reclassified using a set of rules developed from the spectral appearance of known forage crops, provided by ES, as well as the temporal pattern of winter forage, i.e. a pixel vegetated in autumn with bare soil in spring. The classification rules, once implemented identified areas of winter forage, cereal crops, and pasture fields, while eliminating areas of forest, national park and snow cover (North & Belliss, 2015). Over 70,000 ha were mapped as ‘specifically forage’ (approximately 6.7% of the mapped agricultural area) and a further 55,000 ha (5.2%) was mapped as ‘likely forage’. Landcare Research provided ES with a winter livestock forage map in the form of a raster image (a dot matrix data structure representing a rectangular grid of pixels defined by points of colour - Figures 1 and 2). The map had been classified into 15 groups representing the crop type and certainty of the classification, bare soil or no data. The attribute table of the map included a field titled ‘Cell Count’, which gives a total count of every cell (pixel) within the map of that classification. The resolution of the cells within the map is 15 m by 15 m. The attribute table of the Landcare Research winter forage map was exported to Microsoft Excel and area of each classification were calculated (Table 1). The total cell count was multiplied by the resolution to find the area (m2 and ha) of each class (Table 1). The table is adapted from the attribute table of the final output (multitemp_classn1.tif) of the ‘Winter livestock forage map – Southland Region 2014’. For a full description of the methodology and accuracy assessment of the LCR map see North and Belliss (2015).

Page 11
Table 1: Total pixel count of each classification and the calculated area (adapted from: North & Belliss, 2015).
Count Classification Area (m2) Area (ha)
2710245
22992073
6649695
2145066
555703
2177596
1922677
1928904
277681
143222
2247432
1304028
1573892
282687
Unknown
Pasture throughout period (or other non-forage)
Bare soil/stubble/brown vegetation throughout period
Winter forage - likely swede/brassica
Winter forage - possibly cereal
Pasture/other in autumn; bare soil in winter/spring
Pasture/other in autumn; temporary dip to bare soil in winter
Newly-planted pasture/crop
Low-certainty swede/brassica winter forage
Low-certainty cereal winter forage
Bare soil/stubble/brown vegetation in autumn; no spring data
Bare soil/stubble/brown vegetation in spring; no autumn data
Low-certainty pasture/other vegetation throughout period
Late-planted winter forage, or a temporary flush of green
vegetation
609,805,125
5,173,216,425
1,496,181,375
482,639,850
125,033,175
489,959,100
432,602,325
434,003,400
62,478,225
32,224,950
505,672,200
293,406,300
354,125,700
63,604,575
60,980.51
517,321.64
149,618.14
48,263.99
12,503.32
48,995.91
43,260.23
43,400.34
6,247.82
3,222.50
50,567.22
29,340.63
35,412.57
6,360.46
Total area mapped 10,554,952,725 1,055,495.28

Page 12
Figure 1: Southland Region, 2014 – map of agricultural land under winter livestock forage crops, plus other non-forage land. Enlarged areas (a) and (b) are shown in Figure 2 (North & Belliss, 2015).

Page 13
Figure 2: Enlarged areas outlined in Figure 1 (North & Belliss, 2015). Classifications are from: a) good image coverage, where there are 2-5 autumn (pre-grazing) images (2-3 of these high-trust) and 2-4 spring (post grazing) images (2-3) of these high trust; b) poor image coverage, where there are 1-2 autumn images (0-2 of these high-trust) and 1-2 spring images (0-1 high-trust).

Page 14
Landcare Research reported areas by grouping the attributes into five different categories - ‘Specifically forage’, ‘Likely forage’, ‘Specifically not-forage’, ‘Likely not-forage’ and ‘Unknown/insufficient data for classification’ (Table 2) and calculated total areas for each respective class (Table 3). Environment Southland identified the highlighted categories in Table 2 as classes of interest to aid in the development of a wintering rule in the regional plan. Table 2: Classes in LCR winter forage map used for the accuracy assessment (North & Belliss, 2015). The highlighted classes are those used by Environment Southland for further analysis.
Forage category Classes in Winter livestock forage map
UNKOWN
Not sufficient data to judge whether
forage or not forage
No data, or masked out
Unknown
Bare soil in spring, but no autumn data
SPECIFICALLY FORAGE
Winter forage
Winter forage – likely swede/brassica
Winter forage – possibly cereal
Low-certainty brassica/swede winter forage
Low-certainty cereal winter forage
LIKELY FORAGE
Additional classes of likely winter forage
(however, these also have possible non-
forage explanations)
Pasture/other vegetation in autumn, then bare soil in spring
Late-planted forage or temporary flush of green vegetation
SPECIFCALLY NOT-FORAGE
Not winter forage
Pasture/other throughout period
Bare soil/stubble/brown vegetation throughout period
Newly planted pasture/crop
Low-certainty pasture throughout period
Bare soil in autumn, but no data in spring
LIKELY NOT-FORAGE
Additional classes that are likely to
indicate ‘not winter forage’ (however,
these also have possible forage
explanations)
Pasture/other, with a temporary dip to bare soil in spring
Also note that ‘Pasture/other in autumn, then bare soil in spring’
has been included as a likely winter forage class but the class is
problematic, as it can also indicate spring pasture renewal (a non-
forage class)
Table 3: Summary of LRC winter forage map showing area (ha) and percentage of total mapped area/total agricultural land (excluding the no data/masked out area). The percentage of agricultural land is displayed in brackets.
Forage category Area (ha) Percentage of mapped area & agricultural land
Unknown/insufficient data for classification 90,321.14 8.6
Specifically forage 70,237.62 6.7 (7.3)
Likely forage 55,356.37 5.2 (5.7)
Specifically not-forage 796,319.91 75.4 (82.5)
Likely not-forage 43,260.23 4.1 (4.5)
TOTAL (mapped area) 1,055,495.27 100
TOTAL (agricultural land) 965,174.13 91.2 (100)
Page 15
3.2 Proposed Southland Water and Land Plan
In the proposed Southland Water and Land Plan, the intensive winter grazing rule is the only proposed new rule which requires a current activity to obtain consent to be able to continue. Environment Southland produced a Working Draft Water and Land (2015) consultation document to get community feedback on the proposed rules prior to the notification of the pSWLP. This resulted in a change to the definition of winter grazing and the rule as notified in the pSWLP. A number of possible scenarios were also tested to determine their impact on Southland landholders.
3.2.1 Working Draft Water and Land – Community consultation document
In Environment Southland’s Working Draft Water and Land (2015) Consultation Document winter grazing was defined as follows: Grazing of stock between May and September (inclusive) on:
1. fodder crops; or 2. on grass that results in bare ground.
In the consultation document, Rule 21 a(iv) stated “the use of land for intensive winter grazing on a fodder crop is a permitted activity, provided…” “not more than 15% of the area of a landholding is used for intensive winter grazing at any one time.” Key feedback from the community on this rule was as follows: Avoid perverse outcomes (i.e. sending stock where it shouldn’t go/cause poor animal health outcomes).
1. 15% too low/arbitrary. 2. Don’t require system change/investment when FMU solution may be different
again. 3. Don’t put existing operators out of business. 4. Additional wintering in some areas may need to be discouraged. 5. Focus on good management practice (GMP) and/or farm environment plans (FEPs).
This feedback was considered by Environment Southland and an approach which utilises the Physiographic Zones was determined to be more appropriate method to minimise effects of winter grazing on a catchment or Freshwater Management Zone as wintering in some Physiographic Zones will have significantly worse outcomes for water quality than others.
3.2.2 Proposed Southland Water and Land Plan – Rule 23 Intensive winter
grazing
The proposed Southland Water and Land Plan was notified on the 3rd of June 2016. In the pSWLP, Rule 23 relates to Intensive winter grazing, and is defined as “grazing of stock between May and September (inclusive) on forage crops.” Conditions (ii)-(iv) of Rule 23(b) use the Physioqraphic zones to define where intensive winter grazing is a permitted activity:
(ii) no intensive winter grazing is undertaken in the Alpine physiographic zone; (iii) not more than 20 hectares of intensive winter grazing is undertaken on a
landholding within the Old Mataura, or Peat Wetlands physiographic zones;

Page 16
(iv) not more than 50 hectares of intensive winter grazing is undertaken on a landholding within the Riverine, Gleyed, Bedrock/Hill Country, Oxidising, Central Plains, or Lignite-Marine Terraces physiographic zones;
From 30 May 2018, the use of more than 20 hectares of a landholding for intensive winter grazing in the Old Mataura, or Peat Wetlands physiographic zones or 50 hectares in the Riverine, Gleyed, Bedrock/Hill Country, Oxidising, Central Plains or Lignite-Marine Terraces physiographic zone is a restricted discretionary activity requiring resource consent.
3.2.3 Rule Scenarios
After the public submission process on the pSWLP, a number of alternatives to the proposed permitted activity thresholds in conditions (iii) and (iv) of Rule 23(b) were suggested. An assessment of the possible outcomes based on the 2014 winter forage survey was undertaken to better inform the Policy and Planning Team and Council at Environment Southland. The scenario thresholds are based on a minimum land holding size of 20 ha. The following scenarios were assessed from the pSWLP and working draft documents:
1. Notified proposed Southland Water and Land Plan – greater than 50 ha on a landholding OR
20 ha in sensitive physiographic zones (Old Mataura, or Peat Wetlands) is used for intensive winter crop (as described in Section 4.2.2).
2. Working Draft Southland Water and Land Plan – greater than 15% of a landholding is used for intensive winter crop (as described in Section 4.2.1).
The following scenarios were assessed from submissions received on the pSWLP1. The landholding would require resource consent when:
3. 20% of a landholding is used for intensive winter crop. 4. Greater than 50ha on a landholding OR
greater than 20ha in sensitive physiographic zones (Old Mataura, Peat Wetlands) OR greater than 10% of a landholding is used for intensive winter crop.
5. Greater than 50ha on a landholding OR greater than 20ha in sensitive physiographic zones (Old Mataura, Peat Wetlands) OR greater than 15% of a landholding is used for intensive winter crop.
6. Greater than 50ha on a landholding OR 10% of a landholding is used for intensive winter crop. 7. Greater than 50ha on a landholding OR 15% of a landholding is used for intensive winter crop. 8. 50 ha of a landholding is used for intensive winter crop. 9. Greater than 20ha total in Old Mataura, Peat Wetlands, Oxidising and Riverine
physiographic zones OR greater than 50 ha elsewhere (except Alpine) is used for intensive winter crop2. 10. Greater than 20ha total in Old Mataura, Peat wetlands and Bedrock/Hill country OR 50 ha elsewhere (except Alpine) is used for intensive winter crop.
1 Numbering of scenarios is used for identification only and is not an indication of preference.
2 This scenario is similar to the recommendation made by the Science Team at Environment Southland. At a minimum,
it was recommended that Old Mataura, Oxidising and Peat Wetlands were identified as sensitive physiographic zones. For Section 32 Supporting documents see: http://www.es.govt.nz/Document%20Library/Consultations/2016/Proposed%20Southland%20Water%20and%20Land%20Plan/Supporting%20Documents/Supporting%20Documents%20for%20Section%2032.pdf

Page 17
Additional scenario thresholds were tested based on farm size, as larger landholdings are less likely to require resource consent under a percentage of property based rule, while smaller landholdings are less likely to require consent under an area threshold rule. The two farm size thresholds used for this analysis were 333ha (50ha of crop = 15% of property) and 500ha (50ha of crop = 10% of property). The landholding would require resource consent when:
11. For landholdings less than 333ha, if greater than 50 ha is used for intensive winter
crop OR for landholdings greater than 333ha, if 15% of the landholding is used for intensive
winter crop. 12. For landholdings less than 500ha, greater than 50 ha is used for intensive winter
crop OR for landholdings greater than 500ha, 10% of the landholding is used for intensive winter crop.
13. For landholdings less than 333ha, greater than 50 ha is used for intensive winter crop OR
greater than 20ha in sensitive physiographic zones (Old Mataura, Peat Wetlands) is used for intensive winter crop; OR
for landholdings greater than 333ha, 15% of the landholding is used for intensive winter crop OR
greater than 20ha in sensitive physiographic zones (Old Mataura, Peat Wetlands) is used for intensive winter crop.
14. For landholdings less than 500ha, greater than 50 ha is used for intensive winter crop OR greater than 20ha in sensitive physiographic zones (Old Mataura, Peat Wetlands) is used for intensive winter crop OR
for landholdings greater than 500ha, 10% of the landholding is used for intensive winter crop OR
greater than 20ha in sensitive physiographic zones (Old Mataura, Peat Wetlands) is used for intensive winter crop.
These scenarios are used to assess the area and percentage of total intensive winter grazing hectares captured by the scenario and the number of properties likely requiring resource consent under each scenario.
4. Methodology
4.1 Accuracy assessment
The winter livestock forage map from Landcare Research was compared with aerial photography imaged the previous year to assess the accuracy of the mapping exercise. It was determined that the classification of the grid cells using the spectral signature appearance identifies a number of single pixels in error (Figure 3). For example, areas of scrub, roadside fringes, rural residential homes, roofs, gardens, and long grass were often incorrectly classified as winter forage or cereal crop. The causes of the error in pixel classification could be associated with interference from a poor quality base image, sun glare, or remnant cloud cover after the radiometric calibration of the cloud cover as stated by North & Belliss (2015). Most likely these errors occurred as a result of areas of scrub and long grass etc having a spectral signature similar to that of the swede/brassica and cereal crops. By utilising information held by Environment Southland on land cover, elevation (slope), and land use, some of these errors could be resolved or minimised.

Page 18
Figure 3: Examples of potential errors over aerial photography a) scrub and stream beds, b) gardens/houses of lifestyle blocks, c) road verges, and d) wetland and scrub cover. Dark blue areas symbolise the paddocks of winter forage – swede/brassica, light blue is lower certainty winter forage - swede/brassica, green areas are paddocks of pasture/other, bare soil in spring, and pink is newly planted pasture or crop.
4.2 Winter forage map refinement method
4.2.1 Polygon conversion
The raster image received from Landcare Research (Figure 1, multitemp_classn1.tif) was examined to determine which classifications were associated with the ‘Winter forage – likely swede/brassica’ classification. The classes selected were ‘Winter forage – likely swede/brassica’ (dark blue), ‘Low-certainty swede/brassica winter forage’ (light blue), ‘Late-planted forage, or temp green veg’ (red) and ‘pasture/other autumn, bare soil spring’ (dark green) (Figure 4a). These classes were identified within ‘Specifically forage’ and ‘Likely forage’ by Landcare Research in Table 2. ‘Winter Forage – possibly cereal’ and ‘Low-certainty cereal winter forage’ were not considered further in this assessment due to the result of the accuracy assessment. To calculate specific areas of winter livestock forage, the raster grid cells of the above selection were converted to polygons (vector format) in ArcMap. The ‘Raster to Polygon’ conversion tool was used to convert the raster pixels (resolution 15m by 15m) to a polygon representing conjoined areas of these pixels. Single pixels of the selected categories were also converted into single polygons (Figure 4b). The four individual categories were dissolved (‘Dissolve’ - Data Management tool) as multiple classifications were often found within a paddock, especially near

Page 19
the fringes of the crop, drainage swales where crop growth is impaired, or areas grazed to bare ground prior to image collection. By dissolving the four classifications, it was assumed that all categories were winter forage crops and these areas were all treated equally for further classification refinement. Subsequent to this analysis, the ‘Explode Multipart Feature’ editing tool was used to separate the paddocks of forage back into individual features for further refinement. A new Field named ‘Forage_ha’ was added to the attribute table (Type = ‘Double’, ‘Precision’ = 15 and ‘Scale’ = 3). The area in hectares (ha) was then calculated using the Calculate Geometry function with the use of the co-ordinate system of the data source (NZGD 2000 New Zealand Transverse Mercator). This computes the hectares of winter forage within each polygon. Forage areas less than 1 ha in size were selected for and removed to eliminate the erroneous spectral noise along river banks and roadside fringes (Figure 4c). The final result as seen in image Figure 4d shows the reprocessed areas of forage greater than 1 ha in size. The ‘dissolve’ function followed by the ‘explode multipart feature’ tool execution was necessary to join all the features with different classifications i.e. ‘specifically forage’ and ‘likely forage’, within a single paddock; into one cohesive polygon that was larger than 1 hectare in size.
Figure 4: Process of converting the Winter Fodder Crop raster image to polygons a) shows the original output of the Landcare Research winter forage map (multitemp_classn1.tif) where the blue areas symbolise the paddocks of winter forage – swede/brassica, light green areas are paddocks of pasture and pink is newly planted pasture or crop, b) is the result of the conversion of the raster image to a polygon format highlighting the multiple classifications that determine ‘Winter Forage’, c) displays the output of the ‘Dissolve’ with <1 ha errors still present and d) shows the final result of the polygon conversion methodology (scale 1:20,000).
c)
Page 20
4.2.2 Land Cover Database (version 4.1)
To minimise misclassification of forage crops due to similar spectral signatures, LCDB v4.1 was used to refine the winter forage map by removing areas of land cover inconsistent with areas typically used for winter grazing. A definition query for high producing grassland, low producing grassland, short rotation cropland and other perennial crops was used to identify the land cover of interest. Areas of winter forage outside of the definition query were removed. This was done by ‘intersecting’ LCDB v4.1 with the above definition query applied with the forage map output from 5.2.1. The total number of hectares removed was 3,595. See Appendix 1 for a table of area removed by the land cover classifications. Winter forage areas less than 1 ha in size in the output were subsequently removed as these were predominantly slivers and small errors surrounding the misclassified areas.
4.2.3 Topography (slope)
The slope of a paddock limits whether an area can be cultivated with winter forage crop. A Digital Elevation Model (8m DEM, NIWA) was converted from elevation to slope using the ‘Slope’ (spatial analyst) tool. The ‘reclassify’ tool was used to simplify the slope categories into four slope classes, as determined by the ranges used by the model OVERSEER® Nutrient Budgets. The classes are defined as flat to undulating (0-7 degrees), rolling (7-16 degrees), easy hill (16-26 degrees) and steep (>26 degrees). This raster layer was then converted to vector polygon format and subsequently merged together. The four different slope class polygons were then intersected with the forage area (determined in 5.2.2). Four fields titled ‘Flat_ha’, ‘Rolling_ha’, ‘EasyHill_ha’, and ‘Steep_ha’ were added to the attribute table. Each slope class was selected for and populated with the computed ‘Forage_ha’ using the ‘Field Calculator’ function. Forage crop areas corresponding to steep slopes (>26 degrees) were determined to be erroneous spectral signatures, often created by the aspect producing shadow, and were removed from the output shapefile. The total number of hectares removed in this process was 544.
4.2.4 Physiographic Zones
The Southland Physiographic Zones were used to refine the winter forage map by identifying areas unsuitable for crop production and livestock grazing during the winter months. The ‘Alpine Physiographic Zone’ occupies land above 800 metres in elevation, with high rainfall, and thick snowpack accumulation during the winter (Environment Southland, Physiographic zone: Alpine, 2016). The soils above this altitude are typically thin or bare rock and unsuitable for cropping. Areas of forage crop that corresponded to this physiographic zone are likely erroneous. The output created in 5.2.3 was intersected with the Physiographic Zones, and new attribute Fields for each Physiographic Zone were added (Type = ‘Double’, ‘Precision’ = 15 and ‘Scale’ = 3). With each Physiographic Zone selected in turn, the area in hectares (ha) was calculated for the corresponding new hectare field, using the Calculate Geometry function with the use of the coordinate system of the data source (NZGD 2000 New Zealand Transverse Mercator). This computes the total hectares of winter forage within each selected Physiographic Zone.
Winter forage within the Alpine physiographic Zone was removed from the intersect output as it was deemed to be spectral error, misclassifying areas of scrub or shadow. The total number of hectares removed was 16.
Page 21
4.2.5 Land Use
To further refine the winter forage classification, the Southland Land Use Map – April 2015 (at the property scale) was used to identify land uses where winter forage was unlikely to occur (Pearson and Couldrey, 2016). A definition query was applied to the Southland Land Use Map retaining the agricultural land types of interest. This excluded areas such as estuaries and marine, lakes and rivers, conservation, commercial, flower and bulbs, nurseries, horticulture, industry and airports, plantation forestry, residential use, road and rail, unknown land use – indigenous cover, and unknown land use – non-agricultural, from the analysis. The total number of hectares removed was 1,804. See Appendix 1 for a table of area removed by the land use classification. Once the definition query was applied, the Land Use Map (LUM) was intersected with the output of 5.2.4. to remove the land uses listed above, where any winter forage identified would most likely represent spectral errors or other irrelevant crops. From the output, winter forage crops grown on agricultural land uses could be identified, and the areas of forage grown per property calculated. Following this intersect, the output was dissolved (‘Dissolve’ Data Management tool) aggregating features based on specified attributes that corresponded to retaining the property information from the LUM. The four slope class hectare fields were added as Statistic Fields (statistic type ‘SUM’). The resulting output shows the sum of forage area grown on each slope class, within a property boundary as identified by the Southland LUM. The Field named ‘Forage_ha’ was added to the attribute table (Type = ‘Double’, ‘Precision’ = 15 and ‘Scale’ = 3) as it was removed during the dissolve. The field calculator was used to determine the total forage hectare on a property calculating the sum of the fields ‘SUMFlat_ha’, ‘SUMRolling_ha’, and ‘SUMEasyHill_ha’. The resulting output is a shapefile, which shows areas of forage crop identifiable by property and can be used to display crop area by land use, slope class, or physiographic zone.
4.3 Property scale and percentage of a landholding
To incorporate forage area into the Southland Land Use Map, the above output was spatially joined to the property scale LUM layer and forage area and percentage of crop on the property were calculated as detailed below. This layer was used for the pSWLP assessment and scenarios outlined in section 3.2.3.
4.3.1 Classifying winter forage area in hectares
To identify properties with large areas of winter forage crops; a classification based on the total hectares was applied. Six different size classes were established using separate rules. The classes defined are: 1 – 5 ha, 5 – 20 ha, 20 – 50 ha, 50 – 100 ha, 100 – 200 ha, >200 ha An attribute field titled ‘Class’ (TEXT) was added. This field was populated with values defined with a series of rules using the ‘Select by Attributes’ function of the attribute table: RULE 1: ‘Forage_ha’ > 0 AND ‘Forage_ha’ < 5

Page 22
Field Calculator (‘Class’ = “1 – 5 ha”) RULE 2: ‘Forage_ha’ >= 5 AND ‘Forage_ha’ < 20 Field Calculator (‘Class’ = “5 – 20 ha”) RULE 3: ‘Forage_ha’ >= 20 AND ‘Forage_ha’ < 50
Field Calculator (‘Class’ = “20 – 50 ha”) RULE 4: ‘Forage_ha’ >= 50 AND ‘Forage_ha’ < 100
Field Calculator (‘Class’ = “50 – 100 ha”) RULE 5: ‘Forage_ha’ >= 100 AND ‘Forage_ha’ < 200
Field Calculator (‘Class’ = “100 – 200 ha”) RULE 6: ‘Forage_ha’ >= 200
Field Calculator (‘Class’ = “>200 ha”)
4.3.2 Classifying winter forage by property area
Secondly, the percentage of the property in winter forage depicts a snapshot of winter forage extent in 2014. The percentage also provides an indication of intensity of cropping on the property and the potential for rotational crop movement throughout a property. A new attribute field titled ‘Percentage’ was added (Type = Double, Precision = 15, Scale = 3) and the Field Calculator function was used to populate the field with the following calculation: ‘Percentage’ = ([Forage_ha] / [Farm_Area])*100 This field shows the percentage of the land owner’s total property area that was cropped with winter forage in 2014.
5. Results and Discussion
5.1 Data correction
Comparison of winter forage polygons visually with aerial photography shows a much improved data set (Figure 5). The single pixel errors associated with areas of scrub, roadside fringes, rural residential homes, roofs, gardens, and long grass have been removed or minimised through the conversion to and the aggregation of polygons. Landcare Research estimated 70,237 ha of winter forage (including winter cereal crops,) with an additional 55,356 ha of likely forage area. The winter forage crop area after processing by ES staff was reduced to 68,280 ha of winter forage crop (excluding cereal crops). The breakdown of forage area by slope categories showed 83% of the total crop area is grown on flat land (0-7 degrees) (Table 4). However, due to the patchy nature of the pixel analysis, the winter forage crop area is likely underestimated using this method and should be used as a conservative estimate. Table 5 shows the final estimate of winter forage area in comparison to the areas identified by North & Belliss (2015).

Page 23
Figure 5: Examples of likely spectral errors over aerial photography (a and b) and the end result of data refinement for the same areas (c and d). Dark blue areas symbolise the paddocks of winter forage – swede/brassica, light blue is lower certainty winter forage - swede/brassica, green areas are paddocks of pasture/other, with bare soil in spring, and pink is newly planted pasture or crop. Example a) shows gardens/houses of lifestyle blocks and b) scrub, stream beds, wetlands, and road verges.
The initial process of converting the LCR image to a raster format and removing areas less than 1 ha in size, removed 35,110 ha of likely erroneous forage crop. This was further reduced by 6,480 ha through the combination of LCDB v4.1, Physiographic Zones, steep slopes, and unlikely land uses. Appendix 1 shows hectares removed during each step in the reprocessing process by ES. North & Belliss (2015) report the advantages and limitations to pixel-scale classification, compared to a per-paddock approach. The pixel-scale classification was selected to gain the temporal variation in crop production and grazing, however the method is limited by the ability to represent complete paddocks. This limitation results in an underestimation of forage area. The alternative approach, a per-paddock analysis, produces a GIS polygon output with greater statistical robustness. However, there is increased cost due to the requirement to purchase higher resolution imagery. To be able to incorporate winter grazing into the Land Use Map for nutrient loss assessments, a per-paddock approach is desirable over the pixel-scale classification.

Page 24
Table 4: Final estimated amount of winter forage in Southland for 2014 by crop type classification and slope classes.
Crop Type Classification Flat (ha)
Rolling (ha) Easy Hill (ha)
TOTAL (ha)
Winter forage - likely swede/brassica 32,480 4,000 580 37,060
Low-certainty swede/brassica winter forage 1,330 180 40 1,550
Pasture/other in autumn; bare soil in winter/spring 21,620 4,300 2,100 28,020
Late-planted winter forage, or temporary flush of green vegetation
1,390 150 110 1,650
TOTAL (ha) 56,820 8,630 2,830 68,280
Table 5: Final estimated amount of winter forage in Southland for 2014 by Landcare Research (North and Belliss, 2015) and Environment Southland.
Crop Type Classification LCR forage crop area (ha)
LCR Percentage of agricultural area & specifically forage
ES forage crop area (ha)
ES Percentage of agricultural area & specifically forage
Winter forage – likely swede/brassica 48,264 43.9 37,060 54.3
Low-certainty brassica/swede winter forage
6,248 5.7 1,550 2.3
Pasture/other vegetation in autumn, then bare soil in spring
48,996 44.6 28,020 41
Late-planted forage or temporary flush of green vegetation
6,360 5.8 1,650 2.4
TOTAL (ha) 109,868 68,280
5.2 Winter forage distribution
5.2.1 Land Use
The spatial distribution of winter forage crops across Southland is widespread, as most properties with livestock grow forage crops to sustain animals over the winter period when grass growth is minimal. Approximately 65% of the winter crop area in Southland is grown on sheep and beef properties, while 22% is found on dairy and dairy support properties, 4.5% on deer, 3.4% on arable properties, and the remainder on other agricultural land uses (or unidentified pastoral land uses) (Table 6). The majority of properties growing winter crop in Southland have crop areas ranging between 5 to 15 ha (Figure 6). The properties with the largest amount of crop are those typically in the sheep and beef industry, providing dairy grazing or a combination of both. Figures 7 and 8 show the area of winter crop paddocks represented by the land use of the property. For comparison of crop area within in an industry, Figure 9 shows total area of crop, pasture (intensive/extensive), arable cropping, forest (native/exotic), wetlands and other land covers. While sheep and beef have a large amount of crop grown on the land use, they also have a large area of land not used in production for the sheep and beef industry. See Appendix 2 for additional statistics (by area and percentage of property) for each land use category as identified in the Southland Land Use Map (Pearson and Couldrey, 2016).
Page 25
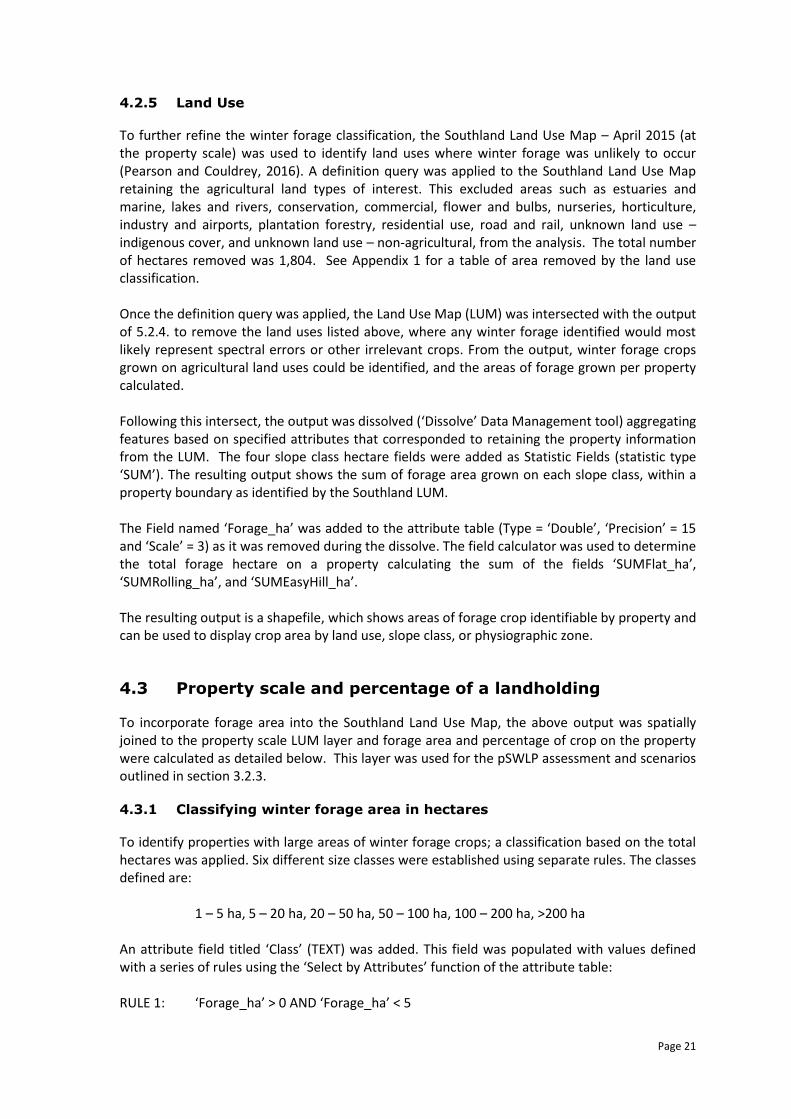
Table 6: Final estimated amount of winter forage crop in Southland by area, average area, and percentage of total forage crop. Total area of land use includes non-pastoral and ineffective areas. Number of properties represents the number of properties with forage crop in Southland. Property area and total land use area as identified from the Southland Land Use Map (Pearson and Couldrey, 2016).
Industry Land Use Total area of land
use (Ha) Total area in crop by land use (Ha)
Average area of crop per property
(Ha)
Percentage of winter forage area
on land use
Number of Properties (n)
Sheep and Sheep and Beef 445,851 27,568.2 28.3 40.4 974
Beef Sheep 106,616 7,269.6 14.8 10.7 490
Beef 17,161 1,468.9 14.0 2.2 105
Mixed Livestock 187,843 7,715.7 50.8 11.3 152
Industry Total 757,471 44,022.5 25.6 64.6 1,721
Dairy Dairy 216,335 10,095.2 13.2 14.8 767
Dairy Support* 25,485 2,554.5 16.4 3.7 156
Dairy Support and Other Livestock* 20,903 2,107.9 27.0 3.1 78
Industry Total 262,723 14,757.6 14.7 21.7 1,001
Deer Specialist Deer 12,245 1,174.6 14.5 1.7 81
Majority Deer with Mixed Livestock 30,438 1,911.9 26.9 2.8 71
Industry Total 42,683 3,086.5 20.3 4.5 152
Arable Arable with Mixed Livestock 20,240 2,129.2 24.5 3.1 87
Arable 3,110 157.7 8.3 0.2 19
Industry Total 23,350 2,286.9 21.6 3.4 106
Other Livestock Support 24,986 2,586.9 21.4 3.8 121
Small Landholding (5-40 ha) 4,901 186.7 3.2 0.3 59
Lifestyle (<5 ha) 3,814 16.0 1.8 0.0 9
Other Animals 1,618 63.2 3.9 0.1 16
Dairy Sheep 947 28.1 28.1 0.0 1
Unknown Use -Pastoral 20,580 1,120.7 6.3 1.6 178
Other Total 56,846 4,001.6 10.4 5.9 384
TOTAL 1,143,073 68,155** 3,364
* Dairy support shows land owned by dairy farmers (run off) and may not represent a separate property. ** Some differences occur in crop area when associating crop back to a property occur due to farmed area and legal property boundary differing. Crop areas under 1 ha were not
included in this analysis.

Page 26
Figure 6: a) Area of winter forage crop on a property and b) percentage of a property in crop by industry group. The y-axis scale of a) has been adjusted to represent the majority of the data range. The upper quartile range (maximum value) is outside the scale range and is presented as a value next to the error bar.
0
10
20
30
40
Sheep and Beef Dairy Deer Arable Other
Are
a in
win
ter
fora
ge c
rop
(H
a)
Industry
0
20
40
60
80
100
Sheep and Beef Dairy Deer Arable Other
Pro
pe
rty
in w
inte
r fo
rage
cro
p (
%)
Industry
848 237 249 93 291 a)
b)

Page 27
Figure 7: Winter forage crop area displayed by land use as defined in Pearson and Couldrey, 2016. The pastoral cover category shows area of grassland in Southland from LCDB v4.1.

Page 28
Figure 8: The blue insert (top) shows paddocks of winter forage crop grown in northern Southland and the red insert (bottom) shows paddocks of winter forage crop grown on the Otautau Plains, representative of lowland Southland.

Page 29
Figure 9: Area of winter forage crop to other land covers by industry area. Pasture, cropping and forest land covers obtained from LCDB4.1, with winter forage crop area from this study subtracted from the area of intensive pasture.
5.2.2 Property area
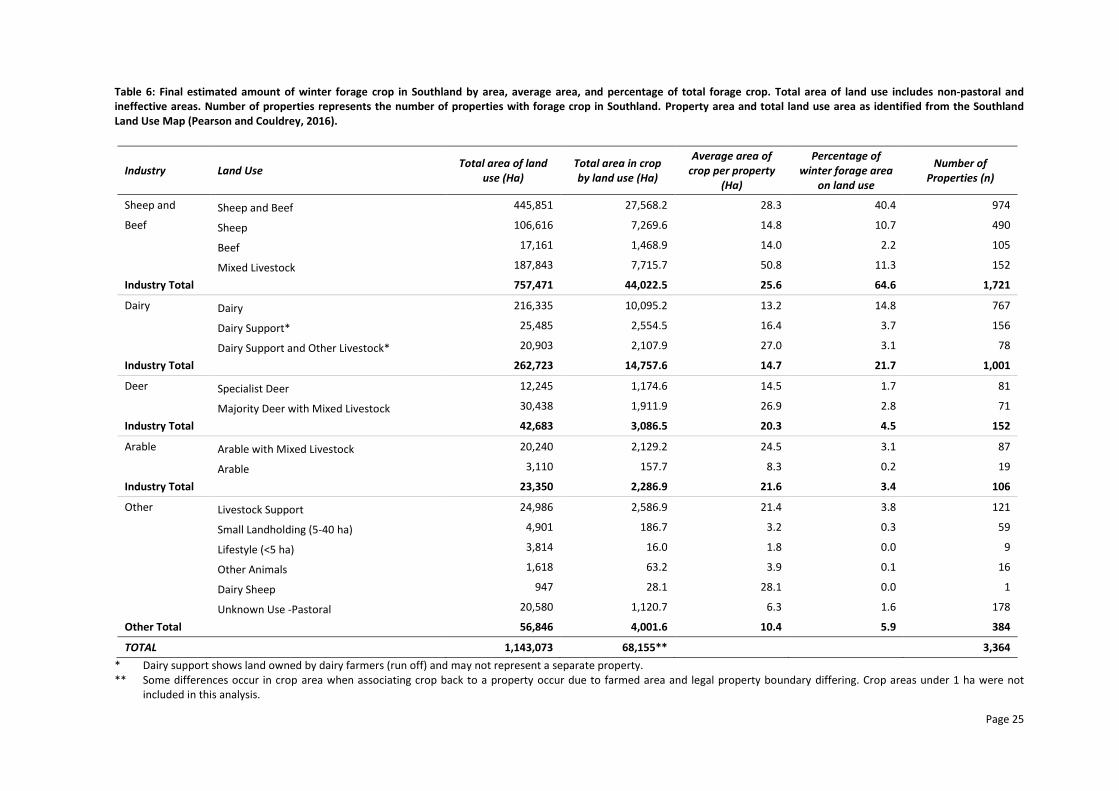
The properties with the largest amount of winter forage crop (>100 ha) are located in the northern areas of Southland in the Te Anau basin, the upper Oreti and upper Mataura catchments (Figure 10). Approximately 10% of the properties with forage grow half the total forage crop in Southland. The land use of these properties are mostly drystock (sheep, beef and some deer), with some dairy and support. However, it is not possible to determine from this study the stock type grazing the forage crop, or whether the drystock properties are wintering capital stock only or providing additional support to the dairy industry. Winter forage areas, represented as a percentage of forage crop area on a property, shows a much wider distribution of where intensive winter grazing may occur across Southland (Figure 10). This method is more sensitive to smaller properties with large areas of winter crop. Of properties with over 15% of a property area in forage, 12,735 ha (71%) is on drystock properties, while 5,290 ha are on dairy and dairy support (29%). A limitation in this assessment is caused by the method in which dairying is identified in the Southland Land Use Map (Pearson and Couldrey, 2016). The Southland LUM identifies the dairy milking platform (dairy) separately to support or runoff blocks (dairy support) resulting in a separation of the total property area. Of the 953 dairy milking platforms in 2015, approximately 416 farms own additional land or runoffs (average runoff size is 110 ha). As these landholdings are identified separately from the milking platform, the percentage of crop is calculated separately for these two land uses and subsequently is unable to be assessed for the “whole farm”. This limitation affects approximately 416 dairy farms and may result in an underestimation of policy effects for the dairy industry.
Page 30
Figure 10: Amount of winter forage crop on a property represented by the total area of the property.

Page 31
Figure 11: Percentage of winter crop on a property.
5.2.3 Physiographic Zones
The Physiographic Zones with the largest area of forage crop are Bedrock/Hill Country (34.7%), Oxidising (24.9%) and Gleyed (21.1%) (Table 7). Drystock land uses dominate the Bedrock/Hill Country zone, while dairying is generally located on the Oxidising and Gleyed Physiographic Zones. The Bedrock/Hill Country zone contains 87% of the crop area grown on slopes above 16 degrees (Table 8).

Page 32
Table 7: Winter forage area (hectares) in 2014 by Physiographic Zone and land use.
Bedrock/Hill Country
Oxidising Gleyed Lignite - Marine
Terraces Riverine
Peat Wetlands
Old Mataura Central Plains
Sheep and Beef 12,479 6,006 4,112 1,833 1,334 686 906 228
Sheep 2,202 1,839 1,884 776 248 86 93 158
Beef 367 472 312 71 93 113 11 38
Mixed Livestock 3,756 2,008 795 230 473 366 61 25
Total Crop on Sheep and Beef (Ha) 18,804 10,325 7,103 2,909 2,148 1,251 1,071 449
Dairy 1,435 2,736 3,645 779 417 401 150 546
Dairy Support 573 698 651 225 210 42 60 99
Dairy Support and Other Livestock 664 593 411 204 156 20 61 0
Total Crop on Dairy (Ha) 2,672 4,028 4,708 1,208 783 464 272 646
Specialist Deer 270 455 213 49 37 43 110 1
Majority Deer with Mixed Livestock 664 569 395 117 131 24 12 Total Crop on Deer (Ha) 934 1,024 608 166 168 67 121 1
Arable 0 65 18 34 21 0 0 22
Mixed Livestock and Arable 146 374 1,077 52 132 67 136 148
Total Crop on Arable (Ha) 147 439 1,095 86 153 67 136 170
Livestock Support 784 762 441 136 240 58 156 11
Small Landholding (5-40 ha) 27 66 61 32 0 7 3 0
Lifestyle (>5 ha) 2 7 18 3 0 1
0
Dairy Sheep 28
0 0 Other Animals 0 18 26 5
14 3
Unknown Land Use - Pastoral 278 330 368 55 86 21 7 13
Total Crop on Other Land Uses (Ha) 1,120 1,184 914 231 326 87 181 27
Area of Forage Crop (Ha) 23,677 16,998 14,428 4,601 3,577 1,937 1,780 1,293
Area of Physiographic Zone (Ha) 1,514,841 276,556 307,858 100,603 122,879 61,742 14,969 18,151
PU in Forage Crop (%) 1.6 6.1 4.7 4.6 2.9 3.1 11.9 7.1
Forage Area by PU (%) 34.7 24.9 21.1 6.7 5.2 2.8 2.6 1.9

Page 33
Table 8: Winter forage area (hectare) in 2014 by Physiographic Zone and slope.
Bedrock/ Hill
Country Oxidising Gleyed
Lignite - Marine
Terraces Riverine
Peat Wetland
Old Mataura
Central Plains
Flat (0-7 degrees) 5,014 15,002 13,374 2,711 3,513 1,754 1,707 1,293
Rolling (7-16 degrees) 7,837 1,269 765 1,518 40 56 53 -
Hill Country (>16 degrees) 10,825 727 288 371 24 126 20 -
5.3 Estimation of dairy support on non-dairy properties
Estimates of how much winter crop is grown to support the dairy industry range between 12 and 20% of the farm area (Chakwizira & de Ruiter, 2009; Monaghan, 2010). Chakwizira & De Ruiter (2009) calculated that an average-sized dairy farm (497 cows, 191 effective ha) required between 23 and 35 ha of winter crop depending on dry matter (DM) yields of 18 t/DM/ha and 12 t/DM/ha respectively. Typical forage crop yields for the different crop types are shown in Table 9. Table 9: Dry matter content of different forage crops grown in Southland (adapted from Fielden & Smith, 1998 and Agricom, 2015*).
Crop Type Yield
(T DM/ha/year) Average
(T DM/ha/year)
Swedes 8,000-18,000 13,000
Kale 8,000-18,000 13,000
Bulb Turnips 6,000-12,000 9,000
Leaf Turnips 6,000-9,000 7,500
Fodder Beet* 18,000-22,000 20,000
Based on Southland dairy cattle numbers for 2014, obtained from Statistics NZ-Agricultural Statistics (700,000 cows), the total hectares of forage crop required to feed all dairy cows can be estimated by taking the average amount of hectares of crop required per cow multiplied by the total cow numbers in Southland. At optimum yields of 18 t/DM/ha, this equates to 32,394 ha of crop and at the sub-optimum yield of 12 t/DM/ha this equates to 49,295 ha of crop. Tarbotton et al. (2012) determined for South Otago and Southland that 60% of cows are wintered on brassica crops alone and that at least approximately a further 10% were wintered on mixed feed systems (e.g. winter crop and pasture)(Figure 12). Therefore, based on an estimate that 70% of cows in Southland are utilising some form of winter crop, this equates to a revised estimate of 22,676 ha and 34,507 ha for the two respective DM yields calculated above. Ledgard (2013) noted that the Statistics NZ dairy cattle estimate is likely to overestimate the number of cattle wintered as it includes calves as at 30 June each year. However, the estimate that 70% of cows are wintered on crops from Tarbotton et al. (2012) is likely to be conservative. There are also other variables which will influence the total hectares of dairy winter crop grown in the region. These include wintering cows out of the region, conversion to herd homes and increases in imported feed, and supplements brought into the region.

Page 34
The amount of crop grown on dairy properties estimated in Table 6 is equal to 14,758 ha resulting in the dairy industry requiring an additional 7,920 to 19,750 ha of winter forage crop on non-dairying land to support the dairy industry. This estimated deficit can be reduced by the 2,587 ha of winter forage grown on livestock support properties, resulting in a final estimate of dairy support of 5,330 to 17,160 ha of winter forage crops, which are likely grown on drystock/arable properties to support the dairy industry in Southland. The mix of crop species, with varying dry matter content will vary from year-to-year and influence the area needed for winter forage crops. The planting of higher yielding fodder species will significantly reduce the land area required to produce the required amount of feed.
Figure 12: Wintering systems of 204 farms in South Otago and Southland – 2010 (Tarbotton et al., 2012).
5.4 Implications for water quality
The potential for nitrogen, phosphorous and sediment loss from different land uses in the Southland region was summarised by Monaghan et al. (2010) and Monaghan (2012). The reviews ranked land uses according to their risk to water quality outcomes from studies undertaken in Southland, as well as around the country, and are consistent with a previous review by Meneer et al. (2004) for the Bay of Plenty Regional Council. Of the land use systems considered, the potential for causing nitrate leaching typically follows this order under conventional farming systems (i.e. added fertiliser) - vegetable cropping > winter grazing > dairy farming > arable > mixed cropping > sheep/beef/deer farming > forestry. Within the winter grazing and sheep/beef/deer land use type, losses from sheep are generally the lowest. However, Monaghan (2012) acknowledged that further work needs to be done on forage paddocks, as trial work by Moir et al. (2010) indicated sheep urine N losses from winter grazing can approach levels similar or greater than those from cattle-grazed winter crops. Phosphorous losses typically follow the following order - deer grazed winter forage crop > cattle grazed winter forage crop > sheep grazed winter forage crop = FDE treated pasture > cattle pasture > sheep pasture (Monaghan, 2010). Deer grazed areas are high risk reflecting the large amounts of erosion that deer can potentially cause (from fence pacing and wallowing), especially when allowed to access streams and wet areas. Forestry losses can also be very high, even greater than from winter forage crops, however, they are periodic in their occurrence and are
Page 35
considered to contribute the least net amount of phosphorous to waterways followed by hill country sheep farming (Meneer et al., 2004). Sediment losses often mimic phosphorous losses and typically follow the following order – Deer > cattle grazed winter forage crop > Sheep grazed winter forage crop > cattle grazed pasture = sheep grazed pasture (Monaghan, 2010). Therefore, given the widespread extent of crops in Southland, winter grazing is likely a key contributor to nitrogen, phosphorus and sediment losses across all Southland catchments. The extent of wintering has increased significantly throughout the region (Ledgard, 2013) with increases from 2% of a farm area used for winter crop in 1995 to over 4% in 2011 (Beef and Lamb New Zealand Economic Service, 2012). Statistics NZ Agricultural Census (2012) reported a total of 52,946 ha of forage brassicas in Southland, second only to Canterbury by region (year-end June 2012). Most of this increase in crop area has occurred since 2008, primarily to support the growing dairy sector (Ledgard, 2013). An estimate of the increase in winter forage crop area since 2012 using the results of this study show an additional 15,334 ha of forage crop or 7,667 ha per year have been grown in Southland.
5.4.1 Southland Physiographic Zones
The Physiographic Zones provide a mechanism for identifying areas of high susceptibility to contaminant loss and resultant risk to water quality in both surface and ground waters from winter grazing. Particular regard is given not only to the contamination of the direct receiving environment but also to down gradient affects. For example, a contaminated aquifer feeding a stream during baseflow may cause the stream to exceed a particular water quality threshold under the National Objectives Framework (NOF; NPS-FM, 2014). The risk to water quality is higher under some physiographic zones than others, due to the attenuation potential of the zone for dilution, denitrification and filtration and adsorption (Hughes et al., 2016). Hughes et al. (2016) identified nitrogen as the greater issue in the Old Mataura, Oxidising and Riverine zones, while phosphorus, sediment and micro-organisms are more likely to be mobilised from the Bedrock/Hill country, Central Plains, Gleyed, Lignite Marine Terraces, Old Mataura, Oxidising and Peat wetlands Physiographic Zones. The Physiographic Zones with the highest risk under winter grazing and the justification for identifying them as high risk are discussed further below.
Old Mataura Physiographic Zone
The Old Mataura Zone is characterised by highly weathered alluvial gravels of the Luggate and Shotover formations overlain by well drained shallow stony soils or Fragic Pallic soils (Turnbull & Allibone, 2003; Hughes et al., 2016). The zone is exclusive to the Mataura catchment. The predominance of well drained shallow stony soils, which have little ability to denitrify or hold water, means the zone is highly susceptible to nitrate leaching to groundwater (Topoclimate South, 2001). The highly weathered nature of the gravels (with little/no ability to remove nitrogen) that make up the aquifer and low transmissivity rates, result in minimal transport, dilution or attenuation of leached nitrogen. Because of this nitrate nitrogen concentrations in groundwater commonly exceed the maximum allowable value for drinking water (Ministry of Health, 2008; Rissmann, 2012; Hughes et al., 2016). Unsaturated zone lag times (3–9 years) also equate to a longer delay in peak nitrate delivery than in equivalent areas (i.e. Oxidised Physiographic Zone) (Chanut et al., 2014). Wherever there is this combination of the Luggate and Shotover formations overlain by well drained shallow stony soils or fragic pallic soils we see
Page 36
elevated nitrate in shallow groundwater (Rissmann 2012; Hughes et al., 2016). Because the zone is dominated by land surface recharge (LSR) there is no flushing of the aquifers by alpine derived water (Hughes et al., 2016). The median groundwater nitrate-N concentration within the zone is 10.0 mg/L, the highest of any Physiographic Zone (Physiographic User Guide, 2016). Also important to consider with the Old Mataura Zone is its contribution of groundwater to streams during baseflow in the summer months (Hughes, 2010). It is hypothesised that contaminated groundwater from the Balfour area (within Old Mataura) increases the nitrate concentrations in the Waimea Stream considerably under baseflow and that this is contributing to the declining water quality in the Waimea Stream (Moreau and Hodson, 2015; Hodson, 2015) and the overall nitrogen load in the system. The Waimea Stream at Mandeville is one location in Southland that is predicted to be at high risk of exceeding the national bottom line for periphyton (Hodson, 2015) and is showing increasing trends in surface water nitrate (Moreau and Hodson, 2015).
Key points
Soils and aquifers do not remove nitrogen.
No/little riverine flushing due to almost exclusive land surface recharge.
Due to low aquifer transmissivities and groundwater recharge dominated by land surface recharge soil leached water undergoes minimal dilution resulting in high nitrate concentrations in groundwater.
Nitrogen can be rapidly transported below the root zone.
Nitrate concentrations exceed the maximum allowable value in many places.
Contribution of contaminated groundwater to surface water during baseflow degrades surface waters. The Waimea Stream is showing significant degradation and is getting worse.
Lag times are slightly longer than in other equivalent areas (Oxidising Physiographic Zone).
Oxidising Physiographic Zone
The Oxidising Zone is characterised by areas of soils with an oxic redox state (show little capacity to remove nitrate) underlain by oxic aquifers that also show no to little capacity to remove nitrate. Like the Old Mataura Zone, these areas are susceptible to nitrate leaching through the soil profile to groundwater and nitrate concentrations become elevated in the underlying aquifers. As with the Old Mataura Zone, the Oxidising Zone is dominated by land surface recharge (LSR) and hence receives no flushing by alpine sourced water. The main difference in this zone is that the aquifers are younger and less weathered. Groundwater flows more quickly in these systems allowing for increased dilution of soil leachate, and for equivalent nitrate loadings, nitrate concentrations may not reach the same levels those seen in the Old Mataura Zone. Groundwater nitrate hotspots are common under the Oxidising Zone and in some places nitrate concentrations exceed the MAV (Hodson, 2015; Ministry of Health, 2008; Hughes, 2010; Rissmann 2012; Hughes et al., 2016). The median groundwater nitrate-N concentration within the zone is 5.7 mg/L, the third highest of any Physiographic Zone (Physiographic User Guide, 2016). In a similar manner to the Old Mataura Zone, aquifers within the Oxidising Zone contribute to baseflow in adjacent streams potentially increasing nitrate concentrations in-stream and overall nitrogen load in the system. The median surface water nitrate-N concentration within the zone is 2.1 mg/L, the second highest of any Physiographic Zone (Physiographic User Guide, 2016).
Page 37
Key points
Soils and aquifers little/no ability to remove nitrate.
Groundwater nitrate concentrations are the third highest of any zone and exceed the maximum allowable value for drinking water in some areas.
Contribution of contaminated groundwater to surface water during baseflow contributes to degradation of surface waters.
No/little riverine flushing due to almost exclusive land surface recharge.
Peat Wetlands Physiographic Zone
The Peat Wetlands Zone is characterised by areas of organic or intergrade soils underlain by peat. Peat areas are particularly prone to phosphorus loss, especially if the land has been recently developed (Rissmann et al., 2012; McDowell & Monaghan, 2015). Organic soils have a low anion storage capacity and therefore do not retain phosphorus in the soil profile as well as soils with a higher mineral content (Rissmann et al., 2012; McDowell & Monaghan, 2015). For similar reasons, peats soils are also poor at retaining potassium and sulfate and other agronomically applied chemicals including calcium and magnesium. Peat wetlands also show elevated levels of E.coli (indicator of microbial contamination) presumably due to the high void space and consequently less effective filtering/retention of microbes. Several streams within or hydraulically connected to the Peat Wetlands Zone within the Waituna catchment are showing increasing trends for dissolved reactive phosphorus (DRP). Median groundwater phosphorus concentrations for areas of peat wetland across the southern portion of the Waituna catchment are 50 times higher than those of the northern half of the catchment (Rissmann et al., 2012). Key points
Organic soils are poor at retaining phosphorus and other agronomically applied chemicals.
Peat soils are poor at filtering out microbes equating to high instream E.Coli counts.
Several streams within or that drain the zone are getting worse with regards to dissolved reactive phosphorus.
Development of land within the Peat Zone for dairy or wintering should be avoided due to the high risk of P and E.coli loss.
Riverine Physiographic Zone
The Riverine Physiographic Zone is categorised by recent and fluvial soils overlying oxidised aquifers (Hughes et al., 2016). These soils are classed as having a severe nutrient leaching risk. Soils and aquifers within the Riverine Zone have no/little ability to remove nitrogen. Nitrogen losses in these areas under wintering can be large (Smith et al., 2012). The Riverine zone is differentiated from the Old Mataura and Oxidised zones by a high degree of flushing by river waters, primarily alpine but also bedrock river recharge. Flushing by alpine and bedrock river water provides an ecosystem service by diluting and transporting nutrients in the groundwater. The high degree of river water flushing regulates the concentration of nitrate to values far below the NZ Drinking Water Standard, with nitrate nitrogen concentrations that are below the national bottom line of 6.9 mg/L.

Page 38
Losses of nitrogen from these areas contribute to the overall load within the catchment. Due to the potentially large magnitude of losses per hectare these areas may contribute a disproportionate amount of nitrogen to the receiving environment. In the Oreti, Aparima, Waiau and Mataura the ultimate freshwater receiving environments are the estuaries. Of these, the Jacobs River (Aparima) and New River (Oreti) estuaries are showing signs of degradation and decreasing trends in water quality/state of eutrophication (Stevens & Robertson 2012; Stevens & Robertson 2013; Townsend & Lohrer, 2015). There are significant unknowns around the fate of nitrogen derived from winter grazing on the Riverine Zone:
whether the majority or a significant proportion of the nitrogen lost is flushed through the estuaries to the sea in winter high flow events;
whether some/any of this nitrogen is taken up by macrophyte/periphyton growth in the river and is this then a problem in the estuary at a later time?
are N losses from dairying and winter grazing on the Riverine Zone a significant contributor to the degradation of the estuaries?
nitrogen lost from these areas during drainage events not associated with high flows may be a significant contributor to adverse effects in the downstream ecosystem.
Due to the majority of soils within the Riverine Zone classified as having severe N leaching loss winter grazing activities on the Riverine Zone will contribute to the load of nitrogen in the catchment. With regard to the catchment, this contribution is likely to be disproportionate to the land area (Smith et al., 2012; Ledgard, 2013). Whether this nitrogen load from wintering or other high intensity land uses on Riverine is having direct significant impacts on the downstream ecosystems is unclear.
Bedrock/Hill Country Zone
The Bedrock/Hill country physiographic zone is characterised by mostly rolling to steep land, where soils overlie bedrock or glacial till. In developed areas, contaminant loss to streams is the main concern in this zone as groundwater is minimal. Water can flow quickly down-slope through wet soils and as overland flow to nearby streams following high or prolonged rainfall (particularly during late autumn and winter). Bedrock/Hill country streams can be a major source of recharge water and dilution for lowland waterways and aquifers (Hughes et al., 2016). This capacity for dilution is reduced as more intensive activities occur in these areas. Contaminant loss from the Bedrock/Hill country zone contributes to the contamination loads in lowland streams in neighbouring zones. Although not identified previously as a ‘high risk’ or a ‘sensitive Physiographic Zone’, the large extent of winter forage crop grown in the Bedrock/Hill country zone, in combination with high rainfall and sloping topography, means wintering could become a significant source of nitrogen, phosphorus, sediment and microbial contaminants entering Southland waterways. The thin soils in this zone, which are identified as reducing (Hughes et al., 2016), become overwhelmed under a high nutrient load, resulting in no assimilation of nutrients. Recent research at the Wallacetown demonstration farm (located on the Gleyed Physiographic Zone) by Cameron et al. (2014), provides evidence of the soil zone becoming overwhelmed by the contaminant load under an intensive land use, resulting in large nitrogen losses during periodic rainfall events. The Gleyed Physiographic Zone should have a much higher capacity to attenuate nitrogen than the Bedrock/Hill country zone due to the deeper soil depth.
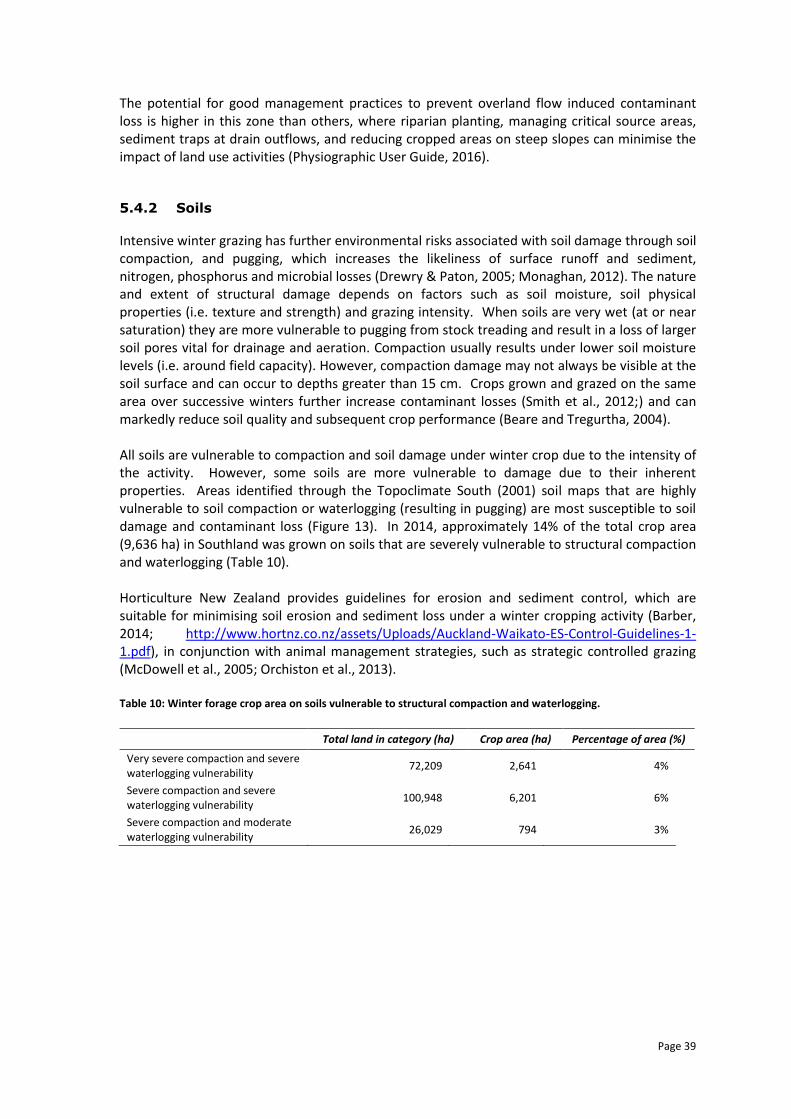
Page 39
The potential for good management practices to prevent overland flow induced contaminant loss is higher in this zone than others, where riparian planting, managing critical source areas, sediment traps at drain outflows, and reducing cropped areas on steep slopes can minimise the impact of land use activities (Physiographic User Guide, 2016).
5.4.2 Soils
Intensive winter grazing has further environmental risks associated with soil damage through soil compaction, and pugging, which increases the likeliness of surface runoff and sediment, nitrogen, phosphorus and microbial losses (Drewry & Paton, 2005; Monaghan, 2012). The nature and extent of structural damage depends on factors such as soil moisture, soil physical properties (i.e. texture and strength) and grazing intensity. When soils are very wet (at or near saturation) they are more vulnerable to pugging from stock treading and result in a loss of larger soil pores vital for drainage and aeration. Compaction usually results under lower soil moisture levels (i.e. around field capacity). However, compaction damage may not always be visible at the soil surface and can occur to depths greater than 15 cm. Crops grown and grazed on the same area over successive winters further increase contaminant losses (Smith et al., 2012;) and can markedly reduce soil quality and subsequent crop performance (Beare and Tregurtha, 2004). All soils are vulnerable to compaction and soil damage under winter crop due to the intensity of the activity. However, some soils are more vulnerable to damage due to their inherent properties. Areas identified through the Topoclimate South (2001) soil maps that are highly vulnerable to soil compaction or waterlogging (resulting in pugging) are most susceptible to soil damage and contaminant loss (Figure 13). In 2014, approximately 14% of the total crop area (9,636 ha) in Southland was grown on soils that are severely vulnerable to structural compaction and waterlogging (Table 10). Horticulture New Zealand provides guidelines for erosion and sediment control, which are suitable for minimising soil erosion and sediment loss under a winter cropping activity (Barber, 2014; http://www.hortnz.co.nz/assets/Uploads/Auckland-Waikato-ES-Control-Guidelines-1-1.pdf), in conjunction with animal management strategies, such as strategic controlled grazing (McDowell et al., 2005; Orchiston et al., 2013). Table 10: Winter forage crop area on soils vulnerable to structural compaction and waterlogging.
Total land in category (ha) Crop area (ha) Percentage of area (%)
Very severe compaction and severe waterlogging vulnerability
72,209 2,641 4%
Severe compaction and severe waterlogging vulnerability
100,948 6,201 6%
Severe compaction and moderate waterlogging vulnerability
26,029 794 3%
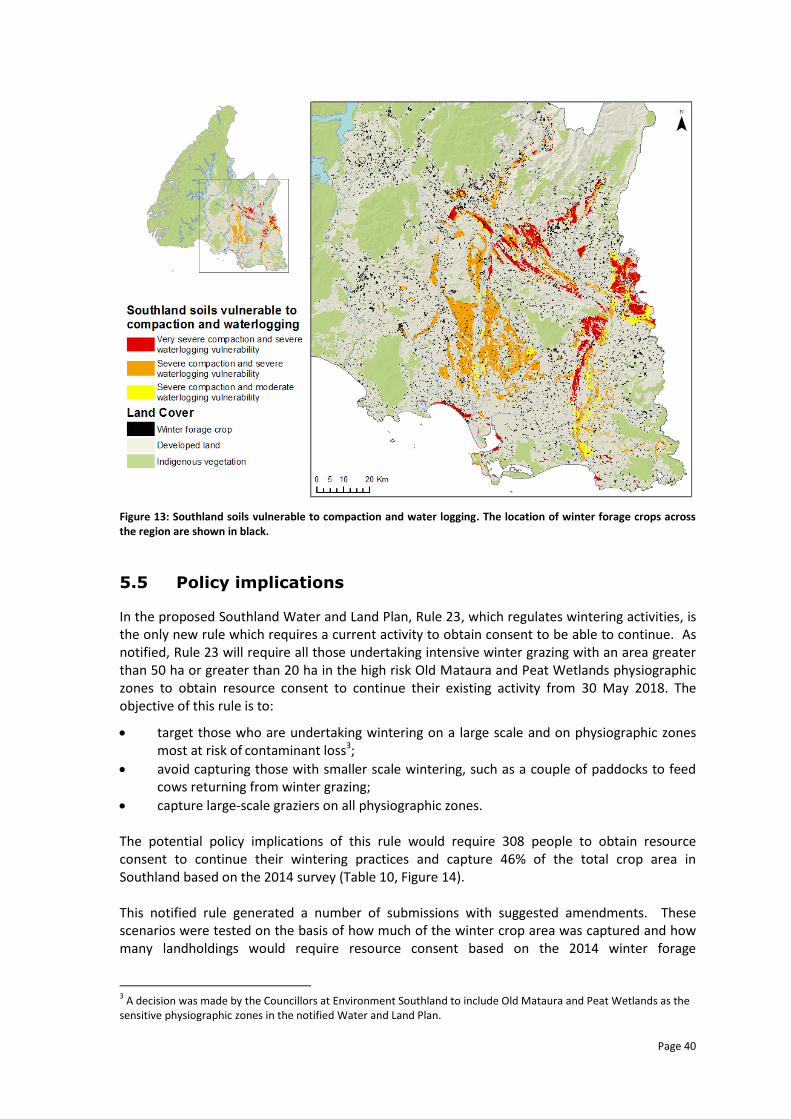
Page 40
Figure 13: Southland soils vulnerable to compaction and water logging. The location of winter forage crops across the region are shown in black.
5.5 Policy implications
In the proposed Southland Water and Land Plan, Rule 23, which regulates wintering activities, is the only new rule which requires a current activity to obtain consent to be able to continue. As notified, Rule 23 will require all those undertaking intensive winter grazing with an area greater than 50 ha or greater than 20 ha in the high risk Old Mataura and Peat Wetlands physiographic zones to obtain resource consent to continue their existing activity from 30 May 2018. The objective of this rule is to:
target those who are undertaking wintering on a large scale and on physiographic zones most at risk of contaminant loss3;
avoid capturing those with smaller scale wintering, such as a couple of paddocks to feed cows returning from winter grazing;
capture large-scale graziers on all physiographic zones. The potential policy implications of this rule would require 308 people to obtain resource consent to continue their wintering practices and capture 46% of the total crop area in Southland based on the 2014 survey (Table 10, Figure 14). This notified rule generated a number of submissions with suggested amendments. These scenarios were tested on the basis of how much of the winter crop area was captured and how many landholdings would require resource consent based on the 2014 winter forage
3 A decision was made by the Councillors at Environment Southland to include Old Mataura and Peat Wetlands as the
sensitive physiographic zones in the notified Water and Land Plan.
Page 41
assessment. Table 11 shows the potential outcomes from the scenarios, with the most favourable outcome capturing a large percentage of the wintering area with minimal consents. The information used for this analysis is limited by one year of data and provides a snapshot in time. However, it is the best information available, based on past land use, and can only provide an indication of consenting implications and is not a precise prediction. The following limitations have been identified in relation to the policy analysis:
the presence of forage crop has been used as a proxy for land used for intensive winter grazing. Management and stock grazing practices are unable to be determined from this analysis;
property boundaries are identified through the Southland Land Use Map (Pearson and Couldrey, 2016), and have been used as a proxy for individual farms when estimating consent application numbers. For the dairy industry, milking platforms are considered as a separate property to runoff or support blocks. There may also be instances where a single farm spans several individual titles and is not identified as a whole enterprise;
legal property boundaries do not always align with the area farmed (i.e. fence lines);
the survey data is only for 2014. There is likely to be variation in both the total hectares in winter crop and the proportion undertaken in each physiographic zone between years in response to grazing demand and paddock rotation;
incentives created by pSWLP may influence the distribution of wintering between the physiographic zones and the type of crop grown (increase in higher yielding crops) in future.

Page 42
Table 11: Outcomes of potential policy scenarios for winter grazing in Southland based on the 2014 winter grazing survey.
Scenario threshold above which consent is required Forage area captured by scenario (ha)
Percentage of total crop area (%)
No. of properties captured by scenario
1. Notified proposed Southland Water and Land Plan – Greater than 50ha on a landholding OR 20ha in Old Mataura or Peat Wetlands
31,288 46 308
2. Working Draft Southland Water and Land Plan – Greater than 15% of a landholding.
17,492 26 473
3. Greater than 20% of a landholding 11,261 17 284
4. Greater than 50ha on a landholding OR greater than 20ha in Old Mataura and Peat Wetlands OR greater than 10% of a landholding
45,103 66 1030
5. Greater than 50ha on a landholding OR greater than 20ha in Old Mataura and Peat Wetlands OR greater than 15% of a landholding
38,334 56 658
6. Greater than 50ha on a landholding OR 10% of a landholding
44,812 66 1021
7. Greater of 50ha on a landholding OR 15% of a landholding
37,862 56 643
8. 50 ha of a landholding 30,552 45 285
9. Greater than 20ha total in Old Mataura, Peat Wetlands, Oxidising and Riverine physiographic zones OR greater than 50ha elsewhere (except Alpine)
35,921 53 445
10. Greater than 20ha total in Old Mataura, Peat wetlands and Bedrock/Hill country OR 50 ha elsewhere (except Alpine)
36,570 54 470
11. For landholdings less than 333ha, greater than 50 ha OR for landholdings greater than 333ha, 15% of the landholding
10,182 15 115
12. For landholdings less than 500ha, greater than 50 ha OR for landholdings greater than 500ha, 10% of the landholding
15,328 22 162
13. For landholdings less than 333ha, greater than 50 ha OR greater than 20ha in Old Mataura and Peat Wetlands; OR for landholdings greater than 333ha, 15% of the landholding OR greater than 20ha in Old Mataura and Peat Wetlands
12,741 19 146
14. For landholdings less than 500ha, greater than 50 ha OR greater than 20ha in Old Mataura and Peat Wetlands; OR for landholdings greater than 500ha, 10% of the landholding OR greater than 20ha in Old Mataura and Peat Wetlands
16,942 25 189

Page 43
Figure 14: Properties likely to be affected by Rule 23 in the notified Water and Land Plan. Sensitive Physiographic Zones for winter forage cropping are Old Mataura and Peat Wetlands. A total of 308 properties will be affected, 23 properties >20 ha on vulnerable Physiographic Zones, 266 properties >50 ha of winter forage in total, and 19 properties exceed both thresholds.

Page 44
6. Summary and Recommendations
Properties in Southland growing winter forage crops over 2014 were identified through spectral analysis. A refinement method was developed at Environment Southland using land cover, physiographic zones and land use to identify and remove likely errors, such as scrub, shadow, and other non-agricultural vegetative covers. When shown spatially the crop areas provide a snapshot of livestock wintering operations throughout the region. The winter forage crop area was estimated to be 68,280 ha in 2014. At the property scale, it provides information on the intensity of wintering activities through the area and percentage of property in crop. In addition to producing enough feed for stock, winter forage crop is often used as part of a farms management plan for pasture renewal, which is consistent with the widespread occurrence of this activity in Southland. The image dataset provided by Landcare Research, in the form of the Winter Livestock Forage Map – Southland Region 2014 (North & Belliss, 2015), was strongly influenced by cloud cover. Because of this, an expensive and time consumptive exercise of radiometric calibration and cloud masking was required to make the imagery useable. The procurement of high quality imagery from the onset would provide for a faster, simpler method, with better accuracies. Therefore, it is recommended that high quality imagery is sourced for any further analysis of winter cropping. Currently, there is no alternative to using the Southland Land Use Map to determine farm boundaries; therefore any limitations to this dataset also have limitations in this analysis. Amendments to the base property layer to better represent streamside and river boundaries would greatly improve estimates of forage crop hectares on a property. Currently grazed areas of river floodplains, floodplain benches and terraces that are not within a current land parcel are unable to be attributed to a property or are attributed to the property on the adjacent side of the river. This error reduces the total area of forage crops that can be attributed to a property. In addition, the procurement of imagery in higher frequency over an extended time period would increase certainty around policy development, implications and plan effectiveness. It is recommended that for future assessments image collection is taken over a longer time period, or whenever conditions are suitable (cloud free days) if using open source data over the entire year. Additional benefits to collecting imagery over the course of a year are crop rotations and pasture renewal practices can be better understood, and estimates of fallow ground (bare ground) can be calculated monthly to aid in sediment loss modeling. The Old Mataura, Oxidising and Peat Wetlands Physiographic Zones have been identified as the most susceptible to nutrient loss and water quality degradation resulting from winter grazing. Shallow groundwater below the Old Mataura and Oxidising Zones show elevated concentrations of nitrogen compared to other areas, while the Peat Wetlands has elevated risk for phosphorus loss. The Riverine Physiographic Zone is also susceptible to nitrogen loss, but due to flushing by alpine water nitrogen does not accumulate. Although not identified previously as a sensitive physiographic zone, this study has identified that Bedrock/Hill country may also be a significant source of contaminants direct to streams due to the large amount of crop grown in this zone, especially on sloping land. The estimates of policy implications are to be used as a guide only. To improve certainty around the analysis, data from multiple years would be required. This assessment is also limited by the methodology of the Southland Land Use Map. The pSWALP would require approximately
Page 45
308 properties to obtain resource consent to continue their current wintering practices. This captures approximately 46% of the total winter forage crop area in Southland based on the 2014 survey.

Page 46
7. References
Agricom. (2015). Brassica, beet and forage cropping guide. Retrieved from: www.agricom.co.nz Barber, A. (2014). Erosion and sediment control guidelines for vegetable production – Good
Management Practices. Agrilink New Zealand Technical Report, prepared for HorticultureNZ. 40p.
Beare, M. H. & Tregurtha, C. S. (2004). Soil quality on Southland Cropping farms: a guide to monitoring and best management practices. Christchurch, New Zealand: New Zealand Institute for Crop & Food Research Limited (ISBN 0478108486). 2004; 51p.
Beef + Lamb New Zealand. (2012). Beef and Lamb New Zealand Economic Service. Retrieved from: http://www.beeflambnz.com/information/on-farm-data-and-industry-production/sheep-beef-farm-survey/nz/
Cameron, K.C., Di, H.J., Roberts, A., Beale, N., Weir, J., and Borrie, N. 2014. Monitoring effects of
Southland demonstration farm on stream water nitrate. In: Nutrient management for the farm, catchment and community. (Eds L.D. Currie and C L.
Christensen). http://flrc.massey.ac.nz/publications.html. Occasional Report No. 27. Fertilizer and Lime Research Centre, Massey University, Palmerston North, New Zealand. 6 pages.
Chakwizira, E. & de Ruiter, J.M. (2009). Southland winter feeding programme – evaluation of options. Plant & Food Contract Report prepared for DairyNZ (Report No. 2355). Auckland, New Zealand: The New Zealand Institute for Plant & Food Research Limited.
Chanut, P., Ledgard, G., Rissmann, C. & Wilson, S., (2014). Estimating Time Lags for Nitrate Response in Shallow Southland Groundwater, Technical Report. Environment Southland publication No 2014-13, Invercargill. 51 p.
Cichota, C., Vogeler, I., Trolove, S., Malcolm, B., Thomas, S. & Beare, M. (2016). Describing the effect of grazing on nitrogen leaching in winter forage-ryegrass rotations. In: L. D. Currie & R. Singh (Eds.). Integrated nutrient and water management for sustainable farming. (Occasional Report No. 29.) Fertilizer and Lime Research Centre, Massey University, Palmerston North, New Zealand. 8p.
de Kleine, C. A. M., Monaghan, R. M., Ledgard, S. & Shepherd, M. (2010). A system's perspective on the effectiveness of measures to mitigate the environmental impacts of nitrogen losses from pastoral dairy farming. In: G. R. Edwards & R. H. Bryant (Eds.) Australasian Dairy Science Symposium (pp. 14-28). Lincoln, New Zealand: Lincoln University.
Drewry, J. J. & Paton, R .J. (2005). Soil physical quality under cattle grazing of a winter-fed brassica crop. Australian Journal of Soil Research, 43(4): 525-531.
Fielden, E. & Smith, J. (1998). Reproductive management of grazing ruminants in New Zealand, 12. Hamilton, New Zealand: New Zealand Society of Animal Production (INC). 220p.
Hodson, R. (2015). Water Quality in Southland – Fact Sheet. Environment Southland. Hughes, B. (2010). State of the Environment: Groundwater Quality Technical Report. Prepared by
Liquid Earth for Environment Southland. May 2010; 58p. Hughes, B., Wilson, K., Rissmann, C. & Rodway, E. (2016). Physiographics of Southland:
Development and application of a classification system for managing land use effects on water quality in Southland. Environment Southland Technical Report Publication No. 2016/11. Invercargill, New Zealand. 146p.
Ledgard, G. (2013). Land Use Change in the Southland region: Technical Report. Invercargill, New Zealand: Environment Southland.
Malcolm, B. J., Cameron, K. C., Edwards, G. R. & Di, H. J. (2015). Nitrogen leaching losses from lysimeters containing winter kale: the effects of urinary N rate and DCD application. New Zealand Journal of Agricultural Research, 58: 13-25.

Page 47
Malcolm, B. J., Cameron, K. C., Edwards, G. R., Di, H. J., de Ruiter, J. M., & Dalley, D. E. (2016). Nitrate leaching losses from lysimeters simulating winter grazing of fodder beet by dairy cows. New Zealand Journal of Agricultural Research, 1-10.
McDowell, R. W., Drewry, J. J., Muirhead, R. W. & Paton, R. J. (2005). Restricting the grazing time of cattle to decrease phosphorus, sediment and E. coli losses in overland flow from cropland. Australian Journal of Soil Research, 43: 61-66.
McDowell, R. W. & Houlbrooke, D. J. (2008). Phosphorus, nitrogen and sediment losses from irrigated cropland and pasture grazed by cattle and sheep. Proceedings of the New Zealand Grasslands Association, 70: 77-83.
McDowell, R. W., & Monaghan, R. M. (2015). Extreme phosphorus losses in drainage from grazed dairy pastures on marginal land. Journal of environmental quality, 44(2), 545-551.
McDowell, R. W. & Stevens, D. R. (2008). Potential waterway contamination associated with wintering deer on pastures and forage crops. New Zealand Journal of Agricultural Research, 51: 287-290.
McDowell, R. W., & Monaghan, R. M. (2015). Extreme phosphorus losses in drainage from grazed dairy pastures on marginal land. Journal of Environmental Quality, 44(2), 545-551.
Meneer, J. C., Ledgard, S. F. & Gillingham, A. G. (2004). Land use impacts on Nitrogen and Phosphorus Loss and management options for Intervention. AgResearch Client Report, prepared for Environment Bay of Plenty. June 2004; 52p.
Ministry of Health. (2008). New Zealand Drinking-Water Standards (NZDWS). Publication WA 675 NEW 2008. New Zealand 2005 (revised 2008).
Moir, J.L., Wild, M.A., Cameron, K.C., & Di, H.J. (2010). The effect of DCD on nitrogen losses from sheep urine patches applied to Lysimeters in autumn. Proceedings of the New Zealand Grassland Association, 72: 197-202.
Monaghan, R. M., Semadeni-Davis, A., Muirhead, R. W., Elliot, S. & Shankar, U. (2010). Land use and land management risks to water quality in Southland. AgResearch Client Report, prepared for Environment Southland.
Monaghan, R.M. (2012). The impacts of animal wintering on water and soil quality. AgResearch Client Report, prepared for Environment Southland (RE500/2012/029). October 2012; 45 p.
Monaghan, R. M. & Smith, L. C. (2012). Contaminant losses in overland flow from dairy farm laneways in southern New Zealand. Agriculture, Ecosystems & Environment, 159: 170-175.
Monaghan, R. M., Smith, L. C. & de Klein, C. A. M. (2013). The effectiveness of the nitrification inhibitor dicyandiamide (DCD) in reducing nitrate leaching and nitrous oxide emissions from a grazed winter forage crop in southern New Zealand. Agriculture, Ecosystems & Environment, 175: 29-38.
Moreau, M. & Hodson, R. (2015). Trends in Southland’s water quality: a comparison between regional and national sites for groundwater and rivers. GNS Science Consultancy Report, prepared for Environment Southland. 2014; 61p.
National Policy Statement for Freshwater Management 2014. http://www.mfe.govt.nz/sites/default/files/media/Fresh%20water/nps-freshwater-management-jul-14.pdf
North, H. & Belliss, S. (2015). Winter livestock forage map – Southland Region 2014. Landcare Research Client Report, prepared for Environment Southland. 31 p.
North, H., Belliss, S. & Pairman, D. (2014). Mapping winter livestock forage in Southland. Landcare Research Client Report, prepared for Environment Southland. 36 p.
Orchiston, T.S., Monaghan, R.M., and Laurenson, S. (2013) Reducing overland flow and sediment losses from winter forage crop paddocks grazed by dairy cows. In: Accurate and efficient use of nutrients on farms. Eds L.D. Currie and C L. Christensen. http://flrc.massey.ac.nz/publications.html. Occasional Report No. 26. Fertilizer and Lime Research Centre, Massey University, Palmerston North, New Zealand. 7 p.

Page 48
Pearson, L. & Couldrey, M. (2016). Methodology for GIS-based Land Use Maps for Southland. Environment Southland Technical Report 2016-10. Invercargill, New Zealand: Environment Southland. 167p.
Physiographic User Guide. (2016). User guide to the physiographic technical sheets. Environment Southland report, November 2016.
Rissmann, C. (2012). The Extent of Nitrate in Southland Groundwaters Regional 5 Year Median (2007-2012 (June)) Technical Report. Environment Southland publication No 2012-09, Invercargill. 24p.
Shepherd, M., Stafford, A. & Smeaton, D. (2012). The use of a nitrification inhibitor (DCn™) to reduce nitrate leaching under a winter-grazed forage crop in the Central Plateau. Proceedings of the New Zealand Grassland Association, 74: 103-107.
Smith, L. C., deKlein, C. A. M. & Catto, W. D. (2008). Effect of dicyandiamide applied in a granular form on nitrous oxide emissions from a grazed dairy pasture in Southland, New Zealand. New Zealand Journal of Agricultural Research, 51 (4): 387-396.
Smith, L. C., Orchiston, T. & Monaghan, R. M. (2012). The effectiveness of the nitrification inhibitor dicyandiamide (DCD) for mitigating nitrogen leaching losses from a winter grazed forage crop on a free draining soil in northern Southland. Proceedings of the New Zealand Grassland Association, 74: 39-44.
StatisticsNZ Agricultural Census (2012). http://m.stats.govt.nz/browse_for_stats/industry_sectors/agriculture-horticulture-forestry/2012-agricultural-census-tables/grain-and-arable.aspx
Stevens, L. M. & Robertson, B. M. (2012). New River Estuary 2012: Broad scale Habitat Mapping. Prepared by Wriggle Coastal Management for Environment Southland. Nelson, New Zealand. November 2012; 29p.
Stevens, L. M. & Robertson, B. M. (2013). Jacobs River Estuary: Broad scale Habitat Mapping 2012/13. Prepared by Wriggle Coastal Management for Environment Southland. Nelson, New Zealand. December 2013; 26p.
Tarbotton, I., Bell, P., Mitchelmore, K. & Wilson, J. (2012). Farmer Network Project, final internal report. DairyNZ, Newstead, Hamilton, New Zealand.
Topoclimate South. (2001). Topoclimate South Soil Mapping Project. Electronic files held by Environment Southland.
Townsend, M. & Lohrer, D. (2015). A review of the ecological health and water quality in four Southland estuaries. Prepared by NIWA for Environment Southland and Dairy NZ (Report No. HAM2015-054). Hamilton, New Zealand. April 2015; 52p.
Turnbull, I.M., Allibone, A.H. (compilers) (2003).Geology of the Murihiku area: scale 1:250,000. Lower Hutt: Institute of Geological & Nuclear Sciences Limited. Institute of Geological & Nuclear Sciences 1:250,000 geological map 20. 74 p. + 1 folded map.
Water and Land 2020 and Beyond. (2016). Physiographic zone: Alpine. Environment Southland Factsheet. Invercargill, New Zealand: Environment Southland.
Water and Land 2020 and Beyond. (2016). Proposed Southland Water and Land Plan: Part A. Invercargill, New Zealand: Environment Southland. http://www.es.govt.nz/Document%20Library/Consultations/2016/Proposed%20Southland%20Water%20and%20Land%20Plan/Supporting%20Documents/proposed%20Southland%20Water%20and%20Land%20Plan%20Part%20A.pdf
Water and Land 2020 and Beyond. (2016). Working Draft Southland Water and Land Plan: Part A. Invercargill, New Zealand: Environment Southland.

Page 49
Appendix 1: Data refinement process
Land Cover
Land Cover Hectares Retained
Hectares Removed
Alpine Grass/Herbfield 0 2
Broadleaved Indigenous Hardwoods 0 176
Built-up Area (settlement) 0 8
Deciduous Hardwoods 0 223
Estuarine Open Water 0 9
Exotic Forest 0 425
Fernland 0 152
Flaxland 0 43
Forest - Harvested 0 156
Gorse and/or Broom 0 341
Gravel or Rock 0 57
Herbaceous Freshwater Vegetation 0 361
Herbaceous Saline Vegetation 0 10
High Producing Exotic Grassland 65,593
Indigenous Forest 0 242
Lake or Pond 0 7
Low Producing Grassland 4,629
Manuka and/or Kanuka 0 238
Matagouri or Grey Scrub 0 145
Mixed Exotic Shrubland 0 102
Orchard, Vineyard or Other Perennial Crop 3
River 0 35
Sand or Gravel 0 12
Short-rotation Cropland 938
Sub Alpine Shrubland 0 33
Surface Mine or Dump 0 3
Tall Tussock Grassland 0 791
Urban Parkland/Open Space 0 26
TOTAL 71,163 3,595

Page 50
Physiographic Zones Physiographic Zone Hectares Retained Hectares Eliminated
Alpine 0 16
Central Plains 1,304
Gleyed 14,312
Hill Country 24,858
Lignite - Marine Terraces 2,539
Old Mataura 2,185
Oxidising 16,190
Peat Wetlands 1,888
Riverine 6,788
TOTAL 70,064 16
Topography
Slope Class Hectares Retained Hectares Eliminated
Flat (0 – 4 degrees) 51,755
Rolling (4 – 16 degrees) 18,752
Easy Hill (16 – 26 degrees) 3,698
Steep (>26 degrees) 0 544
TOTAL 74,204 544

Page 51
Land Use
Land Use Classification Hectares Retained
Hectares Eliminated
Arable 160 Beef 1,478 Commercial Use 0 1
Conservation 0 482
Dairy 10,110 Dairy Support 2,641 Dairy Support and Other Livestock 2,110 Estuaries and Marine 0 9
Flower and Bulb Growers 0 21
Horticulture 0 8
Indigenous Forestry 0 1
Industry and Airports 0 50
Lakes and Rivers 0 247
Lifestyle 53 Livestock Support 2,591 Majority Deer with Mixed Livestock 1,913 Mixed Livestock 7,611 Mixed Livestock and Arable 2,132 Nurseries and Orchards 0 45
Other Animals 66 Plantation Forestry 0 95
Public Use 0 16
Recreation and Tourism 0 189
Residential Use 0 33
Road and Rail 0 558
Sheep 7,287 Sheep and Beef 24,615 Sheep Milking 28 Small Landholding 858 Specialist Deer 1,177 Unknown Land Use - Indigenous Cover 0 32
Unknown Land Use - Non-agricultural 0 18
Unknown Land Use - Pastoral 3,470
Grand Total 68,301 1,804
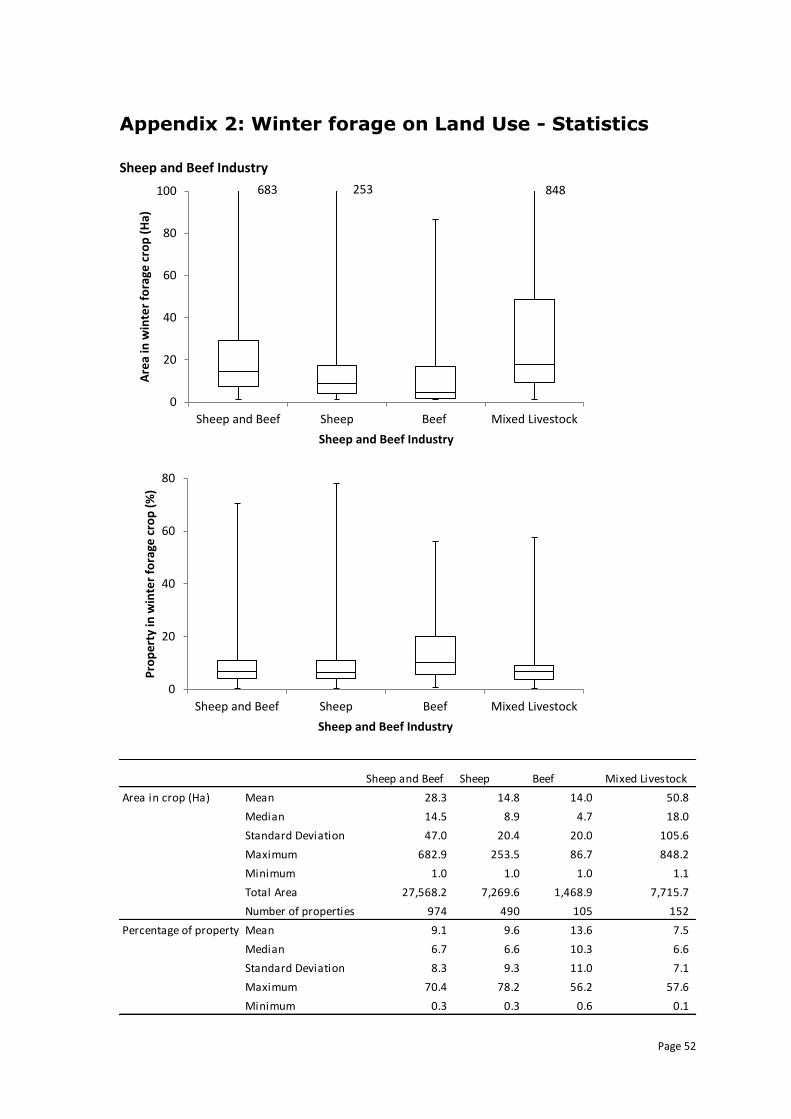
Page 52
Appendix 2: Winter forage on Land Use - Statistics
Sheep and Beef Industry
0
20
40
60
80
100
Sheep and Beef Sheep Beef Mixed Livestock
Are
a in
win
ter
fora
ge c
rop
(H
a)
Sheep and Beef Industry
0
20
40
60
80
Sheep and Beef Sheep Beef Mixed Livestock
Pro
pe
rty
in w
inte
r fo
rage
cro
p (
%)
Sheep and Beef Industry
Sheep and Beef Sheep Beef Mixed Livestock
Area in crop (Ha) Mean 28.3 14.8 14.0 50.8
Median 14.5 8.9 4.7 18.0
Standard Deviation 47.0 20.4 20.0 105.6
Maximum 682.9 253.5 86.7 848.2
Minimum 1.0 1.0 1.0 1.1
Total Area 27,568.2 7,269.6 1,468.9 7,715.7
Number of properties 974 490 105 152
Percentage of property Mean 9.1 9.6 13.6 7.5
Median 6.7 6.6 10.3 6.6
Standard Deviation 8.3 9.3 11.0 7.1
Maximum 70.4 78.2 56.2 57.6
Minimum 0.3 0.3 0.6 0.1
683 253 848

Page 53
Dairy Industry
0
50
100
150
200
Dairy-Milking Platform Dairy Support Dairy Support andOther Livestock
Are
a in
win
ter
fora
ge c
rop
(H
a)
Dairy Industry
0
20
40
60
80
Dairy-Milking Platform Dairy Support Dairy Support and OtherLivestock
Pro
pe
rty
in w
inte
r fo
rage
cro
p (
%)
Dairy Industry
Dairy-MP Dairy SupportDairy Support and
Other Livestock
Area in crop (Ha) Mean 13.2 16.4 27.0
Median 8.1 10.7 15.9
Standard Deviation 16.1 17.2 33.4
Maximum 161.5 98.8 182.0
Minimum 1.0 1.0 1.3
Total Area 10,095.2 2,554.5 2,107.9
Number of properties 767 156 78
Percentage of property Mean 5.2 14.4 13.3
Median 4.0 10.9 9.6
Standard Deviation 4.7 12.4 11.6
Maximum 41.2 68.9 60.0
Minimum 0.4 0.5 1.6

Page 54
Deer Industry
0
50
100
150
200
250
300
Specialist Deer Majority Deer with Mixed Livestock
Are
a in
win
ter
fora
ge c
rop
(H
a)
Deer Industry
0
10
20
30
40
50
60
Specialist Deer Majority Deer with Mixed Livestock
Pro
pe
rty
in w
inte
r fo
rage
cro
p (
%)
Deer Industry
Specialist Deer Majority Deer with Mixed Livestock
Area in crop (Ha) Mean 14.5 26.9
Median 6.7 15.1
Standard Deviation 23.7 37.7
Maximum 164.5 249.1
Minimum 1.0 1.3
Total Area 1,174.6 1,911.9
Number of properties 81 71
Percentage of property Mean 11.1 10.9
Median 9.1 8.5
Standard Deviation 9.1 8.7
Maximum 52.0 41.2
Minimum 0.4 1.5

Page 55
Arable Industry
0
20
40
60
80
100
Arable Arable and Mixed Livestock
Are
a in
win
ter
fora
ge c
rop
(H
a)
Arable Industry
0
10
20
30
40
50
60
70
Arable Arable and Mixed Livestock
Pro
pe
rty
in w
inte
r fo
rage
cro
p (
%)
Arable Industry
Arable
Arable and Mixed
Livestock
Area in crop (Ha) Mean 8.3 24.5
Median 5.0 17.9
Standard Deviation 7.9 23.1
Maximum 33.2 93.1
Minimum 1.2 1.2
Total Area 157.7 2,129.2
Number of properties 19 87
Percentage of property Mean 11.3 11.7
Median 7.6 10.5
Standard Deviation 9.9 9.6
Maximum 34.1 66.7
Minimum 1.9 0.8

Page 56
Other Land Uses
0
10
20
30
40
50
LivestockSupport
Small LandHoldings
Lifestyle Other Animals UnknownLand Use -
Pastoral
Are
a in
win
ter
fora
ge c
rop
(%
)
Other land Uses
0
20
40
60
80
100
LivestockSupport
Small LandHoldings
Lifestyle Other Animals UnknownLand Use -
Pastoral
Pro
pe
rty
in w
inte
r fo
rage
cro
p (
%)
Other Land Uses
Livestock
Support
Small Land
Holdings Lifestyle
Other
Animals
Dairy
Sheep
Unknown Land
Use -Pastoral
Area in crop Mean 21.4 3.2 1.8 3.9 28.1 4.7
(Ha) Median 11.3 1.9 1.7 3.3 28.1 2.4
Standard Deviation 34.3 2.7 0.6 2.5 - 7.1
Maximum 237.7 14.7 2.5 9.2 28.1 74.3
Minimum 1.1 1.1 1.1 1.1 28.1 1.0
Total Area 2,586.9 186.7 16.0 63.2 28.1 829.4
Number of properties 121 59 9 16 1 177
Percentage Mean 15.1 17.1 52.3 11.7 4.8 29.1
of property Median 10.0 14.3 46.7 9.7 4.8 20.9
Standard Deviation 13.9 12.1 21.9 8.5 - 23.5
Maximum 75.8 66.8 94.2 31.1 4.8 99.1
Minimum 1.1 3.4 28.2 1.6 4.8 0.4
237 74

Page 57
Appendix 3: ArcMap Definition Queries for Policy
Analysis
Layer location: M:\GIS\Projects\ArcMap\Environmental Info\Land Use 2015 DeanP\MattLandUse\Winter Grazing\Winter Forage Areas.shp
Scenario threshold above which consent is required Query Used
1. Notified proposed Southland Water and Land Plan – greater than 50ha on a landholding OR 20ha in Old Mataura or Peat Wetlands
Definition Query: "Farm_Area" >20 Select by Attributes: "Forage_ha" >50 OR (("SUM_SUM_ol" + "SUM_SUM_pe") >20)
2. Working Draft Southland Water and Land Plan – greater than 15% of a landholding.
Definition Query: "Farm_Area" >20 Select by Attributes: "Percentage" >15
3. Greater than 20% of a landholding Definition Query: "Farm_Area" >20 Select by Attributes: "Percentage" >20
4. Greater than 50ha on a landholding OR greater than 20ha in Old Mataura and Peat Wetlands OR greater than 10% of a landholding
Definition Query: "Farm_Area" >20 Select by Attributes: "Forage_ha" > 50 OR (("SUM_SUM_ol" + "SUM_SUM_pe") >20) OR "Percentage" >10
5. Greater than 50ha on a landholding OR greater than 20ha in Old Mataura and Peat Wetlands OR greater than 15% of a landholding
Definition Query: "Farm_Area" >20 Select by Attributes: "Forage_ha" > 50 OR (("SUM_SUM_ol" + "SUM_SUM_pe") >20) OR "Percentage" >15
6. Greater than 50ha on a landholding OR 10% of a landholding
Definition Query: "Farm_Area" >20 Select by Attributes: "Forage_ha" > 50 OR "Percentage" >10
7. Greater than 50ha on a landholding OR 15% of a landholding
Definition Query: "Farm_Area" >20 Select by Attributes: "Forage_ha" > 50 OR "Percentage" >15
8. 50 ha of a landholding Definition Query: "Farm_Area" >20 Select by Attributes: "Forage_ha" > 50
9. Greater than 20ha total in Old Mataura, Peat Wetlands, Oxidising and Riverine physiographic zones OR greater than 50ha elsewhere (except Alpine)
Definition Query: "Farm_Area" >20 Select by Attributes: ("SUM_SUM_ol" + "SUM_SUM_ox" + "SUM_SUM_pe" + "SUM_SUM_ri") >20 OR "Forage_ha" > 50
10. Greater than 20ha total in Old Mataura, Peat wetlands and Bedrock/Hill country OR 50 ha elsewhere (except Alpine)
Definition Query: "Farm_Area" >20 Select by Attributes: ("SUM_SUM_ol" + "SUM_SUM_pe" + "SUM_SUM_hi") >20 OR "Forage_ha" > 50
11. For landholdings less than 333ha, greater than 50 ha OR for landholdings greater than 333ha, 15% of the landholding
Definition Query: "Farm_Area" >20 Select by Attributes: "Farm_Area" <333 AND "Forage_ha">50 OR "Farm_Area">333 AND "Percentage">15
12. For landholdings less than 500ha, greater than 50 ha OR for landholdings greater than 500ha, 10% of the landholding
Definition Query: "Farm_Area" >20 Select by Attributes: "Farm_Area" <500 AND "Forage_ha">50 OR "Farm_Area">500 AND "Percentage">10
13. For landholdings less than 333ha, greater than 50 ha OR greater than 20ha in Old Mataura and Peat Wetlands; OR for landholdings greater than 333ha, 15% of the landholding OR greater than 20ha in Old Mataura and Peat Wetlands
Definition Query: "Farm_Area" >20 Select by Attributes: (("SUM_SUM_ol" + "SUM_SUM_pe") >20) OR "Farm_Area" <333 AND "Forage_ha">50 OR "Farm_Area">333 AND "Percentage">15
14. For landholdings less than 500ha, greater than 50 ha OR greater than 20ha in Old Mataura and Peat Wetlands; OR for landholdings greater than 500ha, 10% of the landholding OR greater than 20ha in Old Mataura and Peat Wetlands
Definition Query: "Farm_Area" >20 Select by Attributes: (("SUM_SUM_ol" + "SUM_SUM_pe") >20) OR "Farm_Area" <500 AND "Forage_ha">50 OR "Farm_Area">500 AND "Percentage">10