spatial analysis of clustering of foreclosures in the
TRANSCRIPT

International Journal of
Geo-Information
Article
Spatial Analysis of Clustering of Foreclosures in thePoorest-Quality Housing Urban Areas: Evidence fromCatalan Cities
Aaron Gutiérrez 1,* ID and Josep-Maria Arauzo-Carod 2
1 Department of Geography, Rovira i Virgili University, 43480 Vila-seca, Catalonia, Spain2 Department of Economics (CREIP-QURE), Rovira i Virgili University, 43204 Reus, Catalonia, Spain;
[email protected]* Correspondence: [email protected]; Tel.: +34-977-558-147
Received: 6 December 2017; Accepted: 11 January 2018; Published: 12 January 2018
Abstract: This paper uses data on housing stock owned by financial entities as a result of foreclosuresto analyze (1) the spatial logic of Spain’s mortgage crisis in urban areas, and (2) the characteristicsof the types of housing most affected by this phenomenon. Nearest-Neighbor Index and Ripley’s Kfunction analyses were applied in two Catalan cities (Tarragona and Terrassa). The results obtainedshow that foreclosures tend to be concentrated in the most deprived neighborhoods. The generalpattern of clustering also tends to be most intense for smaller and cheaper housing. Our findings showthat home foreclosures have been concentrated in only a few neighborhoods and precisely in thosecontaining the poorest-quality housing stock. They also provide new evidence of the characteristicsand spatial patterns of the housing stock accumulated by banks in Catalonia as a result of the recentwave of evictions associated with foreclosures.
Keywords: foreclosures; evictions; clustering; Nearest-Neighbor Index; Moran’s I; Ripley’s K; Catalonia
1. Introduction
Over the last decade, one of the main manifestations of the global financial crash and relatedhousing crisis has been a proliferation of mortgage foreclosures. Before this, the financialization of thehousing markets [1–4] and speculative property market practices [5,6] led to a massive increase in theoverexposure of household economies to credit, which was particularly evident during the propertyboom (from the 1990s to 2007) [7]. The bursting of the property bubble and the accelerated growth ofunemployment have since resulted in an increasing number of families unable to meet their mortgagepayments. This has culminated in a wave of evictions associated with mortgage foreclosures. In theUSA, the mortgage crisis resulted in more than 16 million foreclosures in the 2008–2016 period [8].In Europe, Spain has been the most affected country, with more than 695,000 mortgage foreclosuresduring the same period (of those, 137,000 were in Catalonia), resulting in more than 327,000 evictions(n.d. for Catalonia) [9]. Ireland, the United Kingdom, Italy, and Greece have also registered high ratesof foreclosure, although at lower levels than in Spain [10–12].
Previous studies conducted on the situation in Spain have highlighted that evictions due tomortgage foreclosures tend to be concentrated in the most vulnerable social groups [13]. Unemployedpeople, ethnic minorities, and single parent families have been underlined as the most affectedgroups [14]. Within this context of a major wave of evictions due to foreclosures, financial entities haveemerged as new landlords through the acquisition and accumulation of a large stock of properties.In consequence, these financial entities have become key actors in the post-crisis housing marketand the most important housing owners in Spain. According to data on Catalonia, the numberof housing units owned by financial entities (around 45,000) was 50% greater than those owned
ISPRS Int. J. Geo-Inf. 2018, 7, 23; doi:10.3390/ijgi7010023 www.mdpi.com/journal/ijgi

ISPRS Int. J. Geo-Inf. 2018, 7, 23 2 of 17
by all government agencies (around 30,000), including municipal authorities, public companies,and regional government institutions [15]. This rise in the number of evictions resulting from failureto make mortgage repayments was accompanied, and indeed fueled by, a process known as therestructuring and sanitizing of the Spanish financial sector [16,17]. This process entailed first rescuingfinancial entities with the use of public funds and the subsequent conversion of regional savingsbanks into private banks (restructuring). This was followed by the transfer of the assets of therescued financial entities (land; empty, unsold, and/or unfinished housing; and housing acquired viamortgage foreclosure) from the property sector to the Sociedad de Gestión de Activos Procedentes de laReestructuración Bancaria (Company for the Management of Assets Proceeding from the Restructuringof the Banking System) or SAREB (sanitizing) [18,19]. According to data from the Bank of Spain,the value of direct aid granted to the banking sector has, to date, reached €61 billion (up to 20% thisamount could be attributed to their activity in Catalonia, since this region accounts this percentage ofthe total of mortgage foreclosures carried out in Spain). The most significant aspect of this process isthat the financial entities rescued with public funds have carried out the largest number of evictionsassociated with mortgage foreclosures. In fact, data on Catalonia show that around 65% of evictionsdue to mortgage foreclosures executed between 2008 and 2015 were carried out by financial entitiesthat had, themselves, been previously rescued using public funds [15].
This paper seeks to contribute to the existing empirical literature in this field by providing detailedresults obtained from a new dataset that includes extensive records of foreclosed housing units in theCatalan cities of Tarragona and Terrassa. More precisely, we carry out a spatial analysis that allowsus to identify the intra-urban spatial distribution of housing from which people were evicted due tomortgage foreclosures. The dataset also includes information about some of the main characteristicsof these housing units; this helps us to establish a profile of foreclosed properties and explain thespatial pattern of this phenomenon. This approach constitutes a novel contribution to the study of theterritorial logic of evictions in Spain. Previous studies on intra-urban logics and implications of themortgage crisis in Spain have mainly focused on analyzing social characteristics of the urban areasmost affected by foreclosures. However, there is a lack of studies that consider this phenomenon usingthe characteristics of the foreclosed housing. Thus, this study allows us, for the first time, to identifyand correlate both the type of housing involved in evictions due to foreclosures and the neighborhoodsin which these tend to be concentrated.
As there is consistent international evidence to suggest that evictions increase urban inequality,we aim to establish whether Spain’s mortgage crisis helped to exacerbate this situation. To accomplishthis, we seek to validate the following hypotheses:
1. The distribution of evictions due to mortgage foreclosures is not random. It has a clear spatiallogic, with evictions clearly concentrated in the most deprived neighborhoods, where the majorityof low-income households live.
2. The housing units most affected by evictions associated with mortgage foreclosures tend to bethose of the lowest quality (i.e., the smallest and cheapest types of housing).
3. Based on the two previous assumptions, the third–and main–hypothesis of the study is thatevictions due to mortgage foreclosures involving lower quality housing tend to be more spatiallyconcentrated than other evictions. Moreover, these evictions tend to be clustered in the mostdeprived neighborhoods, where the housing is of lower quality, but more affordable for thosewith less economic capacity.
The structure of this paper is as follows: After the introduction, the second section briefly reviewsthe existing literature on the Spanish mortgage crisis. This helps to contextualize our contribution tothis topic. The third section then explains the characteristics of the dataset and the study area andoutlines the methods applied to develop our spatial analysis approach. The fourth section presents themain results we obtain, and the fifth section concludes with a discussion of the main implications ofour findings and suggests possible directions for further analysis.

ISPRS Int. J. Geo-Inf. 2018, 7, 23 3 of 17
2. Background
The most extensive literature on mortgage crises and foreclosures relates to the US context. Severalcase studies have highlighted the existence of “neighborhood effects”, or the direct contribution thatforeclosures have made to urban deprivation and forced displacements [20,21]. Within this context,it is possible to observe links between the spatial concentration of foreclosures and falling propertyvalues at the neighborhood level [22–26]. Relationships have also been observed with increases incrime rates [27–31] and racial segregation [32,33]. Several studies have also focused on the negativeeffects that increases in the number of foreclosures have had on public health [34–37] and on howdifferent groups of local residents perceive the quality of life in their respective neighborhoods [38].
In the Spanish context, the growing literature on the mortgage crisis and foreclosures has exploredvarious related topics that include the economic, financial, and political dimensions of the problem [39,40];the political and historical roots that explain the extension of foreclosures and evictions [41]; some diagnosesof the resulting social impacts [13]; the emergence of social movements, activism, and political participation inresponse to the problem [42–46]; and the impact of these phenomena on public health [14,47]. At present,there is a relatively small, although growing, corpus of academic literature that analyses the Spanishmortgage crisis from a geographic perspective. A few studies [48,49] have analyzed the problemfor the whole country, using data from its 431 judicial districts (regional scale), while others [18,19]have studied the clustering patterns of properties accumulated by SAREB at a municipal scale for thewhole country. However, this scale is highly aggregated and does not allow a focus on the intra-urbanlevel, as most judicial districts are larger than cities. Nevertheless, a few recent studies [15,18,50–52]have used alternative data sources that permit an urban-scale approach for a selected group ofcities. This approach is based on spatial analysis methods based on the possibility of geolocatingforeclosed housing using these alternative sources. These studies coincide in pointing that the mostdeprived urban areas of cities are more affected regarding the concentration of evictions relatedto mortgage foreclosures. In the US context, there are also various studies based on geolocatedinformation about foreclosures using different sources. For instance, Immergluck and Smith studiedthe impact of subprime lending on neighborhood foreclosure levels in the city of Chicago [53]; Pfeifferand Molina examined the spatial logics of the resale of foreclosed properties in Southern CaliforniaLatino neighborhoods [54]; and Zhang and McCord conducted a spatial analysis on the impact ofhousing foreclosures on residential burglary in the city of Louisville [55]. Using a similar approach,the Anti-Eviction Mapping Project [56] presents an innovative way to collectively build a geolocateddataset of evictions in the San Francisco Bay area. The project has allowed the publication of morethan 100 maps in which spatial analysis and data help to support an activist movement of resistanceagainst displacement and gentrification.
To the best of the authors’ knowledge, to date, none of the studies on the urban-scale logicsof evictions and foreclosures using geolocated datasets have considered the characteristics of theforeclosed housing units as a central topic. Considering this context, our research seeks to add tothe existing literature by providing evidence of the spatial patterns of mortgage foreclosures andthe characteristics of the housing units affected by the repossession processes. This research is, thus,relevant for both deepening our knowledge of the subjacent logic of the uneven geography of themortgage crisis experienced in Catalan cities and providing clearer insights into the main characteristicsof the housing units that were accumulated by banks during this crisis.
3. Materials and Methods
3.1. Data
The Consejo General del Poder Judicial (General Council of the Judiciary, or CGPJ) and the InstitutoNacional de Estadística (National Institute of Statistics, or INE) are the only organizations that provideofficial data on the geographic distribution of mortgage foreclosures and evictions in Spain. Data fromCGPJ have been available to the general public since 2009 and are aggregated by judicial district,

ISPRS Int. J. Geo-Inf. 2018, 7, 23 4 of 17
of which there are 431 across the whole country, with almost all of these supra-municipal). INE haspublished aggregated data on the number of evictions and mortgage foreclosures for each of Spain’s51 provinces since 2014. Neither data source allows the disaggregation of data at the city, neighborhood,district, or census tract level. As a result, these data sources do not serve the requirements of thepresent study. This is a relevant deficit because evictions, like any other socioeconomic phenomenon,should be analyzed with respect to their territorial patterns. To overcome the limited scale of analysispermitted by the available official data, we use alternative (non-official), secondary data sources.More precisely, we use information about housing units in the hands of financial entities (housing unitsowned by banks, or HOBs) as a proxy for evictions associated with mortgage foreclosures. This stockcomprises housing acquired by banks via mortgage foreclosures that resulted in the eviction of theformer residents.
The rapid growth in the number of foreclosures in Spain as a result of the mortgage crisis meansthat banks have emerged as the largest property owners. As a result, Spain’s main banks havecreated specialized property subsidiaries to manage and sell their property assets. This strategy wasalso a consequence of banks’ objective to transfer toxic assets to other companies and belongs tothe wider financial strategy of sanitizing the Spanish banking sector. This, in itself, forms part of awider framework aimed at rescuing the Spanish banking sector, which is governed by the agreementcontained in the Memorandum of Understanding signed with the European Commission in 2012.These property subsidiaries use their respective web pages to promote and sell the housing stock thatbanks accumulated as a result of mortgage foreclosures. The web page of each property companycontains a list of all the housing stock available for sale. Moreover, an extensive list of individualadvertisements provides highly detailed information that includes the specific characteristics ofeach property.
We obtained the data used in this study by systematically collecting relevant informationfrom the websites of property subsidiaries belonging to the 17 most important financial entities inCatalonia (CaixaBank, Bankia, Banco Santander, Banc Sabadell, BBVA, CatalunyaCaixa, NovaGalicia,Banco Popular, Grupo BMN, Banesto, IberCaja, Barclay’s, Bankinter, CajaMar-CajaRural, Kutxa-Bank,Deutsche Bank, and BNP Paribas). We carried out this operation between February and May 2014.We identified 471 HOBs in the city of Tarragona and 594 in Terrassa. Following this procedure,we created a database in which each item (each HOB) was listed with information about its location(full postal address) and main characteristics (e.g., year of construction, surface area, number of rooms,market price, and the bank that owned it). We obtained these data from the individual advertisementsfor properties for sale via the property subsidiaries’ webpages. It is important to underline that thisinformation was not readily available from any other direct or indirect source. Moreover, while thedata were collected during four months in 2014, this does not imply that they cover only this period.The dataset includes all the housing units accumulated by these 17 banks (and on sale on the web)during the mortgage crisis through June 2014. Finally, using this source, we produced a geolocatedrecord of HOBs associated with the database of individual characteristics (see Figure 1 for the spatialdistribution of HOBs for each case study).
As we built this database using secondary sources, it is necessary to mention some of thelimitations of these sources. We must firstly underline the fact that the database includes housingoffered for both sale and rent by financial entities, as well as different types of housing: flats, apartments,and single-family detached houses. Secondly, it should be made clear that no new housing stockoffered for either sale or rent by financial entities was considered in this study. This is because suchhousing would not have been associated with eviction processes, as it would never have been occupied.New housing that was never sold would have ended up in the hands of the bank as a result of theinability of builders and promoters to return credit obtained from banks. This was a recurrent problemfollowing the bursting of the Spanish property bubble in 2007; when the property market collapsed,the number of property development companies that went bankrupt soared. Thus, used housingstock owned by banks corresponds to housing previously occupied by evicted families, while new

ISPRS Int. J. Geo-Inf. 2018, 7, 23 5 of 17
housing stock refers to blocks of empty housing, which have proliferated on urban peripheries asa consequence of the apparent overproduction of housing during the property boom. These twovery different scenarios had to be addressed in a disaggregated way. The current study is focused onused housing units from which former residents were evicted as a result of mortgage foreclosures.Accordingly, new empty housing units were excluded.
Finally, it is necessary to underline two of the particularities of the database. Firstly, our sourceprovided data focused on evictions due to mortgage foreclosures, but did not provide data aboutevictions resulting from the non-payment of rent. For this reason, the research objectives of this studyare centered on evictions specifically related to the mortgage crisis. Secondly, these data do not coverall the evictions associated with mortgage foreclosures that were carried out in a given city, nor do theyinclude all of those carried out within a specific period. Instead, as mentioned previously, they reflectthe total accumulated stock of foreclosed properties held by the main banks as of June 2014. Given allof these conditional factors, we were unable to determine the total number of mortgage foreclosuresand evictions in Tarragona and Terrassa from our source. However, we were able to identify the maincharacteristics of foreclosed housing and spatial distribution patterns based on a highly representativesample. Thus, our HOB sample corresponds to between 25% and 30% of the total number of mortgageforeclosures officially reported by the CGPJ during the 2008–2015 period in both cities.
In addition to this dataset, we used data from the 2011 Spanish population and housing census.This source was used to calculate the ratios of HOBs per 1000 inhabitants or 1000 housing unitsin the study area. These ratios allowed a comparative analysis between neighborhoods and cities.Moreover, census data were used to describe the socioeconomic profile of each study area (both wholecities and neighborhoods).
3.2. Study Area
We chose two medium-sized Catalan cities as case studies: Tarragona (population of 132,000in 2014) and Terrassa (population of 215,000 in 2014). The housing units were first identified,characterized, and geolocated using the previously mentioned sources. A total of 471 HOBs wererecorded in Tarragona and 594 in Terrassa. Their spatial distribution is shown in Figure 1.
ISPRS Int. J. Geo-Inf. 2018, 7, 23 5 of 17
These two very different scenarios had to be addressed in a disaggregated way. The current study is focused on used housing units from which former residents were evicted as a result of mortgage foreclosures. Accordingly, new empty housing units were excluded.
Finally, it is necessary to underline two of the particularities of the database. Firstly, our source provided data focused on evictions due to mortgage foreclosures, but did not provide data about evictions resulting from the non-payment of rent. For this reason, the research objectives of this study are centered on evictions specifically related to the mortgage crisis. Secondly, these data do not cover all the evictions associated with mortgage foreclosures that were carried out in a given city, nor do they include all of those carried out within a specific period. Instead, as mentioned previously, they reflect the total accumulated stock of foreclosed properties held by the main banks as of June 2014. Given all of these conditional factors, we were unable to determine the total number of mortgage foreclosures and evictions in Tarragona and Terrassa from our source. However, we were able to identify the main characteristics of foreclosed housing and spatial distribution patterns based on a highly representative sample. Thus, our HOB sample corresponds to between 25% and 30% of the total number of mortgage foreclosures officially reported by the CGPJ during the 2008–2015 period in both cities.
In addition to this dataset, we used data from the 2011 Spanish population and housing census. This source was used to calculate the ratios of HOBs per 1000 inhabitants or 1000 housing units in the study area. These ratios allowed a comparative analysis between neighborhoods and cities. Moreover, census data were used to describe the socioeconomic profile of each study area (both whole cities and neighborhoods).
3.2. Study Area
We chose two medium-sized Catalan cities as case studies: Tarragona (population of 132,000 in 2014) and Terrassa (population of 215,000 in 2014). The housing units were first identified, characterized, and geolocated using the previously mentioned sources. A total of 471 HOBs were recorded in Tarragona and 594 in Terrassa. Their spatial distribution is shown in Figure 1.
Figure 1. Study areas: HOBs (housing units owned by banks) in Tarragona and Terrassa. Source: own elaboration. Figure 1. Study areas: HOBs (housing units owned by banks) in Tarragona and Terrassa. Source:
own elaboration.

ISPRS Int. J. Geo-Inf. 2018, 7, 23 6 of 17
These selected case studies allowed us to analyze two different urban and territorial realities.Terrassa is one of the largest cities in the metropolitan area of Barcelona and is characterized by itscompact urban structure and high population density. In contrast, Tarragona is the capital of thesecond largest urban region in Catalonia and has a fragmented urban structure characterized by cleardiscontinuities between the city center and its peripheral neighborhoods.
The neighborhood was used as the basic territorial level at which all the relevant calculationsand derived spatial analysis were conducted. Based on local council definitions, Tarragona hasfive neighborhoods and Terrassa has six. These were used as the main units for our spatial analysis.As shown in Figure 2, based on these divisions we conducted a disaggregated analysis for thecity centers, their immediate surrounding areas, and (in the case of Tarragona) their peripheralneighborhoods. We then calculated the spatial patterns of HOBs at the infra-municipal scale.
ISPRS Int. J. Geo-Inf. 2018, 7, 23 6 of 17
These selected case studies allowed us to analyze two different urban and territorial realities. Terrassa is one of the largest cities in the metropolitan area of Barcelona and is characterized by its compact urban structure and high population density. In contrast, Tarragona is the capital of the second largest urban region in Catalonia and has a fragmented urban structure characterized by clear discontinuities between the city center and its peripheral neighborhoods.
The neighborhood was used as the basic territorial level at which all the relevant calculations and derived spatial analysis were conducted. Based on local council definitions, Tarragona has five neighborhoods and Terrassa has six. These were used as the main units for our spatial analysis. As shown in Figure 2, based on these divisions we conducted a disaggregated analysis for the city centers, their immediate surrounding areas, and (in the case of Tarragona) their peripheral neighborhoods. We then calculated the spatial patterns of HOBs at the infra-municipal scale.
Figure 2. Neighborhood statistical units in Tarragona and Terrassa. Source: own elaboration.
3.3. Methods
We used a point pattern approach to check whether evictions resulting from foreclosures tend to cluster in certain parts of the cities, or—on the contrary—whether they are randomly spread across the whole urban area [57]. Point pattern analyses have been applied to a large variety of events, including the location of diseases [58], the location of particular tree species [59], property prices [60], and the location of companies [61]. They may also be used for the analysis of any other georeferenced (point) event. To perform the point pattern analysis, we first geolocated and identified each HOB as a single point. More specifically, we were interested in analyzing whether there was any evidence of clustering in the spatial pattern of evictions. Our assumption is that if these distances between HOBs were shorter than those predicted for a random distribution (i.e., if all the evictions were randomly distributed across the whole city), then these evictions could be regarded as clustered. To do this, we carried out a Nearest-Neighbor Index (NNI) analysis and computed the Ripley’s K(d) function.
The NNI compares the mean value of the observed distance between each reference point (in this case, each eviction site) and its nearest neighbor with the expected mean distance assuming a random distribution. It can be expressed as: = (1)
Here, the observed average distance and expected average distance can be computed as follows:
Figure 2. Neighborhood statistical units in Tarragona and Terrassa. Source: own elaboration.
3.3. Methods
We used a point pattern approach to check whether evictions resulting from foreclosures tend tocluster in certain parts of the cities, or—on the contrary—whether they are randomly spread across thewhole urban area [57]. Point pattern analyses have been applied to a large variety of events, includingthe location of diseases [58], the location of particular tree species [59], property prices [60], and thelocation of companies [61]. They may also be used for the analysis of any other georeferenced (point)event. To perform the point pattern analysis, we first geolocated and identified each HOB as a singlepoint. More specifically, we were interested in analyzing whether there was any evidence of clusteringin the spatial pattern of evictions. Our assumption is that if these distances between HOBs were shorterthan those predicted for a random distribution (i.e., if all the evictions were randomly distributedacross the whole city), then these evictions could be regarded as clustered. To do this, we carried out aNearest-Neighbor Index (NNI) analysis and computed the Ripley’s K(d) function.
The NNI compares the mean value of the observed distance between each reference point (in thiscase, each eviction site) and its nearest neighbor with the expected mean distance assuming a randomdistribution. It can be expressed as:
NNI =Observed Average DistanceExpected Average Distance
(1)

ISPRS Int. J. Geo-Inf. 2018, 7, 23 7 of 17
Here, the observed average distance and expected average distance can be computed as follows:
Observed Average Distance = ∑ni=1 dn
(2)
Expected Average Distance = 0.5
√An
(3)
where d is the distance, n is the number of neighboring links, and A is the total area of the regionconsidered. It is important to note that this index is sensitive to the definition of the area of study. It is,thus, normal to expect larger areas to be associated with longer distances. Nevertheless, we can (at leastpartially) control for this by computing A as the minimum area that would include all the existingpoints (i.e., those representing evictions due to foreclosures). The same procedure was followed usingboth NNI and Ripley’s K.
Accordingly, NNI values close to 0 indicate a clustered pattern (as the observed distances areshorter than expected and HOBs are closer to each other), values close to 1 indicate a random pattern(as the observed distances are quite similar to those expected) and values of around 2.149 indicate adispersed pattern (as the observed distances are longer than expected).
Ripley’s K function [62] computes the density of any set of points (in this case HOBs) for aparticular radius (i.e., distance) around each reference point and is used to establish whether there isevidence of clustering within a certain distance. More specifically, distance radii are calculated aroundevery point, with K(d) being the mean density of points for each radius distance (d) divided by themean density of points (n) in the whole area (a): n/a. The interpretation of Ripley’s K is quite similarto that of NNI as the expected random values are compared with the observed values. If the observedvalues (i.e., the density of points) exceed the expected values, there is a clustered pattern, whereas ifthe observed values are lower than the expected values, the result is a dispersed pattern.
It should be noted that both NNI and Ripley’s K help avoid the modifiable areal unit problem(MAUP) [63]. As these functions treat space as continuous, without constraining data withinadministrative boundaries, they avoid statistical bias caused by using statistical data aggregatedby territorial units. Their use is not, therefore, subject to the typical constraints associated with spatialaggregation. Even so, we did not neglect the administrative units as we also used data on evictionswithin the administrative boundaries of Tarragona and Terrassa. The methodology selected does not,therefore, represent a source of potential bias in our results.
Once we identified global clustering patterns at the point level, we used the local version of theMoran’s I calculation to identify the spatial autocorrelation of HOBs [64]. This is defined as:
Ii =(Xi − µ)
m0
N
∑j=1
(Xj − µ
)(4)
where N is the number of observations, i and j are spatial units, µ is the average of variable and:
m0 = ∑Ni−1 (Xi − µ)2/n (5)
Using Local Indicators of Spatial Association (LISA) maps, the Local Moran’s I indicator makesit possible to identify areas in which high and low values of a determined variable are concentrated.It also makes it possible to discard elements that are not statistically significant [65]. We used theaggregation of HOBs by census tracts weighted for the total number of housing units in each censustract as the reference variable to establish the number of HOBs per 1000 housing units for each censustract in both cities. After defining the HOB clusters, the bivariate version of the Local Moran’s I allowedus to determine the spatial correlation of the HOB distribution with different socioeconomic indicatorsat the census tract level. The unemployment rate and the percentage of the resident population without

ISPRS Int. J. Geo-Inf. 2018, 7, 23 8 of 17
primary education (data from the 2011 Spanish population census) were used as indicators of thesocioeconomic vulnerability of each area.
With respect to the question of whether the results obtained from the three indicators can beinterpreted together, it is important to note that while NNI considers only location of the nearestneighbor, Ripley’s K function computes information for all neighbors. In the case of Moran’s I, we usedthe different levels of point concentration by census tract and then census tracts as the unit of clusteringanalysis. These methods do not approach clustering in the same way and, thus, when combined,they can be used to proxy neighboring links among different points.
4. Results
4.1. Spatial Clustering of Foreclosures
The spatial analysis of evictions due to mortgage foreclosures in Terrassa and Tarragona revealedevidence of a non-negligible clustered pattern: HOBs tend to be concentrated in certain neighborhoodsof both cities, with this being particularly evident in Tarragona. More precisely, the NNI value for thewhole city of Tarragona is 0.211, while the value for Terrassa is 0.433. However, these values clearlyhide a considerable degree of intra-urban diversity. This asymmetry is particularly evident in the caseof Tarragona, which is more spatially heterogeneous than Terrassa [66].
To control for this heterogeneity, we decided to compute the NNI for several internal divisionswithin the two cities. To do this, we focused on the neighborhoods in each municipality (five inTarragona and six in Terrassa).
As shown in Table 1, the NNI value for the whole city of Tarragona is quite small (0.211),suggesting pronounced clustering. However, this value may be biased as it considers the whole of thearea in which evictions were reported, and yet one of the main characteristics of the urban layout ofTarragona is the spatial discontinuity of its neighborhoods (see Figure 1), some of which are denselypopulated (and consequently have a potentially higher number of evictions) while others (mainlythose on the east side of the city, such as Llevant) have significantly lower residential densities.
Table 1. Nearest-Neighbor Index (NNI) for neighborhoods in Tarragona.
Centre SantSalvador
St. Pere iSt. Pau Llevant Barris
PonentTarragona
(Total)
Observed average distance (m) 85 38 43 411 33 53Expected average distance (m) 115 80 111 755 69 252Nearest-Neighbor Index (NNI) 0.735 0.471 0.387 0.545 0.479 0.211
N 71 58 49 13 255 446Z-value −4.275 −7.707 −8.203 −3.137 −15.927 −31.879
An intra-urban analysis for Tarragona revealed a heterogeneous pattern for the neighborhoodsconsidered in this analysis. Suburban neighborhoods such as Barris de Ponent, Sant Salvador, and SantPere i Sant Pau were found to have lower values (0.479, 0.471 and 0.387, respectively) while those forwealthier, low-density (Llevant, 0.545), and downtown (Centre, 0.735) neighborhoods are clearly higher.These results show that HOBs tend to cluster in a relatively small number of areas within the mostperipheral neighborhoods, where urban sprawl has created large areas with a low-income population.
Table 2 shows the same analysis for the city of Terrassa and its neighborhoods. Here, the spatialdistribution of HOBs bears some similarity with that in Tarragona, with the more densely-populatedcentral neighborhoods exhibiting higher NNI values and the more peripheral ones having lower ones.The two cities have similar patterns in terms of the spatial distribution of their respective evictionsdespite differences in their urban structures: Terrassa is very compact, and its housing is distributedaround a rather densely-populated central area.

ISPRS Int. J. Geo-Inf. 2018, 7, 23 9 of 17
Table 2. Nearest-Neighbor Index (NNI) for neighborhoods in Terrassa.
Centre Llevant Sud Ponent Nord-Oest Nord-Est Terrassa (Total)
Observed average distance (m) 89 39 62 68 384 56 59Expected average distance (m) 127 66 179 139 145 84 136Nearest-Neighbor Index (NNI) 0.698 0.599 0.344 0.489 0.583 0.665 0.433
N 52 118 113 94 63 144 584Z-value −4.165 −8.326 −13.336 −9.474 −6.328 −7.675 −26.233
City-specific factors apart, in both cases, evictions due to foreclosures were clustered in the mostdeprived neighborhoods. Tables 3 and 4 summarize the distribution of HOBs by neighborhoods ineach city in relative terms (per 1000 inhabitants and per 1000 housing units in each neighborhood).These show how the neighborhoods with the highest ratios of HOBs per 1000 inhabitants or housingunits are also the ones with the worst socioeconomic indicators (i.e., Ponent and Sant Salvador inTarragona and Llevant, Sud, and Nord-Est in Terrassa). This result corroborates previous empiricalevidence for the same areas presented by [50] and the findings of [51,52] for similar analyses carriedout in Lleida and Palma de Mallorca. In these cases, an inverse relationship was found between thesocial status of the neighborhood and the relative concentration of housing evictions. Our data alsoallowed us to correlate these two issues with the characteristics of the housing from which peoplewere evicted. Tables 3 and 4 show that the neighborhoods with the highest ratios of HOBs and theworst socioeconomic profiles are those that also concentrated the HOBs with the smallest surface areasand lowest market prices.
Table 3. HOB (housing units owned by banks) distribution by neighborhood according to theircharacteristics and socioeconomic profiles (Tarragona).
HOB Ratio HOB Characteristics Residents’ Socioeconomic Profile
HOBs/1000Inhab.
HOBs/1000Housing
Units
MeanSurface
(m2)
MeanPrice (€)
Age(Years)
%withoutStudies
%Foreign-Born
Unemploy.Rate
Ponent 6.7 17.0 77.8 75,680.4 39.4 10.2 22.5 19.4Centre 1.3 2.3 79.1 104,345.0 60.0 5.6 13.1 11.2Llevant 0.9 1.5 148.6 222,604.3 31.3 1.4 13.9 10.5
Sant Pere iSant Pau 2.9 6.4 71.3 89,065.9 41.3 6.7 21.0 16.7
Sant Salvador 8.2 17.4 71.9 66,131.1 43.2 6.0 32.0 15.5Tarragona(weightedaverage)
3.4 6.8 78.5 84,767.0 42.7 6.6 17.9 14.2
Source: own elaboration. Data for the socioeconomic profiles and that used to elaborate the HOB ratios (housingunits and inhabitants by neighborhood) obtained from the 2011 census on population and housing.
Table 4. HOB distribution by neighborhood according to their characteristics and socioeconomicprofiles (Terrassa).
HOB Ratio HOB Characteristics Residents’ Socioeconomic Profile
HOBs/1000Inhab.
HOBs/1000Housing
Units
MeanSurface
(m2)
MeanPrice (€)
Age(Years)
%withoutStudies
%Foreign-Born
Unemploy.Rate
Centre 1.4 3.1 81.2 112,909.5 34.9 5.2 12.8 11.4Llevant 6.1 12.6 77.6 94,655.2 43.1 12.6 26.8 18.1
Sud 3.9 7.5 79.9 107,924.6 39.1 8.7 11.4 16.2Ponent 2.3 4.6 84.8 117,758.3 38.7 6.7 12.5 13.6
Nord-Oest 1.4 3.0 79.2 117,041.6 38.1 6.8 11.0 13.9Nord-Est 3.5 7.7 79.1 107,059.6 39.0 10.1 15.3 18.8Terrassa
(weightedaverage)
2.7 5.7 80.1 109,540.9 39.3 7.9 13.9 15.1
Source: own elaboration. Data of the socioeconomic profiles and that used to elaborate the HOB ratios (housingunits and inhabitants by neighborhood) obtained from the 2011 census of population and housing.

ISPRS Int. J. Geo-Inf. 2018, 7, 23 10 of 17
The ratios of HOBs per 1000 inhabitants in the most vulnerable neighborhoods of Tarragona andTerrassa were 3.9 and 4.0, respectively, while the same ratios for the whole cities were 3.4 and 2.7,respectively. A similar relationship can be observed for the ratios of HOBs per 1000 housing units: 8.1and 8.4, respectively, in the most vulnerable neighborhoods of Tarragona and Terrassa, and 6.8 and 5.7,respectively, for the whole cities.
Figure 3 shows the neighborhoods in each city defined as “most vulnerable” by the “Atlas of UrbanVulnerability” [67]. This publication defines the most vulnerable urban areas in Spanish cities largerthan 50,000 inhabitants. The definitions are based on data related to their socioeconomic profiles andhousing characteristics, which were obtained from the 2001 and 2011 national censuses. In Tarragonaand Terrassa, the neighborhoods defined as most vulnerable respectively contain 72.4% and 48.9% ofall HOBs in each city. Moreover, this figure shows the distribution of clusters of high concentrationsof HOBs in each city based on the Local Moran’s Autocorrelation Indicator (i.e., High-High). All theclusters identified are located within the vulnerable neighborhoods previously defined. The clusters oflow concentrations of HOBs are located outside these deprived areas in typical medium to high classneighborhoods of each city.
ISPRS Int. J. Geo-Inf. 2018, 7, 23 10 of 17
Figure 3 shows the neighborhoods in each city defined as “most vulnerable” by the “Atlas of Urban Vulnerability” [67]. This publication defines the most vulnerable urban areas in Spanish cities larger than 50,000 inhabitants. The definitions are based on data related to their socioeconomic profiles and housing characteristics, which were obtained from the 2001 and 2011 national censuses. In Tarragona and Terrassa, the neighborhoods defined as most vulnerable respectively contain 72.4% and 48.9% of all HOBs in each city. Moreover, this figure shows the distribution of clusters of high concentrations of HOBs in each city based on the Local Moran’s Autocorrelation Indicator (i.e., High-High). All the clusters identified are located within the vulnerable neighborhoods previously defined. The clusters of low concentrations of HOBs are located outside these deprived areas in typical medium to high class neighborhoods of each city.
Figure 3. Vulnerable neighborhoods and Univariate Moran’s I LISA (Local Indicators of Spatial Association) cluster map for HOB/1000 housing units for census tracts. Source: own elaboration.
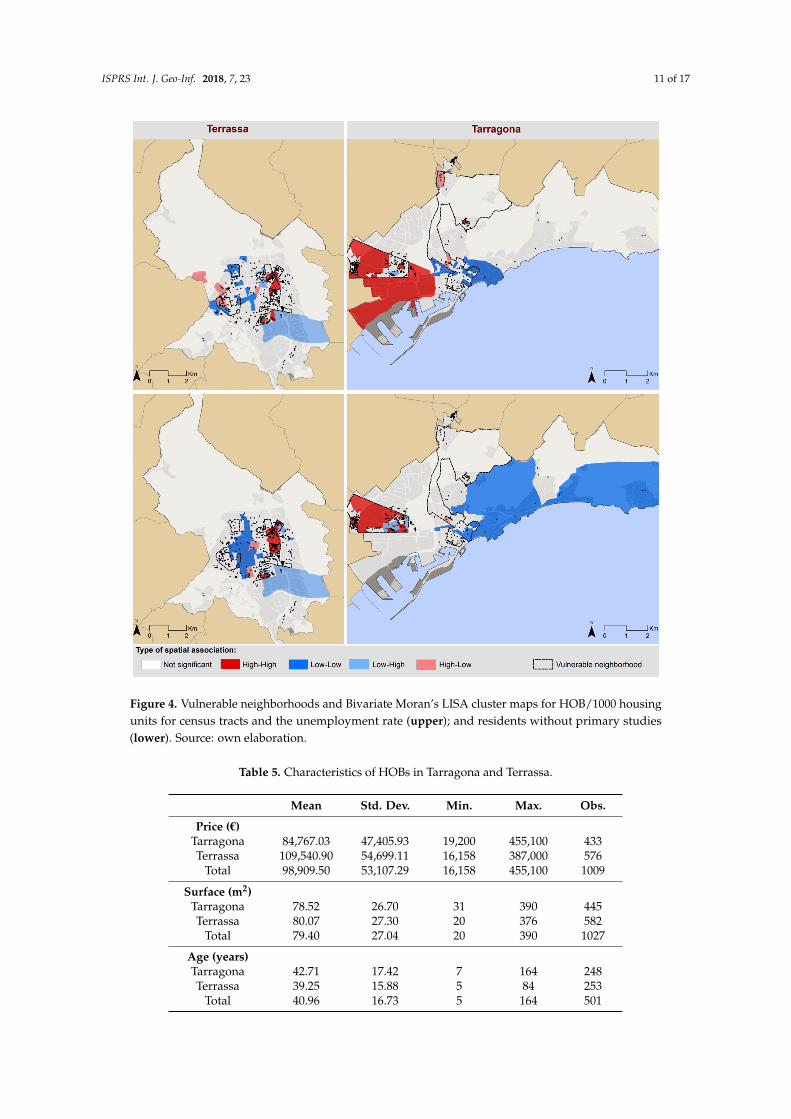
Figure 4 shows Bivariate Moran's I LISA cluster maps for HOBs per 1000 housing units and the unemployment rate and residents without primary studies by census tract for each city. This demonstrates the spatial correlation of HOB clustering and the socioeconomic vulnerability of neighborhoods. As with the univariate Moran’s LISA cluster map, the High-High clusters are concentrated within the areas defined as most vulnerable for each city.
4.2. Characteristics of Foreclosed Housing Units
Although intra-urban analysis generally provides the best explanation for the clustering patterns of HOBs, it is also necessary to take into account the specific characteristics of the housing units involved in these evictions. This is because it is reasonable to assume that the probability of eviction is in some way related to these characteristics (i.e., they are of great importance for lower quality housing units). We, thus, analyzed the respective roles played by price, surface area, and age of housing units. Table 5 presents descriptive statistics related to these characteristics for both cities and for the whole sample.
Figure 3. Vulnerable neighborhoods and Univariate Moran’s I LISA (Local Indicators of SpatialAssociation) cluster map for HOB/1000 housing units for census tracts. Source: own elaboration.
Figure 4 shows Bivariate Moran's I LISA cluster maps for HOBs per 1000 housing unitsand the unemployment rate and residents without primary studies by census tract for each city.This demonstrates the spatial correlation of HOB clustering and the socioeconomic vulnerabilityof neighborhoods. As with the univariate Moran’s LISA cluster map, the High-High clusters areconcentrated within the areas defined as most vulnerable for each city.
4.2. Characteristics of Foreclosed Housing Units
Although intra-urban analysis generally provides the best explanation for the clustering patternsof HOBs, it is also necessary to take into account the specific characteristics of the housing unitsinvolved in these evictions. This is because it is reasonable to assume that the probability of eviction isin some way related to these characteristics (i.e., they are of great importance for lower quality housingunits). We, thus, analyzed the respective roles played by price, surface area, and age of housingunits. Table 5 presents descriptive statistics related to these characteristics for both cities and for thewhole sample.
ISPRS Int. J. Geo-Inf. 2018, 7, 23 11 of 17
ISPRS Int. J. Geo-Inf. 2018, 7, 23 11 of 17
Figure 4. Vulnerable neighborhoods and Bivariate Moran’s LISA cluster maps for HOB/1000 housing units for census tracts and the unemployment rate (upper); and residents without primary studies (lower). Source: own elaboration.
Table 5. Characteristics of HOBs in Tarragona and Terrassa.
Mean Std. Dev. Min. Max. Obs. Price (€)
Tarragona 84,767.03 47,405.93 19,200 455,100 433 Terrassa 109,540.90 54,699.11 16,158 387,000 576
Total 98,909.50 53,107.29 16,158 455,100 1009 Surface (m2) Tarragona 78.52 26.70 31 390 445 Terrassa 80.07 27.30 20 376 582
Total 79.40 27.04 20 390 1027 Age (years) Tarragona 42.71 17.42 7 164 248 Terrassa 39.25 15.88 5 84 253
Total 40.96 16.73 5 164 501
Figure 4. Vulnerable neighborhoods and Bivariate Moran’s LISA cluster maps for HOB/1000 housingunits for census tracts and the unemployment rate (upper); and residents without primary studies(lower). Source: own elaboration.
Table 5. Characteristics of HOBs in Tarragona and Terrassa.
Mean Std. Dev. Min. Max. Obs.
Price (€)Tarragona 84,767.03 47,405.93 19,200 455,100 433Terrassa 109,540.90 54,699.11 16,158 387,000 576
Total 98,909.50 53,107.29 16,158 455,100 1009
Surface (m2)Tarragona 78.52 26.70 31 390 445Terrassa 80.07 27.30 20 376 582
Total 79.40 27.04 20 390 1027
Age (years)Tarragona 42.71 17.42 7 164 248Terrassa 39.25 15.88 5 84 253
Total 40.96 16.73 5 164 501

ISPRS Int. J. Geo-Inf. 2018, 7, 23 12 of 17
As we can see from Table 5, the profiles of the housing units from which people were evictedin Tarragona and Terrassa are quite similar in terms of their surface area (slightly larger in Terrassa)and age (slightly newer in Terrassa). However, the date of the construction of the housing stock wasconsiderably longer in Tarragona, which is coherent for a city whose central area mainly dates fromthe 19th century (see Figure 5).
ISPRS Int. J. Geo-Inf. 2018, 7, 23 12 of 17
As we can see from Table 5, the profiles of the housing units from which people were evicted in Tarragona and Terrassa are quite similar in terms of their surface area (slightly larger in Terrassa) and age (slightly newer in Terrassa). However, the date of the construction of the housing stock was considerably longer in Tarragona, which is coherent for a city whose central area mainly dates from the 19th century (see Figure 5).
Figure 5. Age of housing units subject to eviction due to foreclosure in Tarragona (left) and Terrassa (right). Source: own elaboration.
Nevertheless, there are noticeable differences in property prices (higher in Terrassa) as the monocentric price structure of Catalonia tends to make housing located near the metropolitan area of Barcelona (Terrassa) more expensive than that lying further afield (Tarragona).
In view of the previously mentioned circumstances, we computed NNI according to the characteristics of the housing units. To do this, we grouped the housing units according to whether they are above or below the mean size and mean price.
The results presented in Table 6 are quite robust for both Tarragona and Terrassa. They show that both size and price matter, as evictions from poor quality (cheaper and smaller) housing tend to be more closely clustered than evictions from better quality (larger and more expensive) housing. These results corroborate our previous assumptions about links between the clustering of evictions due to foreclosures and lower quality housing. The clustering of evictions is, thus, not only concentrated in low-income neighborhoods, but also in those with low-quality housing, which magnifies the negative effects. Moreover, these two phenomena are spatially associated. Along these lines, Table 7 shows how the most deprived neighborhoods in each city have the largest concentrations of HOBs, with sizes and market values significantly less than those in the rest of the city.
Table 6. Nearest-Neighbor Index (NNI) related to mean surface area and mean price.
Tarragona Terrassa
Mean Surface Mean Price Mean Surface Mean PriceOver Below Over Below Over Below Over Below
Observed average distance (m)
0.873 0.592 0.972 0.399 1.045 0.552 1.078 0.644
Expected average distance (m)
3.462 2.510 3.551 1.887 1.925 1.349 1.888 1.393
Nearest-Neighbor Index (NNI)
0.252 0.236 0.274 0.211 0.543 0.409 0.571 0.462
N 188 258 179 267 226 358 245 339 Z-value −19.616 −23.486 −18.590 −24.653 −13.141 −21.381 −12.847 −18.937
Figure 5. Age of housing units subject to eviction due to foreclosure in Tarragona (left) and Terrassa(right). Source: own elaboration.
Nevertheless, there are noticeable differences in property prices (higher in Terrassa) as themonocentric price structure of Catalonia tends to make housing located near the metropolitan area ofBarcelona (Terrassa) more expensive than that lying further afield (Tarragona).
In view of the previously mentioned circumstances, we computed NNI according to thecharacteristics of the housing units. To do this, we grouped the housing units according to whetherthey are above or below the mean size and mean price.
The results presented in Table 6 are quite robust for both Tarragona and Terrassa. They showthat both size and price matter, as evictions from poor quality (cheaper and smaller) housing tendto be more closely clustered than evictions from better quality (larger and more expensive) housing.These results corroborate our previous assumptions about links between the clustering of evictions dueto foreclosures and lower quality housing. The clustering of evictions is, thus, not only concentrated inlow-income neighborhoods, but also in those with low-quality housing, which magnifies the negativeeffects. Moreover, these two phenomena are spatially associated. Along these lines, Table 7 shows howthe most deprived neighborhoods in each city have the largest concentrations of HOBs, with sizes andmarket values significantly less than those in the rest of the city.
Table 6. Nearest-Neighbor Index (NNI) related to mean surface area and mean price.
Tarragona Terrassa
Mean Surface Mean Price Mean Surface Mean Price
Over Below Over Below Over Below Over Below
Observed averagedistance (m) 0.873 0.592 0.972 0.399 1.045 0.552 1.078 0.644
Expected averagedistance (m) 3.462 2.510 3.551 1.887 1.925 1.349 1.888 1.393
Nearest-Neighbor Index(NNI) 0.252 0.236 0.274 0.211 0.543 0.409 0.571 0.462
N 188 258 179 267 226 358 245 339Z-value −19.616 −23.486 −18.590 −24.653 −13.141 −21.381 −12.847 −18.937

ISPRS Int. J. Geo-Inf. 2018, 7, 23 13 of 17
Table 7. Mean size and market price of HOBs in the most vulnerable neighborhoods and in the rest ofthe city.
Tarragona Terrassa
Size (m2) Price (€) Size (m2) Price (€)
Most vulnerable neighborhoods 76.6 81,868.2 78.6 102,811.2Rest of the city 83.4 92,416.0 81.5 116,086.3City average 78.5 84,767.0 80.1 109,540.9
Apart from the previously mentioned considerations, it is obvious that the NNI presents certainspecific (technical) features that must be taken into account when decoding results. One of theseis the fact that it only computes the mean distance to the nearest neighbor, but does not take intoaccount the spatial distribution of the rest of the neighbors. Another important feature is that allthe points identified are considered equally, regardless of the size of the event that they represent(i.e., all evictions are given the same importance). Finally, it should be noted that no potential eventshave been computed here, as we exclusively focus on reported events (i.e., evictions). In this sense,it can be argued that the probability of evictions occurring is not constant across the whole city,particularly as there are some areas in which there is a potentially greater risk of eviction than in others,resulting from greater population density or more housing units. However, empirical evidence doesnot seem to support this: the central area of Tarragona (Centre) is a densely populated neighborhoodand has the highest NNI in the whole city. In fact, its NNI score is even higher than that of Llevant,where most of housing corresponds to single-family housing.
Finally, the Ripley’s K results (Figure 6) mainly confirm previous findings related to the clusteringof evictions obtained using the NNI for both Tarragona and Terrassa. Concretely, we have shownthat, by using a general approach, a tendency towards clustering is also revealed when consideringdifferent band distances.
Apart from specific considerations related to the urban structures of Tarragona and Terrassa thatresulted in slightly different K values (e.g., urban sprawl is considerably greater in Tarragona than inTerrassa), our results show that there is a significant tendency for evictions to be clustered. The densitiesof observed evictions are thus greater than those expected from a random distribution pattern.
Overall, no matter the methodology (i.e., univariate or bivariate Moran’s LISA, NNI andRipley’s K) our results indicate a clear pattern of concentration of evictions in most deprivedneighborhoods of both Tarragona and Terrassa. Obviously, using different techniques allows tohighlight locational specificities of evictions as, for instance, their geographical position inside eachurban area, or the spatial clustering calculated across a range of different distances, but the mainconclusions remain unaltered.
ISPRS Int. J. Geo-Inf. 2018, 7, 23 13 of 17
Table 7. Mean size and market price of HOBs in the most vulnerable neighborhoods and in the rest of the city.
Tarragona Terrassa
Size (m2) Price (€) Size (m2) Price (€) Most vulnerable neighborhoods 76.6 81,868.2 78.6 102,811.2
Rest of the city 83.4 92,416.0 81.5 116,086.3 City average 78.5 84,767.0 80.1 109,540.9
Apart from the previously mentioned considerations, it is obvious that the NNI presents certain specific (technical) features that must be taken into account when decoding results. One of these is the fact that it only computes the mean distance to the nearest neighbor, but does not take into account the spatial distribution of the rest of the neighbors. Another important feature is that all the points identified are considered equally, regardless of the size of the event that they represent (i.e., all evictions are given the same importance). Finally, it should be noted that no potential events have been computed here, as we exclusively focus on reported events (i.e., evictions). In this sense, it can be argued that the probability of evictions occurring is not constant across the whole city, particularly as there are some areas in which there is a potentially greater risk of eviction than in others, resulting from greater population density or more housing units. However, empirical evidence does not seem to support this: the central area of Tarragona (Centre) is a densely populated neighborhood and has the highest NNI in the whole city. In fact, its NNI score is even higher than that of Llevant, where most of housing corresponds to single-family housing.
Finally, the Ripley’s K results (Figure 6) mainly confirm previous findings related to the clustering of evictions obtained using the NNI for both Tarragona and Terrassa. Concretely, we have shown that, by using a general approach, a tendency towards clustering is also revealed when considering different band distances.
Apart from specific considerations related to the urban structures of Tarragona and Terrassa that resulted in slightly different K values (e.g., urban sprawl is considerably greater in Tarragona than in Terrassa), our results show that there is a significant tendency for evictions to be clustered. The densities of observed evictions are thus greater than those expected from a random distribution pattern.
Overall, no matter the methodology (i.e., univariate or bivariate Moran’s LISA, NNI and Ripley’s K) our results indicate a clear pattern of concentration of evictions in most deprived neighborhoods of both Tarragona and Terrassa. Obviously, using different techniques allows to highlight locational specificities of evictions as, for instance, their geographical position inside each urban area, or the spatial clustering calculated across a range of different distances, but the main conclusions remain unaltered.
Figure 6. Measure of spatial clustering for a range of distances in Tarragona (left) and Terrassa (right). Source: own elaboration.
Figure 6. Measure of spatial clustering for a range of distances in Tarragona (left) and Terrassa (right).Source: own elaboration.

ISPRS Int. J. Geo-Inf. 2018, 7, 23 14 of 17
5. Conclusions
The study of evictions due to mortgage foreclosures via the proxy of HOBs provides a clear viewof the uneven impact that the mortgage crisis has had on urban areas. This paper focuses on twomedium-sized Catalan cities (i.e., Tarragona and Terrassa) in which HOBs seem to follow quite specificlocation patterns.
This is the first study in the Catalan and Spanish contexts to analyze the spatial patternsof evictions due to foreclosures and incorporate the characteristics of the foreclosed properties.Our unique dataset allowed us not only to study the spatial logic of this phenomenon and analyze itsdistribution patterns according to the socioeconomic profiles of the different neighborhoods, but alsoto explain clustering patterns using the affected housing units. In other words, this is the first work inwhich the urban geography of the mortgage crisis is studied using the characteristics of the foreclosedproperties as an explanatory variable.
Considering the more concrete details, a number of interesting findings were obtained. Firstly,the results revealed a clear clustering of evictions in the most deprived neighborhoods. This implies anadditional problem for those neighborhoods that have traditionally suffered the most from importantsocioeconomic challenges and urban deficits. This type of spatial concentration also results in negativeexternalities concentrated in relatively small deprived areas. Secondly, the results show a clear typologyof evictions due to mortgage foreclosures, with a particularly strong pattern of clustering associatedwith the smallest and cheapest forms of housing. In other words, there is less clustering of evictionsinvolving properties with larger surface areas and higher values and there is greater clustering ofevictions involving properties with smaller surface areas and lower values.
Links between mortgage foreclosures and socioeconomic structures have already beendemonstrated [15,50,52] and show that the mortgage crisis has mainly affected low-income familiesthat had previously purchased low-quality housing. As a result, the type of housing most affected bymortgage foreclosures tends to be of the lowest quality. If we combine this finding with our empiricalresults, which show higher levels of clustering of evictions of lower quality housing, it is evident thatthe most negative effects of the mortgage crisis have particularly affected low-income social groupsand hit the most deprived neighborhoods.
The main contribution made by this paper is to empirically demonstrate that, in the cases studied,evictions caused by mortgage foreclosures exhibit neither a homogenous nor a random distributionwithin urban areas; instead, they are mainly concentrated in the areas with the poorest quality housingand clustered in the most deprived neighborhoods, where more affordable housing is located. This,in turn, increases the vulnerability of the people and areas affected and magnifies any negative effects.It, thus, follows that these cases provide useful examples of how the mortgage crisis has exacerbatedexisting inequalities between neighborhoods of the same city. According to previous results, the threehypotheses of this paper (i.e., spatial distribution of evictions due to mortgage foreclosures is notrandom, housing units most affected by evictions linked with mortgage foreclosures are those of thelowest quality, and evictions due to mortgage foreclosures involving low quality housing are the mostspatially concentrated) have been validated.
The main limitation of our study is that the empirical evidence that provides is based on a sampleof foreclosed housing units for only two cities, but the construction of a comprehensive framework forthe study of the uneven geography of the mortgage crisis in Catalonia, and its implications for cities,needs to be built using data for most of the municipalities of the region. This is a research line thatshould be developed in future studies.
Our findings also demonstrate that the housing stock accumulated by banks as a result of themortgage crisis has a clearly predominant typology and spatial pattern. This is relevant because,as a result of the massive proliferation of repossessions, banks have now become the largest propertyowners and, consequently, the key actors in the post-crash housing market. The implications that thisphenomenon will have for future national and local housing policies offer significant areas in whichto conduct future research. Within this context, the identification and characterization of the spatial

ISPRS Int. J. Geo-Inf. 2018, 7, 23 15 of 17
distribution of overall properties accumulated by banks in Catalonia is another research objective to beaddressed in future works.
Acknowledgments: This article has benefited from funding from CS02014-51785-R, ECO2013-41310-R,ECO2014-55553-P, the “Xarxa de Referència d’R+D+I en Economia i Polítiques Públiques” and the researchprogram SGR (2014 SGR 299 and 2014 SGR 1270). We are grateful for the comments received at the XLIIInternational Conference on Regional Science (Universidade de Santiago de Compostela), the 19th INFER AnnualConference (Université de Bordeaux), and at workshop Asimmetrie in Europe (Università degli Studi Gabrieled’Annunzio, Pescara). We would also like to thank the anonymous referees for their useful and constructivecomments that helped us to improve the paper.
Author Contributions: Both authors contributed equally to this work.
Conflicts of Interest: The authors declare no conflict of interest.
References
1. Aalbers, M. The financialization of home and the mortgage market crisis. Compet. Chang. 2008, 12, 148–166.[CrossRef]
2. Aalbers, M. Geographies of the financial crisis. Area 2009, 41, 34–42. [CrossRef]3. Gotham, K.F. Creating liquidity out of spatial fixity: The secondary circuit of capital and the subprime
mortgage crisis. Int. J. Urban Reg. Res. 2009, 32, 355–371. [CrossRef]4. Rolnik, R. Late neoliberalism: The financialization of homeownership and housing rights. Int. J. Urban Reg. Res.
2013, 37, 1058–1066. [CrossRef]5. Foster, J.B.; Magdoff, F. The Great Financial Crisis: Causes and Consequences; New York University Press:
New York, NY, USA, 2009.6. Stephens, M. Mortgage market deregulation and its consequences. Hous. Stud. 2007, 22, 201–220. [CrossRef]7. Gutiérrez, A.; Delclòs, X. ¿Hipertrofia inmobiliaria? Análisis de las pautas territoriales del boom e
implicaciones del estallido de la burbuja en Cataluña. Cuad. Geogr. 2015, 54, 283–306.8. Attom Data Solutions. U.S. Foreclosure Activity Drops to 10-Year Low in 2016. Available online:
https://www.attomdata.com/news/heat-maps/2016-year-end-u-s-foreclosure-market-report/ (accessed on1 December 2017).
9. Consejo General del Poder Judicial. Datos Sobre el Efecto de Las Crisis en Los Órganos Judiciales.Available online: http://www.poderjudicial.es/cgpj/es/Temas/Estadistica-Judicial/Estudios-e-Informes/Efecto-de-la-Crisis-en-los-organos-judiciales/ (accessed on 1 December 2017).
10. European Mortgage Federation. Study on Non-Performing Loans in the EU; European Mortgage Federation:Brussels, Belgium, 2013.
11. Cano, G.; Etxezarreta, A.; Dol, K.; Hoekstra, J. From Housing Bubble to Repossessions: Spain Compared toOther West European Countries. Hous. Stud. 2013, 28, 1197–1217. [CrossRef]
12. Raya, J.M. The determinants of foreclosures: Evidences from Spanish case. Pap. Reg. Sci. 2017, early view.[CrossRef]
13. Colau, A.; Alemany, A. Vidas Hipotecadas. De la Burbuja Inmobiliaria al Derecho a la Vivienda; Angle Editorial,Cuadrilátero Libros: Barcelona, Spain, 2012.
14. Valiño, V. Emergència Habitacional a Catalunya. Impacte de la Crisi Hipotecària en el Dret a la Salut i els Drets DelsInfants; Observatorio DESC and Plataforma de Afectados por la Hipoteca: Barcelona, Spain, 2015.
15. Gutiérrez, A.; Delclòs, X. Geografía de la Crisis Inmobiliaria en Cataluña: Una Lectura a Partir de LosDesahucios Por Ejecución Hipotecaria. Scripta Nova 2017, 21. Available online: http://revistes.ub.edu/index.php/ScriptaNova/article/view/17734/20431 (accessed on 1 December 2017).
16. Garrido Torres, A. La actuación de las autoridades españolas frente a la crisis financiera. Rev. Estud. Empres.2012, 2, 5–28.
17. Royo, S. How Did the Spanish Financial System Survive the First Stage of the Global Crisis? Governance2013, 26, 631–656. [CrossRef]
18. Gutiérrez, A.; Domènech, A. Geografía de los desahucios por ejecución hipotecaria en las ciudades españolas:Evidencias a partir de las viviendas propiedad de la SAREB. Rev. Geogr. Norte Gd. 2017, 67, 33–52. [CrossRef]
19. Gutiérrez, A.; Domènech, A. Spanish mortgage crisis and accumulation of foreclosed housing by SAREB:A geographical approach. J. Maps 2017, 13, 130–137. [CrossRef]

ISPRS Int. J. Geo-Inf. 2018, 7, 23 16 of 17
20. Schuetz, J.; Been, V.; Gould Ellen, I. Neighborhood Effects of Concentrated Mortgage Foreclosures.N. Y. Univ. Law Econ. Work. Pap. 2008, 151. Available online: http://lsr.nellco.org/nyu_lewp/151(accessed on 1 December 2017).
21. Leonard, T.; Murdoch, J.C. The neighborhood effects of foreclosure. J. Geogr. Syst. 2009, 11, 317. [CrossRef]22. Immergluck, D.; Smith, G. The External Costs of Foreclosure: The Impact of Single-Family Mortgage
Foreclosures on Property Values. Hous. Policy Debate 2006, 17, 57–79. [CrossRef]23. Lin, Z.; Rosenblatt, E.; Yao, V.W. Spillover Effects of Foreclosures on Neighborhood Property Values. J. Real
Estate Financ. 2009, 38, 387–407. [CrossRef]24. Rogers, W.H.; Winter, W. The Impact of Foreclosures on Neighboring Housing Sales. J. Real Estate Res.
2009, 31, 455–479. [CrossRef]25. Rogers, W.H. Declining foreclosure neighborhood effects over time. Hous. Policy Debate 2010, 20, 687–706.
[CrossRef]26. Frame, W.S. Estimating the effect of mortgage foreclosures on nearby property values: A critical review of
the literature. Econ. Rev.-Fed. Res. Bank Atlanta 2010, 95, 1–9.27. Immergluck, D.; Smith, G. The Impact of Single-family Mortgage Foreclosures on Neighborhood Crime.
Hous. Stud. 2006, 21, 851–866. [CrossRef]28. Arnio, A.N.; Baumer, E.P.; Wolff, K.T. The contemporary foreclosure crisis and US crime rates. Soc. Sci. Res.
2012, 41, 1598–1614. [CrossRef] [PubMed]29. Baumer, E.P.; Wolff, K.T.; Arnio, A.N. A Multicity Neighborhood Analysis of Foreclosure and Crime.
Soc. Sci. Q. 2012, 93, 577–601. [CrossRef]30. Katz, C.M.; Wallace, D.; Hedberg, E.C. A Longitudinal Assessment of the Impact of Foreclosure on
Neighborhood Crime. J. Res. Crime Delinquency 2013, 50, 359–389. [CrossRef]31. Williams, S.; Galster, G.; Verma, N. Home Foreclosures and Neighborhood Crime Dynamics. Hous. Stud.
2014, 29, 380–406. [CrossRef]32. Rugh, J.S.; Massey, D.S. Racial Segregation and the American Foreclosure Crisis. Am. Sociol. Rev. 2010, 75,
629–651. [CrossRef] [PubMed]33. Hall, M.; Crowder, K.; Spring, A. Neighborhood Foreclosures, Racial/Ethnic Transitions, and Residential
Segregation. Am. Sociol. Rev. 2015, 80, 526–549. [CrossRef] [PubMed]34. Bennett, G.G.; Scharoun-Lee, M.; Tucker-Seeley, R. Will the Public’s Health Fall Victim to the Home
Foreclosure Epidemic? PLoS Med. 2009, 6, e1000087. [CrossRef] [PubMed]35. Christine, P.J.; Moore, K.; Crawford, N.D.; Barrientos-Gutierrez, T.; Sánchez, B.N.; Seeman, T.; Diez Roux, A.V.
Exposure to Neighborhood Foreclosures and Changes in Cardiometabolic Health: Results From MESA.Am. J. Epidemiol. 2017, 185, 106–114. [CrossRef] [PubMed]
36. Saegert, S.; Fields, D.; Libman, K. Mortgage Foreclosure and Health Disparities: Serial Displacement as AssetExtraction in African American Populations. J. Urban Health 2011, 88, 390–402. [CrossRef] [PubMed]
37. Libman, K.; Fields, D.; Saegert, S. Housing and Health: A Social Ecological Perspective on the US ForeclosureCrisis. Hous. Theory Soc. 2012, 29, 1–24. [CrossRef]
38. Batson, C.; Monnat, S.M. Distress in the Desert: Neighborhood Disorder, Resident Satisfaction, and Qualityof Life during the Las Vegas Foreclosure Crisis. Urban Aff. Rev. 2015, 51, 205–238. [CrossRef] [PubMed]
39. Hoekstra, J.; Vakili-Zad, C. High vacancy rates and rising house prices: The Spanish paradox. Tijdschr. Econ.Soc. Geogr. 2011, 102, 55–71. [CrossRef]
40. Coq-Huelva, D. Urbanisation and Financialisation in the Context of a Rescaling State: The Case of Spain.Antipode 2013, 45, 1213–1231. [CrossRef]
41. Di Feliciantonio, C.; Aalbers, M. The Prehistories of Neoliberal Housing Policies in Italy and Spain and TheirReification in Times of Crisis. Hous. Policy Debate 2017. [CrossRef]
42. Romanos, E. Evictions, Petitions and Escraches: Contentious Housing in Austerity Spain. Soc. Mov. Stud.2014, 13, 296–302. [CrossRef]
43. Álvarez de Andrés, E.; Zapata, M.J.; Zapata, P. Stop the evictions! The diffusion of networked socialmovements and the emergence of a hybrid space: The case of the Spanish Mortgage Victims Group.Habitat Int. 2015, 46, 252–259. [CrossRef]
44. Barbero, I. When rights need to be (re)claimed: Austerity measures, neoliberal housing policies andanti-eviction activism in Spain. Crit. Soc. Policy 2015, 35, 270–280. [CrossRef]

ISPRS Int. J. Geo-Inf. 2018, 7, 23 17 of 17
45. De Werdt, J.; García, M. Housing crisis: The Platform of Mortgage Victims (PAH) movement in Barcelonaand innovations in governance. J. Hous. Built Environ. 2016, 31, 471–493. [CrossRef]
46. García-Lamarca, M. From Occupying Plazas to Recuperating Housing: Insurgent Practices in Spain. Int. J.Urban Reg. Res. 2017. [CrossRef]
47. Gili, M.; Roca, M.; Basu, S.; McKee, M.; Stuckler, D. The mental health risks of economic crisis in Spain:Evidence from primary care centres, 2006 and 2010. Eur. J. Public Health 2013, 23, 103–108. [CrossRef][PubMed]
48. Méndez, R.; Plaza, J. Crisis inmobiliaria y desahucios hipotecarios en España: Una perspectiva geográfica.Bol. Asoc. Geogr. Esp. 2016, 71, 99–127. [CrossRef]
49. Obeso, I. Análisis geográfico de los desahucios en España. Ería 2014, 95, 327–342. [CrossRef]50. Gutiérrez, A.; Delclòs, X. The uneven distribution of evictions as new evidence of urban inequality: A spatial
analysis approach in two Catalan. Cities 2016, 56, 101–108. [CrossRef]51. Gutiérrez, A.; Domènech, A. The spanish mortgage crisis: Evidence of the concentration of foreclosures in
the most deprived neighborhoods. Die Erde 2017, 148, 39–57. [CrossRef]52. Vives-Miró, S.; González-Pérez, J.M.; Rullan, O. Home dispossession: the uneven geography of evictions in
Palma (Majorca). Die Erde 2015, 146, 113–126. [CrossRef]53. Immergluck, D.; Smith, G. Measuring the Effect of Subprime Lending on Neighborhood Foreclosures.
Evidence from Chicago. Urban Aff. Rev. 2005, 40, 362–389. [CrossRef]54. Pfeiffer, D.; Molina, E.T. The Trajectory of REOs in Southern California Latino Neighborhoods: An Uneven
Geography of Recovery. Hous. Policy Debate 2013, 23, 81–109. [CrossRef]55. Zhang, H.; McCord, E.S. A spatial analysis of the impact of housing foreclosures on residential burglary.
Appl. Geogr. 2014, 54, 27–34. [CrossRef]56. Maharawal, M.M.; McElroy, E. The Anti-Eviction Mapping Project: Counter Mapping and Oral History
toward Bay Area Housing Justice. Ann. Am. Assoc. Geogr. 2017. [CrossRef]57. Lloyd, C.D. Spatial Data Analysis; Oxford University Press: Oxford, UK, 2010.58. Hill, E.G.; Ding, L.; Waller, L.A. A comparison of three tests to detect general clustering of a rare disease in
Santa Clara County, California. Stat. Med. 2000, 19, 1363–1378. [CrossRef]59. Li, F.S.; Zhang, L.J. Comparison of point pattern analysis methods for classifying the spatial distributions of
spruce-fir stands in the north-east USA. Forestry 2007, 80, 337–349. [CrossRef]60. Battaglia, F.; Borruso, G.; Porceddu, A. Real Estate Values, Urban Centrality, Economic Activities. A GIS
Analysis on the City of Swindon (UK). In Computational Science and Its Applications—ICCSA 2010. LectureNotes in Computer Science; Taniar, D., Gervasi, O., Murgante, B., Pardede, E., Apduhan, B.O., Eds.; Springer:Berlin/Heidelberg, Germany, 2010; Volume 6016, pp. 1–16. [CrossRef]
61. Arbia, G.; Cella, P.; Espa, G.; Giuliani, D. A micro spatial analysis of firm demography: The case of foodstores in the area of Trento (Italy). Empir. Econ. 2015, 48, 923. [CrossRef]
62. Ripley, B.D. The second–order analysis of stationary point processes. J. Appl. Probab. 1976, 13, 255–266.[CrossRef]
63. Arbia, G. Modelling the geography of economic activities on a continuous space. Pap. Reg. Sci. 2001, 80,411–424. [CrossRef]
64. Anselin, L. Local indicators of spatial association—LISA. Geogr. Anal. 1995, 27, 93–115. [CrossRef]65. Anselin, L. Exploring Spatial Data with GeoDa: A Workbook; Center for Spatially Integrated Social Science,
University of Illinois Urbana-Champaign: Urbana, IL, USA, 2005.66. Roquer, S.; Gutiérrez, A.; Muro, J.I.; Alberich, J. La regeneración integral de barrios en Cataluña mediante
la “Llei de Barris”: Análisis comparado y valoración de los casos de “La Mariola”(Lleida) y Campclar(Tarragona). Polígonos 2013, 25, 277–309. [CrossRef]
67. Ministerio de Fomento. Atlas de la Vulnerabilidad Urbana; Ministerio de Fomento: Madrid, Spain, 2011.Available online: http://atlasvulnerabilidadurbana.vivienda.es/ (accessed on 1 December 2017).
© 2018 by the authors. Licensee MDPI, Basel, Switzerland. This article is an open accessarticle distributed under the terms and conditions of the Creative Commons Attribution(CC BY) license (http://creativecommons.org/licenses/by/4.0/).