spark-based iterative spatial overlay analysis method
TRANSCRIPT

Spark-Based Iterative Spatial Overlay Analysis Method
Zheng ZHAO
College of Electronic Science and Engineering National University of Defense Technology
Changsha, Hunan Province, China e-mail: [email protected]
Ye WU College of Electronic Science and Engineering
National University of Defense Technology Changsha, Hunan Province, China
e-mail: [email protected]
Luo CHEN
College of Electronic Science and Engineering National University of Defense Technology
Changsha, Hunan Province, China e-mail: [email protected]
Ning JING College of Electronic Science and Engineering
National University of Defense Technology Changsha, Hunan Province, China
e-mail: [email protected]
Abstract—For the spatial overlay analysis of vector data on the condition of mass data and confined memory, the paper proposes spark-based iterative spatial overlay analysis algorithm. The algorithm builds multi-level grid index structure combining the first-level grid with quartering ,designs memory space data structure and implements spatial overlay analysis of mass vector data based on Spark distributed computation platform. The experimental result indicates that the algorithm, compared with spatial overlay analysis algorithm in ArcGIS and spatial database PostGIS and Spark-based quad tree index algorithm, enhances the efficiency of spatial overlay analysis obviously. Therefore, it is more suitable for spatial overlay analysis of vector data on the condition of mass data and confined memory.
Keywords-Spark; overlay analysis; vector data; multi-level grid index
I. INTRODUCTION
Spatial overlay analysis is one of basic functions of spatial analysis and also the basis of various spatial analysis methods. As is predicted in the IDC research report issued by the world authority IT information consulting analysis company, the data size around the world will increase from 0.8ZB in 2009 to 35ZB in 2020 [1]. And, as is estimated by market research, over 80% of information involved in the human activity is related to spatial data [2]. With the arrival of big data era, the data volume of spatial data also grows exponentially. Therefore, it is one of the key technologies of spatial analysis to complete spatial overlay analysis operation rapidly facing mass vector data.
For spatial overlay analysis, many scholars have carried out research. Literature [3] proposed concurrent MBR filtration algorithm and polygon clipping algorithm based on GPU; Literature [4] proposed vector data overlay analysis algorithm based on the current overlay analysis algorithm of point-surface, line-surface an surface-surface; Literature [5] proposed heterogeneous multi-level grid index overlay analysis algorithm, including index construction, grid
filtration, overlay analysis and topologic dimension. These methods usually are based on single computer, the computation capability is limited and cannot meet the rapid spatial overlay analysis requirement of mass vector data.
There are many foreign and domestic related researches on spatial index and spatial algorithm optimization based on Spark distributed computation platform. Literature [6] constructed Spark-based quad tree index to process mass vector data, which enhanced the overlay analysis efficiency; Literature [7] realized computation and inquiry frame based on memory in Spark computation platform; Literature [8] optimized the real-time analysis process of spatial data based on spark/shark; Literature [9] realized higher-efficiency equal-join optimization of spatial data based on Spark; Literature [10] established quad tree global index based on the spatial filling curve block subdivision, which realized higher-efficiency spatial inquiry and k-NN inquiry.
The paper proposes iterative spatial overlay analysis method based on Spark distributed computation platform. Firstly, it designs the computation model, abstracts it to multi-target optimization problem. Moreover, based on the distributed memory, it designs key-value memory data structure memory vector data and constructs multi-level grid index structure by combining the first-level grid and quartering and makes partition of data based on grid so as to enhance the algorithm efficiency.
II. SPARK-BASED ITERATIVE SPATIAL OVERLAY
ANALYSIS METHOD
A. Model Design
The input data of spatial overlay analysis includes point, line, polygon and other vector data. There are various constraint conditions according to different backgrounds. By abstracting spatial overlay analysis problem to multi-target optimization problem and limiting the condition constraint to the spatial object information scope, input variable is all the callable spatial data in the target scope, the solution space of
227 This is an open access article under the CC BY-NC license (http://creativecommons.org/licenses/by-nc/4.0/).
Copyright © 2017, the Authors. Published by Atlantis Press.
Advances in Intelligent Systems Research (AISR), volume 1452017 International Conference on Electronic Industry and Automation (EIA 2017)

question is the spatial scale of the overall input data and the solution set is the geographic space scale meeting the space constraint condition.
Input data is divided into point(P), line(L) and polygon(S). Input the overall data, which is called joint as X, and X = {P, L, S}. When studying quantitative problem, it needs to describe each link of question with mathematic expression. Many specific condition constrains of spatial overlay analysis can be abstracted to mathematical language. Specific to data type of spatial overlay analysis, the constraint condition can be divided into different spatial relationship constraint conditions: constraint related to point object, constraint related to line object and constraint related to surface object, which are expressed as follows:
(1)
(2)
(3)
The objective function/result:
(4)
Namely, designate the polygon set in the range that meets constraint condition. F means the computational process under the constraint.
Taking the coverage area of spatial entity as the basis, the constraint condition corresponded by each entity can be divided into two types: compatible constrains and repulsion constrains. The range related to the tow constrains is compatible with and repellent to the result range, respectively.
B. Key-value Memory Space Data Structure
Based on mass memory of distributed cluster, corresponding data structure needs to be designed specific to the feature of memory space by making full use of its advantage compared with the disk. The mature data management mode among current memories is to realize memory database by adopting No-SQL architecture, most of them adopt Key-Value structure organization data, and Key-Value structure is also applicable to be expanded to RDD data in lower distributed computation frame Spark.
It is spliced by designing distributed spatial data model Key as the index character ring of spatial object. The specific composition is as below:
Key = dataset ID + layer ID + node ID + grid ID + object ID (5)
Dataset ID and layer ID are different concept hierarchies stated by spatial data. The node ID is the sole identifier of the data node in distributed cluster, which can be node IP, node
No., etc.; grid ID is a data block ID divided according to the next section of data division method, including simple grid division and Hilbert grid division; object ID is the identifier of spatial object, which is the sole number vested by the system while data input; if dataset only includes one layer, the layer ID can be omitted.
The value of data model includes the following contents: Geotype: spatial object type. The spatial object as point,
line and surface is represented with 001,010 and 100. Center: the geometric central point coordinate. To reduce
the operation burden, the center of spatial object MBR can be selected.
Geometry: the specific format can adopt WKT or WKB and other storage structure.
Attribute column family: attribute name + attribute value The general key-value structure is Key | Geotype | Center
| MBR | Geometry | Attribute. The schematic diagram is shown in Fig. 1.
Figure 1. Spatial data structure design
C. Multi-level Grid Index Structure by Combining the First-level Grid with Quartering
In this paper, the multi-level grid index structure by combining the first-level grid with quartering is used. The corresponding two spatial areas are required to keep consistent in spatial overlay analysis. Therefore, if the indexes of different datasets are constructed respectively, index inconsistency in the same spatial area may occur. A modified multi-level grid index structure based on MBR is adopted in this paper.
Read in all datasets , solve respective MBR( ) according to the coordinate of spatial object in each dataset. Then merge the acquired MBR and get of the overall dataset. Make grid division of the area ( ) and compute the coordinate
228
Advances in Intelligent Systems Research (AISR), volume 145

and corresponding ID of each grid. Traverse the spatial element of dataset and divide the spatial element to corresponding grid according to the first-level grid. Calculate the number of spatial objects in the grid. If the value of some grid is bigger than the preset threshold P, add the corresponding grid ID to the grid ID set to be quartered further. For other datasets, repeat the above steps and get ID sets ( ) of different datasets. Union and distinct all the ID sets and get the grid ID set to be finally quartered further. Quarter the grids to be divided further according to the set . Compared the number of objects in the new gird to the threshold P and get the new ID set . Circulate the previous step and make iterative division of grids which don’t meet the threshold value until the number of all the spatial objects in the grid meets the threshold value condition, namely = Ø.
The number of spatial objects in the grid can be adjusted through threshold value P to avoid too big data volume being divided and the confined memory processing speed becoming slow, which is guaranteed by the iterative division of grid on the condition of confined memory.
D. Data Partitioning Based on Spatial Grid
In actual spatial dataset, whatever the grid is divided, the intersection between spatial object and grid boundary always exists. The spatial intersection omission and spatial logic computation missing exist certainly when computing the spatial analysis directly. Therefore, it needs to process the cross-boundary spatial data additionally to ensure the accuracy of analytical result. To cope with this case, a spatial grid division method is adopted in this paper, that is to say, not only is the grid the basis of the spatial object division, but
also the boundary of dividing cross-boundary object. The specific operation method is shown in Fig. 2. Taking each grid as a boundary, state a rectangle Geometry in the program, make spatial logic intersection with all the spatial objects that is intersected with the grid and take the coinciding part as the grid member. Thus, the cross-boundary object is divided into each grid range. For example, the circle object 3 in the above figure, rounded rectangle object A and B are divided into two objects by the dotted line grid box and classified to the subordinated grid. After division preprocessing, the object cross-boundary phenomenon is missing. Then, through spatial analysis in the grid and result merging, correct and complete analysis result is acquired.
Figure 2. Grid segmentation operation
E. Spark-based Spatial Overlay Analysis
The specific process of iterative spatial overlay analysis algorithm based on Spark is described in details below, see Fig. 3.
Figure 3. Spark-based iterative spatial overlay analysis
The iterative spatial overlay analysis process based on Spark includes index construction, index filtration and overlay analysis.
Index construction: firstly, according to the designed data structure, read in different datasets by utilizing Spark, translate it into RDD; then, construct the index according to
229
Advances in Intelligent Systems Research (AISR), volume 145

multi-level grid index structure in the paper, including calculating dataset MBR, making data division according to grid and making iterative grid division according to the distribution of data volume.
Index filtration: firstly, conduct concurrent Union operation of different datasets, merge the spatial object in the single dataset with the same index ID; then, conduct Join operation among different datasets, and the result is the connection of spatial object among different datasets corresponded by the same index ID.
Overlay analysis: conduct Map operation specific to RddJoin acquired after index filtration, conduct intersection or difference operation for spatial object in the same index ID according to the compatible or repulsion constrains conditions; conduct the Union operation for the overlay analysis result of different index ID and get the ultimate result.
III. EXPERIMENTAL ANALYSIS
In Spark platform, the above spatial overlay analysis algorithm is realized in this paper by using Scala language and compared with desktop software ArcGIS and spatial database PostGIS in performance.
TABLE I. DISTRIBUTED CLUSTER ENVIRONMENT SETTING
Item Description
CPU 4core * 5, Intel(R) i5-4570 @
3.20GHz Memory 16GB * 5, DDR3
Network among nodes Giga bit Ethernet, GbE Operating system Ubuntu16.04 *, 64bit
File system HDFS Resource management tool Hadoop Yarn 2.6.4 Memory computation frame Spark 1.6.1
Programming language environment
Java: 1.80; Scala: 2.10.6
TABLE II. SUPER MICRO SERVER CONFIGURATION
Item Description
CPU 32core, Intel(R) Xeon(R) E5-4620 @
2.20GHz Memory 512GB, DDR3
Operating system
Windows7, 64bit
File system NTFS Software version
ArcGIS10.2, QGIS2.0, PostgreSQL9.3, PostGIS2.0
The experimental data include the point of interest (POI) data and main highway line vector data in Changsha and Beijing.
TABLE III. EXPERIMENTAL DATA SET OF SPATIAL ANALYSIS
Data Object
type Number of
object
Coordinate number
contained changsha_point Point 298 298 changsha_road Line 2347 19538 beijing_point Point 251282 251282 beijing_road Line 144170 1271867
Intersection and Difference calculation performances are compared for two different scales and different types of data, as shown in Fig. 4.
Figure 4. Performance comparison calculated using Intersection and
Difference
From the data scale and performance contrast result, it is known that when the data volume is small, stand-alone GIS tool can complete the computation task of overlay operation rapidly. The time consumed for overlay analysis operation of related data in Changsha doesn’t exceed 1s; while the data volume increases, the computation process involves millions of spatial coordinate points. Then, the concurrent advantage of Spark computation platform emerges. Compared with GIS tool, the computation speed under such two spatial overlay analyses are enhanced by two orders of magnitudes.
In the comparison of overall overlay analysis process, efficiency comparison is made with distributed computational method based on MPI(Message Passing Interface) frame in this paper.
TABLE IV. MPI OPERATION ENVIRONMENT CONFIGURATION
Item Description
CPU 16core * 10, Intel(R) Xeon(R) E5-2640 v2 @ 2.00GHz
Memory 64GB * 10, DDR3
Network among nodes
10Giga bit Ethernet, GbE
Operating system
CentOS6.3 * 10, x86_64
File system GPFS(IBM General Parallel File System)
The experimental result is as below:
230
Advances in Intelligent Systems Research (AISR), volume 145
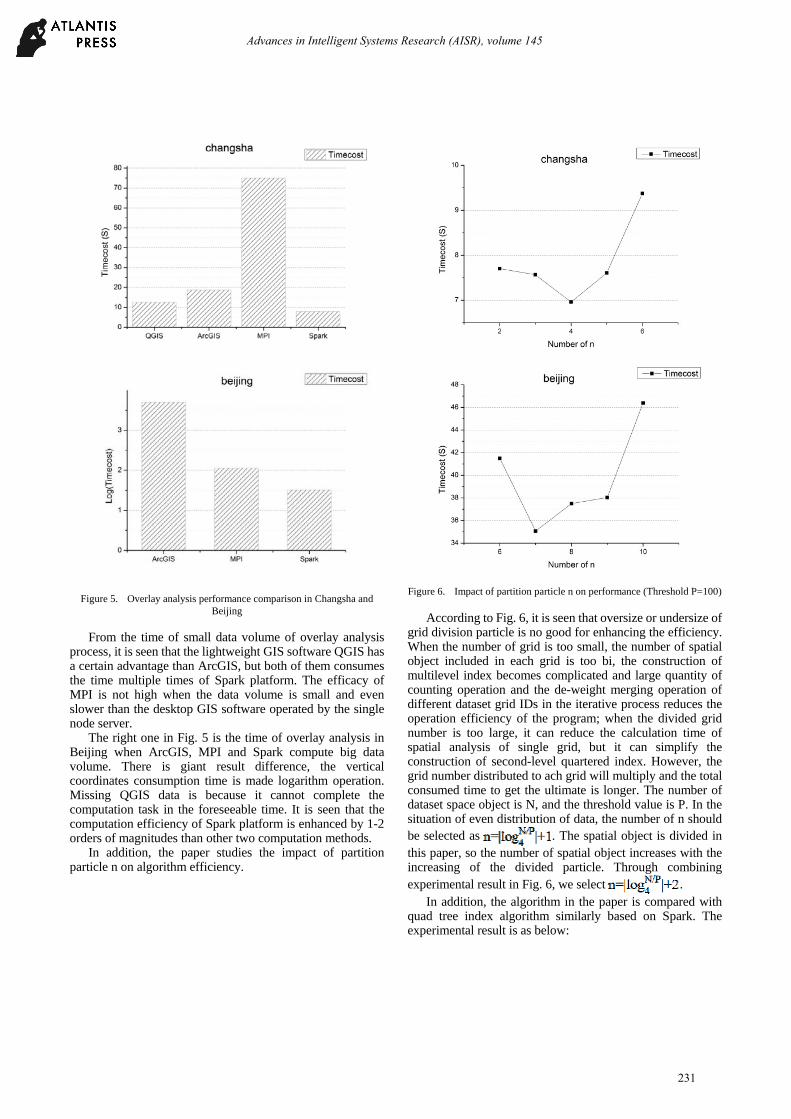
Figure 5. Overlay analysis performance comparison in Changsha and
Beijing
From the time of small data volume of overlay analysis process, it is seen that the lightweight GIS software QGIS has a certain advantage than ArcGIS, but both of them consumes the time multiple times of Spark platform. The efficacy of MPI is not high when the data volume is small and even slower than the desktop GIS software operated by the single node server.
The right one in Fig. 5 is the time of overlay analysis in Beijing when ArcGIS, MPI and Spark compute big data volume. There is giant result difference, the vertical coordinates consumption time is made logarithm operation. Missing QGIS data is because it cannot complete the computation task in the foreseeable time. It is seen that the computation efficiency of Spark platform is enhanced by 1-2 orders of magnitudes than other two computation methods.
In addition, the paper studies the impact of partition particle n on algorithm efficiency.
Figure 6. Impact of partition particle n on performance (Threshold P=100)
According to Fig. 6, it is seen that oversize or undersize of grid division particle is no good for enhancing the efficiency. When the number of grid is too small, the number of spatial object included in each grid is too bi, the construction of multilevel index becomes complicated and large quantity of counting operation and the de-weight merging operation of different dataset grid IDs in the iterative process reduces the operation efficiency of the program; when the divided grid number is too large, it can reduce the calculation time of spatial analysis of single grid, but it can simplify the construction of second-level quartered index. However, the grid number distributed to ach grid will multiply and the total consumed time to get the ultimate is longer. The number of dataset space object is N, and the threshold value is P. In the situation of even distribution of data, the number of n should be selected as . The spatial object is divided in this paper, so the number of spatial object increases with the increasing of the divided particle. Through combining experimental result in Fig. 6, we select .
In addition, the algorithm in the paper is compared with quad tree index algorithm similarly based on Spark. The experimental result is as below:
231
Advances in Intelligent Systems Research (AISR), volume 145

Figure 7. Performance comparison between multi-level grid index and
quad tree index
From Fig. 7, it is seen that the algorithm in the paper has higher efficiency than quad tree index under different threshold P. The first-level grid division avoids reduction of large quantity of spatial object counting operation and merging de-weight operation of different datasets with the same level of index from the initial index construction of quad tree, which enhances the algorithm efficiency. Meanwhile, the first-level grid index reduces the impact of threshold P on algorithm efficiency, which is more suitable for spatial overlay analysis on the confined memory condition.
IV. CONCLUSION
A new overlay analysis algorithm is proposed based on Spark distributed computation platform with the purpose of solving the problems of mass data and confined memory vector data space overlay analysis. Multi-level grid index structure by combining the first-level grid with quartering is adopted to construct the grid-based data in the index construction process. The iterative division of grid is made
according to the threshold so as to control the data volume of spatial object in the grid. The contrast experiment indicates that the efficiency of the spatial overlay analysis algorithm in this paper is greatly enhanced. However, the efficiency of the modified multi-level grid index structure in the paper is low on the condition of uneven distribution of data. Thus, other index structures are to be considered. Meanwhile, the data division method based on grid is to be studied further in different overlay analysis scenes.
ACKNOWLEDGEMENT
This work is supported by the HTRDC(863) under grant No.2015AA123901, and the Natural Science Foundation of China(41471321).
REFERENCES [1] Yihua Huang, In-depth understanding of big data: big data processing
and programming practice [M] China Machine Press, 2014. [2] Shekhar S, Xiong H. Encyclopedia of GIS[M]. Springer US, 2008. [3] Sisi Zhao, Chenghu Zhou. Accelerating polygon overlay analysis by
GPU [J]. Progress in Geography, 2013(1):114-120. [4] Xiaomin Zhu, Hongchao Zhao, Yan Liu, et al. Research on vector map
overlay [J]. Journal of Image and Graphics, 2010(11):1696-1706. [5] Shaohua Wang, Ershun Zhong, Hao Lu, et al. Vector overlay analysis
algorithm of non-uniform multi-level grid index [J]. Geography and Geo-Information Science, 2013(3):17-20, 69.
[6] Fengying Jin, Feng Zhang, Zhenhong Du, et al. Spatial overlay analysis of land use vector data based on Spark. Journal of Zhejiang University(Science Edition), 2016(1):040-044.R.J. Ong, J.T. Dawley and P.G. Clem: submitted to Journal of Materials Research (2003)
[7] Yu Liu. Research on key technologies of real-time enquiry and analysis of spatial big data based on Spark [D]. University of Chinese Academy of Sciences, 2015.
[8] Xin Wen. Optimization of database real-time spatial data analysis based on SPARK/SHARK: taking kNN algorithm as an instance. 2015.
[9] Haoqiong Bian, Yueguo Chen, Xiaoyong Du, et al. Equi-join Opimization on Spark[J] East China Normal University Journal (Natural Science), 2014(5):263-270.
[10] Zhong Y, Han J, Zhang T, et al. Towards Parallel Spatial Query Processing for Big Spatial Data[J]. 2012:2085-2094.
232
Advances in Intelligent Systems Research (AISR), volume 145