spanish fiscal federalism at the crossroad: · pdf file · 2016-01-08spanish fiscal...
TRANSCRIPT
GEN - Governance and Economics research Network
GEN Working Paper A 2016 – 1 webs.uvigo.es/infogen/WP
SPANISH FISCAL FEDERALISM AT THE CROSSROAD:
A SURVEY
Xoaquín Fernández Leiceaga* Santiago Lago Peñas** Alberto Vaquero** * Universidade de Santiago de Compostela and GEN ** GEN and Universidade de Vigo
January 2016
SPANISH FISCAL FEDERALISM AT THE CROSSROAD: A SURVEY Xoaquín Fernández-Leiceaga IDEGA (USC) and GEN (UVIGO) Phone: 690950754 Address: Facultad de Ciencias Económicas, Campus Norte, 15782 Santiago de Compostela E-mail: [email protected] Santiago Lago-Peñas GEN (UVIGO) Phone: 607746927 Address: Facultad de Ciencias Empresariales y Turismo- Campus Universitario As
Lagoas, s/n, 32004 Ourense E-mail: [email protected] Alberto Vaquero GEN (UVIGO) Phone: 988368762 Address: Facultad de Ciencias Empresariales y Turismo- Campus Universitario As Lagoas s/n, 32004 Ourense E-mail: [email protected] JEL CODES: H70, H71, H72, H73, H74, H77
KEY WORDS: Fiscal Federalism, decentralization, fiscal stability, intergovernmental relations, Spain
ABSTRACT
In just over three decades Spain became one of the most decentralized countries in the world, at least in the tax area. This paper aims to conduct a detailed analysis of this unplanned process, showing the successful aspects, but also its shortcomings and failures. Furthermore, this analysis will also help to understand current political tensions in Catalonia, and, to a lesser extent, the Basque Country. Our second aim is to review the way in which the Spanish sub-central levels of government have responded to the so-called “great recession”. Spain is a good laboratory for what actually works and what does not in the area of stability and fiscal sustainability in decentralized states, for two reasons. First, it is by far the country which has suffered the brunt of the economic and financial crisis most acutely among those with a federal structure. And second, subsequent different solutions for tackling the fiscal crisis of sub-central governments have been tested. ACKNOWLEDGMENTS: This research has been financially supported by the Spanish Ministry of Economy and Competitiveness (CSO2013-4703-C2-2-R). The paper has benefited from very useful comments by Jorge Martinez-Vazquez, Agnese Sacchi, Marko Crnogorac, and Pablo Simon. We are also grateful to Fernanda Martínez and Alejandro Domínguez for very able research assistance. The usual disclaimer applies.
2
1. INTRODUCTION
Spain's experience with decentralization offers several special features which make it an interesting case study. Firstly, the high speed of the process. Over a very short period from a historical standpoint Spain went from being a highly centralised country to one of the most decentralized countries in the world at least in the fiscal area. Secondly, this process did not follow a previously set-out plan. The Spanish Constitution established a general framework and legal procedures, but neither pace nor arrival point. Thirdly, decentralization imposed a new regional layer of government over the existing ones. Its powers and financial resources were mostly provided from the central level which, nonetheless, retained a powerful lead role. A cooperative but hierarchical federalism has thus emerged. In many scopes the central government retained its capacity to set basic legislation –which sometimes has been very hard to enforce- while the regional governments were able to modulate this homogeneous regulation and they assumed the management thereof. Finally, much of the decentralization process was a consequence of political settlements which attempted to accommodate social demands that were spatially asymmetrical, similar to those existing in other still highly centralised countries. Considering the Spanish case will thus also serve to gauge the effectiveness of decentralization in maintaining national unity in countries with cultural, ethnic or social diversity.
The primary aim of this paper is to conduct a detailed analysis of this process, showing the successful aspects, but also its shortcomings and failures, to be taken into account by countries intending to embark on their own decentralization processes. Furthermore, this analysis will also help to understand current political tensions in Catalonia and give some clues for solving it and to identify remaining challenges and possible solutions.
Our second aim is to review the way in which the Spanish public sector has responded to the so-called “great recession”, paying particular attention to the sub-central levels of government. Among the world's most decentralized countries, Spain is by far the one which has suffered the brunt of the crisis most acutely, which could have prompted greater competition by scarce revenues, and placed global financial stability in question. Insofar as a number of different solutions for tackling the fiscal crisis of sub-central governments have been tested, it is again a good case study for what actually works and what does not in the area of stability and fiscal sustainability in decentralized states.
In order to perform both tasks, this work is structured into five sections, including this introduction. The second section analyses the Spanish decentralization process, placing it in comparative perspective and focusing on the different asymmetries which still characterise the Spanish model. The third section analyses the way in which the decentralized system has addressed the recent economic crisis. In section four, we then go on to draw a balance of both the positive and negative aspects of the process and, in particular, those issues that are in most urgent need of reform. Section five offers the conclusions along with a recap of the lessons offered by the Spanish case.
3
2. THE INTENSITY AND SPEED OF SPANISH DECENTRALIZATION
2.1 Decentralization compared with other OECD countries
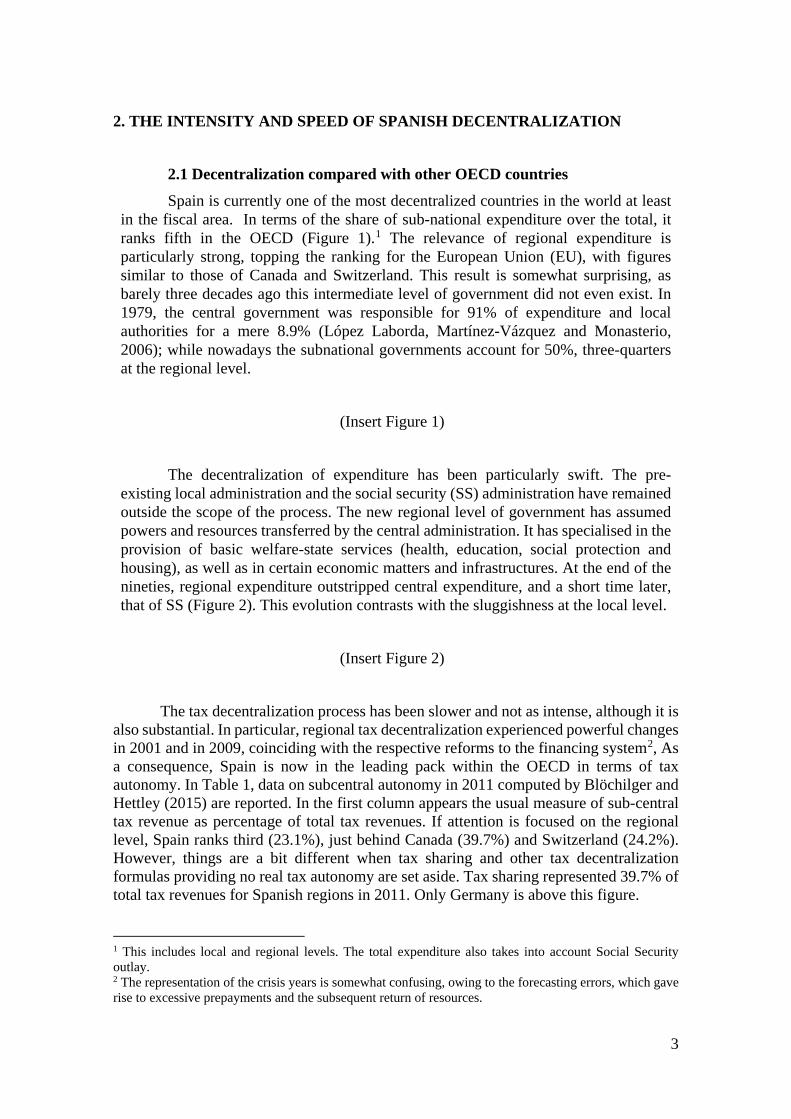
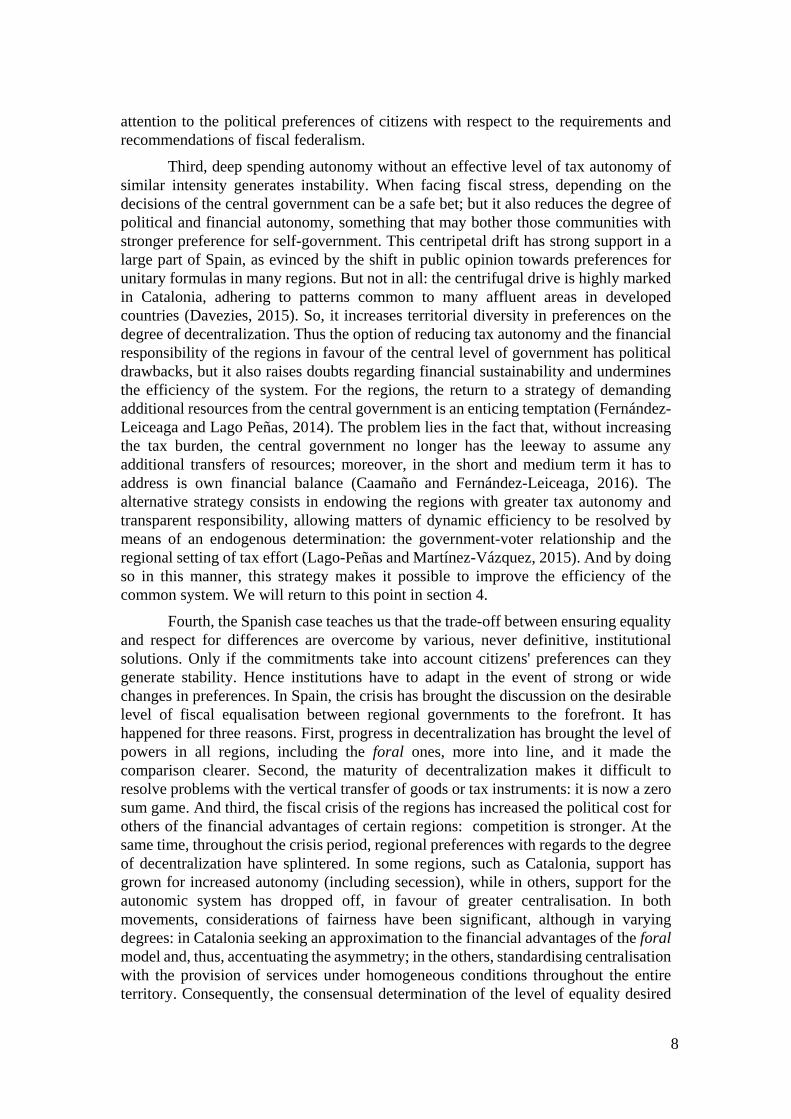
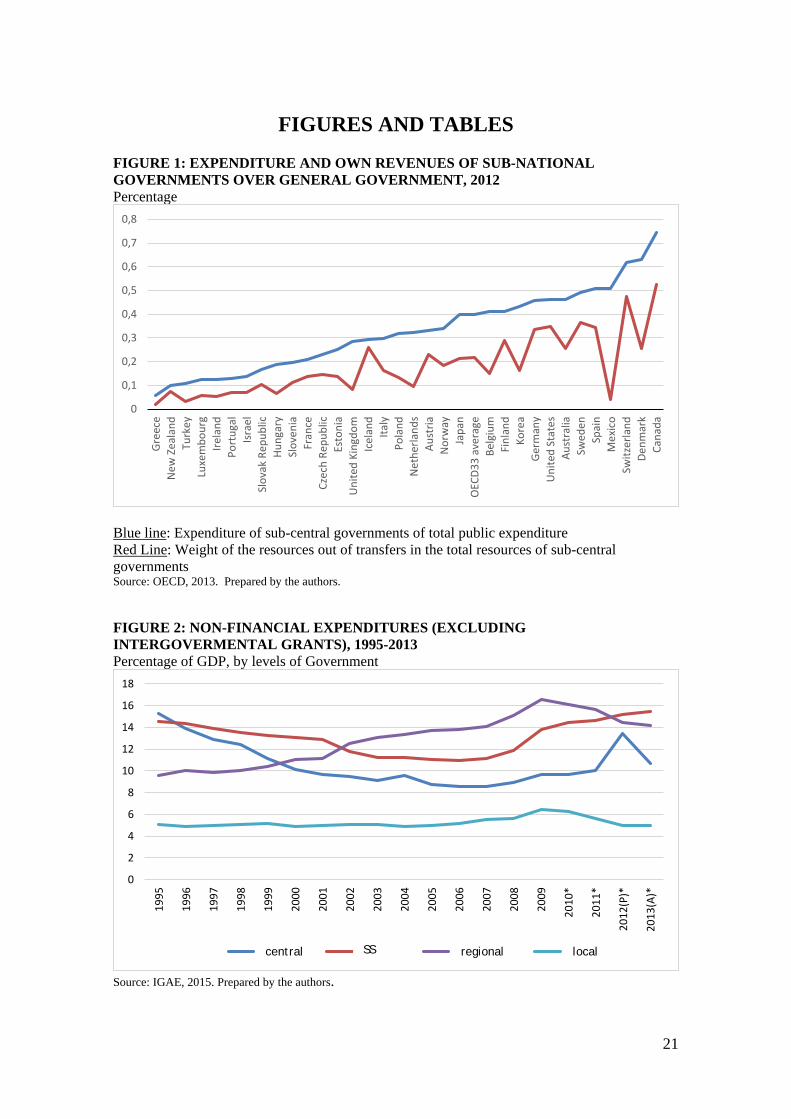
Spain is currently one of the most decentralized countries in the world at least in the fiscal area. In terms of the share of sub-national expenditure over the total, it ranks fifth in the OECD (Figure 1).1 The relevance of regional expenditure is particularly strong, topping the ranking for the European Union (EU), with figures similar to those of Canada and Switzerland. This result is somewhat surprising, as barely three decades ago this intermediate level of government did not even exist. In 1979, the central government was responsible for 91% of expenditure and local authorities for a mere 8.9% (López Laborda, Martínez-Vázquez and Monasterio, 2006); while nowadays the subnational governments account for 50%, three-quarters at the regional level.
(Insert Figure 1)
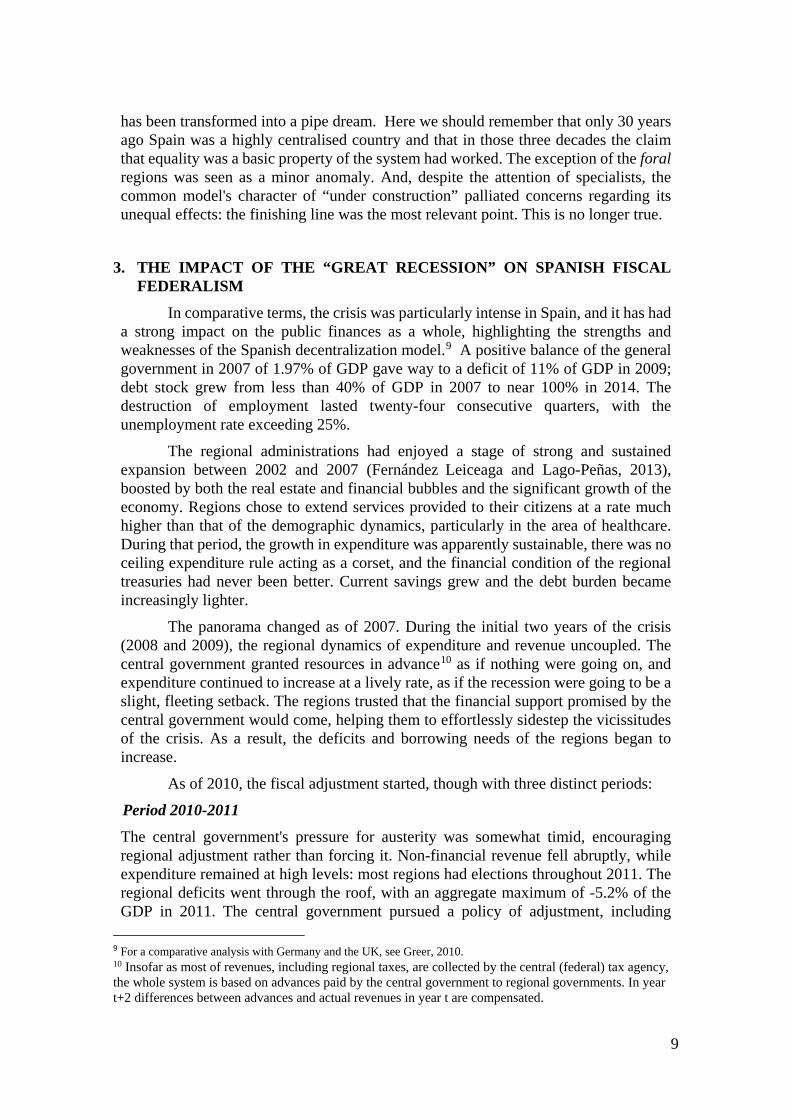
The decentralization of expenditure has been particularly swift. The pre-existing local administration and the social security (SS) administration have remained outside the scope of the process. The new regional level of government has assumed powers and resources transferred by the central administration. It has specialised in the provision of basic welfare-state services (health, education, social protection and housing), as well as in certain economic matters and infrastructures. At the end of the nineties, regional expenditure outstripped central expenditure, and a short time later, that of SS (Figure 2). This evolution contrasts with the sluggishness at the local level.
(Insert Figure 2)
The tax decentralization process has been slower and not as intense, although it is
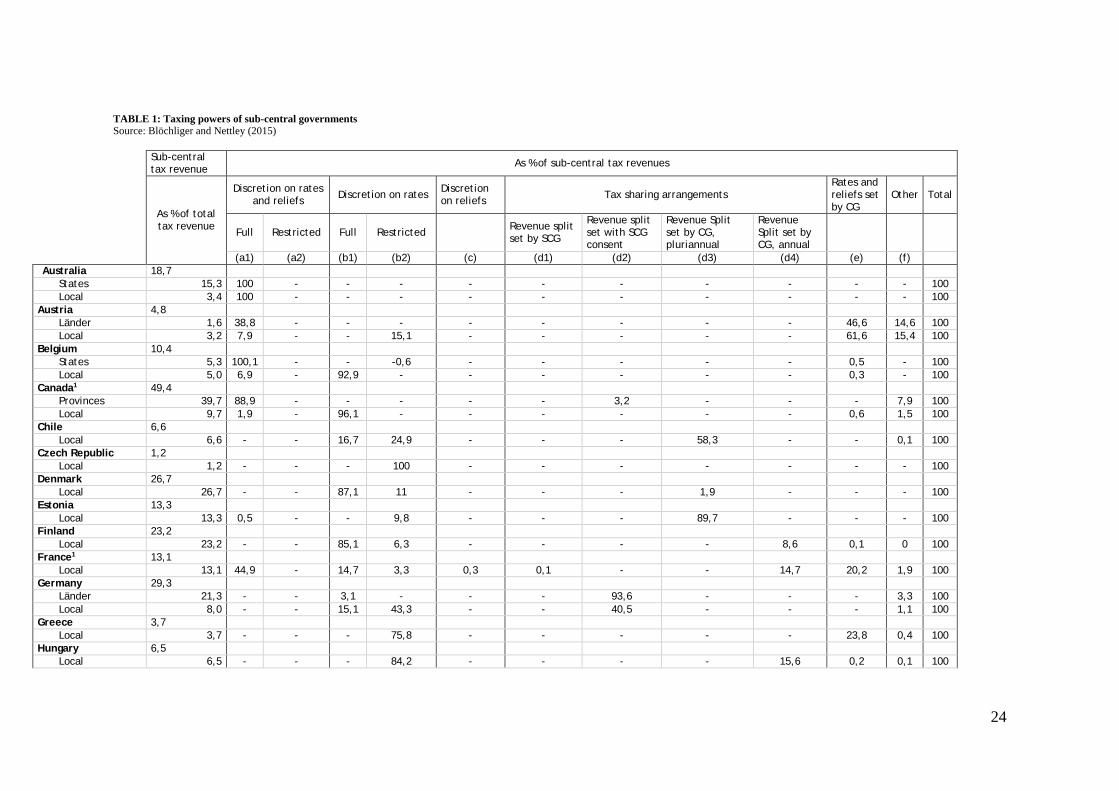
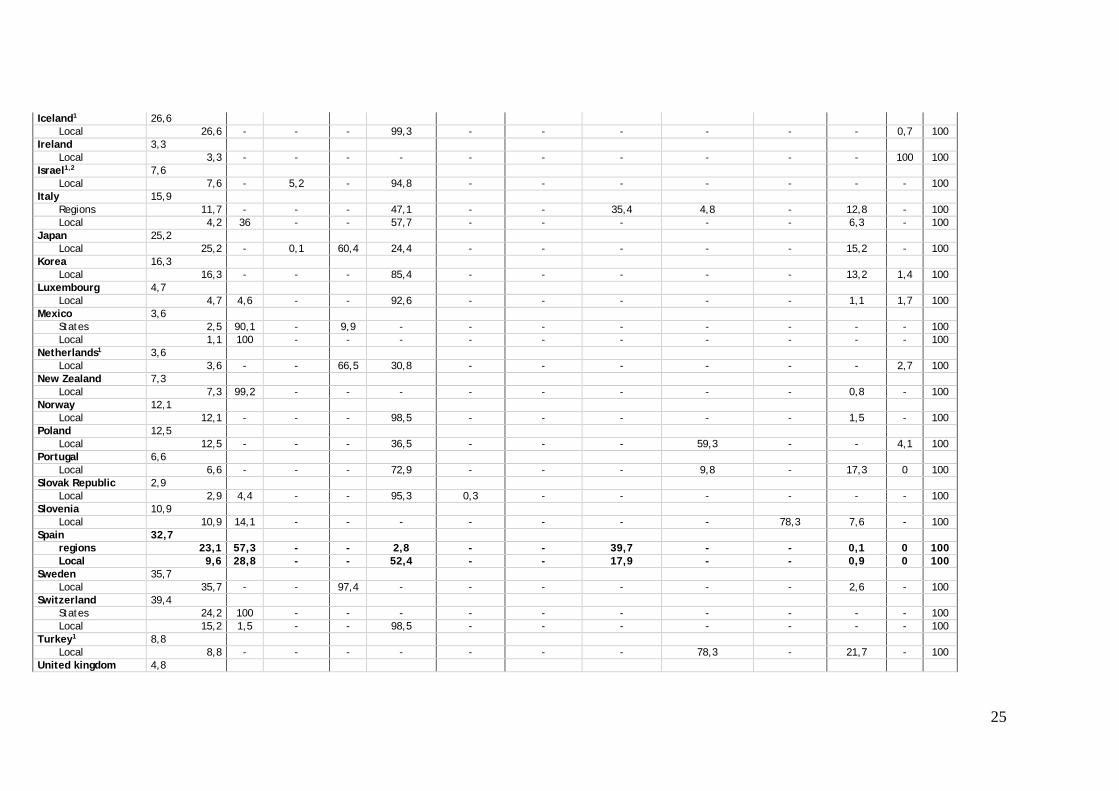
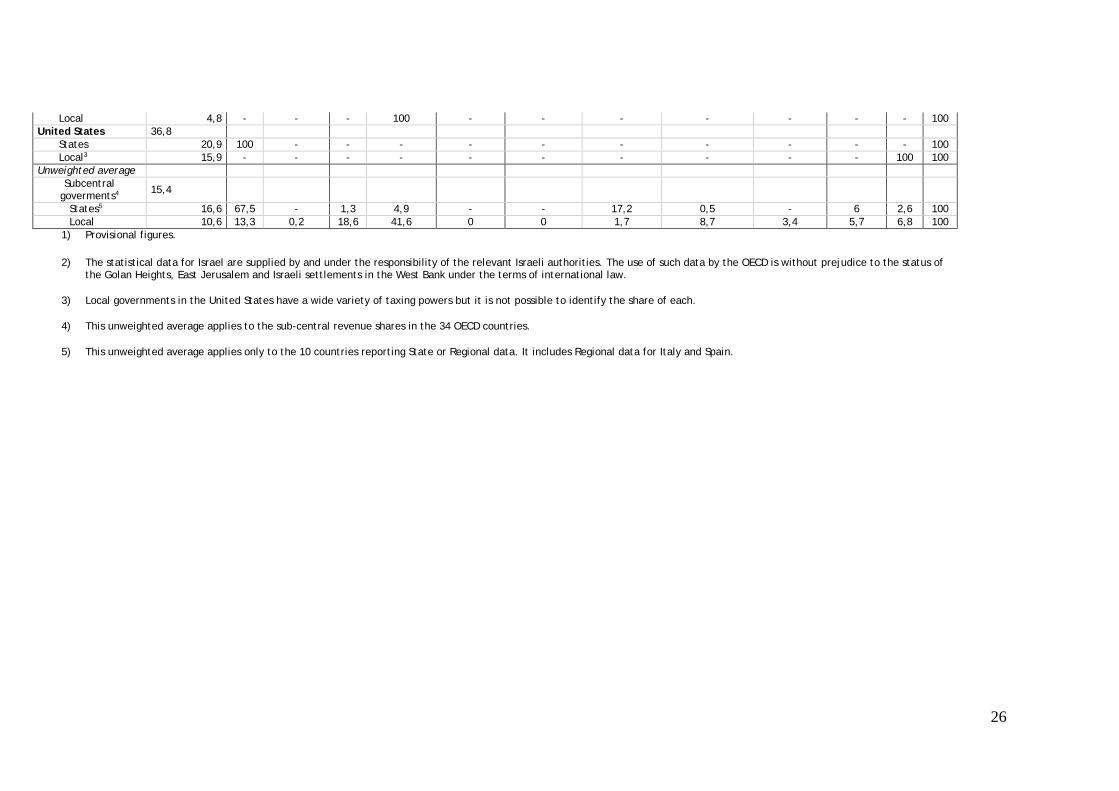
also substantial. In particular, regional tax decentralization experienced powerful changes in 2001 and in 2009, coinciding with the respective reforms to the financing system2, As a consequence, Spain is now in the leading pack within the OECD in terms of tax autonomy. In Table 1, data on subcentral autonomy in 2011 computed by Blöchilger and Hettley (2015) are reported. In the first column appears the usual measure of sub-central tax revenue as percentage of total tax revenues. If attention is focused on the regional level, Spain ranks third (23.1%), just behind Canada (39.7%) and Switzerland (24.2%). However, things are a bit different when tax sharing and other tax decentralization formulas providing no real tax autonomy are set aside. Tax sharing represented 39.7% of total tax revenues for Spanish regions in 2011. Only Germany is above this figure.
1 This includes local and regional levels. The total expenditure also takes into account Social Security outlay. 2 The representation of the crisis years is somewhat confusing, owing to the forecasting errors, which gave rise to excessive prepayments and the subsequent return of resources.
4
(Insert Table 1)
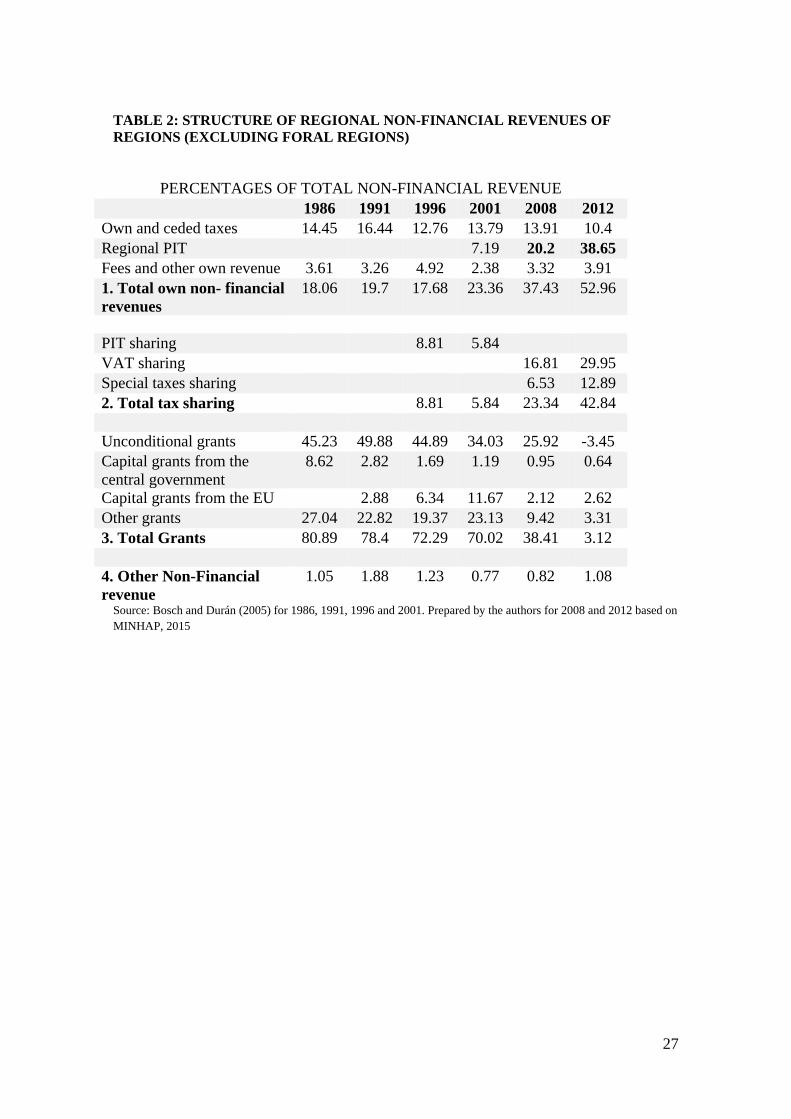
Table 2 reports the structure of non-financial revenues in regions under the common system3. Up to 2001, grants were dominant, although there was some tax devolution and a small space for new own taxes had opened up. Over the following ten years, the lead role in the regional taxation's march forward was played by Personal Income Tax (PIT). Besides, in 2001, tax sharing in the indirect taxes (VAT and excise duties on alcoholic beverages, energy products and electricity, and manufactured tobacco) were established, and powers over the national PIT were transferred to the regions. In 2012, 52.96% of total regional revenues were provided by own taxes and other own revenues; 42.84% of revenues came from tax sharing on indirect taxes; and net grants from the central government were only marginal.4
(Insert Table 2)
In contrast, the treasuries in the foral regions (Basque Country and Navarre) control tax figures representing 95% of their total revenue. They administer almost all taxes in their jurisdiction (the central tax administration plays a marginal role) paying an annual amount to the central government to finance a share of the cost of central government programs. Insofar as both regions have structurally been among the richest in Spain and the bilateral bargaining on the amount of the grant to the central yielded figures significantly lower than the expected according to their fiscal capacity, regional per capita revenues in the foral regions have been substantially higher than in the remaining regions. In addition, their regulatory capacity is much higher than that of the regions under the common system, particularly concerning direct taxes. In the case of indirect taxes, the foral regions are also subject to the requirements for tax harmonisation in the single European market. The decentralized fiscal arrangements for the Basque Country and Navarre are an exception from a comparative international perspective. It is closer to a confederal arrangement than a federal one.
2.2 The asymmetries
Decentralization has played an important role in the transition from dictatorship to democratic rule in Spain (1975). The main aim and motivation for political and
3 These are 15 of the 17 Spanish regions or Autonomous Communities (AC). The Basque Country and Navarre, comprising around 6% of Spanish total population and 8% of Spanish GDP, have a special or foral system, which we shall examine below; they are also called “chartered communities”. For a survey on them see Zabalza and Lopez-Laborda (2014). 4 The regional system of financing is based on the idea of guarantying revenues enough to meet the estimated spending needs in each region. Hence the sum of ceded taxes and tax sharing to each region is compared to that figure. If revenues are over the figure, then regions pay the excess back to the central government and the central government grants it to poorer regions where fiscal capacity is not enough to match spending needs. In fact, in 2012 net unconditional grants from the central government were negative (Table 2).
5
financial decentralization was to integrate the strong aspirations to self-governance of three regions: Catalonia, the Basque Country and, to a lesser extent, Galicia.5 Nonetheless, once started, a wave of emulation appeared in others regions, such as Andalusia, the Community of Valencia, Canary Islands, Navarra, and Balearic Islands.6 Finally, the remaining nine regions demanded to join the decentralization process. While the former wished to be differentiated, with the resulting asymmetry, the latter simply did not want to be left behind, giving rise to demands for parity. The dynamics of the system hinges on these regional differences in relation to the depth of decentralization and the degree of asymmetry. In this game, the Basque Country and Navarre attained a differentiated and advantageous solution, one of maximum decentralization, as set forth in the Spanish Constitution of 1978. If this situation has not resulted in the enhanced growth predicted by the theory (Congleton, 2006), it is because, for a long time, the advantages were cancelled out by the violence of the Basque terrorist group, ETA.
Catalonia, with a strong sense of identity and an appetite for self-governance every bit as strong as that of the Basque Country, has persistently sought higher levels of self-government (Gómez-Reino and Herrero, 2011). But this has given rise to a defensive strategy from other regions, aimed at cancelling out any differential treatment granted to Catalonia and universalising the progress, in turn leading Catalonia to engage in a new bout of singularisation. The level of self-governance attained has arguably been excessive for the majority of the regions, while it has not been enough for Catalonia. So far, Catalonia has not attained any notable financial advantages, as opposed to what occurred with the Basque Country and Navarre.
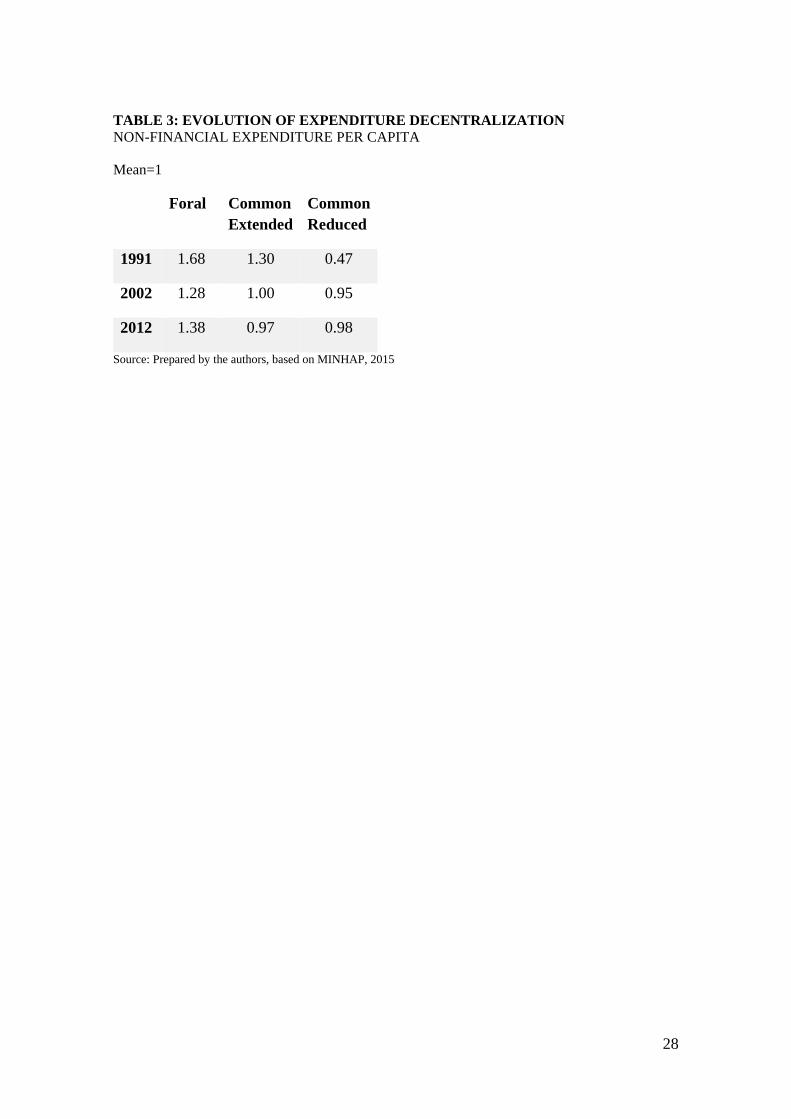
Hence, initially, the system is doubly asymmetrical: a primary, permanent, constitutionalised asymmetry between the foral regions and those of the common system; and a secondary variable asymmetry, modulated by ordinary legislation, among the later. Nonetheless, there are no clear asymmetries based on the grounds of efficiency or different capabilities.7 The reasons for this second-order asymmetry, essentially are political: accommodating different preferences for the desirable level of self-government, although at times the basis thereof lies in a distinguishing fact (own language, insularity or others). Thus, some regions (Catalonia and Galicia, initially, followed by Andalusia, the Community of Valencia and the Canary Islands8) used a fast track for decentralization, because they received prior powers in important areas.t. In 1991, the other common system regions had lagged far behind in the decentralization of expenditure (Table 3). But during the nineties this situation changed. In 2001, the
5 According to various surveys carried out by the CIS (http://www.cis.es/) in 1984 (numbers 1387, 1389, 1404, 1412, 1413, 1415, 1420, 1421, 1437) the percentage of population that are defined as more Basque than Spanish or only Basque was 50%. The answer to a similar question ranged between 26 and 37% in Catalonia and 30% for Galicia. But it went down to 13% in Andalusia and 11% in the Valencian Community, two historical regions of defined identity. 6 The Canary Islands could also be included in the former. Navarre is divided about identity. In the Balearic Islands there is also a notable sense of identity. This even happens in Andalusia. So, the dichotomous division we have made is a simplification. 7 The other two reasons which Bird and Ebel (2006) include for the appearance of asymmetries, in addition to political ones. 8 Which will also enjoy a special tax regime (Lago-Peñas and Fernández-Llera, 2011), on the basis of its singularity, as set forth in the Constitution of 1978.
6
devolution of powers in education and healthcare was achieved in all the regions. Most of the existing differences were therefore cancelled out.
(Insert Table 3)
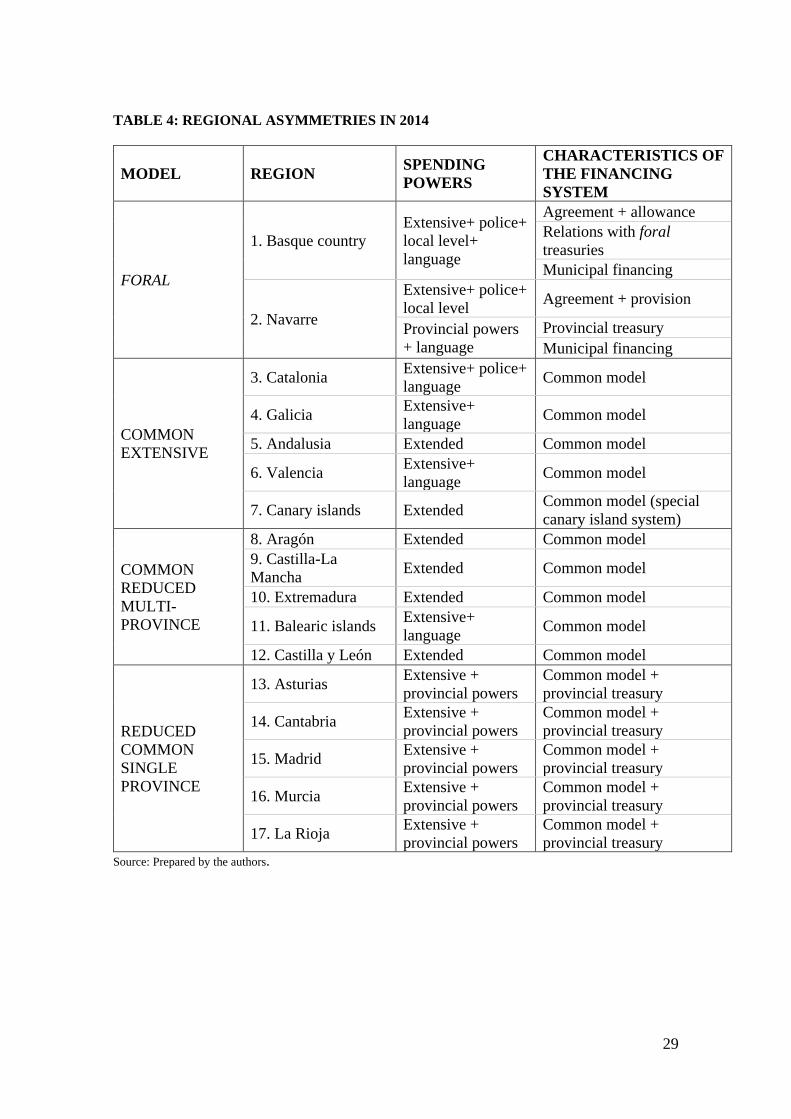
Consequently, Spain’s decentralization responded quite homogeneously to political demands of a highly variable intensity. The resulting asymmetries were not ordered on the basis of preferences for greater self-government. They placed regions with similar intensity (Basque Country, Catalonia) on different tracks, while they lumped together, although with different speeds, regions with highly diverse preferences for decentralization. This absence of correlation was not relevant during the system construction phase. Nonetheless, it has appeared as a problem as decentralization has reached maturity and, more acutely, with the restrictions brought about by the crisis of 2008.
(Insert Table 4)
Bird and Ebel (2006) explain that tolerance of asymmetries is variable over time. Identities and loyalties are not constant. Political settlements are, by definition, contingent. In the Spanish case, during the initial three decades of centralisation, the foral asymmetry was tolerated, and the transitory asymmetry in the common system accommodated highly diverse preferences. It happened, basically, as the system has been vividly dynamic. The growth prospects for resources, periodic renegotiation of fiscal intergovernmental relations and the margin for borrowing made it possible to accommodate ambitious political projects without excessively squeezing those most reticent towards decentralization. The regional elites, in all territories, enjoyed extended power with relatively low levels of responsibility.
Regional resources grew steadily over time, through the devolution of powers and the progressive construction of the Spanish welfare state in European terms. The five-yearly negotiation of the terms of the vertical distribution of resources with the central administration was an implicit guarantee of a soft budgetary constraint (León, 2009); it also meant that dissatisfaction could be channelled. The central treasury regularly had to pump more resources into the system: for negotiating deals and respecting the status quo in each community in absolute terms it was essential to provide more resources. The regions had their eyes more in the evolution of its resources and less on what happened to their neighbors.
At the start of the 21st Century, the institutional architecture was practically complete: a broad level of powers for all regions, which already enjoyed unequal but significant tax autonomy. The asymmetry inside the common system was reduced. The dynamics of the system began to change: the final wave of relevant powers had been transferred and the level of self-financing had risen substantially. The central treasury gradually divested itself of tax resources and, thus, of its future transfer capacity. For the first time, the agreed financing system (2002) had no expiration date. Nonetheless,
7
the time of the financial bubble had a beneficial impact on autonomic finances (Lago-Peñas and Fernández Leiceaga, 2013; De la Fuente, 2013). Access to abundant tax resources at a minimum cost killed off any possible debate. The regions even found themselves in a position to reduce their debt stocks and to implement downward tax adjustments (Cuenca, 2015). The central government helped by providing extraordinary grants in a setting of soft regional budget constraints.
In this context, Catalonia again opted for an institutional reform which set it apart within the common regime group of regions (the new Statute of Autonomy, 2006), which among other things would involve a new more favourable financing system. One main aim was to limit inter-regional fiscal equalisation by the centre—by limiting how much the region would need to contribute- and to obtain new powers without central government intervention. Nonetheless, the success of the new Statute of Autonomy was only partial in both dimensions. The frustration this generated in Catalonia coincided with the onset of the great recession in Spain.
With it, the operational conditions of decentralization underwent extensive changes. Regional revenues shrank notably, despite the additional resources provided by the reform of fiscal intergovernmental relations in 2009. Previously granted tax reductions in Catalonia and elsewhere were partially reversed. For the first time, tax autonomy was actually exercised in a setting of severe difficulties, although with limited revenue collection. Importantly, the central government ceased to be the guarantor of last resort: because of the financial crisis, it had no margin for providing additional financing to the sub-central levels. Moreover, the mushrooming Spanish public debt, coupled with the markets' lack of confidence in European stability and the commitment of the EU institutions, forced a severe adjustment in terms of budgetary stability regulations. The setting of fiscal consolidation notably reduced the regions' future margin for borrowing. Lastly, the end to the terrorist violence in the Basque Country got to transform the foral asymmetry into a highly relevant net advantage, very visible to Catalonia and also other regions.
The already diverse regional preferences regarding the degree of decentralization drifted even further apart. In many regions, a marked mistrust of the virtues of decentralization arose and demands for greater centralisation became prevalent; only in Catalonia did the demand for the breakup of the common model remain strong, possibly because of territorial egotism (Davezies, 2015). In the Basque Country and Navarra the foral model already gave rise to this breakdown of equalisation, and so egotism had already been accomplished there. For a broad section of Catalan society, the foral model (or its financial results) became to be a second-best option, after that of independence.
2.3 Some lessons from the Spanish devolution process
What can we learn from the rapid decentralization process in Spain? First, it can be done in a short time; even from a highly centralised state and a strong preference for equality in the access to the decentralized public services.
Second, decentralization is not merely a technical problem or an economic issue. At least in Spain it also tried to solve acute political problems. In particular, it has been used for making it possible for diverse social and political communities to live together in a common nation. A sound decentralization process requires combining
8
attention to the political preferences of citizens with respect to the requirements and recommendations of fiscal federalism.
Third, deep spending autonomy without an effective level of tax autonomy of similar intensity generates instability. When facing fiscal stress, depending on the decisions of the central government can be a safe bet; but it also reduces the degree of political and financial autonomy, something that may bother those communities with stronger preference for self-government. This centripetal drift has strong support in a large part of Spain, as evinced by the shift in public opinion towards preferences for unitary formulas in many regions. But not in all: the centrifugal drive is highly marked in Catalonia, adhering to patterns common to many affluent areas in developed countries (Davezies, 2015). So, it increases territorial diversity in preferences on the degree of decentralization. Thus the option of reducing tax autonomy and the financial responsibility of the regions in favour of the central level of government has political drawbacks, but it also raises doubts regarding financial sustainability and undermines the efficiency of the system. For the regions, the return to a strategy of demanding additional resources from the central government is an enticing temptation (Fernández-Leiceaga and Lago Peñas, 2014). The problem lies in the fact that, without increasing the tax burden, the central government no longer has the leeway to assume any additional transfers of resources; moreover, in the short and medium term it has to address is own financial balance (Caamaño and Fernández-Leiceaga, 2016). The alternative strategy consists in endowing the regions with greater tax autonomy and transparent responsibility, allowing matters of dynamic efficiency to be resolved by means of an endogenous determination: the government-voter relationship and the regional setting of tax effort (Lago-Peñas and Martínez-Vázquez, 2015). And by doing so in this manner, this strategy makes it possible to improve the efficiency of the common system. We will return to this point in section 4.
Fourth, the Spanish case teaches us that the trade-off between ensuring equality and respect for differences are overcome by various, never definitive, institutional solutions. Only if the commitments take into account citizens' preferences can they generate stability. Hence institutions have to adapt in the event of strong or wide changes in preferences. In Spain, the crisis has brought the discussion on the desirable level of fiscal equalisation between regional governments to the forefront. It has happened for three reasons. First, progress in decentralization has brought the level of powers in all regions, including the foral ones, more into line, and it made the comparison clearer. Second, the maturity of decentralization makes it difficult to resolve problems with the vertical transfer of goods or tax instruments: it is now a zero sum game. And third, the fiscal crisis of the regions has increased the political cost for others of the financial advantages of certain regions: competition is stronger. At the same time, throughout the crisis period, regional preferences with regards to the degree of decentralization have splintered. In some regions, such as Catalonia, support has grown for increased autonomy (including secession), while in others, support for the autonomic system has dropped off, in favour of greater centralisation. In both movements, considerations of fairness have been significant, although in varying degrees: in Catalonia seeking an approximation to the financial advantages of the foral model and, thus, accentuating the asymmetry; in the others, standardising centralisation with the provision of services under homogeneous conditions throughout the entire territory. Consequently, the consensual determination of the level of equality desired
9
has been transformed into a pipe dream. Here we should remember that only 30 years ago Spain was a highly centralised country and that in those three decades the claim that equality was a basic property of the system had worked. The exception of the foral regions was seen as a minor anomaly. And, despite the attention of specialists, the common model's character of “under construction” palliated concerns regarding its unequal effects: the finishing line was the most relevant point. This is no longer true.
3. THE IMPACT OF THE “GREAT RECESSION” ON SPANISH FISCAL FEDERALISM
In comparative terms, the crisis was particularly intense in Spain, and it has had a strong impact on the public finances as a whole, highlighting the strengths and weaknesses of the Spanish decentralization model.9 A positive balance of the general government in 2007 of 1.97% of GDP gave way to a deficit of 11% of GDP in 2009; debt stock grew from less than 40% of GDP in 2007 to near 100% in 2014. The destruction of employment lasted twenty-four consecutive quarters, with the unemployment rate exceeding 25%.
The regional administrations had enjoyed a stage of strong and sustained expansion between 2002 and 2007 (Fernández Leiceaga and Lago-Peñas, 2013), boosted by both the real estate and financial bubbles and the significant growth of the economy. Regions chose to extend services provided to their citizens at a rate much higher than that of the demographic dynamics, particularly in the area of healthcare. During that period, the growth in expenditure was apparently sustainable, there was no ceiling expenditure rule acting as a corset, and the financial condition of the regional treasuries had never been better. Current savings grew and the debt burden became increasingly lighter.
The panorama changed as of 2007. During the initial two years of the crisis (2008 and 2009), the regional dynamics of expenditure and revenue uncoupled. The central government granted resources in advance10 as if nothing were going on, and expenditure continued to increase at a lively rate, as if the recession were going to be a slight, fleeting setback. The regions trusted that the financial support promised by the central government would come, helping them to effortlessly sidestep the vicissitudes of the crisis. As a result, the deficits and borrowing needs of the regions began to increase.
As of 2010, the fiscal adjustment started, though with three distinct periods:
Period 2010-2011
The central government's pressure for austerity was somewhat timid, encouraging regional adjustment rather than forcing it. Non-financial revenue fell abruptly, while expenditure remained at high levels: most regions had elections throughout 2011. The regional deficits went through the roof, with an aggregate maximum of -5.2% of the GDP in 2011. The central government pursued a policy of adjustment, including
9 For a comparative analysis with Germany and the UK, see Greer, 2010. 10 Insofar as most of revenues, including regional taxes, are collected by the central (federal) tax agency, the whole system is based on advances paid by the central government to regional governments. In year t+2 differences between advances and actual revenues in year t are compensated.
10
effective regulatory measures which affected the recruitment and salaries of public employees, including regional staffs.
Period 2012-2014
In this second period, the financial markets had the Spanish economy against the ropes. The central government made fiscal consolidation the key target in its economic policy, employing the hierarchical nature of Spanish decentralization to push through a strong adjustment at the sub-central levels of government. This behaviour was reinforced by the political coincidence among the majority of regional governments and the central government after the general and regional elections in 2011. There was a slight upturn in revenue. Although the regions opted to increase their tax rates, the net yield was scant, owing to the slump in the tax bases. The central government's decisions made it possible to reintroduce the regional tax on net wealth and to secure revenue derived from the principle of benefit (healthcare co-payment).
Adjustments in expenditure became severe. After 2011, the personnel policy became noticeably tougher, with a moratorium on new recruitment and a draconian salary adjustment. On top of this, other measures, such as the unpaid extension of working hours in the administration and the minimum number of students in classes or reducing negotiated drugs prices, also reduced regional expenditure. An official report (CORA, 2013) estimates that, between 2012 and 2014, the regions would have saved around 6% of the annual expenditure owing to the structural measures in the matter of personnel.11 There would be similar savings in education and healthcare, in line with the official forecasts (Kingdom of Spain, 2012). Whether they are excessive or not, these estimates highlight the limits on the autonomy of the regions also on the side of expenditure. To offset this, the central level assumed the bulk of the political cost of the spending adjustment.
In this biennium, despite its reduced level, autonomic debt became a core element of concern, owing to its rapid and sustained expansion. The sharp growth in regional authorities' liabilities could have been indicative of a persistent soft budgetary constraint and, thus, of the central government's inability to reduce the consolidated deficit in a federal setting. In decentralized contexts, the strong horizontal and vertical externalities in confidence building mean that sustainability must be addressed at all levels of government. In 2011, over 25% of regional public expenditure was covered by debt, and current dissaving was of major proportions.
The central government responded to the situation with the adoption in 2012 of much more stringent budgetary stability legislation, introducing an explicit expenditure regulation and deficit/debt objectives for each governmental level (Hernández de Cos and Pérez, 2013; Lago-Peñas and Solé-Ollé, 2016). Moreover, this legislation endowed the central government with the capacity to control, monitor and sanction any deviation from the deficit (including the possibility of taking action against regional governments which are repeat offenders), an authority which it previously lacked. It has served as a strong signal of the will to control the deficit, both externally (EU, financial operators) and internally. Nonetheless, in practice, the agreement with the regions to set deficit targets has only come into play in annual terms; the targets have only been partially
11 See Montesinos et al. (2014), for corroboration, which, in any case, confirms the specific impact on regional public accounts
11
achieved, and, despite non-compliance, sanctions ever have been applied The trend toward deficit reduction has been clear (Cuenca, 2015) although at a slower rate than desired.
The satisfactory aggregate performance of the sub-central authorities would not have been possible without pressure from the financial markets. In 2012, there was a sudden increase in the bond spread with Germany, and access to credit for sub-central governments was all but blocked. The savings banks, which had been one of the principal financiers for these authorities, were subjected to extensive restructuring and were forced to become normal banks. Despite its own difficulties, the central treasury came to the aid of those sub-central authorities most in need of liquidity, standing in for the reluctant financial intermediaries. Access to instruments launched by the central government imposed conditionality, which also had the effect of reducing the regional authorities' expenditure autonomy.
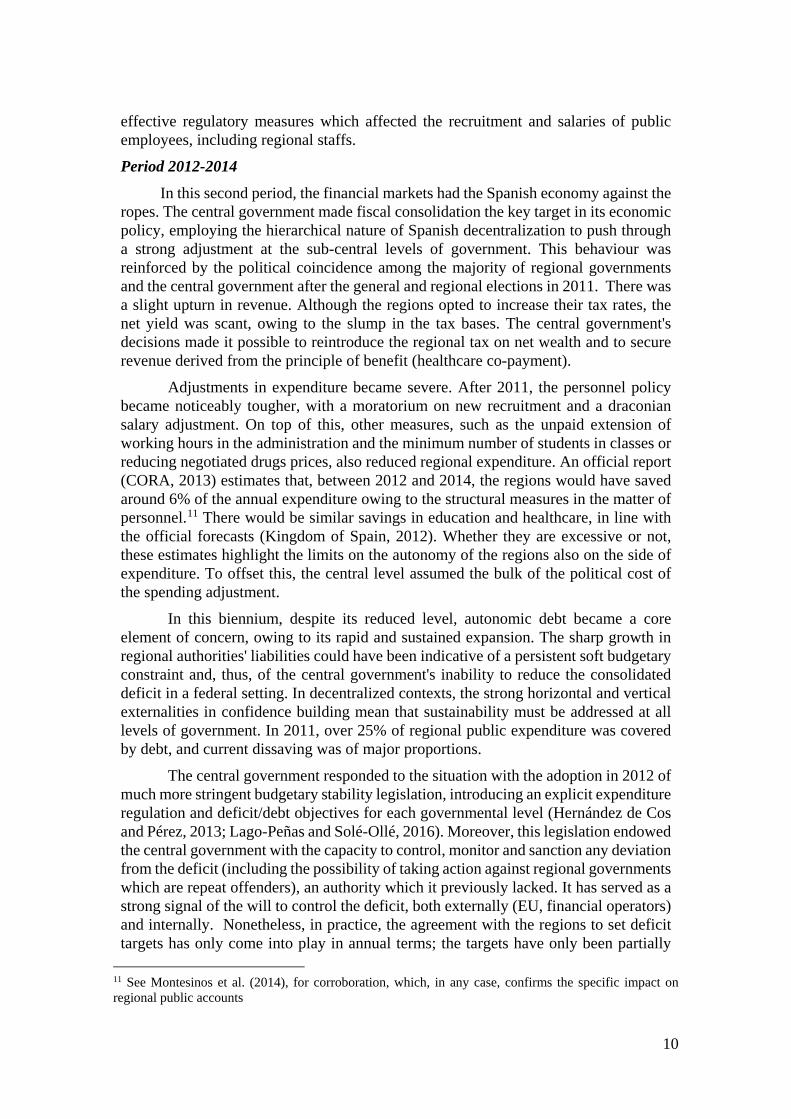
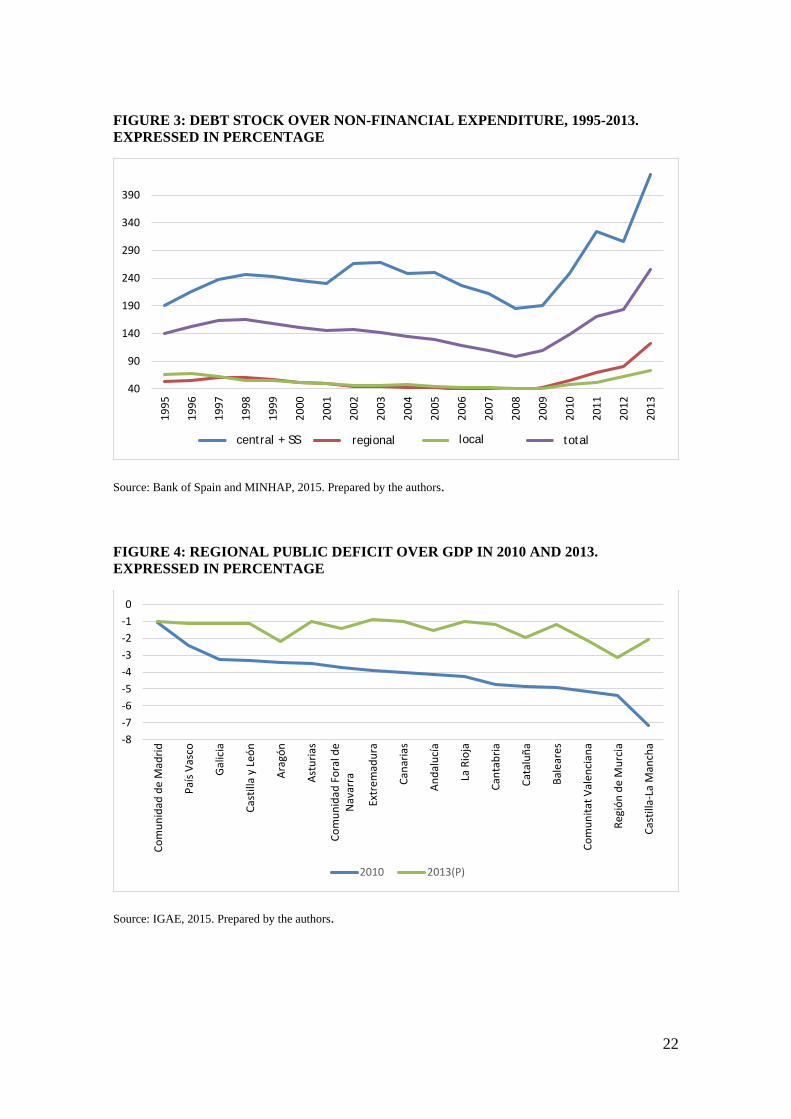
Despite the foregoing, the debt burden mushroomed during the crisis (Figure 3), starting from moderate levels, with the curve rising more abruptly than for the central government and the local administrations. Nonetheless, as a whole, the debt stock remained predominantly in the hands of the central government. The central government had internalised part of the regional public debt through liquidity mechanisms.12 By the end of 2013, the regions were responsible for 20% of public liabilities, while they handled around 40% of total public revenues.13
(Insert Figure 3)
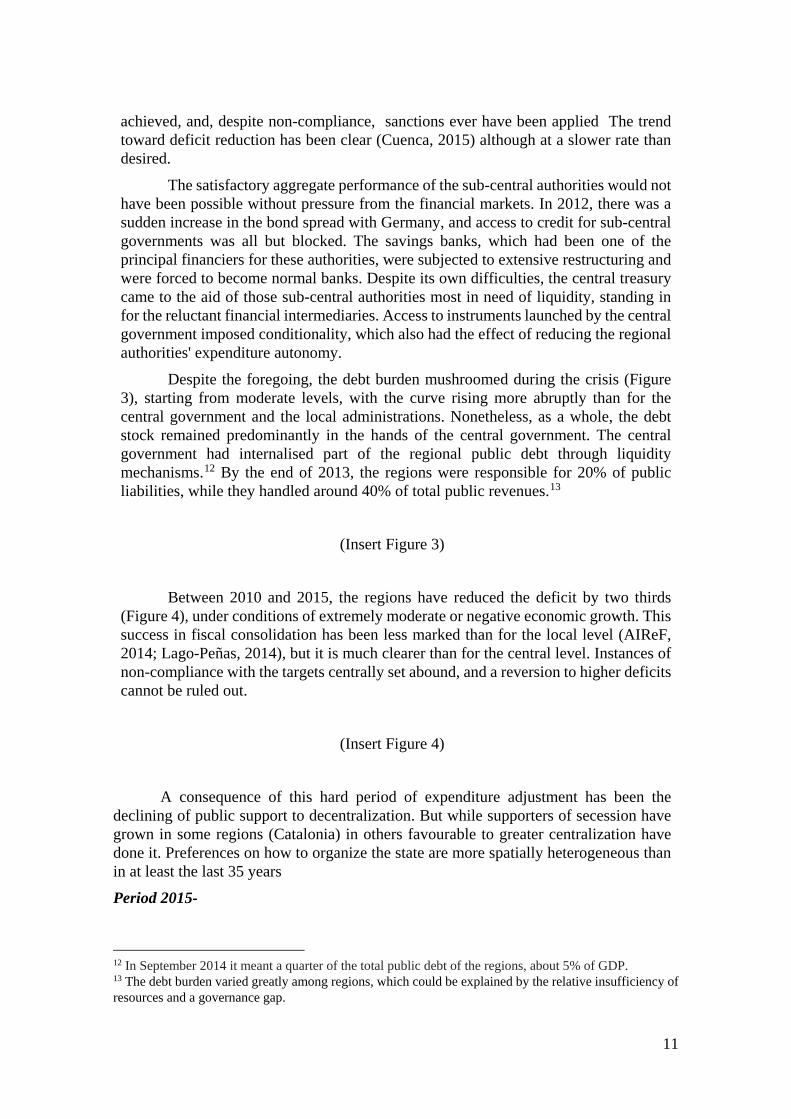
Between 2010 and 2015, the regions have reduced the deficit by two thirds (Figure 4), under conditions of extremely moderate or negative economic growth. This success in fiscal consolidation has been less marked than for the local level (AIReF, 2014; Lago-Peñas, 2014), but it is much clearer than for the central level. Instances of non-compliance with the targets centrally set abound, and a reversion to higher deficits cannot be ruled out.
(Insert Figure 4)
A consequence of this hard period of expenditure adjustment has been the declining of public support to decentralization. But while supporters of secession have grown in some regions (Catalonia) in others favourable to greater centralization have done it. Preferences on how to organize the state are more spatially heterogeneous than in at least the last 35 years
Period 2015-
12 In September 2014 it meant a quarter of the total public debt of the regions, about 5% of GDP. 13 The debt burden varied greatly among regions, which could be explained by the relative insufficiency of resources and a governance gap.
12
The third period of adjustment got under way in 2015. The political conditions have once again changed drastically, with an electoral shift in the regions which seems to be indicative of widespread weariness with the fiscal adjustment policy among citizens. The wording of some of the central government's recent communications would also seem to indicate that its commitment to austerity is on the wane. Thus, in practice, it has acted as a bank for those regions with problems, providing funding (the so-called “Autonomic Liquidity Fund”). Nonetheless, the design of this instrument offers clear financial advantages to the recipient regions—namely, those which have most clearly failed to comply with the deficit objectives—giving rise to strong negative incentives. The political window of opportunity for collaboration between the central and regional levels to reduce deficit, despite its negative economic, social and political effect on the short-term, appears to be closing.
What has the behaviour of regional administrations during the crisis taught us? First, in a hierarchical federalism system, decisions made by the central tier are critical. Spanish regions acted in the first phase of the crisis with abandon; and in the second they met the tasks of fiscal adjustment and consolidation with good overall marks. But in both cases they homogeneously responded, rather than with different rhythms and intensities, to messages and incentives set from the central level. Second, centralisation also faces a number of risks. The impact of mistakes made by the central government is maximised. Regions barely have room to try different strategies, losing one of the advantages of decentralization, and the support offered by the central government can encourage irresponsible behaviour. Third, if they are long lasting, policies of austerity and consolidation are hard to implement due to their social and political consequences and the asymmetry in perceived responsibilities by the different levels of government.
All in all, and despite the successful consolidation up to now, there is still a good way to go. How can this be done? Continuity along the pathway of fiscal consolidation is going to depend on the current economic upturn. In this setting, a combination of expenditure regulation and zero structural deficit could guarantee a gradual reduction of the debt, which would be sufficient for some regions, but which is going to leave others a long way off the target set for 2020 (Caamaño and Fernández-Leiceaga, 2015). Some authors (Lago-Peñas, 2015) warn of the dilemma in which the government find itself, caught between the difficulties in applying the more extreme deficit control measures contemplated by the law (including that of suspending regional autonomy) and the cost of the alternative paths. The application of extreme measures is complicated by the number of regions involved and the strong cut-backs already implemented in regional expenditure, which reduce the margin for saving. The alternative pathways (reviewing the vertical distribution of deficit and debt targets and reforming the financing system) entail reducing the cushion for a central administration which is even further away from the regulatory objectives than the regional level.
Reforming the financing model to increase the regions' level of tax autonomy encourages efficiency, given that the correlation between fiscal decentralization and compliance with fiscal discipline is positive (Eyraud and Lusinyan, 2011; Foremny, 2014), but will only be effective in the medium and long-term. However, it is the only way to ensure compatibility of decentralization with financial stability.
13
4. AN APPRAISAL OF THE SPANISH DECENTRALIZATION PROCESS: REMAINING TASKS
4.1. Reinforcing autonomy and accountability
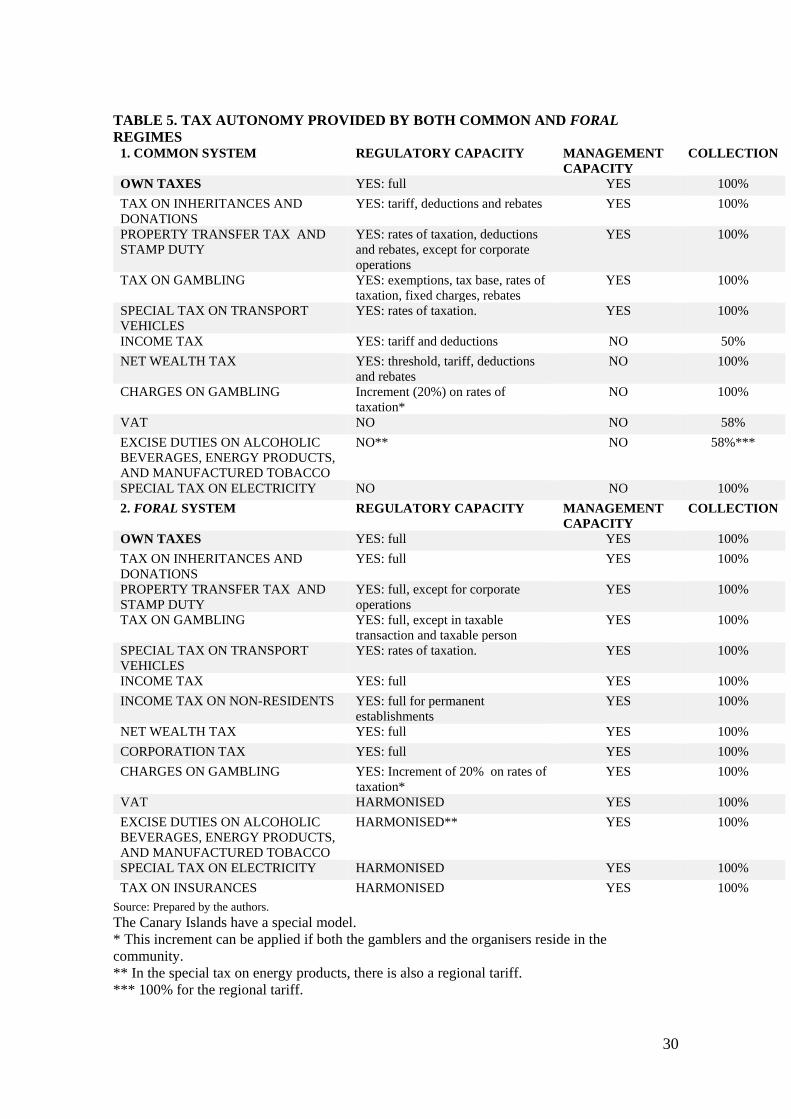
How can regional tax autonomy and accountability be strengthened? How can the perception thereof by the citizens be guaranteed? Table 5 shows the current situation.
(Insert Table 5)
Regional own fiscal room has been exploited, although with a low yield, by regional governments. The high level of litigiousness, brought about by both the central government and private agents, has hampered the initiative of regional governments. Clearly delimiting the regional setting of action and endowing it with legal stability (Lago-Peñas and Martínez-Vázquez, 2010 and 2015) are necessary actions for more extensive use. The quashing and subsequent reintroduction of a regional net wealth tax by the central government indicates that it remains responsible for setting taxes. The extensive regional differences in the treatment of inheritance and donation tax shows the negative effects of fiscal power in an area (taxation on wealth) usually reserved for the central level of government. Moreover, this fact should not be surprising in light of international experiences. Setting limits on the State's discretionary action establishing common tax minima) could help to enhance tax autonomy in this dimension (Lagares, 2014.
In the case of the PIT there are problems of visibility and management autonomy. Lago Peñas and Martínez-Vázquez (2015) have proposed moving towards separate or differentiated taxes, holding the same definition of the tax base. This new configuration would force the regional level of government to conduct a healthy exercise in responsibility
In turn, tax sharing on indirect taxes lead to scant financial autonomy. Regions do not participate in the establishment, regulation or management thereof, nor do they possess the capacity to have a bearing on the decision that the central Treasury takes. They are only entitled to receive the yield assigned to them, on the basis of an estimated regional consumption index. These resources account for 26.6% of the total. What should be done with them? Following the examples of Canada or Brazil, some authors (Durán, 2008) advocate the creation of a regional value added tax on the retail phase of distribution or the possibility of a surcharge. Nonetheless, the progressive homogenisation of indirect taxation in the EU reduces the effectiveness of both solutions. As an alternative, others defend a solution along the lines of the German one (Zabalza and López Laborda, 2014), with a regulatory capacity shared by all regions.
Lastly, the management and collection of shared taxes suffers from a serious problem of visibility. These taxes are managed in a centralised manner, thus maximising the economies of scale, but hindering the citizens' perception of the responsibility of regional governments (Lago-Peñas and Lago-Peñas, 2010, Martínez Vázquez and Timofeev, 2005); in order to maximise visibility, the decentralization of management is preferable (Mikesell, 2003). The key lies in going from a fragmented
14
model (Onrubia, 2015) with independent agencies to an integrated one (Gascón, 2014), with networks for cooperation in the treatment of information, while maintaining the institutional autonomy of the different agencies.
4.2. Clarifying the extent of fiscal equalisation The foral system is considered to be the principal factor in the breakdown of
equity, by conferring per capita financing which is highly favourable in comparative terms. But at the heart of the common financing system himself the debate on horizontal equity is also lively. The core discrepancy, which affects the route the model must adopt, concerns the desirable degree of fiscal equalisation (Lago Peñas and Fernández-Leiceaga, 2014).
The highly extensive tax and management autonomy of the foral framework, operating on economies which are more prosperous than the average, allows regions to attend to their expenditure needs and to contribute to the financing of services rendered by the central level. This non-transparent vertical transfer, the so-called “Allowance” or “Provision” (“Cupo” or “Aportación”), is a differential advantage, insofar as it is far below what would be required for equivalent treatment between the foral regions and the rest, allowing improved services with lower fiscal pressure in those regions. The non-justified over-financing of foral regions has been estimated at between 30% (Zabalza and López-Laborda, 2014) and 75% (De la Fuente, 2011; Zubiri, 2015) of the mean level of the common territories. It is not surprising that the OECD (2014) ranks the autonomous Community of the Basque Country as the region with the highest level of welfare in Spain.
With lower taxes and a higher capacity for expenditure, the foral model has attracted the attention of other regions, and more specifically, that of Catalonia. The Catalan government is seeking the way to attain the results of the foral system (Lago-Peñas and Fernández-Leiceaga, 2013). Its proposal of Fiscal Agreement (Pacto Fiscal) is an example of formulas found in the international setting (the US federal system), which connects with the instincts of societies with strong internal cohesion and scant solidarity towards neighbours. In the Spanish case, it is a temptation for those regions with high tax capacity and strong identities, combining interests with dominant values (Claeys and Martire, 2015). In short, if you want me to stay, pay me. The principal problem in attending to these demands is their cost in fiscal resources and the (further) breach in equity it represents. The extension thereof to Catalonia would mean substantially reducing the funds available for inter-regional fiscal equalisation.
In relation to the common model, it is important to take into account that, in Spain, decentralization took place through the transfer of powers from the central government to the new regional level, and that it has happened very recently. The regions were transferred resources equivalent to the expenditure which beforehand had effectively been made by the state administration (“effective cost method”). For a period of time, this procedure guaranteed financial neutrality and sufficiency at both levels of government, but it also perpetuated the marked differences already existing in the provision of services at regional level. As of 1987, this method gave way to an objective formula of determining needs. In 2001 a system intended to be permanent was established. Without altering the general scheme, expenditure was distributed
15
among three areas: common powers, healthcare powers and powers in social services. For each area of expenditure, resources were distributed on the basis of a set of variables and percentages. Healthcare was incorporated into the general scheme of financing.
Consequently, the distribution models have a strong focus on equality. And if they have improved over time, why do the results thereof tend to move away from homogeneous financing? The initial formula for determining needs was tweaked to produce results close to the “effective cost”. This effect was reinforced by the instruction of a “hold harmless” clause to respect the status quo, to guarantee that, in nominal terms, no community lost. This guarantee would be present in each round of negotiations, tending to reproduce the inequalities present at the outset. The formally multilateral model is also adjusted by means of specific bilateral agreements which help to maintain the relative positions of the ACs.
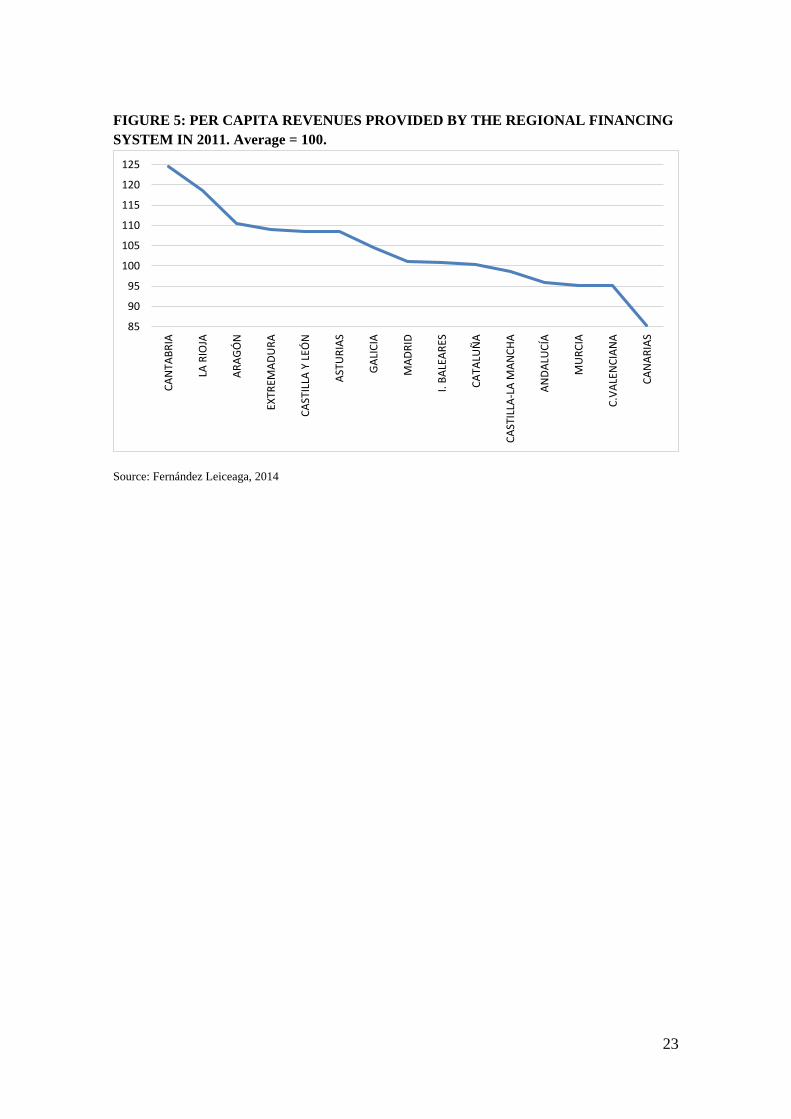
Figure 5 shows that the dispersion of per capita regional revenues is limited but, once again, that the ordering of the regions is difficult to explain. The equalisation transfer has achieved its purpose, partially offsetting the effects of dispersion of the regions' on tax capacity. The current model sets an ambitious objective of equality, but then goes on to qualify it considerably, the end result being somewhat confusing and arbitrary, although with a strong weighting of the status quo (Fernández-Leiceaga, 2014).
(Insert Figure 5)
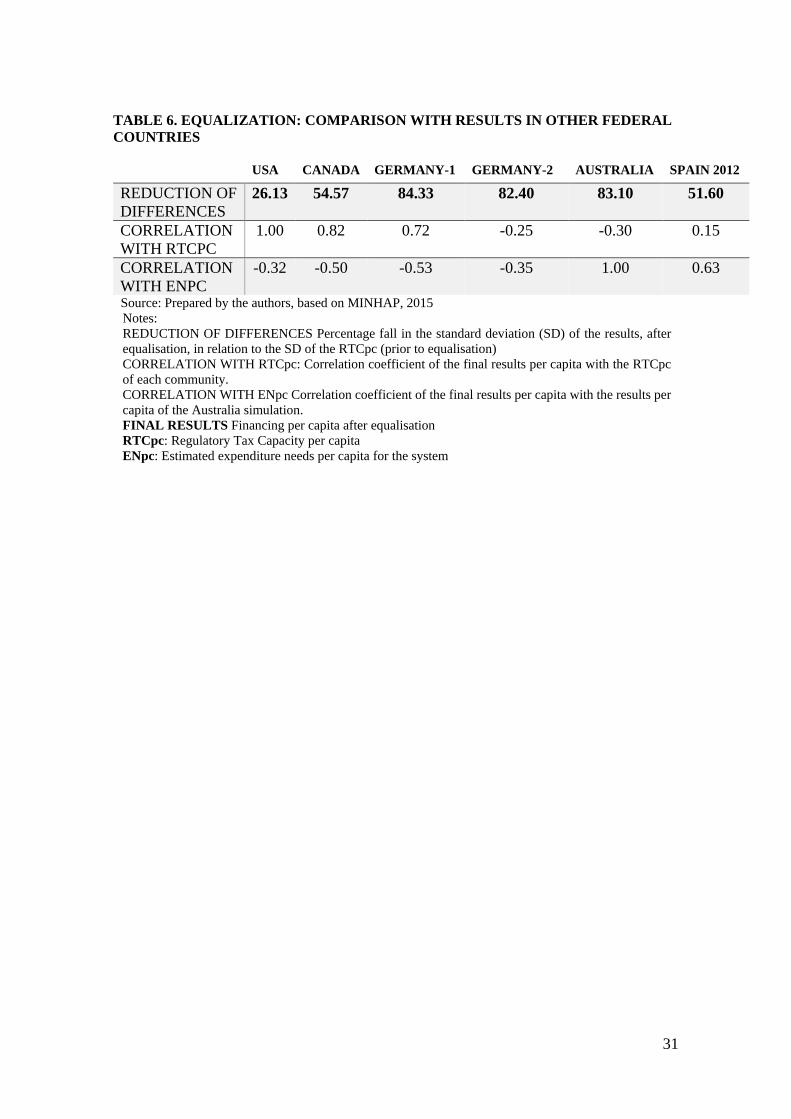
The equalisation system is more easily understood in comparison with those operating in other developed and extensive federal countries (United States, Canada, Germany, Australia) (Lago-Peñas and Fernández-Leiceaga, 2013). The starting point (the regional distribution of tax capacity) shows that Spain, in the common space, exhibits low territorial inequality, with only that of Australia being lower. The finishing line (regional financing per capita) shows that the common model is of a medium redistributional intensity, higher than for the US, similar to Canada, but lower than Germany and Australia. The final ordering on the basis of expansion needs continue to be dominant, although in a highly nuanced manner. With a view to the future, the model needs to clarify the degree of equalisation to be targeted.
(Insert Table 6)
5. CONCLUSIONS
After 35 years, the Spanish decentralization process has reached a critical point. Problems can no longer be solved simply by offering greater powers and more resources to the regional level. Certain core aspects thereof need to be reconsidered. The economic crisis has heightened awareness of this need, as it has revealed a number
16
of shortcomings and dysfunctions in fiscal intergovernmental relations and in the regional contribution to budgetary stability. It has also amplified the differences in regional meta-preferences regarding the level of decentralization, as well as in the optimal level of fiscal equalisation among regions.
A first major change is related to the responsibilities of both the regional and central tiers. Until now, the model has been paternalistic, with a central government which has held the reins and took decisions, whilst it defrayed the costs of regional governments and reprimanded, but at the same time compensated, those who broke the rules. In such a setting, expecting fiscal irresponsibility and a limited use of tax autonomy was logical. In order to overcome those outcomes, three main developments are required. First, the strengthening of the regions' tax autonomy and of the fiscal responsibility thereof to the citizens are required. We have analysed the possibilities available and limitations on the same. The clarification of the regions' own tax space and the transformation of the PIT into a true regional tax are the changes with the greatest potential. Second, the transition towards a cooperative federalism would reinforce regional participation in financial stability. The first condition for the effective use of the margins existing in tax autonomy is a restriction on the use of borrowing; with this limitation, budgetary sustainability forces constraints on expenditure, particularity at the high points of the economic cycle. Since 2012, the Spanish legislation applicable to the regions has incorporated a broad array of instruments which should be more than sufficient to fully guarantee both objectives. The problem lies in the imposition of legislation by the central government and in a distribution of consolidated deficit and debt objectives which are highly unfavourable for the sub-central levels. A review of the global distribution of objectives, a temporal adjustment of the compliance horizon for the debt objective and higher regional participation in the drafting of regulations would strengthen the stability framework. Third, imposing hard regional budget constraints would also be necessary. The use of tax autonomy and compliance with the stability objectives on the part of the regions will be more likely if the probability of financial bailouts from by the central level diminishes. The current budgetary stability legislation is highly demanding, but it is not met: no sanctions have been imposed and the unrealistic nature of some objectives helps to generate a sense of laxity in the regions. Moreover, despite the financial difficulties the central government has experienced throughout the crisis, it has implemented partial financial bailouts for the regions through the creation of financing facilities which are particularly beneficial for the non-compliant regions. A consensual reform of the legislation should be accompanied by an automatic sanctioning mechanism, and through the establishment of a truly independent authority shared by the regions, responsible for its application.
A second challenge is the fact that the asymmetries existing in the regional model do not respond well to functional factors; nor do they correspond directly with regional meta-preferences. Moreover, the asymmetry driven by the foral model, which is the most relevant one, is accompanied by a significant financial advantage. Is not simply a case of making a clean sweep of the asymmetries, rather of adjusting them to coincide with regional preferences on the extent of decentralization, generating at least two optional levels for the regions. And in order to preclude any perverse incentives, the asymmetries in powers and resources will have to be uncoupled from financial advantages.

17
And last, but not the least, a new general agreement on fiscal equalisation is mandatory. This general agreement will require also agreements on the formulas used to compute regional spending needs and tax capacities, on the degree of equalisation to be targeted, and on the inclusion of foral regions as net contributors of funds according to their real tax capacity.
18
REFERENCES [1] AIREF (Autoridad Independiente de Responsabilidad Fiscal), 2014 Informe
complementario sobre las líneas fundamentales de Presupuestos 2015 de las Comunidades Autónomas.
[2] Bank of Spain, 2015, Statistics Bulletin, several issues. [3] Bird R, Ebel R, 2006, “Fiscal federalism and national unity” in Handbook of fiscal
federalism, Eds E Ahmad, G Brosio (Edward Elgar) [4] Bird R, Gendron P P, 2001, "VATs in federal countries: international experience
and emerging possibilities" Bulletin for international fiscal documentation 55 (7) 293-309
[5] Blöchiger H, Hettley M, 2015, “Sub-central tax autonomy” OECD Working Papers on Fiscal Federalism 20.
[6] Bosch N, Durán J M, 2005 La financiación de las comunidades autónomas: Políticas tributarias y solidaridad interterritorial (Publicaciones y Ediciones de la Universidad de Barcelona, Barcelona)
[7] Caamaño J, Fernández-Leiceaga X, 2016 “El ajuste del gasto en España: estabilidad, presupuestación y control financiero” Papeles de Economía Española (forthcoming)
[8] Claeys P, Martire F, 2015, "‘If you want me to stay, pay’: a model of asymmetric federalism in centralised countries" Environment and Planning C: Government and Policy 33(2) 305 –320
[9] Congleton R D, 2006 “Asymmetric federalism and the political economy of decentralization”, in Handbook of fiscal federalism Eds E Ahmad, G Brosio (Edward Elgar)
[10] CORA (Comisión Virtual para la Reforma de las Administraciones Públicas), 2013, Reforma de las Administraciones Públicas, Ministerio de Hacienda y Administraciones Públicas, Madrid
[11] Cuenca A, 2015, “Autonomía y corresponsabilidad: La política tributaria de las comunidades autónomas de régimen común” Papeles de Economía Española 139, 97-114
[12] Davezies L, 2015 Le nouvel égoïsme territorial (La République des idées- Seuil) [13] De la Fuente A, 2011, "¿Está bien calculado el cupo?" Moneda y Crédito 231 93-
150 [14] De la Fuente A, 2013, "Las finanzas autonómicas en boom y en crisis (2003-12)"
Hacienda Pública Española/Revista de Economía Pública 205 (2) 127-150 [15] Durán J M, 2008, La descentralització de l’IVA en fase minorista (Generalitat de
Catalunya, Departament d’Economia i Finances, Barcelona) [16] Eyraud L, Lusinyan L, 2011, “Decentralizing spending more than revenue: Does it
hurt fiscal performance?” IMF Working Paper 11/226
19
[17] Fernández-Leiceaga X, 2014, “La equidad horizontal en el modelo de financiación de 2009 de las comunidades autónomas españolas de régimen común” Papeles de Economía Española 143 152-173
[18] Fernández-Leiceaga X, Lago-Peñas S, 2013, "Sobre el reparto de los derechos de déficit entre las comunidades autónomas: una propuesta alternativa" Revista de Economía Aplicada 63 117-136
[19] Fernández-Leiceaga X, Lago-Peñas S, 2014, “El modelo de financiación autonómica desde la perspectiva de los gobiernos autonómicos” Investigaciones Regionales 30 159-196
[20] Foremny D, 2014, “Sub-national deficits in European countries: The impact of fiscal rules and tax autonomy” European Journal of Political Economy 34 86-110
[21] Gascón J, 2014, “La gestión de los impuestos: en busca de una administración tributaria eficiente“ Papeles de Economía Española 139 153-173
[22] Gómez-Reino J L, Herrero A, 2011, "Political determinants of regional financing: the case of Spain" Environment and Planning C: Government and Policy 29(5) 802–820
[23] Greer S, 2010, "Territorial politics in hard times: the welfare state under pressure in Germany, Spain, and the United Kingdom" Environment and Planning C: Government and Policy 28(3) 405–419
[24] Hernández de Cos P, Pérez J, 2013, “The new budgetary stability law”, Economic Bulletin of Bank of Spain April 65-78
[25] IGAE (Intervención General de la Administración del Estado), 2015 Operaciones no financieras del sector de Administraciones Públicas y sus subsectores. Datos anuales. SEC 2005. Base 2008
[26] Lagares, M. (chairman) 2014, Comisión de Expertos para la reforma del Sistema Tributario Español. Informe Ministerio de Economía y Hacienda, 2014
[27] Lago-Peñas I, Lago-Peñas S, 2010, “Decentralization and electoral accountability” Environment and Planning C: Government and Policy 28 318-344
[28] Lago-Peñas S, 2014, “Fiscal consolidation in Spain: Situation and outlook” Spanish Economic and Financial Outlook (3) 3 45-52
[29] Lago-Peñas S, 2015, “Remaining challenges to budgetary stability in Spain” Spanish Economic and Financial Outlook (4) 2 67-74
[30] Lago-Peñas S, Fernández-Leiceaga X, 2013, “Las finanzas autonómicas: expansión y crisis” Papeles de Economía Española 138 129-146
[31] Lago-Peñas S, Fernández-Leiceaga X, 2014, “Los límites a la redistribución entre territorios: un análisis comparado” Cuadernos de Información Económica 238, 77-85
[32] Lago-Peñas S, Fernández Llera R, 2011, “Ultraperiferia, economía y finanzas públicas de Canarias: una panorámica”, Revista de Estudios Regionales 90(1) 17-44
20
[33] Lago-Peñas S, Martínez-Vázquez J, 2010, “La descentralización tributaria de las Comunidades Autónomas de régimen común: un proceso inacabado” Hacienda Pública Española / Revista de Economía Pública 192(1/2010) 129-151
[34] Lago-Peñas S, Martínez-Vázquez J, 2015, “El sistema de financiación autonómica: ¿Quo vadis?” Papeles de Economía Española 143 2-14
[35] Lago Peñas S, Solé-Ollé A, 2016, “Multi-Level Finance and Governance in Spain: The Impact of the Euro Crisis” in Multi-Level Finance and the Euro Crisis: Causes and Effects Eds. E Ahmad, M Bordignon, G Brosio, in press.
[36] León S, 2009, “¿Por qué el sistema de financiación autonómica es inestable?” Revista Española de Investigaciones Sociológicas 128 57-87
[37] Lopez-Laborda J, Martinez-Vazquez J, Monasterio C, 2007, “The Practice of Fiscal Federalism in Spain” in The Practice of Fiscal Federalism: Comparative Perspectives Eds. A Shah (The Forum of Federations/ McGill-Queen’s University Press, Quebec)
[38] Martinez-Vazquez, J, Timofeev A, 2005, “Choosing Between Centralized and Decentralized Models of Tax Administration”, in Financiacion, Solidaridad Interterritorial y Politicas Tributarias de las Comunidades Autónomas Eds. N Bosch, J M Duran (Publicaciones de la Universitat de Barcelona, Barcelona)
[39] Mikesell J, 2003, “International Experiences with Administration of Local Taxes: A Review of Practices and Issues” Tax Policy and Administration Thematic Group, The World Bank.
[40] MINHAP (Ministerio de Hacienda y Administraciones Públicas), 2015, Liquidación de los Presupuestos de las Comunidades Autónomas, Secretaria de Estado de Administraciones Públicas.
[41] Montesinos A, Pérez J, Ramos R, 2014 El empleo en las Administraciones Públicas en España: caracterización y evolución durante la crisis (Documentos Ocasionales, 1402, Banco de España)
[42] OECD, 2013, Regions at a Glance, 2013 (OECD) [43] OECD, 2014, Indicadores de Bienestar
Regional, http://www.oecdregionalwellbeing.org [44] Onrubia J, 2015, “La gestión de los impuestos en un país descentralizado:
diagnóstico y líneas de reforma para España” Papeles de Economía Española 143 110-130
[45] Kingdom of Spain, 2012 Stability Programme Update, 2012-2015, Madrid [46] Zabalza A, López-Laborda J, 2014, “The Uneasy Coexistence of the Spanish Foral
and Common Regional Finance System” Instituto Valenciano de Investigaciones Económicas WP-EC 2014-02
[47] Zabalza A, López-Laborda J, 2015, “A vueltas con la autonomía tributaria” Papeles de Economía Española 143 94-109
[48] Zubiri I, 2015, “Un análisis del sistema foral de la comunidad autónoma del País Vasco y sus ventajas durante la crisis” Papeles de Economía Española 143 205- 223
21
FIGURES AND TABLES FIGURE 1: EXPENDITURE AND OWN REVENUES OF SUB-NATIONAL GOVERNMENTS OVER GENERAL GOVERNMENT, 2012 Percentage
Blue line: Expenditure of sub-central governments of total public expenditure Red Line: Weight of the resources out of transfers in the total resources of sub-central governments Source: OECD, 2013. Prepared by the authors. FIGURE 2: NON-FINANCIAL EXPENDITURES (EXCLUDING INTERGOVERMENTAL GRANTS), 1995-2013 Percentage of GDP, by levels of Government
Source: IGAE, 2015. Prepared by the authors.
0
0,1
0,2
0,3
0,4
0,5
0,6
0,7
0,8
Gre
ece
New
Zea
land
Turk
eyLu
xem
bour
gIre
land
Port
ugal
Isra
elSl
ovak
Rep
ublic
Hung
ary
Slov
enia
Fran
ceCz
ech
Repu
blic
Esto
nia
Uni
ted
King
dom
Icel
and
Italy
Pola
ndN
ethe
rland
sAu
stria
Nor
way
Japa
nO
ECD3
3 av
erag
eBe
lgiu
mFi
nlan
dKo
rea
Ger
man
yU
nite
d St
ates
Aust
ralia
Swed
enSp
ain
Mex
ico
Switz
erla
ndDe
nmar
kCa
nada
0
2
4
6
8
10
12
14
16
18
1995
1996
1997
1998
1999
2000
2001
2002
2003
2004
2005
2006
2007
2008
2009
2010
*
2011
*
2012
(P)*
2013
(A)*
AC SS CCAA CCLLcentral SS regional local
22
FIGURE 3: DEBT STOCK OVER NON-FINANCIAL EXPENDITURE, 1995-2013. EXPRESSED IN PERCENTAGE
Source: Bank of Spain and MINHAP, 2015. Prepared by the authors.
FIGURE 4: REGIONAL PUBLIC DEFICIT OVER GDP IN 2010 AND 2013. EXPRESSED IN PERCENTAGE
Source: IGAE, 2015. Prepared by the authors.
40
90
140
190
240
290
340
390
1995
1996
1997
1998
1999
2000
2001
2002
2003
2004
2005
2006
2007
2008
2009
2010
2011
2012
2013
ac+ss ccaa ccll total adm
-8-7-6-5-4-3-2-10
Com
unid
ad d
e M
adrid
País
Vasc
o
Gal
icia
Cast
illa
y Le
ón
Arag
ón
Astu
rias
Com
unid
ad F
oral
de
Nav
arra
Extr
emad
ura
Cana
rias
Anda
lucí
a
La R
ioja
Cant
abria
Cata
luña
Bale
ares
Com
unita
t Val
enci
ana
Regi
ón d
e M
urci
a
Cast
illa-
La M
anch
a
2010 2013(P)
local regional total central + SS
23
FIGURE 5: PER CAPITA REVENUES PROVIDED BY THE REGIONAL FINANCING SYSTEM IN 2011. Average = 100.
Source: Fernández Leiceaga, 2014
85
90
95
100
105
110
115
120
125CA
NTA
BRIA
LA R
IOJA
ARAG
ÓN
EXTR
EMAD
URA
CAST
ILLA
Y L
EÓN
ASTU
RIAS
GAL
ICIA
MAD
RID
I. BA
LEAR
ES
CATA
LUÑ
A
CAST
ILLA
-LA
MAN
CHA
ANDA
LUCÍ
A
MU
RCIA
C.VA
LEN
CIAN
A
CAN
ARIA
S
24
TABLE 1: Taxing powers of sub-central governments Source: Blöchliger and Nettley (2015)
Sub-central tax revenue As % of sub-central tax revenues
As % of total tax revenue
Discretion on rates and reliefs Discretion on rates Discretion
on reliefs Tax sharing arrangements Rates and reliefs set by CG
Other Total
Full Restricted Full Restricted Revenue split set by SCG
Revenue split set with SCG consent
Revenue Split set by CG, pluriannual
Revenue Split set by CG, annual
(a1) (a2) (b1) (b2) (c) (d1) (d2) (d3) (d4) (e) (f) Australia 18,7
States 15,3 100 - - - - - - - - - - 100 Local 3,4 100 - - - - - - - - - - 100
Austria 4,8 Länder 1,6 38,8 - - - - - - - - 46,6 14,6 100 Local 3,2 7,9 - - 15,1 - - - - - 61,6 15,4 100
Belgium 10,4 States 5,3 100,1 - - -0,6 - - - - - 0,5 - 100 Local 5,0 6,9 - 92,9 - - - - - - 0,3 - 100
Canada1 49,4 Provinces 39,7 88,9 - - - - - 3,2 - - - 7,9 100 Local 9,7 1,9 - 96,1 - - - - - - 0,6 1,5 100
Chile 6,6 Local 6,6 - - 16,7 24,9 - - - 58,3 - - 0,1 100
Czech Republic 1,2 Local 1,2 - - - 100 - - - - - - - 100
Denmark 26,7 Local 26,7 - - 87,1 11 - - - 1,9 - - - 100
Estonia 13,3 Local 13,3 0,5 - - 9,8 - - - 89,7 - - - 100
Finland 23,2 Local 23,2 - - 85,1 6,3 - - - - 8,6 0,1 0 100
France1 13,1 Local 13,1 44,9 - 14,7 3,3 0,3 0,1 - - 14,7 20,2 1,9 100
Germany 29,3 Länder 21,3 - - 3,1 - - - 93,6 - - - 3,3 100 Local 8,0 - - 15,1 43,3 - - 40,5 - - - 1,1 100
Greece 3,7 Local 3,7 - - - 75,8 - - - - - 23,8 0,4 100
Hungary 6,5 Local 6,5 - - - 84,2 - - - - 15,6 0,2 0,1 100
25
Iceland1 26,6 Local 26,6 - - - 99,3 - - - - - - 0,7 100
Ireland 3,3 Local 3,3 - - - - - - - - - - 100 100
Israel1,2 7,6 Local 7,6 - 5,2 - 94,8 - - - - - - - 100
Italy 15,9 Regions 11,7 - - - 47,1 - - 35,4 4,8 - 12,8 - 100 Local 4,2 36 - - 57,7 - - - - - 6,3 - 100
Japan 25,2 Local 25,2 - 0,1 60,4 24,4 - - - - - 15,2 - 100
Korea 16,3 Local 16,3 - - - 85,4 - - - - - 13,2 1,4 100
Luxembourg 4,7 Local 4,7 4,6 - - 92,6 - - - - - 1,1 1,7 100
Mexico 3,6 States 2,5 90,1 - 9,9 - - - - - - - - 100 Local 1,1 100 - - - - - - - - - - 100
Netherlands1 3,6 Local 3,6 - - 66,5 30,8 - - - - - - 2,7 100
New Zealand 7,3 Local 7,3 99,2 - - - - - - - - 0,8 - 100
Norway 12,1 Local 12,1 - - - 98,5 - - - - - 1,5 - 100
Poland 12,5 Local 12,5 - - - 36,5 - - - 59,3 - - 4,1 100
Portugal 6,6 Local 6,6 - - - 72,9 - - - 9,8 - 17,3 0 100
Slovak Republic 2,9 Local 2,9 4,4 - - 95,3 0,3 - - - - - - 100
Slovenia 10,9 Local 10,9 14,1 - - - - - - - 78,3 7,6 - 100
Spain 32,7 regions 23,1 57,3 - - 2,8 - - 39,7 - - 0,1 0 100 Local 9,6 28,8 - - 52,4 - - 17,9 - - 0,9 0 100
Sweden 35,7 Local 35,7 - - 97,4 - - - - - - 2,6 - 100
Switzerland 39,4 States 24,2 100 - - - - - - - - - - 100 Local 15,2 1,5 - - 98,5 - - - - - - - 100
Turkey1 8,8 Local 8,8 - - - - - - - 78,3 - 21,7 - 100
United kingdom 4,8
26
Local 4,8 - - - 100 - - - - - - - 100 United States 36,8
States 20,9 100 - - - - - - - - - - 100 Local3 15,9 - - - - - - - - - - 100 100
Unweighted average Subcentral
goverments4 15,4
States5 16,6 67,5 - 1,3 4,9 - - 17,2 0,5 - 6 2,6 100 Local 10,6 13,3 0,2 18,6 41,6 0 0 1,7 8,7 3,4 5,7 6,8 100
1) Provisional figures.
2) The statistical data for Israel are supplied by and under the responsibility of the relevant Israeli authorities. The use of such data by the OECD is without prejudice to the status of the Golan Heights, East Jerusalem and Israeli settlements in the West Bank under the terms of international law.
3) Local governments in the United States have a wide variety of taxing powers but it is not possible to identify the share of each.
4) This unweighted average applies to the sub-central revenue shares in the 34 OECD countries.
5) This unweighted average applies only to the 10 countries reporting State or Regional data. It includes Regional data for Italy and Spain.
27
TABLE 2: STRUCTURE OF REGIONAL NON-FINANCIAL REVENUES OF REGIONS (EXCLUDING FORAL REGIONS)
PERCENTAGES OF TOTAL NON-FINANCIAL REVENUE 1986 1991 1996 2001 2008 2012 Own and ceded taxes 14.45 16.44 12.76 13.79 13.91 10.4 Regional PIT 7.19 20.2 38.65 Fees and other own revenue 3.61 3.26 4.92 2.38 3.32 3.91 1. Total own non- financial revenues
18.06 19.7 17.68 23.36 37.43 52.96
PIT sharing 8.81 5.84 VAT sharing 16.81 29.95 Special taxes sharing 6.53 12.89 2. Total tax sharing 8.81 5.84 23.34 42.84 Unconditional grants 45.23 49.88 44.89 34.03 25.92 -3.45 Capital grants from the central government
8.62 2.82 1.69 1.19 0.95 0.64
Capital grants from the EU 2.88 6.34 11.67 2.12 2.62 Other grants 27.04 22.82 19.37 23.13 9.42 3.31 3. Total Grants 80.89 78.4 72.29 70.02 38.41 3.12 4. Other Non-Financial revenue
1.05 1.88 1.23 0.77 0.82 1.08
Source: Bosch and Durán (2005) for 1986, 1991, 1996 and 2001. Prepared by the authors for 2008 and 2012 based on MINHAP, 2015
28
TABLE 3: EVOLUTION OF EXPENDITURE DECENTRALIZATION NON-FINANCIAL EXPENDITURE PER CAPITA
Mean=1
Foral Common Extended
Common Reduced
1991 1.68 1.30 0.47
2002 1.28 1.00 0.95
2012 1.38 0.97 0.98
Source: Prepared by the authors, based on MINHAP, 2015
29
TABLE 4: REGIONAL ASYMMETRIES IN 2014
MODEL REGION SPENDING POWERS
CHARACTERISTICS OF THE FINANCING SYSTEM
FORAL
1. Basque country Extensive+ police+ local level+ language
Agreement + allowance Relations with foral treasuries Municipal financing
2. Navarre
Extensive+ police+ local level Agreement + provision
Provincial powers + language
Provincial treasury Municipal financing
COMMON EXTENSIVE
3. Catalonia Extensive+ police+ language Common model
4. Galicia Extensive+ language Common model
5. Andalusia Extended Common model
6. Valencia Extensive+ language Common model
7. Canary islands Extended Common model (special canary island system)
COMMON REDUCED MULTI-PROVINCE
8. Aragón Extended Common model 9. Castilla-La Mancha Extended Common model
10. Extremadura Extended Common model
11. Balearic islands Extensive+ language Common model
12. Castilla y León Extended Common model
REDUCED COMMON SINGLE PROVINCE
13. Asturias Extensive + provincial powers
Common model + provincial treasury
14. Cantabria Extensive + provincial powers
Common model + provincial treasury
15. Madrid Extensive + provincial powers
Common model + provincial treasury
16. Murcia Extensive + provincial powers
Common model + provincial treasury
17. La Rioja Extensive + provincial powers
Common model + provincial treasury
Source: Prepared by the authors.
30
TABLE 5. TAX AUTONOMY PROVIDED BY BOTH COMMON AND FORAL REGIMES
Source: Prepared by the authors. The Canary Islands have a special model. * This increment can be applied if both the gamblers and the organisers reside in the community. ** In the special tax on energy products, there is also a regional tariff. *** 100% for the regional tariff.
1. COMMON SYSTEM REGULATORY CAPACITY MANAGEMENT CAPACITY
COLLECTION
OWN TAXES YES: full YES 100% TAX ON INHERITANCES AND DONATIONS
YES: tariff, deductions and rebates YES 100%
PROPERTY TRANSFER TAX AND STAMP DUTY
YES: rates of taxation, deductions and rebates, except for corporate operations
YES 100%
TAX ON GAMBLING YES: exemptions, tax base, rates of taxation, fixed charges, rebates
YES 100%
SPECIAL TAX ON TRANSPORT VEHICLES
YES: rates of taxation. YES 100%
INCOME TAX YES: tariff and deductions NO 50% NET WEALTH TAX YES: threshold, tariff, deductions
and rebates NO 100%
CHARGES ON GAMBLING Increment (20%) on rates of taxation*
NO 100%
VAT NO NO 58% EXCISE DUTIES ON ALCOHOLIC BEVERAGES, ENERGY PRODUCTS, AND MANUFACTURED TOBACCO
NO** NO 58%***
SPECIAL TAX ON ELECTRICITY NO NO 100% 2. FORAL SYSTEM REGULATORY CAPACITY MANAGEMENT
CAPACITY COLLECTION
OWN TAXES YES: full YES 100% TAX ON INHERITANCES AND DONATIONS
YES: full YES 100%
PROPERTY TRANSFER TAX AND STAMP DUTY
YES: full, except for corporate operations
YES 100%
TAX ON GAMBLING YES: full, except in taxable transaction and taxable person
YES 100%
SPECIAL TAX ON TRANSPORT VEHICLES
YES: rates of taxation. YES 100%
INCOME TAX YES: full YES 100% INCOME TAX ON NON-RESIDENTS YES: full for permanent
establishments YES 100%
NET WEALTH TAX YES: full YES 100% CORPORATION TAX YES: full YES 100% CHARGES ON GAMBLING YES: Increment of 20% on rates of
taxation* YES 100%
VAT HARMONISED YES 100% EXCISE DUTIES ON ALCOHOLIC BEVERAGES, ENERGY PRODUCTS, AND MANUFACTURED TOBACCO
HARMONISED** YES 100%
SPECIAL TAX ON ELECTRICITY HARMONISED YES 100% TAX ON INSURANCES HARMONISED YES 100%
31
TABLE 6. EQUALIZATION: COMPARISON WITH RESULTS IN OTHER FEDERAL COUNTRIES
USA CANADA GERMANY-1 GERMANY-2 AUSTRALIA SPAIN 2012
REDUCTION OF DIFFERENCES
26.13 54.57 84.33 82.40 83.10 51.60
CORRELATION WITH RTCPC
1.00 0.82 0.72 -0.25 -0.30 0.15
CORRELATION WITH ENPC
-0.32 -0.50 -0.53 -0.35 1.00 0.63
Source: Prepared by the authors, based on MINHAP, 2015 Notes: REDUCTION OF DIFFERENCES Percentage fall in the standard deviation (SD) of the results, after equalisation, in relation to the SD of the RTCpc (prior to equalisation) CORRELATION WITH RTCpc: Correlation coefficient of the final results per capita with the RTCpc of each community. CORRELATION WITH ENpc Correlation coefficient of the final results per capita with the results per capita of the Australia simulation. FINAL RESULTS Financing per capita after equalisation RTCpc: Regulatory Tax Capacity per capita ENpc: Estimated expenditure needs per capita for the system