spain meeting evaluation
DESCRIPTION
Comenius Green Skills for Global Change evaluation of SP meetingTRANSCRIPT

www.1ka.si SPAIN MEETING EVALUATION
SPAIN MEETING EVALUATION ANALYSIS
XSPOL Spol:
Answers Frequency Percent Valid Cumulative
1 (Male) 3 43% 43% 43%
2 (Female) 4 57% 57% 100%
Valid Valid 7 100% 100%
Average 1.6 Std. deviation 0.5
XSTAR2a4 Age range
Answers Frequency Percent Valid Cumulative
1 (21 - 40 years) 3 43% 43% 43%
2 (41 - 60 years ) 3 43% 43% 86%
3 (61 years or more) 1 14% 14% 100%
Valid Valid 7 100% 100%
Average 1.7 Std. deviation 0.8
Q1 Rate the following activities
Subquestion Answers Valid Units AverageStd.
deviation
1 2 3 4 5 Valid
Q1a Accommodation 0 (0%) 0 (0%) 0 (0%) 1 (14%) 6 (86%) 7 (100%) 7 7 4.9 0.4
Q1b Transport 0 (0%) 1 (14%) 0 (0%) 2 (29%) 4 (57%) 7 (100%) 7 7 4.3 1.1
Q1c Cultural programme 0 (0%) 0 (0%) 1 (14%) 2 (29%) 4 (57%) 7 (100%) 7 7 4.4 0.8
Q1d Working sessions 0 (0%) 0 (0%) 2 (29%) 3 (43%) 2 (29%) 7 (100%) 7 7 4.0 0.8
Q1e Meals 0 (0%) 0 (0%) 0 (0%) 2 (29%) 5 (71%) 7 (100%) 7 7 4.7 0.5
Q1f Timetable 0 (0%) 0 (0%) 1 (14%) 2 (29%) 4 (57%) 7 (100%) 7 7 4.4 0.8
Q1g Impromevent of the relationships among teachers
0 (0%) 0 (0%) 0 (0%) 2 (29%) 5 (71%) 7 (100%) 7 7 4.7 0.5
Q1h Imporvement of the relationships among students
0 (0%) 0 (0%) 0 (0%) 3 (43%) 4 (57%) 7 (100%) 7 7 4.6 0.5
Q1i Documentation (minutes, ..)
0 (0%) 0 (0%) 0 (0%) 5 (71%) 2 (29%) 7 (100%) 7 7 4.3 0.5
14.07.2015 Page 1 / 3
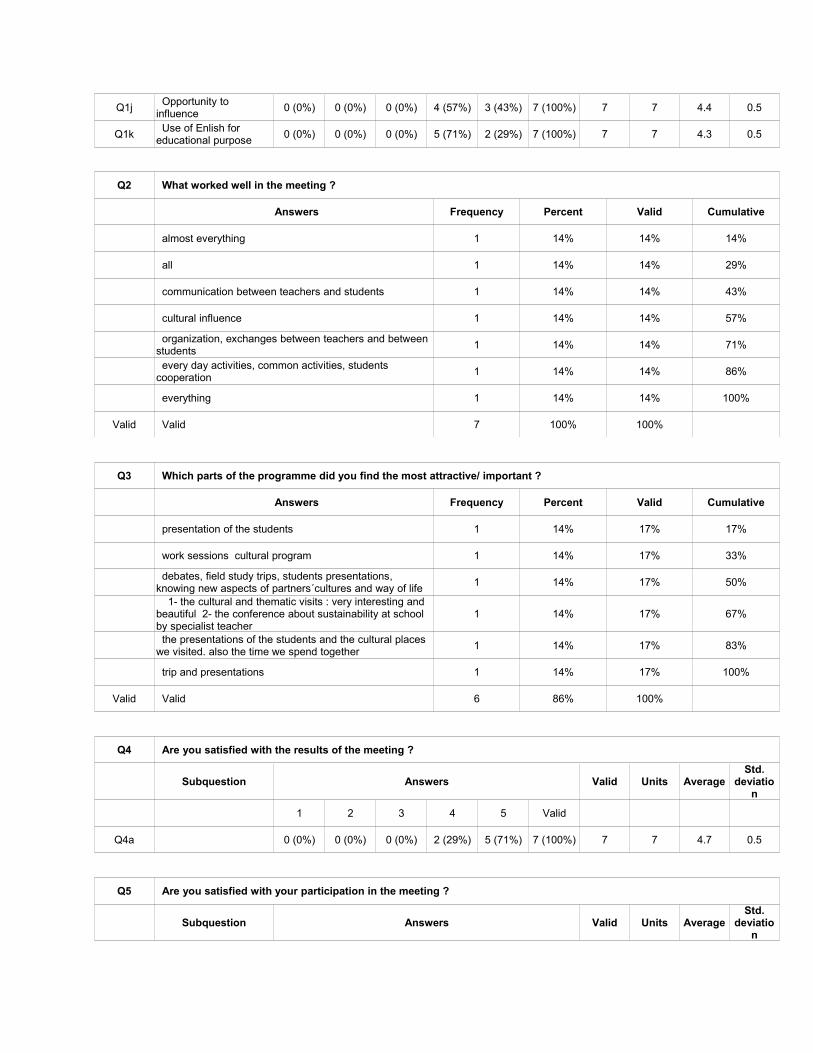
Q1j Opportunity to influence
0 (0%) 0 (0%) 0 (0%) 4 (57%) 3 (43%) 7 (100%) 7 7 4.4 0.5
Q1k Use of Enlish for educational purpose
0 (0%) 0 (0%) 0 (0%) 5 (71%) 2 (29%) 7 (100%) 7 7 4.3 0.5
Q2 What worked well in the meeting ?
Answers Frequency Percent Valid Cumulative
almost everything 1 14% 14% 14%
all 1 14% 14% 29%
communication between teachers and students 1 14% 14% 43%
cultural influence 1 14% 14% 57%
organization, exchanges between teachers and between students
1 14% 14% 71%
every day activities, common activities, students cooperation
1 14% 14% 86%
everything 1 14% 14% 100%
Valid Valid 7 100% 100%
Q3 Which parts of the programme did you find the most attractive/ important ?
Answers Frequency Percent Valid Cumulative
presentation of the students 1 14% 17% 17%
work sessions cultural program 1 14% 17% 33%
debates, field study trips, students presentations, knowing new aspects of partners´cultures and way of life
1 14% 17% 50%
1- the cultural and thematic visits : very interesting and beautiful 2- the conference about sustainability at school by specialist teacher
1 14% 17% 67%
the presentations of the students and the cultural places we visited. also the time we spend together
1 14% 17% 83%
trip and presentations 1 14% 17% 100%
Valid Valid 6 86% 100%
Q4 Are you satisfied with the results of the meeting ?
Subquestion Answers Valid Units AverageStd.
deviation
1 2 3 4 5 Valid
Q4a 0 (0%) 0 (0%) 0 (0%) 2 (29%) 5 (71%) 7 (100%) 7 7 4.7 0.5
Q5 Are you satisfied with your participation in the meeting ?
Subquestion Answers Valid Units AverageStd.
deviation

www.1ka.si SPAIN MEETING EVALUATION
1 2 3 4 5 Valid
0 (0%) 0 (0%) 0 (0%) 2 (29%) 5 (71%) 7 (100%) 7 7 4.7 0.5
Q6 Express your suggestions in order to improve the next meeting.
Answers Frequency Percent Valid Cumulative
it could be more organized 1 14% 25% 25%
this was the last meeting 1 14% 25% 50%
be sure the equipment actually works for the exposés or workshops (computer, projector, audio equipment)
1 14% 25% 75%
- 1 14% 25% 100%
Valid Valid 4 57% 100%
14.07.2015 Page 3 / 3