soybean research · editor (crop protection) : dr. h. c. phatak, visiting professor (plant...
TRANSCRIPT
SOYBEAN RESEARCH
Volume 11, Number 1: 2013
Society for Soybean Research and Development
Directorate of Soybean Research Khandwa Road, Indore 452 001
Madhya Pradesh, India
ISSN 0973-1830
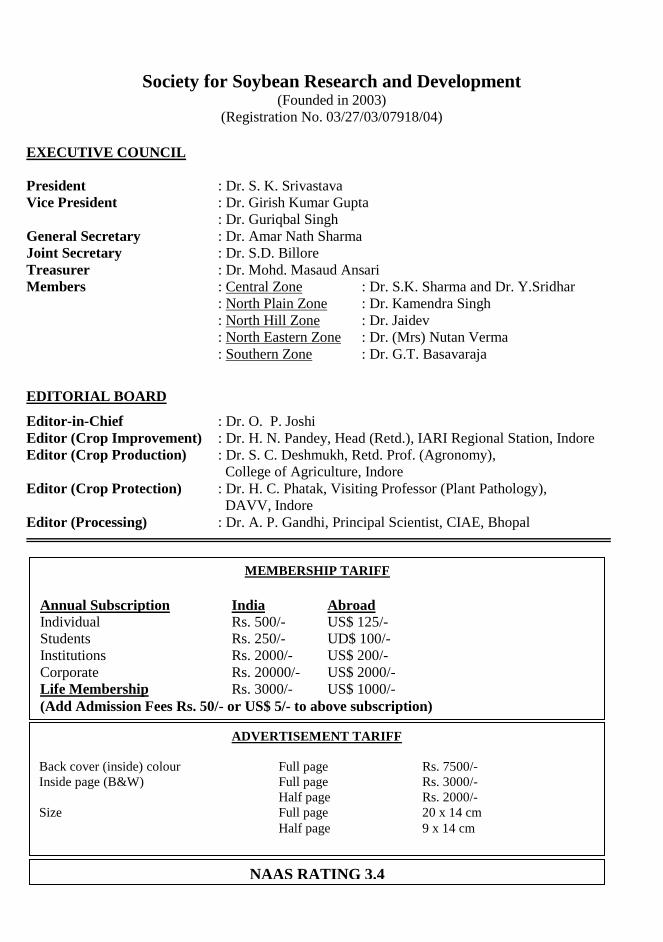
Society for Soybean Research and Development (Founded in 2003)
(Registration No. 03/27/03/07918/04)
EXECUTIVE COUNCIL
President : Dr. S. K. Srivastava
Vice President : Dr. Girish Kumar Gupta
: Dr. Guriqbal Singh
General Secretary : Dr. Amar Nath Sharma
Joint Secretary : Dr. S.D. Billore
Treasurer : Dr. Mohd. Masaud Ansari
Members : Central Zone : Dr. S.K. Sharma and Dr. Y.Sridhar
: North Plain Zone : Dr. Kamendra Singh
: North Hill Zone : Dr. Jaidev
: North Eastern Zone : Dr. (Mrs) Nutan Verma
: Southern Zone : Dr. G.T. Basavaraja
EDITORIAL BOARD
Editor-in-Chief : Dr. O. P. Joshi
Editor (Crop Improvement) : Dr. H. N. Pandey, Head (Retd.), IARI Regional Station, Indore
Editor (Crop Production) : Dr. S. C. Deshmukh, Retd. Prof. (Agronomy),
College of Agriculture, Indore
Editor (Crop Protection) : Dr. H. C. Phatak, Visiting Professor (Plant Pathology),
DAVV, Indore
Editor (Processing) : Dr. A. P. Gandhi, Principal Scientist, CIAE, Bhopal
MEMBERSHIP TARIFF
Annual Subscription India Abroad
Individual Rs. 500/- US$ 125/-
Students Rs. 250/- UD$ 100/-
Institutions Rs. 2000/- US$ 200/-
Corporate Rs. 20000/- US$ 2000/-
Life Membership Rs. 3000/- US$ 1000/-
(Add Admission Fees Rs. 50/- or US$ 5/- to above subscription)
ADVERTISEMENT TARIFF
Back cover (inside) colour Full page Rs. 7500/-
Inside page (B&W) Full page Rs. 3000/-
Half page Rs. 2000/-
Size Full page 20 x 14 cm
Half page 9 x 14 cm
NAAS RATING 3.4

SOYBEAN RESEARCH
ISSN 0973-1830 Volume 11, Number 1 : 2013
_____________________________________________________________________
CONTENTS Research papers Variability and Character Association Studies Among Different Germplasm Sub-
groups in Soybean [Glycine max (L.) Merrill] 1
Dinesh K Agarwal and Gajendra Bhawsar
Effect of Sulphur and Boron Levels on Productivity, Quality and Profitability of Soybean [Glycine max (L.) Merrill] in Vertisols under Rainfed Conditions
14
M D Vyas and Rupendra Khandwe
Effect of Organic and Inorganic Farming Systems on Physico-chemical Properties of Vertisols under Soybean - Wheat Cropping System
22
R Gallani, S K Sharma, P Sirothia and O P Joshi
Effect of Gypsum as a Source of Sulphur on Soybean [Glycine max (L.) Merrill] at Farmers Field on Malwa Region of Madhya Pradesh
29
S K Verma, SRS Raghuwanshi, S C Tiwari and R Jain
Impact of New Water Management Practices on Productivity and Sustainability of Soybean Grown in the Chambal Command Area of South-Eastern Rajasthan
36
R S Narolia, Pratap Singh, I N Mathur and L L Panwar
Productivity, Sustainability and Stability of Soybean Based Cropping Systems under Different Tillage Systems
43
S D Billore, O P Joshi, A Ramesh and A K Vyas
A Study on Farmers’ Seed Replacement Rate of Soybean and Related Problems in Major Soybean Growing States
58
B U Dupare, S D Billore and S K Verma
Yield Performance of Soybean in Vindhyan Plateau of Madhya Pradesh 66 R K Singh, S R K Singh, T K Singh, U S Gautam and A K Dixit
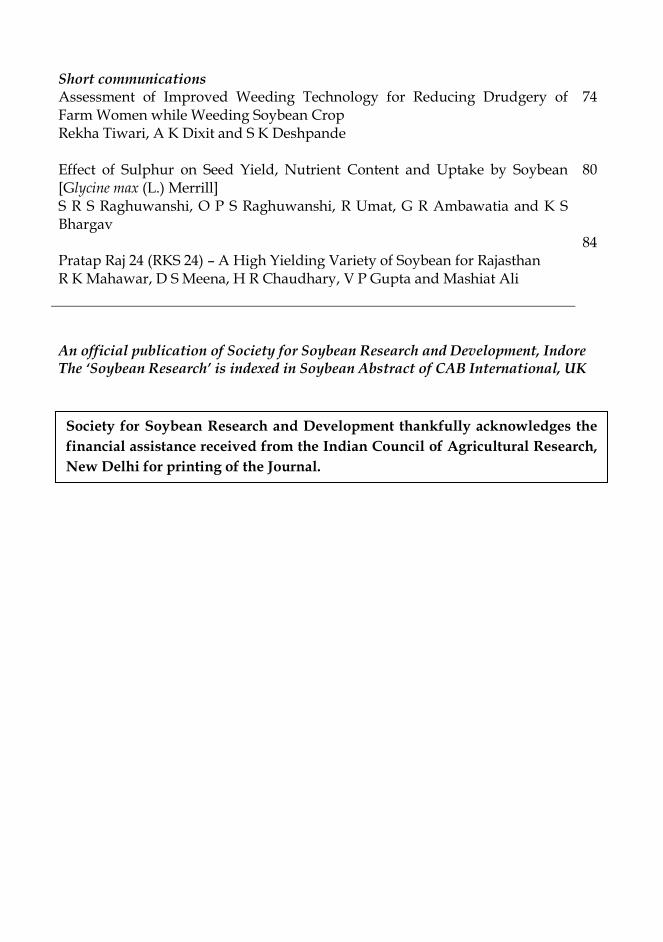
Short communications Assessment of Improved Weeding Technology for Reducing Drudgery of Farm Women while Weeding Soybean Crop
74
Rekha Tiwari, A K Dixit and S K Deshpande
Effect of Sulphur on Seed Yield, Nutrient Content and Uptake by Soybean [Glycine max (L.) Merrill]
80
S R S Raghuwanshi, O P S Raghuwanshi, R Umat, G R Ambawatia and K S Bhargav
Pratap Raj 24 (RKS 24) – A High Yielding Variety of Soybean for Rajasthan
84
R K Mahawar, D S Meena, H R Chaudhary, V P Gupta and Mashiat Ali
An official publication of Society for Soybean Research and Development, Indore The ‘Soybean Research’ is indexed in Soybean Abstract of CAB International, UK
Society for Soybean Research and Development thankfully acknowledges the
financial assistance received from the Indian Council of Agricultural Research,
New Delhi for printing of the Journal.
1
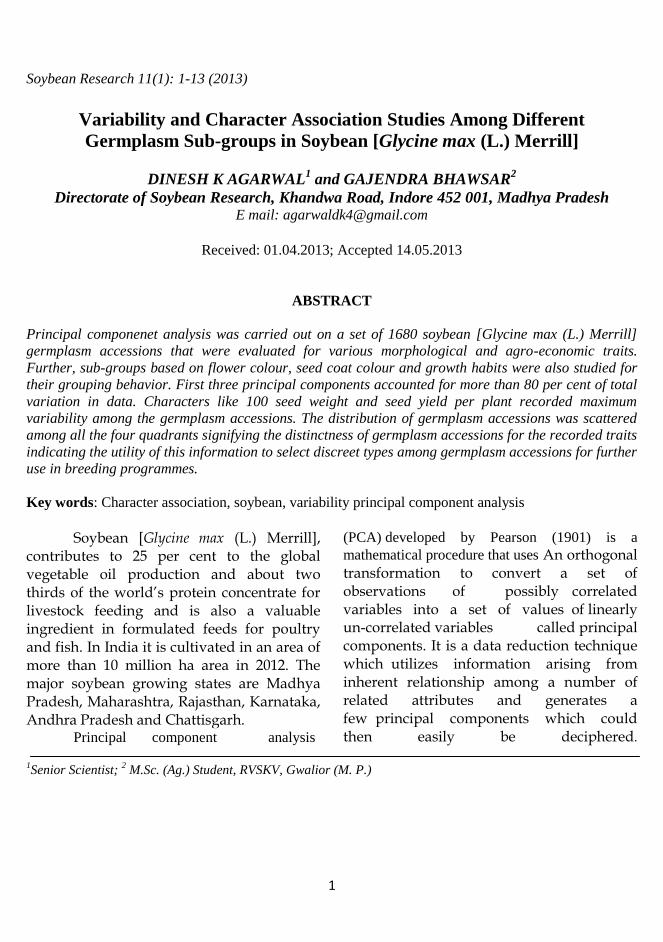
Soybean Research 11(1): 1-13 (2013)
Variability and Character Association Studies Among Different
Germplasm Sub-groups in Soybean [Glycine max (L.) Merrill]
DINESH K AGARWAL1 and GAJENDRA BHAWSAR
2
Directorate of Soybean Research, Khandwa Road, Indore 452 001, Madhya Pradesh E mail: [email protected]
Received: 01.04.2013; Accepted 14.05.2013
ABSTRACT
Principal componenet analysis was carried out on a set of 1680 soybean [Glycine max (L.) Merrill]
germplasm accessions that were evaluated for various morphological and agro-economic traits.
Further, sub-groups based on flower colour, seed coat colour and growth habits were also studied for
their grouping behavior. First three principal components accounted for more than 80 per cent of total
variation in data. Characters like 100 seed weight and seed yield per plant recorded maximum
variability among the germplasm accessions. The distribution of germplasm accessions was scattered
among all the four quadrants signifying the distinctness of germplasm accessions for the recorded traits
indicating the utility of this information to select discreet types among germplasm accessions for further
use in breeding programmes.
Key words: Character association, soybean, variability principal component analysis
Soybean [Glycine max (L.) Merrill],
contributes to 25 per cent to the global vegetable oil production and about two thirds of the world‟s protein concentrate for livestock feeding and is also a valuable ingredient in formulated feeds for poultry and fish. In India it is cultivated in an area of more than 10 million ha area in 2012. The major soybean growing states are Madhya Pradesh, Maharashtra, Rajasthan, Karnataka, Andhra Pradesh and Chattisgarh.
Principal component analysis
(PCA) developed by Pearson (1901) is a
mathematical procedure that uses An orthogonal transformation to convert a set of observations of possibly correlated variables into a set of values of linearly un-correlated variables called principal components. It is a data reduction technique which utilizes information arising from inherent relationship among a number of related attributes and generates a few principal components which could then easily be deciphered.
1Senior Scientist;
2 M.Sc. (Ag.) Student, RVSKV, Gwalior (M. P.)
2
MATERIAL AND METHODS
The present investigation was carried out in the experimental fields of Directorate of Soybean Research (ICAR) Indore (Madhya Pradesh) during kharif season of 2011-12. Indore is situated between latitude 22°43' N and longitude 75°66' E and at an altitude of 555.7 metres above the mean sea level. Indore belongs to sub-tropical semi-arid region with an average annual rainfall of 954.5 mm. Most of the rains are received through South West Monsoon during rainy season (mid-June to third week of September). The total rainfall received during the crop season 2011-12 was 1377.8 mm with 56 rainy days, the maximum temperature ranged from 26.20 to 33.30C, minimum temperature from 14.80 to 24.50 C and range of relative humidity was 78 to 94.2 per cent.
A set of 1680 soybean germplasm accessions have been evaluated in augmented design. All the recommended package of practices was followed to harness the maximum potential of genotypes under study. The genotypes were planted in a row (single or double) length of 3 m The observations on the following agro-economical traits namely, plant height (cm), days to flowering, days to maturity, number of nodes per plant-1, number of branches per plant-1, number of pod clusters per plant-1, number of pods per plant-1, seed yield per plant-1 and seed index (g/100 seeds) were recorded on five randomly selected plants for following characters in each genotypes. The mean value for the treatment was computed
by taking average. In present investigation, principal component analysis was taken up among total germplasm evaluated along with separately among sub-groups based on flower colour, seed coat colour and growth habit. The growth habit is an important trait defining suitability of a variety in any production niche while seed coat colour is the trait that affects its market value; moreover these traits are important in germplasm studies as categorization benchmark. The basic purpose of this study was to investigate whether variability pattern and character inter-relationship was same across these groups or formed a distinct pattern. RESULTS AND DISCUSSION
Performing classificatory analysis on a group of entities based on observations on multiple variables is a tedious job even with an aid of a computer. If entities concerned are germplasm accessions, grouping analysis assumes special importance. The use of established multivariate statistical algorithms is an important strategy for classifying germplasm, ordering variability for a large number of accessions, or analyzing genetic relationships among traits in any breeding materials. Multivariate analytical techniques, which simultaneously analyze multiple measurements on each individual under investigation, are widely used in analysis of genetic diversity irrespective of the dataset (morphological, bio-chemical, or molecular marker data). Only if available
3
genetic diversity could be categorized in to distinct categories along with an insight of genetic variability within each sub group, the information could be utilized in formulating a proper breeding strategy in a trait specific improvement programme. Principal Component Analysis (PCA) as a data reduction technique is one of the most important technique that helps in arriving at such meaningful information.
In the present investigation, PCA analysis was performed for entire collection as well as sub-categories based on flower colour, growth habit, seed coat colour etc. Principal component analysis in all these sets and sub-sets revealed that there is a tremendous variability among the germplasm accessions. There are a number of genotypes that are scattered far across the origin point, manifesting presence of many distinct types from the average representative. Presence of distinct types among the main set and various sub-sets could directly be utilized in secondary selections for the trait of interest or through hybridization in an appropriate breeding programme. Among total 1680 germplasm evaluated, Figure 1 describes that first three principal components describe more than 80 per cent of total variation in data. As is evident from vector length for various quantitative traits; characters like seed yield per plant, total number of pods per plant and days to flowering recorded maximum variability among the germplasm accessions. Similarly, the distribution of germplasm accessions is
also scattered among all the four quadrants signifying the distinctness of germplasm accessions for all the recorded traits. This information can very well be utilized while selecting discreet types among germplasm accessions for further use in breeding programmes. The traits that share same sign for PCA 1 and PCA 2 are positively correlated and this information can be taken account of while formulating selection indices. As is evident from Figure 1, seed yield is positively correlated with number of pod clusters per plant, total number of pods per plant and 100 seed weight. The accessions having higher number for these traits could be utilized in breeding programmes that aim at increasing seed yield through associated traits.
Among purple flower accessions also the trend depicted was very similar to that registered in case of whole group analysis (Fig. 2). The first three principal components explained more than 85 per cent variation in data. Among traits, 100 seed weight, seed yield per plant, total number of pods per plant and days to flowering recorded maximum variability among the pink flowered germplasm accessions. The character association also depicted the same trend as was evident in case of whole group. Among white flower accession, first three principal components explained only 60 per cent of variation among data and biplot depicting traits and accessions on PCA 1 and PCA 2 could only explain 50 per cent of variation through these two axes (Fig. 3). As per vector length, highest variability was
4
recorded for 100 seed weight, seed yield per plant, total number of pods per plant and days to flowering; but character association among this group registered a different pattern. Days to flowering and 100 seed weight recorded a much higher significant association with seed yield per plant than previous two groups (Fig. 3).
Soybean is a photosensitive crop and has a narrow adaptation to varying climatic conditions; hence, the growth habit of genotypes to a large extent determines its specific adaptation to a given agro-ecological niche. Among growth habit patterns, for determinate growth habit, first three principal components explained only 51 per cent of variation among data and biplot depicting traits and accessions on PCA 1 and PCA 2 could only explain 42 per cent of variation through these two axes (Fig. 4). Traits namely, plant height, seed yield per plant, total number of pods per plant and days to flowering recorded highest variability among accessions. Similarly, the distribution of germplasm accessions is also very scattered among all the four quadrants signifying the distinctness of germplasm accessions for all the recorded traits. Among character association, seed yield per plant recorded significantly similar trends with number of pods, number of nodes, leaf length: breadth ratio and seed index (Fig. 4). Seed yield like determinate growth habit displayed a greater harmony with total number of pods per plant, number of pod clusters per plant and plant height (Fig. 5).
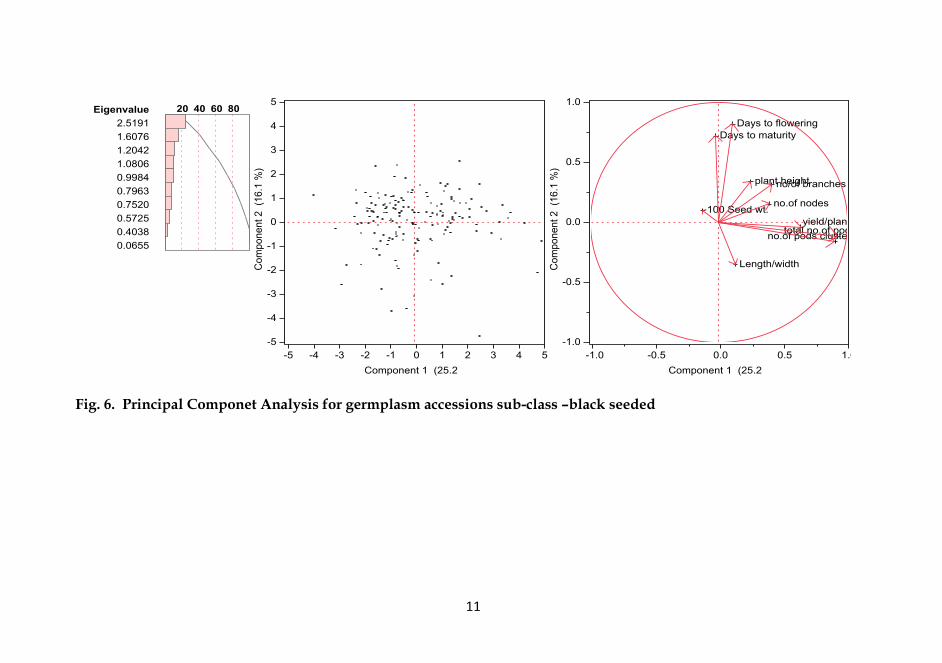
Seed coat colour is a factor that largely determines the consumer preference towards a variety. Therefore, the experimental lot was subdivided into two categories of black seeded and yellow/green seeded type to further subject them to PCA analysis so as to ascertain the variability parameters and character association among these two groups. Among black seeded types, first three principal components explained only 63 per cent of variation among data and biplot depicting traits and accessions on PCA 1 and PCA 2 could only explain 42 per cent of variation through these two axes (Fig. 6). Traits namely, seed yield per plant, total number of pods per plant and days to flowering recorded highest variability among accessions. Germplasm accessions were also scattered among all the four quadrants signifying the distinctness of germplasm accessions for all the recorded traits. Among character association, seed yield per plant recorded significantly similar trends with total number of pods and number of pod clusters per plant (Fig. 6).
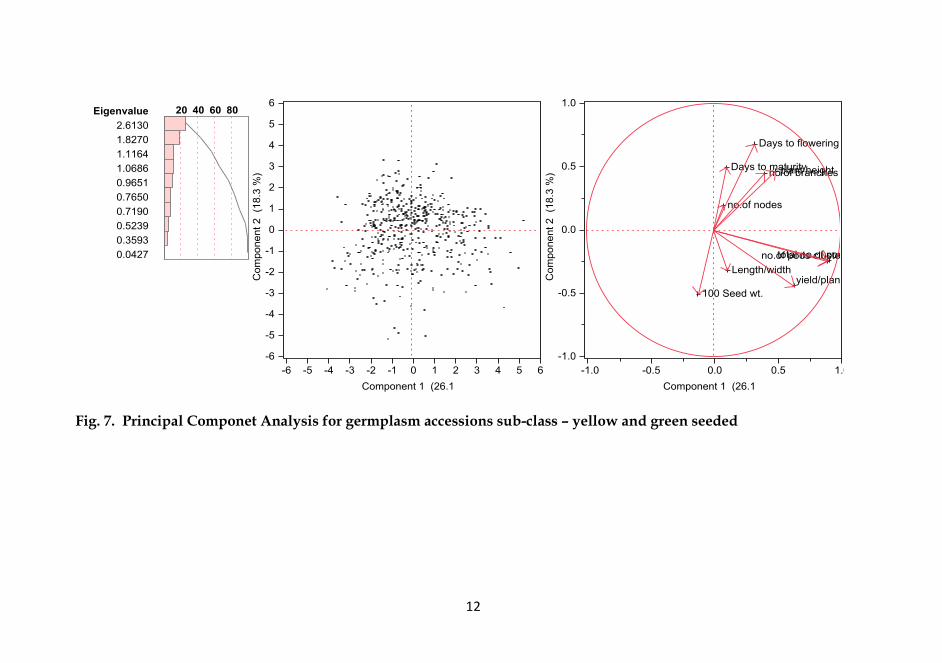
Among yellow/green seeded types, first three PCA explained 55 per cent of variation in data while the biplot depicting first two components accounted for nearly 45 per cent of total variation. Similar to black-seeded types, traits namely, seed yield per plant, total number of pods per plant and days to flowering recorded highest variability among accessions (Fig. 7). While seed yield per plant among yellow/green seeded type

5
appeared to be a function of 100 seed weight, total number of pods, number of pod clusters per plant and leaf length breadth ratio (Fig. 7).
Similar variability has been studied by a number of workers in soybean and other agricultural crops using principal component analysis. Broschat (1979) considered PCA as powerful technique for data reduction which removes inter-relationships among components. Results reported by various researchers showed multivariate analysis as a valid system to deal with germplasm collection. Smith et al. (1995) conducted average linkage cluster and principal component analyses, and reported the utility of these results in preservation and utilization of germplasm. Extent of diversity and relationship among Brassica juncea germplasm from Pakistan for 35 morphological characters in 52 accessions were determined by Rabbani et al. (1998) the using cluster and principal component analysis. Ghafoor et al. (2001) studied genetic diversity in blackgram germplasm accessions. In yet another study involving PCA, Elizabeth et al. (2001) investigated 19 sesbania accessions to characterize them on basis of morphological and agronomic data. Ghafoor et al. (2003) evaluated chickpea accessions by using multivariate techniques. The first three principal components with eigenvalues >1 contributed 83.3 per cent of the variability amongst genotypes.
Among soybean agronomic traits, Truong et al. (2005) studied yield and yield
components. The metric observations were analysed using principal component analysis and significant diversity was observed for these traits. Zafar Iqbal et al. (2008) and Malik et al. (2011) also in their respective studies involving soybean germplasm accessions recorded significant diversity for yield and associated traits using principal component analysis. Principal component analysis is comparatively better than other diversity measures owing to its data reduction abilities which otherwise are possible with other techniques, hence, the classification of a large group for a number of attributes becomes less cumbersome.
The present investigation in light of results obtained and other germplasm studies based on Principal Component Analysis demonstrated that days to flowering, days to maturity, number of branches, number of nodes, number of pod clusters, total number of pods, number of seeds per plant and 100 seed weight are the important agro-economic traits that individually or as an yield associated trait hold special importance for all the soybean breeders. Principal component analysis among the whole set as well as subsets emphasized the presence of significant diversity albeit in varying magnitude among different groups for days to flowering, days to maturity, number of pod clusters, total number of pods, seed yield per plant and 100 seed weight. This variability could be significantly harnessed through a soybean breeding programme.

6
Fig. 1. Principal Componet Analysis for total germplasm evaluated

7
Fig. 2. Principal Componet Analysis for germplasm accessions sub-class –purple flowered

8
Fig. 3. Principal Componet Analysis for germplasm accessions sub-class –white flowered

9
Fig. 4. Principal Componet Analysis for germplasm accessions sub-class – determinate

10
Fig. 5. Principal Componet Analysis for germplasm accessions sub-class – semi and indeterminate
11
Fig. 6. Principal Componet Analysis for germplasm accessions sub-class –black seeded
12
Fig. 7. Principal Componet Analysis for germplasm accessions sub-class – yellow and green seeded

13
REFERENCES Broschat T K. 1979. Principal component analysis
in horticultural research. Horticulture Science 14: 114-17.
Ghafoor A, Gulbaaz F N, Afzal M, Ashraf M and Arshad M. 2003. Inter-relationship between SDS-PAGE markers and agronomic traits in chickpea (Cicer arietinum L.). Pakistan Journal of Botany 35(4): 613-24.
Ghafoor A, Sharif A, Ahmad Z, Zahid M A and Rabbani M A. 2001. Genetic diversity in blackgram (Vigna mungo (L.) Hepper). Field Crops Research 69: 183-190.
Malik M F A, Ashraf M, Qureshi A S and Khan M R. 2011. Investigation and comparison of some morphological traits of the soybean populations using cluster analysis. Pakistan Journal of Botany 43(2): 1249-55.
Pearson K. 1901. On Lines and Planes of Closest Fit to Systems of Points in Space(PDF). Philosophical Magazine 2(11): 559–72.
Rabbani M A, Iwabuchi A, Murakami Y, Suzuki T and Takayanagi K. 1998. Phenotypic variation and the relationship among mustard (Brassica juncea L.) germplasm from Pakistan. Euphytica 101: 357-66.
Smith S E, Guarino L, Doss A A and Conta D M. 1995. Morphological and agronomic affinities among Middle Eastern alfalfas accessions from Oman and Yemen. Crop Science 35: 1188-1194.
Truong Ngon T, Jae-Gyun Gwag, Yong-Jin Park, and Suk-Ha Lee. 2005. Genetic diversity of soybean pod shape based on elliptic fourier descriptors. Korean Journal of Crop Science 50(1): 60-6.
Zafar Iqbal, Arshad M, Ashraf M, Naeem R, Malik M F and Waheed A. 2010. Genetic divergence and correlation studies of soybean [Glycine Max (L.) Merrill] genotypes. Pakistan Journal of Botany 42(2): 971-6.
14
Soybean Research 11(1): 14-21 (2013)
Effect of Sulphur and Boron Levels on Productivity, Quality and Profitability of Soybean [Glycine max (L.) Merrill] in Vertisols
under Rainfed Conditions
M D VYAS1 and RUPENDRA KHANDWE2 RAK, College of Agriculture, Rajmata Vijyaraje Scindia Krishi Vishwa
Vidyalaya, Sehore 466 001, Madhya Pradesh (E-mail: [email protected])
Received: 19.12.2011; Accepted 04.09.2012
ABSTRACT
A field experiment was conducted on clayey loam soil of Sehore, Madhya Pradesh, during kharif seasons of 2007 and 2008, to study the effect of sulphur and boron levels on physiological parameters, productivity, soil fertility and economics of soybean under rainfed conditions. The twenty five treatment combinations comprised of five sulphur levels viz., 0, 10, 20, 30, 40 and five boron levels viz., 0, 0.5, 1.0, 1.5, 2.0 kg per ha as basal. Progressive increase in sulphur and boron levels increased crop growth rate, total chlorophyll content, pods per plant and seed yield. But significant response of sulphur application was obtained up to 20 kg per ha and it gave CGR (10.94 g/m2/day), total chlorophyll content (2.55 mg/g/fresh weight), number of pods per plant (24.19), harvest index (42.91 %), and seed yield (2 059 kg/ha), being 33.74, 13.33, 9.35, 4.92 and 12.14 per cent higher, respectively over control. The crop responded up to 0.5 kg boron per ha which increased the pods per plant by 7.04 and seed yield by 6.33 per cent over non application of boron. CGR and total chlorophyll content were found significantly superior at 1.5 kg B per ha. The uptake of sulphur in seed (6.82 kg/ha) and straw (4.8 kg/ha 9) was significantly higher up to 10 kg S per ha. The significant higher value of oil was obtained at 10 kg S per ha and 0.5 kg B per ha whereas, protein was significantly higher at 30 kg S per ha and 2.0 kg B per ha. The interaction effect between sulphur and boron in all the parameters was not significant. Key words: Boron, economics, nutrient uptake, soybean, sulphur
Soybean (Glycine max L. Merrill) with its 40-42 per cent protein and 20-22 per cent oil has already emerged as one of the major oilseed crop in India. In spite of its high yield
potential (4.5 tonnes/ha), soybean productivity is much less in India (1.07 tonnes/ha) than the world average of 2.43 tonnes per ha (FAOSTAT, 2011).
1Principle Scientist; 2Associate Professor
15
Among the factors responsible for low productivity, inadequate fertilizer use and emerging secondary and micronutrient deficiencies play an important role. Several workers reported sulphur deficiency in soybean crop in Madhya Pradesh due to use of S–free fertilizers and adoption of high yielding varieties that remove more S from soil. Besides, sulphur requirement of soybean crop is high which remains uncared because of practice of applying high analysis fertilizer like di-ammonium phosphate. Adequate supply of sulphur has been reported to enhance photosynthetic efficiency and productivity of Brassica genotypes (Ahmad and Abdin, 2000). Boron is one of the essential micronutrient and it enhances the crop yields. It has seen that places of high metabolic activities i.e. cell division, flowering, fruiting and seed development etc. in a plant requiring more quantities of sugar. It is believed that boron facilitates the translocation of sugars in plants. Moreover, due to low crop productivity in the rainfed regions, it is assumed that mining of secondary and micronutrients are much less as compared to irrigated agriculture (Rego et al., 2003). A field experiment was, therefore, conducted to study the effect of sulphur and boron levels on crop growth, yield, nutrient uptake, soil fertility status and economics of soybean. MATERIAL AND METHODS
The field experiment was conducted during the kharif seasons of 2007 and 2008 at
College of Agriculture, Sehore, replicated three times in factorial randomized block design. The soil was Vertisols (Chromusterts) clayey loam with organic carbon content 0.42 per cent and available N, P2O5 and K2O 210.6, 15.80 and 285 kg per ha, respectively. Soil was neutral in reaction (pH 7.50) with initial status of sulphur 5 ppm and boron 1.09 ppm. The twenty-five treatment combination comprised of five sulphur levels viz., 0, 10, 20, 30, 40 kg per ha and five boron levels viz., 0, 0.5, 1.0, 1.5, 2.0 kg per ha as basal application through gypsum and borax, respectively. A uniform basal dose of NPK fertilizers and all the recommended package of practices were followed for raising the crop. Seeds of soybean „JS 93-05‟ inoculated with Bradyrhizobium japonicum and PSB were sown at 45 cm row spacing on 29th June, 2007 and 27th June, 2008. The total rainfall received during the crop season was 766 and 706 mm in 2007 and 2008, respectively. Chlorophyll content in leaves of soybean was determined at 45 DAS using standard procedure (Yoshida et al., 1972). The crop growth rate was worked out in between 30 - 45 and 45 - 60 DAS (Watson, 1952), and economics was calculated as per prevailing market prices.
RESULTS AND DISCUSSION Morphological and physiological parameters
The significant effect of sulphur on CGR and total chlorophyll content with successive increase of S levels was noted.
16
While non-significant differences were recorded with plant height and branches per plant. The maximum CGR (8.60 and 11.52 g/m2/day) was recorded with highest S level 40 kg per ha and the lowest (CGR 5.35 and 8.18 g/m2/day) with control in between 30–45 and 45–60 days after sowing (DAS), respectively (Table 1). Total chlorophyll content differed significantly with S levels 20, 30 and 40 kg per ha over control and 10 kg S per ha. Tandon et al. (2007) reported that sulphur functions in many ways resembling those of nitrogen in enhancement of crop growth and formation of chlorophyll that permits the photosynthesis.
Application of boron @ 1.5 and 2.0 kg per ha increased CGR by 8.70 and 8.85 g per m2 per day at 30–45 DAS, 11.08 and 11.16 g per m2 per day at 45–60 DAS and total chlorophyll content 2.55 and 2.58 mg per g fresh weight at 45 DAS, respectively. However, the differences among 0, 0.5 and 1.0 kg B per ha were recorded statistically non-significant. Molegarrd and Hardman (1980) also reported that B deficiency caused flowering and reproductive failure, rosetting of terminal buds, small leaves and chlorosis. Yield and yield attributes
Sulphur @ 30 and 40 kg per ha increased the pods per plant by 11.88 and 14.33 per cent, seeds per pod by 2.10 and 3.60 per cent, harvest index by 6.77 and 7.77 per cent and straw yield by 4.73 and 4.54 per cent, respectively over the control (Table 1). The increase in seed yield by 17.32 and 18.57
per cent was recorded with 30 and 40 kg S per ha, respectively over the control. The difference in yield between 30 and 40 kg S per ha levels was statistically non-significant. The increased yield under sulphur fertilization might be ascribed to increased pods per plant and seeds per pod with heavier seeds. A significant and positive correlation was noted in between seed yield with pods per plant (r = 0.99) and seeds per pod (r = 0.85). It indicated that when sulphur was applied, a significant and strong correlation was observed. Similarly, when boron was applied, a significant positive correlation was noted between seed yield and pods per plant (r = 0.98). Whereas, non-significant weak correlation were observed between seed yield and seeds per pod (r = 0.64). Thus, significant improvement in yield obtained under sulphur fertilization seems to have resulted owing to increased concentration of sulphur in various parts of plant that helped maintain the critical balance of other essential nutrients in the plant and resulted in enhanced metabolic processes. Vyas et al. (2006) and Khatik et al. (1992) also noticed increased yield of soybean with application of sulphur. Sulphur plays a vital role in improving vegetative structure for nutrient absorption, strong sink strength through development of reproductive structures and production of assimilates to fill economically important sink (Sharma and Singh, 2005).
Application of boron 0.5, 1.0, 1.5 and 2.0 kg per ha significantly increased

17
Table 1. Effect of levels of sulphur and boron on morphological, physiological parameters, yield attributes and yield
on soybean (Pooled data of 2007 and 2008)
Treatments Plant height (cm)
Bran-ches (No/
plant)
CGR (g/m2/day)
Total chlorophyll
(mg/g fresh weight)
Pods (No/plant))
Seeds (No/pod)
Seed yield
(kg/ha)
Straw yield
(kg/ha)
Harvest index
(%) 30 -45 DAS
45 -60 DAS
Sulphur level ( kg/ha)
0 59.04 2.32 5.35 8.18 2.25 22.12 3.33 1836 2638 40.87
10 61.14 2.35 7.82 10.88 2.48 23.29 3.36 1937 2675 41.89
20 60.54 2.33 8.10 10.94 2.55 24.19 3.35 2059 2721 42.91
30 61.48 2.38 8.30 11.16 2.78 24.75 3.40 2154 2763 43.64
40 60.47 2.32 8.60 11.52 2.80 25.29 3.45 2177 2758 44.04
SEm (+) 0.91 0.15 0.70 0.90 0.10 0.53 0.04 36.89 88 0.91
CD at 5% NS NS 2.18 2.65 0.30 1.53 NS 105.62 NS 2.57
Boron level (kg/ha)
0 59.54 2.30 5.90 8.38 2.22 22.00 3.30 1910 2661 41.46
0.5 60.64 2.37 6.92 9.30 2.38 23.55 3.45 2031 2624 43.59
1.0 60.57 2.32 7.25 9.45 2.45 24.40 3.38 2054 2733 42.68
1.5 60.08 2.30 8.70 11.08 2.55 24.53 3.39 2064 2734 42.77
2.0 60.84 2.40 8.85 11.16 2.58 25.34 3.38 2102 2801 42.76
SEm (+) 0.91 0.15 0.70 0.90 0.10 0.53 0.04 36.89 88 0.91 CD at 5% NS NS 2.18 2.65 0.30 1.53 NS 105.62 NS NS
18
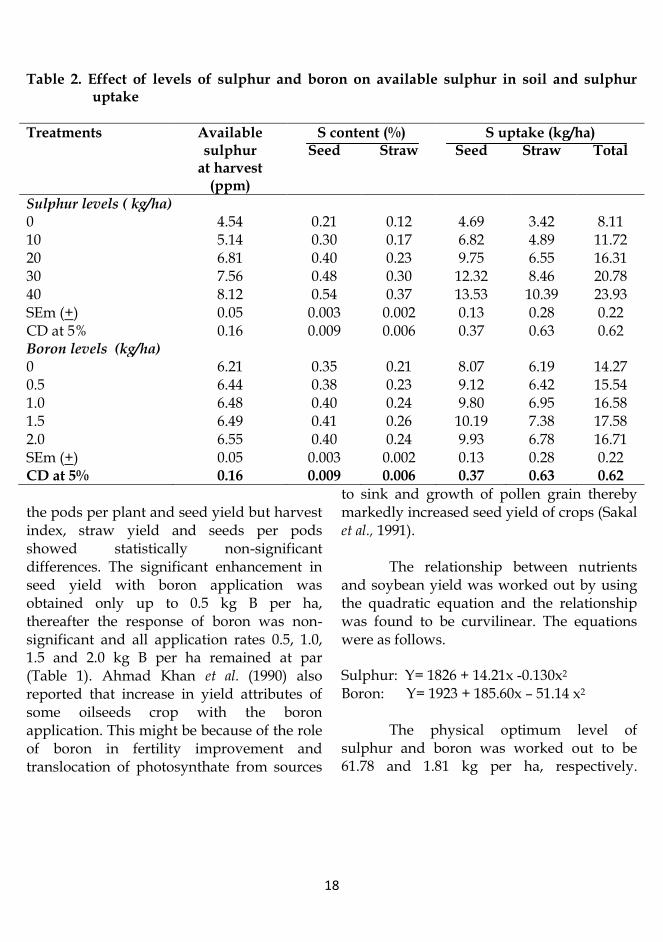
Table 2. Effect of levels of sulphur and boron on available sulphur in soil and sulphur uptake
Treatments Available sulphur
at harvest (ppm)
S content (%) S uptake (kg/ha) Seed
Straw
Seed
Straw
Total
Sulphur levels ( kg/ha) 0 4.54 0.21 0.12 4.69 3.42 8.11 10 5.14 0.30 0.17 6.82 4.89 11.72 20 6.81 0.40 0.23 9.75 6.55 16.31 30 7.56 0.48 0.30 12.32 8.46 20.78 40 8.12 0.54 0.37 13.53 10.39 23.93 SEm (+) 0.05 0.003 0.002 0.13 0.28 0.22 CD at 5% 0.16 0.009 0.006 0.37 0.63 0.62 Boron levels (kg/ha) 0 6.21 0.35 0.21 8.07 6.19 14.27 0.5 6.44 0.38 0.23 9.12 6.42 15.54 1.0 6.48 0.40 0.24 9.80 6.95 16.58 1.5 6.49 0.41 0.26 10.19 7.38 17.58 2.0 6.55 0.40 0.24 9.93 6.78 16.71 SEm (+) 0.05 0.003 0.002 0.13 0.28 0.22 CD at 5% 0.16 0.009 0.006 0.37 0.63 0.62
the pods per plant and seed yield but harvest index, straw yield and seeds per pods showed statistically non-significant differences. The significant enhancement in seed yield with boron application was obtained only up to 0.5 kg B per ha, thereafter the response of boron was non-significant and all application rates 0.5, 1.0, 1.5 and 2.0 kg B per ha remained at par (Table 1). Ahmad Khan et al. (1990) also reported that increase in yield attributes of some oilseeds crop with the boron application. This might be because of the role of boron in fertility improvement and translocation of photosynthate from sources
to sink and growth of pollen grain thereby markedly increased seed yield of crops (Sakal et al., 1991).
The relationship between nutrients
and soybean yield was worked out by using the quadratic equation and the relationship was found to be curvilinear. The equations were as follows. Sulphur: Y= 1826 + 14.21x -0.130x2
Boron: Y= 1923 + 185.60x – 51.14 x2 The physical optimum level of
sulphur and boron was worked out to be 61.78 and 1.81 kg per ha, respectively.

19
Table 3. Effect of levels of sulphur and boron on oil and protein content, net returns and cost benefit ratio (Pooled data of 2007 and 2008)
Treatments Oil content (%)
Protein content (%)
Net returns (INR/ha)
B:C ratio
Sulphur level (kg/ha) 0 18.02 35.55 18824 2.92 10 19.15 36.66 20388 3.07 20 19.37 37.77 22178 3.24 30 19.75 38.74 23558 3.35 40 19.79 39.66 23910 3.36 SEm (+) 0.01 0.95 -- -- CD at 5% 0.05 2.86 -- -- Boron level (kg/ha) 0 18.62 35.29 21269 3.47 0.5 19.06 37.51 22510 3.41 1.0 19.33 37.76 22114 3.20 1.5 19.36 37.94 21530 3.00 2.0 19.37 38.39 21435 2.86 SEm (+) 0.01 0.95 -- -- CD at 5% 0.05 2.86 -- --
However, the economic optimum level of sulphur and boron was 56.83 and 1.58 kg per ha with the yield levels of 2, 213.70 and 2, 088.58 kg per ha, respectively. Nutrient uptake
Sulphur application induced marked increase in the S content and uptake in seed and straw. Sulphur levels 10 to 40 kg per ha recorded significant differences with S content in seed and straw and S uptake by seed, straw and total uptake over control. Successive increase in S fertilization significantly increased the S uptake up to 40
kg S per ha. The crop fertilized with 10, 20, 30 and 40 kg S per ha recorded 44.44, 100.99, 156.11 and 194.94 per cent higher total S uptake, respectively over the control (8.112 kg/ha). Increase in net depletion of soil S was not only by the removal of the seed, but also by the straw from the field (Tandon et al., 2007). Similarly the increase in B levels from 0 to 2.0 kg per ha, improved the S content in seed and straw and S uptake by seed, straw and total biomass produced but the margin between successive level was significant only up to 1.5 kg B per ha.
Available S at harvest ranged from 5.14 to 8.12 and 6.44 to 6.55 ppm with
20
application of 10 to 40 kg S per ha and 0.5 to 2.0 kg B per ha, respectively (Table 2). This increase in S can be ascribed to the influence of applied S on availability of S in the soil and its extraction by plants as well as increase in crop yield Quality parameters
The increasing levels of sulphur significantly improved the quality of soybean in terms of protein and oil content. The increase in oil content by 1.77 percentage points and protein by 4.11 percentage points with the application of 40 kg S per ha over control (18.02 and 35.55 %, respectively) was noticed (Table 3). Increase in oil content due to sulphur application can be attributed to the key role played by sulphur in biosynthesis of oil in oilseed plants. The increase in protein content may be accounted for the increase in synthesis of sulphur containing amino acids. Such beneficial effects of sulphur fertilization were also reported by Sharma (2003), Tandon et al. (2007) and Raghuwanshi et al. (2009). Boron application up to 2 kg per ha increased the protein and oil content but was at par with 1.5 kg per ha dose. Similar results have also
reported by Chaturvedi et al. (2010). Economics
Among the S levels, maximum net returns was recorded with 40 kg S per ha, whereas benefit cost ratio 3.36 and 3.35 was mostly equal with 40 and 30 kg S per ha, respectively. In case of boron, net returns increased with successive fertilization rate. However, the cost benefit ratio recorded with control was superior 3.47 followed by 3.41, 3.20, 3.00 and 2.86 with 0.5, 1.0, 1.5 and 2.0 kg B per ha.
This behaviour of economic parameters due to S and B levels was change in marginal seed yield of the crop with successive increase in fertilizer nutrient and relative cost of inputs in relation to output. Tandon et al. (2007) also reported that S application is highly profitable as shown by value cost ratio of 21.2 in soybean under field condition.
Thus, it may be concluded that application of sulphur @ 20 kg per ha and boron @ 0.5 kg per ha were found beneficial for enhancing soybean productivity in Vertisols under rainfed conditions of Madhya Pradesh.
REFERENCES Ahmad A and Abdin M Z. 2000. Photosynthesis
and its related physiological variables in the leaves of Brassica genotypes as influenced by sulphur fertilization. Physiologia Planetarium 110: 144–149.
Ahmad Khan, Venugopal T, Devaih K C and Seenapa K. 1990. Effect of secondary nutrients and boron on growth characters and yield in sunflower. Journal of Oilseeds Research 7(2): 136-9.

21
Chaturvedi Sumit, Chandel A S, Dhyani V C and Singh A P. 2010. Productivity, profitability and quality of soybean (Glycine max) and residual soil fertility as influenced by integrated nutrient management. Indian Journal of Agronomy 55(2): 133-7.
FAOSTAT. 2011. A publication of Statistics Division of Food and Agriculture Organization, United Nations.
Khatik S K, Mahajan J P and Vishwakarma S K. 1992. Effect of sulphur and phosphorus levels on phosphorus, sulphur, calcium and magnesium content at different growth stages of soybean in Vertisol. JNKVV Research Journal 28(1): 56–9.
Molegarrd P and Hardman R. 1980. Effect of boron on growth and yield of various crops. Journal of Agriculture Sciences 94: 455- 60.
Raghuwanshi S R S, Raghuwanshi O P S, Umat R, Ambawatia G R and Bhargav K S. 2009. Effect of different doses of sulphur on productivity and quality of soybean (Glycine max). Soybean Research 7: 93-5.
Rego T J, Sahrawat K L, Wani S P and Pardhasaradhi G. 2003. Widespread deficiencies of sulphur, boron and zinc in Indian semi-arid tropical soils: on farm
crop responses. Journal of Plant Nutrition 30: 1569–83.
Sakal R. 1991. Relative susceptibility of some important varieties of sesame and mustard to boron deficiency in calcareous soil. Fertilizer News 36(3): 43-6
Sharma O P and Singh G D. 2005. Effect of sulphur in conjunction with growth substances on productivity of cluster bean and their residual effect on barley. Indian Journal of Agronomy 50(1): 16-8.
Sharma R K. 2003. Effect of sulphur application on seed yield, nutrient content and uptake by soybean (Glycine max (L.) Merrill). Haryana Journal of Agronomy 19: 71-3.
Tandon H L S and Messick D L. 2007. Practical Sulphur Guide, pp 1-22. The Sulphur Institute, Washington, D.C.
Vyas A K, Billore S D, Joshi O P and Pachlania N. 2006. Productivity of soybean (Glycine max) genotypes as influenced by nitrogen and sulphur nutrition. Indian Journal of Agricultural Sciences 76(4): 272-3.
Watson D J. 1952. The physiological basis of variation in yield. Advances in Agronomy 4: 101–144.
Yoshida S, Forno D A, Loc J H and Gomez K A. 1972 Laboratory Manual of Physiological Studies of Rice, IRRI. Pp. 30.

22
Soybean Research 11(1): 00-00
Effect of Organic and Inorganic Farming Systems on Physico- chemical Properties of Vertisols under Soybean - Wheat
Cropping System
R GALLANI1, S K SHARMA2, P SIROTHIA3 and O P JOSHI4
Mahatma Gandhi Chitrakoot Gramodaya Vishwavidyalaya, Chitrakoot, Madhya Pradesh
E mail: [email protected]
Received: 29.11.2011; Accepted: 15.10.2012
ABSTRACT Physico-chemical properties of Vertisols were studied under organic and inorganic farming systems during 2008-09 and 2009-10 at farmers’ fields of Indore district. Experiment was carried out in randomized block design with four treatments and five replications. Treatments comprised of organic farming ≥ 3 years, organic farming (< 3 years), RDF and farmers’ practice of nutrient application. Each farmer was taken as one replication. Significantly higher values for soil organic carbon content, available zinc content along with soil porosity and soil aggregation were recorded with organic farming systems. The soil N, P and K status were maximum in inorganic farming system followed by organic farming systems and farmers’ practice of nutrient application. The contrasting results were found in crop productivities of the two crops. Soybean productivity was higher in organic farming system (≥ 3 years) by 3.69 per cent over RDF (2088 kg/ha), while wheat productivity was higher in later one by 16.92 per cent over formers’ practice of nutrient application (3417 kg/ha). Non-significant differences were observed among the treatments for pH, EC and for available Cu, Fe and Mn. Key words: Physico-chemical properties, organic and inorganic farming systems
„Green Revolution‟ has shown path to
the country for self-sufficiency in food grain production, but the indigenous knowledge and local wisdom was ignored in adopting scientific approach, particularly in applying fertilizers. Most of
the agro- ecological regions now showing reduction in soil organic carbon contents consequent upon adoption of intensive cropping and improper crop management practices (Srinivasarao et al., 2006). As a result, soils are encountering
1Subject Matter Specialist; 2Senior Scientist, College of Agriculture, Indore; 3Associate Professor (MGCGVV), Chitrakoot; 4Emeritus Scientist, DSR, Indore

23
diversity of constraints broadly on account of physical, chemical and biological health and ultimately leading to poor soil quality. This shows signs of reversing trend in production at several places, in spite of increased inputs (Srinivasarao, 2011).
Several scientists and activists believe that agriculture in general and organic farming in particular is more specific with respect to local than global level due to vide variations in soil, climate and captive water resources. Since it is site specific farmer‟s knowledge and identification of local practices are important to create new approaches to achieve sustainability (Shroff, 1994 and Deshpande, 2009). To evaluate the influence of organic and inorganic management, the present study is planned with soybean [Glycine max (L.) Merrill] - wheat (Triticum aestivum L.) cropping system on Vertisols of Central India. MATERIAL AND METHODS
The experiment was laid out at the farmers‟ field located at different sites of Indore district (Madhya Pradesh) using randomized block design with four treatments, namely organic farming (≥ 3 years), organic farming (< 3 years), inorganic farming with recommended dose of fertilizers and farmers‟ practice of nutrient application, replicated 5 times (each farmer was taken as one replication). The study was carried out during rabi and kharif seasons of 2008-09 and 2009-10 in five villages namely,
Semliyachau, Asrawad Khurd, Badiya Khema, Ralamandel and Morod Haat of Indore district. These bio-villages were adopted by the Department of Farmers‟ Welfare and Agriculture Development (Government of Madhya Pradesh), where in farmers have been practicing organic farming for last 2-7 years.
The two organic farming treatments received NADEP compost @ 7.5 t per ha, vermicompost @ 2.5 t per ha, bio-gas slurry @ 2.0 t per ha and biofertilizers Rhizobium japonicum + PSB (for soybean) and azotobacter + PSB (for wheat) as seed inoculants @10 g per kg seed each and soil application @ 2 kg per ha. Inorganic farming treatment involved application of recommended levels of NP2O5K2O (120:60:30 kg/ ha) to wheat and NP2O5K2O (20:60:20 kg/ha) to soybean through chemical fertilizers. The above three treatments were evaluated over farmers‟ practice of application of NP2O5K2O (150:50:0 kg/ ha) to wheat and NP2O5K2O (40:40:0 kg/ha) to soybean through chemical fertilizers. The popular variety Lok-1 of wheat and JS-335 of soybean were grown in the experiment following standard package and practices. The data on various parameter recorded in both the years were pooled, statistically analysed and presented in the manuscript.
Soil samples (0-15 cm and 15-30 cm) were collected from the four systems evaluated and analysed. The soils of the study area was medium black (Sarol series), belonging to fine, Montmorillonitic,
24
hyperthermic family of Vertic Haplusterts. Standard methods as described by (Jackson, 1973) were used for soil analysis. Available micronutrients were extracted by using DTPA extractant (Lindsay and Norvell, 1978) and measured by using AAS (Perkin-Elmer model). The Soil bulk density was estimated by core sampler method given by Bodman (1942), soil porosity was computed by putting values in the formulae, soil aggregate analysis- Mean Weight Diameter (MWD) was estimated by wet sieving method using Yoder‟s apparatus (Yoder, 1936).
RESULTS AND DISCUSSION
Effect of different farming systems on chemical properties of soil
The pH and electrical conductivity were unaltered by various treatments under the study. The values of pH and EC for different treatments were ranged from 7.4 to 7.6 and from 0.19 to 0.21, respectively. This could be due to high buffering capacity of the soil, as reported by Palojarvi et al. (2002). Significant higher organic carbon content was noted in the organic farming system (5.58 to 6.32 g/kg soil) as compared to inorganic (4.86 g/kg soil) and farmers‟ practice of nutrient application (4.31 g/kg soil) (Table 1). This appeared feasible due to the direct and continuous addition of organic matter through organic sources. Bhandari et al. (1992) and Hapse (1993) reported similar increase in soil organic carbon content of soil due to continuous addition of organic
manures. The available nitrogen, phosphorus and potassium contents also revealed significant differences. The content of these major nutrients were maximum in inorganic system followed by organic systems and farmers‟ practice of nutrient application. The direct application of nitrogen through fertilizers leading to immediate availability could be accounted for higher nitrogen contents in inorganic systems. Comparatively lower nitrogen contents in organic system could be due to shift in biological activity (Petersen et al., 1999). Significantly lower phosphorus content in organic farming systems due to slow mineralization from native pool (Khan et al., 1984) and of potassium due to its release consequent upon interaction of organic matter with clay (Miller and Donahue, 1995) could be the possible explanations. The justifications also explain the higher content of these nutrients in organic systems over farmers‟ practice receiving unbalanced and skewed nutrition. As far as micronutrients are concerned, there were non-significant differences for the content of Cu, Fe, and Mn between different management systems. Zinc content was significantly higher (1.29 kg/ha) in the organic farming (≥ 3 years) as compared to
rest of the treatments (Table 1). Organic manures are known to naturally provide micronutrient as they store them in both stable and usable forms (Tisdale et al., 1993). The significant higher soil zinc content was also observed by Ramesh et al. (2010) in organic farming system.
25
Effect of different farming systems on physical properties of soil
A soil with good structure and stable aggregates will exhibit desirable values of bulk density and porosity for a given soil type that promotes adequate soil aeration and available water. These characteristics define the physical environment of the soil ecosystem and are critical for a healthy soil and sustainable agriculture. Enhanced soil structural properties are linked with increased soil organic matter (Tisdall and Oades, 1982) and the literature contains considerable evidence that a range of recycled organic amendments (composts or bio-solids) increases the organic matter of soil (Albiach et al., 2001).
The values for bulk density, porosity and mean weight diameter (MWD) for 0-15 cm and 15-30 cm, which are indicator of desirable soil structure and stable aggregates, were favourable in organic farming system (> 3 years) followed by organic farming system (< 3 years), inorganic system and farmers‟ practice of nutrient application (Table 2). The decrease in bulk density and increased aggregations on account of dilution effect of denser mineral fraction (Shiralipour et al., 1992) and increase in aggregation on account of binding effect of humic acid (Khaleel et al., 1981), particularly in organic systems is feasible. Enhanced soil structural properties are linked to increased soil organic matter has been brought forth in the present study.
Effect of different farming systems on crop productivity
The grain yield is the manifestation of various growth and yield attributing characters. In case of soybean, the higher productivity was obtained under organic farming (≥ 3 years) treatment, followed by inorganic farming with RDF (Table 2). On the contrary, in case of wheat, being cereal, the inorganic farming with RDF gave highest productivity as compared to rest of the treatments. Higher soybean productivity under organic systems as compared to farmers‟ practice of nutrient application, might be due to regulated availability of nutrients, throughout the crop growth as soybean gets majority of its nitrogen requirement through symbiotic N-fixation. Further, the addition of manure and bio-fertilizers causes increased activity of beneficial microorganisms which mediated biological process like N- fixation and P- solubilzation (Shwetha, 2007). Lower productivity of wheat under organic farming systems may be argued on the basis of slow mineralization of organic manure and non-availability of required nutrients, which resulted in a setback in crop growth at early stage of wheat and thus affected the crop yield (Prasad, 1994). The lower wheat productivity under organic farming system due to inadequate supply of nutrients during entire crop growth period through lower readily available nutrients has earlier been reported (Halberg and Kristensen, 1997).

26
Table 1. Soil chemical properties as influenced by organic and inorganic farming systems
Treatment pH EC
(dS/m)
Organic carbon
(g/kg soil)
Available
N (kg/ha)
P2O5 (kg/ ha)
K2O (kg/ha)
Zn (mg/kg
soil)
Fe (mg/kg
soil)
Cu (mg/kg
soil)
Mn (mg/kg
soil)
Initial status 7.5 0.20 4.50 195 12.50 480 1.10 6.10 1.92 5.43
Organic farming (≥ 3 years)
7.4 0.19 6.32 208.4 12.97 501.4 1.29 6.14 1.96 5.48
Organic farming (<3years)
7.5 0.20 5.58 197.8 12.64 471.7 1.17 6.10 1.93 5.46
Inorganic farming with RDF
7.5 0.20 4.86 219.1 13.34 507.4 1.09 6.09 1.92 5.43
Farmers‟ practice of nutrient application
7.6 0.21 4.31 187.2 11.64 446.0 1.01 6.02 1.91 5.40
SEm ( ±) 0.03
0.0036 0.17 0.64 0.03 5.63 0.01 0.03 0.01 0.02
CD at 5% NS NS 0.52 1.98 0.09 17.36 0.03 NS NS NS RDF- Recommended dose of fertilizers

27
Table 2. Soil physical properties and crop productivity as influenced by organic and inorganic farming systems
Treatment Bulk density
(Mg/m) Porosity
(%) MWD (mm)
Seed yield (kg/ha)
0-15 cm
15-30 cm
0-15 cm
15-30 cm
0-15 cm
15-30 cm
Soybean Wheat
T1 - Organic farming (≥ 3 years)
1.22 1.44 53.8 44.9 1.222 0.807 2165 3698
T2 - Organic farming (<3years)
1.28 1.53 50.5 42.1 1.118 0.660 1849 3376
T3 - Inorganic farming with RDF
1.31 1.56 48.1 41.4 0.969 0.597 2088 3995
T4 - Farmers‟ practice of nutrient application
1.37 1.58 46.8 40.1 0.934 0.566 1576 3417
SEm (±) 0.01 0.01 0.21 0.40 0.030 0.010 0.16 0.29 CD at 5% 0.02 0.02 0.63 1.24 0.090 0.020 49 89 RDF- Recommended dose of fertilizers
The present study indicated that continuous practising organic farming for extended period promoted favourable soil environment for the growing crops by improving soil organic carbon and soil physical properties leading to better seed yield of soybean than inorganic farming
system with RDF. However, the later one recorded better wheat yield along with higher residual major soil nutrients than the organic farming (≥ 3 years). The farmers‟ practices of nutrient application do not compete over other systems and needs to be revamped.
REFERENCES Albiach R, Canet R, Pomares F and Ingelmo F.
2001. Organic matter components and aggregate stability after the application of different amendments to a horticultural soil. Bioresource Technology 76: 125-29.
Bhandari A L, Sood Anil, Sharma K N and Rana D S. 1992. Integrated nutrient management in a rice-wheat system. Journal of Indian Society of Soil Science 40: 742-7.
Bodman G B. 1942. Nomograms for rapid calculation of soil density, water content
and total porosity relationship. Journal of American Society of Agronomy 34: 833-839
Deshpande W R. 2009. Basics of organic farming. All India Biodynamic and Organic Farming Association, Indore, pp 81-83.
Halberg N and Kristensen I S. 1997. Expected crop yield loss when converting to organic dairy farming in Denmark. Biological Agriculture and Horticulture 14: 25–41.

28
Hapse D G. 1993. Organic farming in the light of reduction in use of chemical fertilizers. Proceedings of 43rd Annual Deccan Sugar Technology Association, Pune, Part-I, pp. SA37-SA51.
Jackson M L. 1973. Soil Chemical Analysis, Prentice Hall of India Pvt. Ltd., New Delhi.
Khaleel R, Reddy K R and Overcash M R. 1981. Changes in soil physical properties due to organic waste applications: a review. Journal of Environmental Quality 10: 133-41.
Khan G, Gupta S K and Banerjee S K. 1984. Studies on solubilization of phosphorus in presence of different city wastes. Journal of Indian Society of Soil Science 29: 123-4.
Lindsay W L and Norvell W A. 1969. Equilibrium relationships of Zn2+, Fe2+, Ca2+ and H+ with EDTA and DTPA in soil. Soil Science Society of America Proceedings 33: 62-8.
Miller R W and Donahue R L. 1995. Soils in Our Environment (7th Edition). Prentice Hall, Englewood Cliffs, New Jersey, 649 pp.
Palojarvi A, Alakkuku L, Martikainen E, Marina N, Vanhala P, Jorgensen K and Esala M. 2002. 17th WCSS, 14-21 August, 2002. Thailand.
Petersen C, Drinkwater L and Wagoner P. 1999. The Rodale Institute Farming System Trial: The first 15 years. The Rodale Institute, Kutztown, PA, p. 40. www.rodaleinstitute.org.
Prasad B. 1994. Integrated nutrient management for sustainable agriculture. Fertilizer News 39(9): 19-25.
Ramesh P, Panwar N R, Singh A B, Ramana S, Yadav S K, Shrivastava Rahul and Subba
Rao A. 2010. Status of organic farming in India. Current Science 98(9): 1190-1194.
Shiralipour A, McConnell D B and Smith W H. 1992. Physical and chemical properties of soils as affected by municipal solid waste compost application. Biomass and Bioenergy 3: 261-6.
Shroff V N. 1994. Organic Farming- selected lectures, training programme on organic farming organized by Government of India, State Government of Madhya Pradesh and Jawaharlal Nehru Krishi Vishwa Vidyalaya, Jabalpur at College of Agriculture, Indore, pp 1-6.
Shwetha B N. 2007. Studies on nutrient management through organics in soybean – wheat cropping system. M. Sc. Thesis, University of Agricultural Sciences, Dharwad
Srinivasarao Ch., Vittal K P R, Gajbhiye P N and Venkateswarlu B. 2006. Indian Journal on Dryland Agricultural Research and Development 21(5): 105-13.
Srinivasarao Ch. 2011. Nutrient management strategies in rainfed agriculture: constraints and opportunities. Indian Journal of Fertilizers 7(4):12-25.
Tisdale S L, Nelson W L, Beaton J D and Havlin J L. 1993. Soil Fertility and Fertilizers. 5th ed. Macmillan Publ. Co., New York, 634 pp.
Tisdall J M and Oades J M. 1982. Organic matter and water-stable aggregates in soils. Journal of Soil Science 33: 141-63.
Yoder R E. 1936. A direct method of aggregate analysis and a study of the physical nature of erosion losses. Journal of American Society of Agronomy 28: 237-51.
29
Soybean Research 11(1): 29-35 (2013)
Effect of Gypsum as a Source of Sulphur on Soybean [Glycine max (L.) Merrill] at Farmers Field on Malwa Region
of Madhya Pradesh
S K VERMA1, S R S RAGHUWANSHI2, S C TIWARI3 and R JAIN4 Department of Soil Science and Agricultural Chemistry,
Rajmata Vijayaraje Scindia Krishi Vishwa Vidyalaya, Gwalior 474 002, Madhya Pradesh
Received: 24.08.2011; Accepted: 12.10.2012
ABSTRACT
Demonstrations were conducted for three consecutive years (kharif 2006 to 2008) at 5 farmers’ fields during each year, to observe the effect of graded levels of gypsum on production potential and economic benefits of soybean cultivation. The average plant height, number of pods per plant and number of seeds per pod of soybean increased significantly with the increase in gypsum application rates beyond 0.2 t per ha over control. The mean seed index (g/100 seeds) also increased with the increasing levels of gypsum. The maximum plant height (55.48 cm) and number of pods per plant (44.26) were recorded on application of gypsum @ 0.2 t per ha, however, maximum number of seeds per pod (2.75) and seed index (14.12 g/100 seeds) was noticed when gypsum was applied @ 0.3 t per ha. The highest seed (2 591 kg/ha) and stover (2 784 kg/ha) yields were recorded on application of gypsum @ 0.3 t per ha, which was statistically at par with @ 0.2 t per ha. The content of N, P, K and S in seed increased significantly with the increased level of gypsum application as compared to control. The highest content of N (6.53 %), P (0.51 %), K (2.39 %) and S (0.33 %) was recorded with application of gypsum @ 0.2 per t ha. The computed value cost ratio (VCR) indicated that the increased rate of gypsum application was invariably beneficial to the farmers. Soybean crop gave highest return (INR 26.30) on single rupee invested on gypsum when applied @ 0.2 t per ha. Key words: Economics, gypsum, soybean, yield
During past four decades of its
commercial venture, soybean has established itself as a major kharif season oilseed crop in India, particularly in central part of the country. Madhya Pradesh has its major
share in area of 5.51 million hectare (59.3 %) with production of soybean of 6.10 mt (60.2 %) in India (www.sopa.org). Although, the soybean research and development system in the
1Professor; 2Associate Professor; 3Scientist; 4Research Associate
30
country has generated viable production technology to raise the productivity to more than 80% from the present level of around 1.0 tons per hectare, it appears that there are impediments in reaching to end users creating a technological gap (Bhatnagar, 2009). To convince the soybean growers on effectiveness of technology and to motivate them for adoption, conduct of demonstrations is one of the proven methods. The low productivity of soybean may be due to nutritional deficiencies and also imbalanced fertilization amongst the nutrients, sulphur is one of them whose response is observed in soybean (Prasad, 2006). Non-judicious use of chemical fertilizers, intensive cultivation of crops, higher cropping intensity and limited use of organic matter are the most possible causes for sulphur deficiency limiting soybean yield. MATERIAL AND METHODS
Front line demonstrations were conducted for three consecutive years (2006-08) on farmers fields (5 farmers every year) covering eight adopted villages (Dakachya and Barlai of Sanwer tehsil, Panod and Balyakheda of Indore tehsil and Agra, Hatod, Sagwal and Budania of Depalpur tehsil) of Indore district of Madhya Pradesh under rainfed condition. The soil of the demonstration sites was medium black soil with low to medium fertility status (pH-7.80, EC-0.67 dSm-1, available N 191.8 kg/ha, available P2O5 12.65 kg/ha, available K2O 585 kg/ha and available S 10.53 kg/ ha). Each
demonstration was conducted on an area of 0.4 hectare and the same area adjacent to the demonstration plot was kept as farmers practice. The experiment consisted of four levels of gypsum as fertilizer 0, 0.1, 0.2 and 0.3 t per ha. Package of improved technologies included high yielding, short duration variety (JS 93-05), recommended level of fertilizer application (25:60:30, N: P2O5: K2O kg/ha) and hand weeding at 25 DAS. The soybean crop was sown between June 29th and 2nd July in 2006, June, 20th and 22nd in 2007 and June 15th and 28th in 2008 with seed rate 80 kg per ha at row to row spacing of 45 cm. Entire dose of N and P through DAP and K through MOP was applied as basal dose before sowing. Gypsum of agriculture grade (12.6% S) was used as a source of sulphur and applied before sowing of the crop. The seeds were treated with Bradyrhizobium japonicum and phosphate –solubilizing bacteria, each @ 10 g per kg seed. The crop was harvested in between October 7th and 10th in 2006, September 25th and 28th in 2007 and September 16th and 27th in 2008. The observations pertaining to yield attributing characters on five randomly selected plants, seed and stover yield of soybean were recorded and subjected to statistical analysis (Panse and Sukhatme, 1985) in randomized block design considering location (farmers) as replicate. The seed samples collected at harvest were analyzed for nitrogen (Kjeldhal, 1983) phosphorus by vanadomolybdo phosphoric yellow colour method in nitric acid system (Jackson, 1973), potassium (Black, 1965), sulphur by method given by Chesnin and

31
Yien (1950) and oil content as per AOAC (1984). RESULTS AND DISCUSSION Effect of gypsum (sulphur) on yield attributes
Application of gypsum contributed significantly in enhancing the growth attributes and yield during all the three years of demonstrations (Table 1). In general, there has been an increasing trend in values of mean plant height, number of pods per plant and number of seeds per pod of soybean with increasing levels of gypsum up to 0.2 t per ha. The values for plant height (55.48 cm) and pods per plant (44.26) were maximum at this level and were significantly higher than control (49.06 cm and 39.85, respectively). Mean seeds per plant and seed index (g/100 seeds) showed a regular increase with increasing levels of gypsum. These highest values for two yield attributing characters were associated with application of gypsum @ 0.3 t per ha. The seed index values differed significantly over control and other levels of application of gypsum. The observed improvement of growth attributing traits of soybean by application of gypsum can be explained on account of sulphur in gypsum, which plays a pivotal role in promoting the growth of crops, particularly oilseeds and pulses. The above results are in conformity with the findings of Joshi and Billore (1998), who reported a gradual increase in these yield attributes of soybean with increasing levels of sulphur applied through gypsum.
Some other workers (Hemantrajan and Trivedi, 1997) also reported an increase the pod length (Hemantrajan and Trivedi, 1997), number of pods and seed index (Saxena and Nainwal, 2010) of soybean consequent upon application of sulphur. Effect on yield
The effect of increased levels of gypsum for sulphur nutrition on soybean seed and stover yield was found to be statistically significant (Table 1). Application of gypsum @ 0.2 t per ha gave significantly higher seed as well as stover yield as compared to control and 0.1 t per ha gypsum addition. The highest seed (2591 kg/ha) and stover (2784 kg/ha) yields were recorded when gypsum was applied@ 0.3 t per ha, which was statistically at par with 0.2 t per ha level. The consistent increments in seed yield of soybean observed in the present study with increasing levels of sulphur through gypsum could be the consequence of cumulative improvement in yield attributes like number of pods per plant, seeds per pod and the seed index. The balanced nutrition provided by recommended fertilizers including sulphur through gypsum must have been the cause of improved seed and strover yield. Increased supply of sulphur is known to promote the process of tissue differentiation from somatic to reproductive, meristematic activity, which might have increased the number and size of leaves (Mengal and Kirkby, 1987). Since, sink lies in leaves, when supply of sulphur is optimum, greater translocation of

32
Table 1. Effect of different levels of gypsum application on yield attributes and yield (seed and stover) of soybean (averaged over of five demonstrations)
Gypsum levels (t/ha)
Year Year 2006 2007 2008 Mean 2006 2007 2008 Mean
Plant height (cm) Pods/plant (No) 0.0 45.40 47.04 58.40 49.06 29.50 45.20 44.88 39.85 0.1 47.40 49.62 55.90 50.95 27.30 48.10 48.18 41.18 0.2 51.60 52.38 58.20 55.48 32.20 50.00 50.64 44.26 0.3 48.20 52.34 58.56 53.03 31.00 50.42 50.64 44.19 SEm (+/-) 0.55 0.50 0.30 0.58 2.10 1.66 0.52 0.75 CD (5 %) 1.70 1.55 0.92 2.01 6.46 5.11 1.60 2.58 Seeds/pod (No) Seed index (g/100 seeds) 0.0 2.9 2.47 2.45 2.61 14.02 13.11 13.41 13.50 0.1 2.9 2.56 2.51 2.62 14.26 13.37 13.51 13.71 0.2 3.0 2.57 2.67 2.71 14.73 13.56 13.66 13.97 0.3 3.0 2.60 2.67 2.75 15.12 13.61 13.64 14.12 SEm (+/-) 0.06 0.03 0.03 0.02 0.09 0.03 0.04 0.04
CD (5 %) 0.19 0.10 0.09 0.08 0.27 0.10 0.11 0.13
Seed yield (kg/ha) Stover yield (kg/ha) 0.0 1701 2196 2456 2118 1817 2808 2641 2311 0.1 1959 2379 2621 2329 2087 2770 2775 2544 0.2 2163 2691 2829 2585 2286 3073 2955 2771 0.3 2189 2689 2881 2591 2284 3077 2992 2784 SEm (+/-) 32.21 44.94 25.97 24.94 44.90 49.91 23.34 27.67 CD (5 %) 99.20 138.42 80.00 86.30 138.3 153.73 71.90 95.75
photosynthates might have occurred from leaves to seed (Mengal and Kirkby, 1987) leading to higher yield. Such yield enhancements due to sulphur supply have been recorded by other workers (Kumar et al., 1992; Sarker et al., 2002; Meena et al., 2011).
Effect on nutrient and oil contents
The content of N, P, K and S in seed in seed increased significantly with the increased level of gypsum
application up to 0.2 t per ha as compared to control and remained at par with 0.3 t per ha (Table 2). The highest content of nitrogen (6.53 %), phosphorus (0.51 %), potassium (2.39 %) and sulphur (0.33 %) was recorded with application of 0.2 t gypsum per ha, whereas, minimum values recorded were under control (6.19 %, 0.41 %,
2.10 % and 0.26 %, respectively). This effect may be attributed to the fact that the increased supply of sulphur facilitated higher uptake of N, P, K and S from soil.

33
Increased sulphur content in soybean seed on application of sulphur to soybean has been recorded by Ganeshamurty (1996).
Oil content in soybean seed increased significantly with increasing doses of gypsum application up to 0.2 t per ha (Table 3) due to the fact that sulphur in gypsum might have played a key role in biosynthesis of oil in oilseeds. Mean values of oil contents in treatments supplied with 0.2 and 0.3 t of gypsum per ha recorded 21.02 per cent followed by 0.1 t gypsum per ha (20.34 %) and control (19.74 %). Raghuwanshi et al. (2009) also reported increased oil content in soybean seed by 4.37 per cent when sulphur was applied @ 50 kg per ha.
Effect on economical aspects
The economics in term of investment on cost of gypsum and returns through increased seed yield worked out on the basis of current market price revealed that the value cost ratio (VCR) gradually increased with sulphur application through gypsum up to 0.2 t per ha (Table 4). The VCR value for 0.2 t gypsum per ha worked out to 26.30. Beyond 0.2 t per ha application of gypsum, the benefit decreased (VCR 17.73) indicating lowering in per rupee investment. The computed VCRs value clearly indicated that the increased rate of gypsum application was always beneficial to the farmers as compared to
Table 2. Effect of different doses of gypsum application on nutrients and oil content (%) of soybean seed (averaged over of five demonstrations)
Gypsum levels (t/ha)
Year Year
2006 2007 2008 Mean 2006 2007 2008 Mean
N content (%) P content (%)
0.0 6.69 6.01 5.88 6.19 0.48 0.41 0.36 0.41
0.1 7.08 6.18 6.03 6.24 0.53 0.41 0.41 0.44
0.2 7.37 6.24 6.02 6.53 0.61 0.51 0.41 0.51
0.3 7.21 6.21 6.20 6.53 0.58 0.46 0.46 0.50
SEm (+/-) 0.08 0.14 0.09 0.05 0.01 0.03 0.02 0.01
CD (5 %) 0.25 0.43 NS 0.18 0.03 0.10 0.06 0.03
K content (%) S content (%)
0.0 1.92 2.16 2.21 2.10 0.21 0.30 0.29 0.26
0.1 2.28 2.19 2.23 2.23 0.23 0.34 0.31 0.29
0.2 2.49 2.28 2.41 2.39 0.27 0.37 0.36 0.33
0.3 2.36 2.27 2.53 2.38 0.25 0.37 0.37 0.33
SEm (+/-) 0.06 0.10 0.06 0.04 0.003 0.006 0.008 0.003
CD (5 %) 0.17 0.32 0.20 0.14 0.008 0.020 0.024 0.012

34
Table 3. Effect of different doses of gypsum application on oil content (%) of soybean seed (averaged over of five demonstrations)
Gypsum levels (t/ha)
Year 2006 2007 2008 Mean
Oil content (%) 0.0 19.98 19.28 19.97 19.74 0.1 20.76 19.78 20.50 20.34 0.2 21.83 20.44 20.79 21.02 0.3 21.86 20.44 20.76 21.02 SEm(+/-) 0.06 0.19 0.09 0.06 CD (5 %) 0.19 0.58 0.27 0.22
control. Saxena and Nainwal (2010) also reported that sulphur application @ 30 kg per ha recorded significantly higher B:C ratio than other levels of sulphur nutrition.
The demonstrations conducted for three consecutive years under real farm conditions on effect of application
Table 4. The average value cost ratio (VCR) of applied gypsum
Gypsum levels (t/ha) 0.0 0.1 0.2 0.3
Yield (kg/ha) 2118 2329 2585 2591 Increase over control (kg/ha)
- 211 467 473
Profit (INR) - 3787 8416 8517 Gypsum application cost (INR)
- 160 320 480
VCR - 23.67
26.30
17.73
of sulphur through gypsum enhances growth, major nutrient contents in seed and yield (seed and straw) of soybean. The application of sulphur through gypsum @ 0.2 t per ha is optimum to enhance yield and is economically viable in medium black soils of Malwa plateau of Madhya Pradesh.
REFERENCES AOAC. 1984. Official Methods of Analysis, The
Association of Official Agricultural Chemists, ed.14. Association of Official Agricultural Chemists, Washington DC, USA.
Bhatnagar P S. 2009. Harnessing productivity and profitability potentials of soybean (Glycine max) for its sustainability in India. In: Abstracts: Developing a Global Soy Blueprint for a Safe, Secure and Sustainable Supply, World Soybean Research Conference, 2009, Aug 10-15, Beijing, China, pp 209.
Black C A. 1965. Methods of Soil Analysis (part 2) American Society of Agronomy, Madison, Wisconsin, USA.
Chesnin L and Yien C H. 1950. Turbidimetric determination of available sulphates. Soil Science Society America Proceedings 15: 149-51.
Ganeshamurthy A N. 1996. Critical plant S content and effect of sulphur application on grain and oil yield of rainfed soybean in vertic Ustochrepts. Journal of Indian Society of Soil Science 44: 290-4.
Hemantrajan A and Trivedi S K. 1997. Growth and yield of soybean [Glycine max (L.) Merrill] as influenced by sulphur and iron nutrition. Indian Journal of Plant Physiology 2: 304-6.

35
http://www.sopa.org/.2010. Area and production estimate of soybean in India kharif (Monsoon) 2010.
Jackson M L. 1973. Soil Chemical Analysis. Prentice Hall of India Pvt. Ltd. New Delhi, pp 151-157, 181-190.
Joshi O P and Billore S D. 1998. Economic optima of sulphur fertilizer for soybean (Glycine max). Indian Journal of Agricultural Sciences 68: 244-6.
Kjeldhal J. 1983. A new method for estimation of nitrogen in organic compounds. Z. Analytical Chemistry 22: 366-382.
Kumar V, Shrotriy G C and Khare S V. 1992. Crop response to sulphur application. Indian Farmers fertilizer Corporative Ltd., New Delhi, pp 50.
Meena D S, Ram B and Tetarwal J P. 2011. Productivity, quality and profitability of soybean (Glycine max) as influenced by sulphur and boron nutrition. Soybean Research 9:103-108.
Mengal K and Kirkby E A. 1987. Principles of Plant Nutrition. International potash Institute, Bern. Switzerland.
Panse V G and Sukhatme P V. 1985. Statistical methods for Agricultural workers (3rd ed.). Pub. ICAR, New Delhi.
Prasad R. 2006. Textbook of Field Crops Production. Directrate of Information and Publication of Agriculture, ICAR, Krishi Anusandhan Bhavan, New Delhi.
Raghuwanshi S R S, Raghuwanshi O P S, Umat R, Ambawatia G R and Bhargav K S. 2009. Effect of different doses of sulphur on productivity and quality of soybean [Glycine max (L.) Merrill]. Soybean Research 7: 93-5
Sarker S K, Choudhary M A H and Zakir H M. 2002. Sulphur snd boron fertilization on yield quality and nutrient uptake by Bangladesh soybean-4. Journal of Biological Sciences 2: 729-33.
Saxena S C and Nainwal R C. 2010. Effect of sulphur and boron nutrition on yield, yield attributes and economics of soybean. Soybean Research 8: 7-12.
.
36
Soybean Research 11(1): 36-42 (2013)
Impact of New Water Management Practices on Productivity and Sustainability of Soybean Grown in the Chambal
Command Area of South-Eastern Rajasthan
R S NAROLIA1, PRATAP SINGH2, I N MATHUR3 and L L PANWAR4 AICRP on Water Management, Agricultural Research Station (MPUA& T),
Ummedganj, Kota 324 001, Rajasthan (Email: [email protected])
Received: 26.05.2012; Accepted 03.10.2012
ABSTRACT
On farm demonstrations in soybean was carried out during 2004 to 2008 at farmer’s field under ORP of Agricultural Research Station, Kota. The main objective was evaluation of the productivity and sustainability of soybean in Chambal command. Treatments were comprised of irrigation scheduling at flowering and pod development stages by border strip (6 x 50 m) method using 80 per cent cut off ratio (improved water management technology) which was compared with farmer’s practice i.e. wild flooding. Results revealed that improved water management technology gave higher and sustainable seed yield of soybean over the years. The mean yield recorded (2 008 kg/ha) was being 7.47 per cent higher as compared to the yield (1 870 kg/ha) observed under farmer’s practice. Sustainability of soybean yield was reflected by the higher sustainability yield index (0.897) and value index (0.849). Improved water management technology possessed higher water expanse efficiency (163.21 kg/ha/cm) and incremental benefit cost ratio (3.2) over farmer’s practice.
Key word: Soybean, sustainability yield index, value index and water management technology
Soybean (Glycine max (L.) Merrill), commonly known as golden bean, is most important kharif oilseed crop of south eastern Rajasthan. The productivity of soybean in the state is very low. Therefore, concentrated efforts are
required to enhance its productivity. It is, generally, grown with the onset of monsoon in the month of July. Method of irrigation and time of application of water plays an important role in enhancing the water productivity of soybean. Declining
1Assistant Professor (Agronomy), 2Associate Professor (Agronomy), 3Agricultural Engineer, 4Associate Professor (Plant Breeding)

37
availability of irrigation water, need of sustainability in crop production and increasing demand of food/oil; can be achieved through adoption of improved water management and crop production technologies, and efficient water management. Keeping this in view, demonstrations were conducted at farmer‟s field under Operational Research Programme (ORP) with the aim to improve water expanse efficiency at field level and to show the benefits of demonstrated water management technology in terms of enhanced yield and saving of irrigation water.
MATERIAL AND METHODS
The study area is in Chambal command, which lies between 25º and 26º North latitude and 75º-30' and 76º-6' East longitude in the south-eastern part of Rajasthan comprising part of Kota, Bundi and Baran Districts. It comes under agro- climatic zone V, which is also known as humid south-eastern plain of Rajasthan. Kota Barrage, situated in Kota city serves the main canal system of Chambal command, from here the two main canals – right and left takes off. In absence of canal water, irrigation was given by the tube well, etc.
The soils of the Chambal command area belong to the order Vertisols and Inceptisols, mainly comprised of Chambal series (62 %) and Kota variant (23 %). The
bulk density, pH and cation exchange capacity of these soils varies between 1.30 -1.60 Mg/m3, and 7.75-8.50 and 30-40 Cmol/kg, respectively. The soils have a very low water intake rate (approximately 0.25 cm/h) on surface, but are almost impermeable at 1.2 to 1.5 m depth. The potential moisture retention capacity is almost 120 mm of water in 1 m profile depth. The soils of the region are poor in organic carbon (0.50 ± 0.08 %) and available nitrogen (275 ± 10 kg/ha), but are low to medium in available P2O5 (24.2 ± 1.0 kg/ha) and medium to high in available K2O (290 ± 12 kg/ha).
The field demonstrations were carried out for five years from 2004 to 2008 during kharif season, at farmer‟s field under ORP of AICRP on Water Management to show economic feasibility and sustainability of improved water management technology in soybean crop. Each year eighteen demonstration were conducted, three each at head, middle and tail reach of Left main canal and Right main canal system of Chambal command, respectively.
Improved water management technology (two irrigation, one each at flowering and pod development stage, if needed, with 6 cm depth, by border strip method 6 m x 50 m at 80 % cut off ratio) with recommended package of practices viz., high yielding varieties, seed treatment, recommended dose of fertilizer (20:40:40:30 kg/ha, NPKS), weed management, crop geometry (30 x 10 cm)
38
and seed rate (80 kg/ha) were used in test block during each year. Each demonstration was laid out in an area of 0.1 ha. For assessing impact of improved water management technology, the adjoining field with similar area cultivated to soybean crop by the farmer himself was considered which served as check plot (Farmer‟s practice). Improved water management technology was compared with farmer‟s practice i.e. flooding method of irrigation with no control over the depth of irrigation (usually about 10 cm). For test plots measurement of water was done by velocity-area method at field level. The demonstration plots were sown with improved water management technology during first fortnight of July every year except 2008 where the sowing was done in fourth week of July due to delayed commencement of monsoon. The rainfall received during growing period of soybean were 478 mm, 430 mm, 645 mm, 736 mm and 585 mm, for the years of 2004, 2005, 2006, 2007 and 2008, respectively. Data were recorded from demonstration blocks and farmer‟s practice blocks. These recorded data were analyzed for different parameters, using following formulae, suggested by Prasad et al. (1993). Extension Gap = Demonstration yield (Di) -
Farmer‟s practice yield (Fi) Technology Gap = Potential yield (Pi) -
Demonstration yield (Di) Technology Index = (Pi - Di )/Pi x 100
Data were also analyzed for parameters like standard deviation, coefficient of variation as per standard procedure (Panse and Sukhatme, 1961). Sustainability indices (Sustainability yield index and sustainability value index) were work out using formula (Singh et al., 1990). SYI/ SVI = Y-O/Ymax Where: Y = Estimated average yield/net return of
practices over the year O = Standard deviation Ymax = Maximum yield/maximum net return. RESULTS AND DISCUSSION Seed yield
Five year average seed yield of demonstrations of soybean was 2 008 kg per ha which was 7.47 per cent higher than the five year average yield (1 870 kg/ha) obtained under farmer‟s practices (Table 2). Year-wise per cent increase in seed yield of demonstrations over farmer‟s practices ranged from 5.1 to 9.3. The higher seed yield under demonstrations could be attributed to adoption of improved water management technology under the supervision of scientists. Year-wise observed variation in seed yield might be due to the variation in the environmental conditions prevailed during that particular year. This fact has been reported by Joshi et al. (2004) stating
39
that improved package of practices along with water management has shown positive effect on yield potentials of different crops. Average water expanse efficiency (163.2 kg/ha/cm) calculated was also higher in test block as compared to farmer‟s practice. This is due to lesser depth of irrigation water applied and more seed yield obtained. Same thing was also observed by Dhar et al., (2011). During five years of study, two years, i.e. 2004 and 2005, only irrigation at pod development stage was applied, as the irrigation at flowering stage was supplied through effective rainfall. Early withdrawal of monsoon is a big problem of the area in the absence of canal water during the month of September, only those farmers who have irrigation facilities could harvest good crop; this phenomena is evident by the yield of year 2008. Gap analysis
Yield gap analysis for all the five years as reflected by extension gap, technology gap and technological index revealed wide gaps in all the three parameters. Extension gap is a parameter to know the yield difference between the demonstrated technology and farmer‟s practice; for the present study, it ranged from 106 to 165 kg per ha with an average of 138 kg per ha. This indicated a wide gap between the demonstrated improved technology and its adoption by the farmers (Table 1). Technology gap is a measure of difference between potential yield and yield obtained under improved technology demonstration.
This is of greater significance than other parameters as it indicated the constraints in implementation and drawbacks in our package of practices and could be environmental or varietal. This also reflects the poor extension activities, which resulted in lesser adoption of improved water management technology and package of practices by the farmers. This gap can be lowered down by strengthening the extension activities and further research to improve the package of practices. Technology index is dependent on technology gap and is a function expressed in per cent. For the five years of study it varied from 27.2 to 41.7 per cent, with an average of 34.0 per cent. The very low technology index (27.2) during the year 2004 could be due to introduction of improved water management technology, favourable climatic conditions, crop free from insect pest and disease incidence. High technology index shows a poor performance of package of practices and demonstrated technology. For example during the year 2008 the technology index was 41.7 per cent, this was mainly due to early withdrawal of monsoon and unfavourable climatic conditions with incidence of pest and diseases. Such higher technology indices have been reported in front line demonstrations on chickpea by Siag et al. (2002). Economic analysis
Grain yield, cost of inputs and sale
price of produce determine the economic

40
Table 1. Grain yield, gap analysis and water expanse efficiency of soybean demonstrations
Year Yield (kg/ha)
% incre-ase over
FP
Depth of water applied
(cm)
Water expense efficiency (kg/ha/cm)
Potential yield
(kg/ha)
Extension gap
(kg/ha)
Technology gap
(kg/ha)
Technology index (%)
IT FP IT FP IT FP
2004 2183 2077 5.10 13 17 167.92 122.18 3000 106 817 27.2 2005 2008 1892 6.13 12.5 16.5 160.64 114.67 3000 116 992 34.0 2006 2040 1875 8.80 12 20 170.00 93.75 3000 165 960 32.0 2007 2062 1908 8.07 12 20 171.83 95.40 3000 154 938 31.3 2008 1748 1600 9.25 12 20 145.66 80.00 3000 148 1252 41.7 Average 2008 1870 7.47 12.3 18.7 163.21 101.20 3000 138 992 34.0
IT= Improved technology; FP = Farmers practice Table 2. Variability of seed yield and net returns of soybean demonstrations
Particulars
Years
2004 2005 2006 2007 2008 Average
IT FP IT FP IT FP IT FP IT FP IT FP
Seed yield (kg/ha) range
H 2258 2137 2130 2010 2250 2180 2230 2130 1901 1767 2145 2045 T 2128 2029 1930 1780 1900 1710 1910 1760 1595 1355 1905 1777
Mean seed yield (kg/ha)
2183 2077 2008 1892 2040 1875 2062 1908 1748 1600 2008 1870
S D 0.437 0.454 0.685 0.865 1.26 1.61 1.24 1.44 1.23 1.53 0.819 0.966 CV (%) 2.00 2.18 3.41 4.57 6.22 8.60 6.02 7.55 7.09 9.61 4.08 5.16
Net returns range (`./ha)
H 18996 18044 19450 18432 22038 21675 23085 22285 20166 18742 20646 19835
T 17436 16748 16820 16328 17225 15213 18445 16630 15362 12274 17218 15989
S D 567.3 545.2 901.2 1138.6 1745.8 2218.4 1800.4 2090.0 1945.6 2414.3 1161.5 1368.8
CV (%) 3.14 3.15 5.05 6.75 9.12 12.69 8.72 10.96 10.96 14.98 6.21 7.88
SYI 0.972 0.950 0.910 0.898 0.850 0.786 0.868 0.828 0.854 0.818 0.897 0.867 SVI 0.948 0.930 0.871 0.854 0.790 0.704 0.816 0.762 0.784 0.731 0.849 0.807 H = Maximum yield at head reach of canal; T = Minimum yield at tail reach of canal; IT= Improved technology; FP = Farmers practice; S D = Standard deviation

41
returns and these vary from year to year as the cost of input, labour and sale price of produce changes from time to time. The year-wise additional returns from improved technology demonstrations over farmer‟s practice varied from INR 1 272 to INR 2 324 (Table 3). The mean additional cost of input of all the demonstrations for five years was INR 598 (Table 3). This additional investment along with non-monitory management factors gave an additional mean returns of INR 1 925. The higher sale price of produce, in spite of low production and higher additional cost of input during 2008 gave highest additional returns under improved technology demonstrations over farmer‟s practice. The incremental benefit cost ratio (IBCR) on overall average basis was 3.2. The highest IBCR during five years was observed in 2006 (3.8), which can be ascribed to comparatively higher grain yield, less cost of input and a good sale price.
Sustainability Higher standard deviation in seed
yield was observed under farmer‟s practice over improved water management technology demonstrations for all the five years (Table 2). Similar was the case with coefficient of variation. This may be due to more variation in the yield from farmer to farmer under farmer‟s practice and lesser in improved technology demonstrations. However, the sustainability yield index (SYI) and Sustainability value index (SVI) was more under improved technology than farmer‟s practices (Table 2). The mean SYI and SVI over these 5 years under improved technology of water management, ranged from 0.850 to 0.972 and 0.784 to 0.948 with an average of 0.897 and 0.849, while the corresponding values under farmer‟s practice were 0.786 to 0.950 and 0.704 to 0.930 with an average of 0.867 and 0.807, respectively. This shows that the improved technology is more sustainable as compared to farmer‟s practice. Similar results have been reported by Billore et al. (2009).
Table 3. Economic analyses of demonstrations on soybean during kharif season
Year Cost of inputs
(INR/ha)
Addi-tional cost in
IT
Sale price (INR
/t)
Total returns (INR /ha)
Addi-tional
returns in IT (INR /ha)
Effec-tive gain (INR /ha)
IBCR
IT FP IT FP
2004 8100 7600 500 12000 26196 24924 1272 772 2.5
2005 8560 8000 560 13150 26405 24880 1525 965 2.7
2006 8900 8300 600 13750 28050 25781 2269 1669 3.8
2007 9250 8600 650 14500 29899 27666 2233 1583 3.4
2008 9680 9000 680 15700 27444 25120 2324 1644 3.4
Average 8898 8300 598 13820 27599 25674 1925 1327 3.2

42
REFERENCES Billore S D, Vyas A K and Joshi O P. 2009.
Assessment of improved production technologies of soybean on production and economic potentials in India. Journal of Food Legumes 22 (1): 53-5.
Dhar R, Bharti V, Samanta A, Gupta N K and Bali A S. 2011. Water productivity enhancement of major crops in irrigated plains of Jammu. National Seminar on “Strategic Resource Management for Sustainable Food and Water Security” organized by G. B. Pant University of Agriculture & Technology Pantnagar, 13-15 June 2011, PP-2 (Theme II)
Joshi O P, Billore S D and Vyas A K. 2004. Productivity and economic sustainability of improved soybean production technology under real farm conditions. Paper presented in “VII-World Soybean Research Conference” held at Foj do Iguassu, PR, Brazil on 29 Feb-5 March 04.
Panse V G and Sukhatme V P. 1985. Statistical Methods for Agricultural Workers. Indian Council of Agricultural Research, New Delhi.
Prasad Y, Rao E, Manchar M and Vijaybhinanda R. 1993. Analysis of on-farm trials and level of technology on oilseeds and pulse crops in Northern Telangana Zone of Andhra Pradesh. Indian Journal of Agricultural Economics 48: 351-6.
Siag R K, Gaur R B, Verma R S, Yadav D K, Singh V and Prakash V. 2002. Evaluating gaps in transfer of technology in chickpea frontline demonstrations in semi-arid region of Rajasthan. Haryana Journal of Agronomy 18 (1&2): 110-4.
Singh R P, Das S K, Bhaskar Rao U M and Narayana Reddy M. 1990. Towards Sustainable Dryland Agricultural Practices. Bulletin published by CRIDA, Hyderabad, India. Pp. 1-106.
43
Soybean Research 11(1): 43-57 (2013)
Productivity, Sustainability and Stability of Soybean Based Cropping Systems under Different Tillage Systems
S D BILLORE1, O P JOSHI2, A RAMESH3 and A K VYAS4
Directorate of Soybean Research, Khandwa Road, Indore, Madhya Pradesh 452 001
E mail: [email protected]
Received: 13.10.2011; Accepted: 17.10.2012
ABSTRACT
Field experiments were conducted during 1995 to 2006 to study the impact of tillage systems on yield trend, stability, relative stability, sustainability, energy budgeting and economics of soybean–wheat and soybean–chickpea cropping systems. Soybean yields remained uninfluenced by the tillage systems. Soybean grown prior to wheat did not show appreciable higher yield than that of chickpea. Seed yield of soybean grown prior to wheat was more sustainable than that of chickpea. Trend analysis revealed that yield of all the three crops, i.e. soybean (9.9 %/annum), wheat (1.71 %/ annum) and chickpea (11.9 %/ annum) increased linearly over the years under all the three tillage systems, which were equally stable. However, minimum tillage was more stable than conventional and no-till with regards to soybean. In rabi crops; no-till was more stable than remaining two tillage systems. Total crop productivity in terms of soybean equivalent yield (SEY) remained unaffected due to tillage systems. Soybean –wheat system was more productive, stable and profitable compared to soybean-chickpea. Trend analysis revealed that the rate of yield increment was more than double in soybean – chickpea than soybean-wheat. Under no-till system both the cropping systems performed well under unfavourable environments. Energy budgeting revealed that the soybean–wheat system was associated with higher energy input and output than soybean-chickpea system, while soybean-chickpea was most energy efficient in terms energy use efficiency, energy productivity and energy intensiveness. Minimum and no-till systems were most economically viable and energy efficient than conventional tillage.
Key words: Chickpea, relative stability, soybean, stability, sustainability, tillage, trend analysis, wheat
---------------------------------------------------------------------------------------------------------- 1Senior Scientist; 2Ex-Principal Scientist; 3 Senior Scientist; 4Principal Scientist

44
It has become imperative for India to become globally competent in production of various crops in view of the challenges put-forth subsequent to become signatory to WTO in 1995. This necessitated resorting to making all out efforts to optimize production from a unit area in unit time at minimum cost. The efforts which are being made to contain the production cost of crops through reducing the extent of tillage, enhancement of cropping system efficiency, utilization of integrated approaches in management of nutrients, water and weeds, and increase the farm mechanization keeping sustainability in mind. Among these measures, manipulation of tillage system by changing land configuration for planting and curtailing the extent of tillage operations works out to be important ones. The conservation and no-till systems not only contain soil erosion and restore organic carbon content in soil (Madari et al., 2005; Write et al., 2005), but also reduces cost of production. Moreover, the later is instrumental in providing sustainability to crop production. Although, the commercial cultivation of soybean in India is slightly more than four decades old, the crop has made a special niche in cropping systems of Central India, particularly in the area covered under Vertisols and associated soils. The major cropping systems in Central India are soybean-wheat (irrigated) and soybean-chickpea (rainfed). There is dearth of information on performance and sustainability of soybean-wheat and soybean-
chickpea system under different tillage systems. Therefore, performance and sustainability of these two cropping systems with different tillage systems on Vertisols of Central India have been studied in present investigation. MATERIAL AND METHODS
Two field experiments involving
tillage and cropping systems (1995-2001) and tillage, fertility levels and cropping systems (2001-2006), each at a fixed site were conducted at research farm of Directorate of Soybean Research, Indore. For drawing conclusions on the effect of different tillage systems on the performance of soybean-wheat and soybean-chickpea, the data generated in said two experiments and to work out the trend analysis, stability and sustainability over the years was clubbed and presented in the text. The experimental soil belonged Haplusterts. It was analyzed for pH 7.86, EC 0.14 dS per m, organic carbon 0.30 per cent, available P2O5 4.80 kg/ha and available K2O 298 kg/ha. The clubbed data for 10 years for three tillage systems viz., zero, minimum (2 cross harrowing) and conventional (deep ploughing, 2 harrowing and planking) and two cropping systems i.e. soybean (JS 71 05) – followed by wheat (Sujata) and soybean (JS 71 05)- chickpea (JG 218) taking three replications was analyzed in strip plot design. All these crops were raised with respective recommended package of

45
practices. The rabi crops received pre-sowing irrigation and two additional irrigations during crop growing period.
Sustainability index, stability and relative stability were estimated as per the procedure suggested by Singh et al. (1990), Finley and Wilkinson (1963) and Raun et al. (1993). Type of stability was decided on regression coefficient (b) and mean values. If „b‟ is equal to unity, the treatment was considered to have average stability (same performance in all the environments). If „b‟ more than unity, it was suggested to have less than average stability (good performance under favourable environments) and if „b‟ was less than unity, it was reported to have more than average stability (good performance under poor environment). The trend analysis of yield over years was worked out as suggested by Dobermann et al., (2000).
The economics of each treatment was calculated as per the prevailing prices of inputs and outputs. The energy budget of the treatments was determined by using the conversion factors for each inputs, outputs and cultural operations as suggested by Mittal and Dhawan (1988). Energy intensiveness (EI) and energy productivity (EP) were worked out as per Burnett (1982) and Fluck (1979).
RESULTS AND DISCUSSION Soybean yield
Cumulative data over ten years (Table
1) on soybean-wheat and soybean-chick pea adapted to different intensities of tillage revealed that soybean cropped prior to wheat yielded marginally higher (2.3 %) than that cropped before chickpea. Soybean yields in case of soybean-wheat was maximum (1594 kg/ha) in minimum tillage, which was 0.6 per cent and 2.8 per cent higher than no-till and conventional tillage, respectively. In case of soybean-chickpea, maximum seed yield of soybean was in no-till (1562 kg/ha), which was 3.6 per cent and 0.8 per cent higher than minimum tillage and conventional tillage, respectively. This indicated that there were no perceptible differences between tillage systems implying that reducing the extent of tillage will be a potent shift to reduce the expenses on these cropping systems. The year to year variability in performance of soybean crop could be accounted for the variability in monsoon, its pattern and distribution. Higher sustainable yield index (SYI) values for soybean indicated that the soybean yields were more sustainable when grown before wheat rather than chickpea. Legume in rotation following cereal crops is considered to be of great help owing to their soil ameliorating benefits and attaining the sustainability (Gangwar and Prasad, 2005). In terms of SYI for tillage systems, the minimum tillage had an edge over no-till and conventional tillage with reference to sustainability (Table 5).
Trend analysis (Table 4) revealed that soybean yield increased linearly over the years under all the three tillage
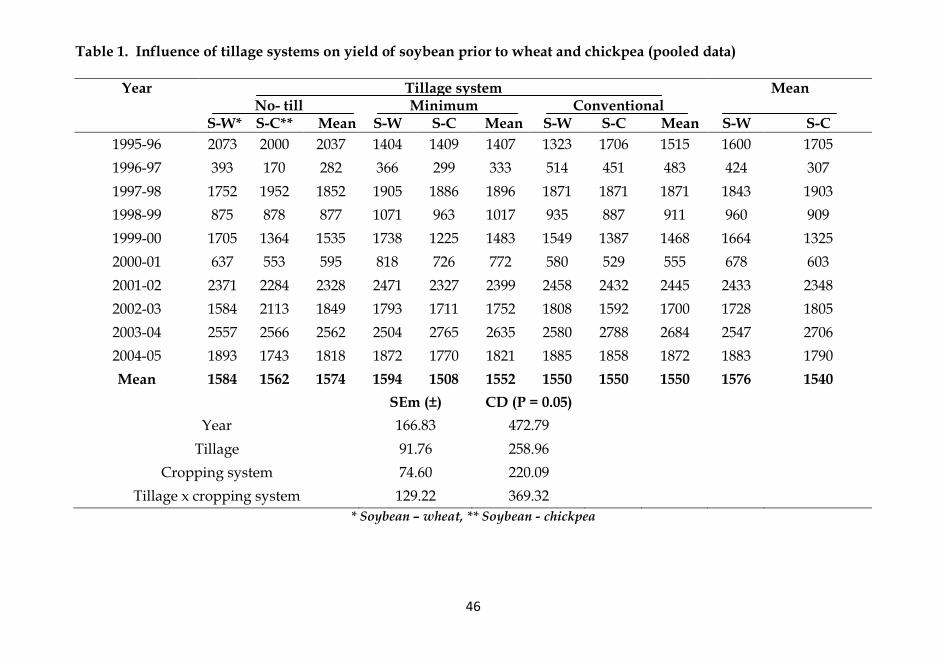
46
Table 1. Influence of tillage systems on yield of soybean prior to wheat and chickpea (pooled data)
Year Tillage system Mean No- till Minimum Conventional
S-W* S-C** Mean S-W S-C Mean S-W S-C Mean S-W S-C
1995-96 2073 2000 2037 1404 1409 1407 1323 1706 1515 1600 1705
1996-97 393 170 282 366 299 333 514 451 483 424 307
1997-98 1752 1952 1852 1905 1886 1896 1871 1871 1871 1843 1903
1998-99 875 878 877 1071 963 1017 935 887 911 960 909
1999-00 1705 1364 1535 1738 1225 1483 1549 1387 1468 1664 1325
2000-01 637 553 595 818 726 772 580 529 555 678 603
2001-02 2371 2284 2328 2471 2327 2399 2458 2432 2445 2433 2348
2002-03 1584 2113 1849 1793 1711 1752 1808 1592 1700 1728 1805
2003-04 2557 2566 2562 2504 2765 2635 2580 2788 2684 2547 2706
2004-05 1893 1743 1818 1872 1770 1821 1885 1858 1872 1883 1790
Mean 1584 1562 1574 1594 1508 1552 1550 1550 1550 1576 1540
SEm (±) CD (P = 0.05)
Year 166.83 472.79
Tillage 91.76 258.96
Cropping system 74.60 220.09
Tillage x cropping system 129.22 369.32
* Soybean – wheat, ** Soybean - chickpea
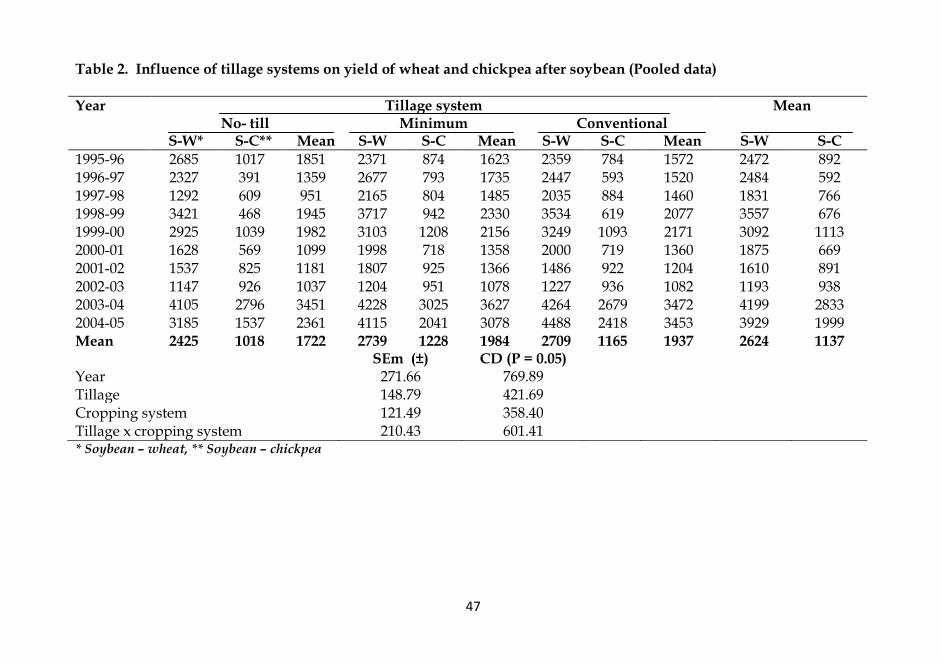
47
Table 2. Influence of tillage systems on yield of wheat and chickpea after soybean (Pooled data)
Year Tillage system Mean No- till Minimum Conventional
S-W* S-C** Mean S-W S-C Mean S-W S-C Mean S-W S-C
1995-96 2685 1017 1851 2371 874 1623 2359 784 1572 2472 892 1996-97 2327 391 1359 2677 793 1735 2447 593 1520 2484 592 1997-98 1292 609 951 2165 804 1485 2035 884 1460 1831 766 1998-99 3421 468 1945 3717 942 2330 3534 619 2077 3557 676 1999-00 2925 1039 1982 3103 1208 2156 3249 1093 2171 3092 1113 2000-01 1628 569 1099 1998 718 1358 2000 719 1360 1875 669 2001-02 1537 825 1181 1807 925 1366 1486 922 1204 1610 891 2002-03 1147 926 1037 1204 951 1078 1227 936 1082 1193 938 2003-04 4105 2796 3451 4228 3025 3627 4264 2679 3472 4199 2833 2004-05 3185 1537 2361 4115 2041 3078 4488 2418 3453 3929 1999 Mean 2425 1018 1722 2739 1228 1984 2709 1165 1937 2624 1137 SEm (±) CD (P = 0.05) Year 271.66 769.89 Tillage 148.79 421.69 Cropping system 121.49 358.40 Tillage x cropping system 210.43 601.41 * Soybean – wheat, ** Soybean – chickpea

48
Table 3. Influence of tillage systems on system productivity (Soybean equivalent yield- pooled data)
Year Tillage system Mean No- till Minimum Conventional
S-W* S-C** Mean S-W S-C Mean S-W S-C Mean S-W S-C
1995-96 4026 3248 3637 3128 2482 2805 3039 2668 2854 3398 2799 1996-97 2085 650 1368 2313 1272 1793 2294 1179 1137 2231 1034 1997-98 2692 2699 2696 3450 2873 3162 3351 2956 3154 3164 2843 1998-99 3363 1452 2408 3774 2119 2947 3505 1647 2576 3547 1739 1999-00 3832 2639 3236 3995 2708 3352 3912 2728 3320 3913 2692 2000-01 1821 1251 1536 2271 1607 1939 2034 1411 1723 2042 1423 2001-02 3489 3297 3393 3785 3462 3624 3539 3564 3552 3604 3441 2002-03 2418 3249 2834 2669 2878 2774 2700 2741 2721 2596 2956 2003-04 5542 5997 5770 5579 6478 6029 5681 6076 5879 5601 6184 2004-05 4209 3629 3919 4865 4275 4570 5149 4826 4988 4741 4243 Mean 3348 2811 3080 3583 3015 3300 3520 2980 3190 3484 2935 SEm ( ±) CD (P = 0.05)
Year 307.49 871.43
Tillage 168.42 477.30
Cropping system 137.51 405.67
Tillage x cropping system 238.18 680.72 * Soybean – wheat, ** Soybean – chickpea
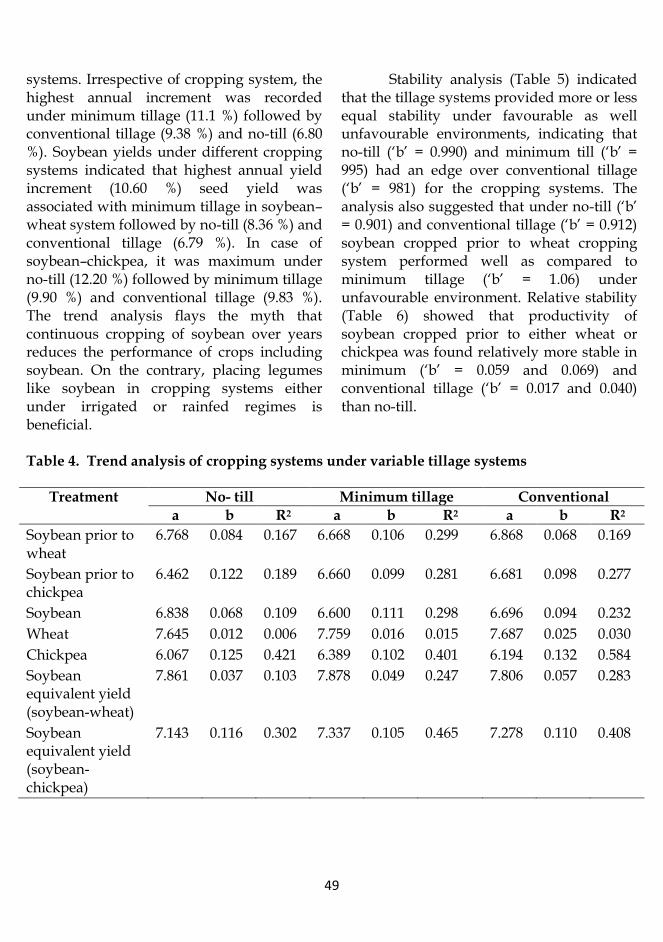
49
systems. Irrespective of cropping system, the highest annual increment was recorded under minimum tillage (11.1 %) followed by conventional tillage (9.38 %) and no-till (6.80 %). Soybean yields under different cropping systems indicated that highest annual yield increment (10.60 %) seed yield was associated with minimum tillage in soybean–wheat system followed by no-till (8.36 %) and conventional tillage (6.79 %). In case of soybean–chickpea, it was maximum under no-till (12.20 %) followed by minimum tillage (9.90 %) and conventional tillage (9.83 %). The trend analysis flays the myth that continuous cropping of soybean over years reduces the performance of crops including soybean. On the contrary, placing legumes like soybean in cropping systems either under irrigated or rainfed regimes is beneficial.
Stability analysis (Table 5) indicated that the tillage systems provided more or less equal stability under favourable as well unfavourable environments, indicating that no-till („b‟ = 0.990) and minimum till („b‟ = 995) had an edge over conventional tillage („b‟ = 981) for the cropping systems. The analysis also suggested that under no-till („b‟ = 0.901) and conventional tillage („b‟ = 0.912) soybean cropped prior to wheat cropping system performed well as compared to minimum tillage („b‟ = 1.06) under unfavourable environment. Relative stability (Table 6) showed that productivity of soybean cropped prior to either wheat or chickpea was found relatively more stable in minimum („b‟ = 0.059 and 0.069) and conventional tillage („b‟ = 0.017 and 0.040) than no-till.
Table 4. Trend analysis of cropping systems under variable tillage systems
Treatment No- till Minimum tillage Conventional
a b R2 a b R2 a b R2
Soybean prior to wheat
6.768 0.084 0.167 6.668 0.106 0.299 6.868 0.068 0.169
Soybean prior to chickpea
6.462 0.122 0.189 6.660 0.099 0.281 6.681 0.098 0.277
Soybean 6.838 0.068 0.109 6.600 0.111 0.298 6.696 0.094 0.232
Wheat 7.645 0.012 0.006 7.759 0.016 0.015 7.687 0.025 0.030
Chickpea 6.067 0.125 0.421 6.389 0.102 0.401 6.194 0.132 0.584
Soybean equivalent yield (soybean-wheat)
7.861 0.037 0.103 7.878 0.049 0.247 7.806 0.057 0.283
Soybean equivalent yield (soybean-chickpea)
7.143 0.116 0.302 7.337 0.105 0.465 7.278 0.110 0.408
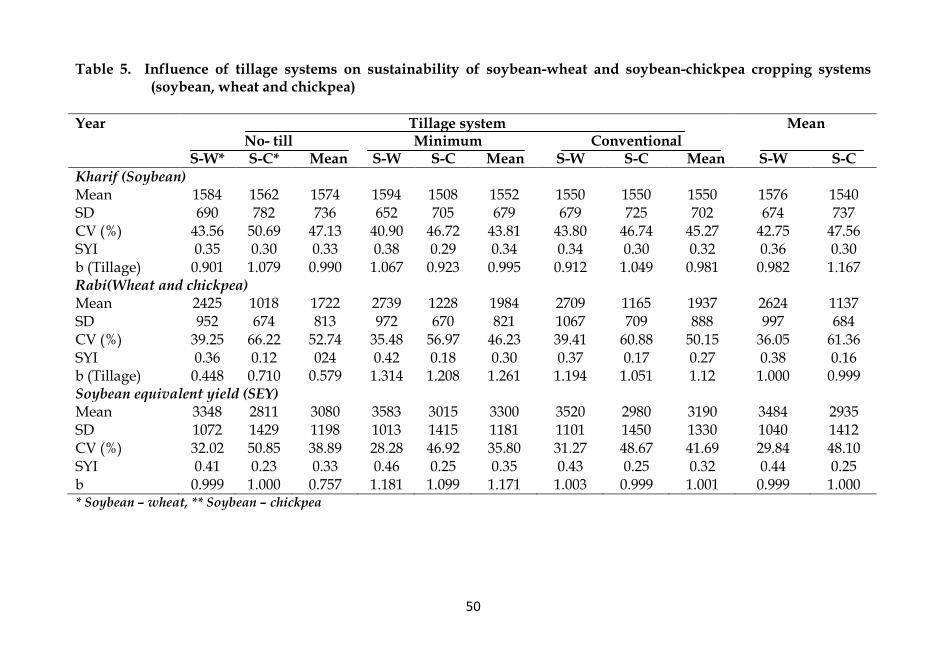
50
Table 5. Influence of tillage systems on sustainability of soybean-wheat and soybean-chickpea cropping systems
(soybean, wheat and chickpea)
Year Tillage system Mean No- till Minimum Conventional
S-W* S-C* Mean S-W S-C Mean S-W S-C Mean S-W S-C Kharif (Soybean) Mean 1584 1562 1574 1594 1508 1552 1550 1550 1550 1576 1540 SD 690 782 736 652 705 679 679 725 702 674 737 CV (%) 43.56 50.69 47.13 40.90 46.72 43.81 43.80 46.74 45.27 42.75 47.56 SYI 0.35 0.30 0.33 0.38 0.29 0.34 0.34 0.30 0.32 0.36 0.30 b (Tillage) 0.901 1.079 0.990 1.067 0.923 0.995 0.912 1.049 0.981 0.982 1.167 Rabi(Wheat and chickpea) Mean 2425 1018 1722 2739 1228 1984 2709 1165 1937 2624 1137 SD 952 674 813 972 670 821 1067 709 888 997 684 CV (%) 39.25 66.22 52.74 35.48 56.97 46.23 39.41 60.88 50.15 36.05 61.36 SYI 0.36 0.12 024 0.42 0.18 0.30 0.37 0.17 0.27 0.38 0.16 b (Tillage) 0.448 0.710 0.579 1.314 1.208 1.261 1.194 1.051 1.12 1.000 0.999 Soybean equivalent yield (SEY) Mean 3348 2811 3080 3583 3015 3300 3520 2980 3190 3484 2935 SD 1072 1429 1198 1013 1415 1181 1101 1450 1330 1040 1412 CV (%) 32.02 50.85 38.89 28.28 46.92 35.80 31.27 48.67 41.69 29.84 48.10 SYI 0.41 0.23 0.33 0.46 0.25 0.35 0.43 0.25 0.32 0.44 0.25 b 0.999 1.000 0.757 1.181 1.099 1.171 1.003 0.999 1.001 0.999 1.000 * Soybean – wheat, ** Soybean – chickpea
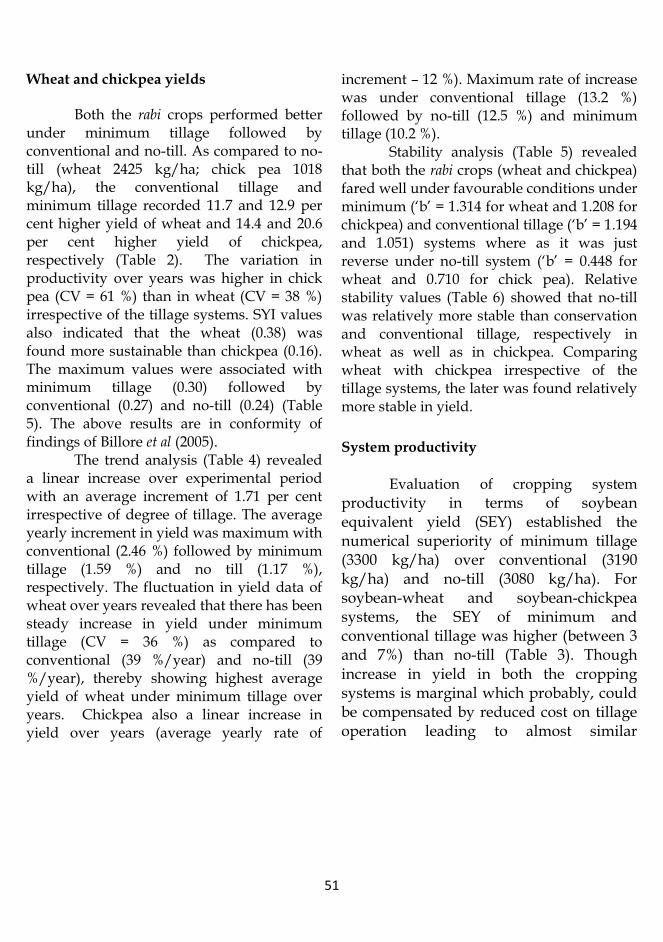
51
Wheat and chickpea yields
Both the rabi crops performed better under minimum tillage followed by conventional and no-till. As compared to no-till (wheat 2425 kg/ha; chick pea 1018 kg/ha), the conventional tillage and minimum tillage recorded 11.7 and 12.9 per cent higher yield of wheat and 14.4 and 20.6 per cent higher yield of chickpea, respectively (Table 2). The variation in productivity over years was higher in chick pea (CV = 61 %) than in wheat (CV = 38 %) irrespective of the tillage systems. SYI values also indicated that the wheat (0.38) was found more sustainable than chickpea (0.16). The maximum values were associated with minimum tillage (0.30) followed by conventional (0.27) and no-till (0.24) (Table 5). The above results are in conformity of findings of Billore et al (2005).
The trend analysis (Table 4) revealed a linear increase over experimental period with an average increment of 1.71 per cent irrespective of degree of tillage. The average yearly increment in yield was maximum with conventional (2.46 %) followed by minimum tillage (1.59 %) and no till (1.17 %), respectively. The fluctuation in yield data of wheat over years revealed that there has been steady increase in yield under minimum tillage (CV = 36 %) as compared to conventional (39 %/year) and no-till (39 %/year), thereby showing highest average yield of wheat under minimum tillage over years. Chickpea also a linear increase in yield over years (average yearly rate of
increment – 12 %). Maximum rate of increase was under conventional tillage (13.2 %) followed by no-till (12.5 %) and minimum tillage (10.2 %).
Stability analysis (Table 5) revealed that both the rabi crops (wheat and chickpea) fared well under favourable conditions under minimum („b‟ = 1.314 for wheat and 1.208 for chickpea) and conventional tillage („b‟ = 1.194 and 1.051) systems where as it was just reverse under no-till system („b‟ = 0.448 for wheat and 0.710 for chick pea). Relative stability values (Table 6) showed that no-till was relatively more stable than conservation and conventional tillage, respectively in wheat as well as in chickpea. Comparing wheat with chickpea irrespective of the tillage systems, the later was found relatively more stable in yield.
System productivity
Evaluation of cropping system
productivity in terms of soybean equivalent yield (SEY) established the numerical superiority of minimum tillage (3300 kg/ha) over conventional (3190 kg/ha) and no-till (3080 kg/ha). For soybean-wheat and soybean-chickpea systems, the SEY of minimum and conventional tillage was higher (between 3 and 7%) than no-till (Table 3). Though increase in yield in both the cropping systems is marginal which probably, could be compensated by reduced cost on tillage operation leading to almost similar

52
Fig.1. Effect of different tillage systems on total system productivity over years
Fig. 2. Mean productivity of the
system under different tillage systems
net profit. The productivity (SEY) of the two cropping systems soybean-wheat and soybean-chickpea followed the same trend under three tillage systems (Fig. 1 and 2). To start with the minimum tillage, it showed slight advantage in SEY. However, after five years the effect was not visible, but again in the tenth year the conventional tillage recorded slightly higher productivity as
compared to no-tillage. The advantage appeared to be marginal that could be compensated by the cost incurred on tillage operations. The yearly variations in the productivity could be explained by the amount of intensity and the duration of precipitation received in that particular period/ year.
The variation under the tillage systems is not pronounced. This might be and on account of vertic (self ploughed) nature of experimental swell-shrink soils.
The trend in the productivity of soybean-wheat and soybean-chickpea was almost similar over the years; however, productivity of soybean-wheat remained marginally higher up to eight years, whereas soybean-chickpea system was found to be more productive in later two year. This could be because of the price variation of the commodity in the market. But it could be compensated by reduction in the cost of tillage operations.
Rating in terms of SYI brought out
0
2000
4000
6000
8000
SEY
(kg
/ha)
YearNo-till
S…
0
2000
4000
6000
8000
SEY
(kg
/ha)
YearMinimum tillage
S…
0
2000
4000
6000
8000
19
95
-96
19
97
-98
19
99
-00
20
01
-02
20
03
-04
SEY
(kg
/ha)
YearConventional tillage
S…
0
2000
4000
6000
8000
19
95
-…
19
96
-…
19
97
-…
19
98
-…
19
99
-…
20
00
-…
20
01
-…
20
02
-…
20
03
-…
20
04
-…
SEY
(kg
/ha)
Year
No-tillage
Minimum tillage
Conventional tillage

53
that soybean-wheat (0.44) was comparatively more sustainable than soybean-chickpea (0.25) irrespective tillage systems. Minimum tillage (0.35) had an edge over conventional tillage (0.32) and no-till (0.33) as indicated by SYI values (Table 5). These results are in agreement with the findings of Billore et al (2005).
The trend analysis (Table 4) over years established the superiority of soybean-checkpea over soybean-wheat as the average annual increment in yield was more than double (10.0 %) in former than later (4.7 %). The maximum rate of annual increment of soybean–chickpea system was under no-till (11.6 %) followed by conventional (11.0 %) and minimum tillage (10.5 %). While in case of soybean–wheat, the rate of increment increased linearly with the increase in the frequency of tillage (from 3.7 to 5.7 %). Contrary to these observations, Singh et al. (2004), while working with rice-wheat rotation reported a declining trend in yield of rice and no change in trend in wheat over a period of time.
Stability analysis (Table 5) indicated that under no-till („b‟= 0.757), both the cropping systems performed better than minimum („b‟ = 1.171) and conventional tillage („b‟ = 1.001) under unfavourable conditions. No differentiation with respect to performance under variable environment could be discerned with respect to cropping systems. Relative stability analysis (Table 6) indicated that the no-till worked out to be more stable than minimum and conventional
tillage and minimum tillage had better stability than conventional tillage. This indicated that the reduction in extent of tillage enhances the stability of the cropping systems. Soybean – wheat system in all the 3 tillage systems was found more stable than soybean- chickpea. It has been documented that no-till system has established itself as cost saving, yield boosting and environment friendly management option (Gangwar and Prasad, 2005). Energy budgeting and economic evaluation
Cropping systems over tillage systems significantly influenced the energy budgeting (Table 7). Soybean-wheat cropping system required higher energy input as compared to soybean-chickpea. The resultant higher gross and net energy outputs were as well associated with the soybean-wheat as compared to soybean-chickpea. The calculated energy use efficiency (3.11), energy productivity (212 g/MJ) and energy intensivity (0.43 MJ/`) was higher in soybean-chick pea than soybean-wheat on account of variations in energy input, productivity and sell price of output. Since, Gangwar et al., (2003) have already reported that the soybean based cropping systems were distinctly better than other cropping systems, only soybean-based cropping systems have been compared here.
As regards energy requirement, the
perceptible differences in tillage

54
Table 6. Relative stability of different treatments under various tillage systems
Treatment b R2 Treatment b R2
Soybean Soybean equivalent yield
S-W v/s S-C under No- till -0.090 0.078 S-W v/s S-C under No till tillage
-0.153 0.209
S-W v/s S-C under Minimum tillage
-0.079 0.087 S-W v/s S-C under Minimum tillage
-0.334 0.337
S-W v/s S-C under Conventional tillage
-0.066 0.077 S-W v/s S-C under Conventional tillage
-0.271 0.317
S-W v/s S-C (Total) -0.084 0.181 S-W – No till v/s Minimum tillage
0.069 0.053
Soybean after wheat S-W – No till v/s Conventional tillage
-0.028 0.004
No till v/s Minimum tillage 0.059 0.025 S-W –Minimum v/s Conventional tillage
-0.095 0.188
No till v/s Conventional tillage
0.017 0.002 S-C – No till v/s Minimum tillage
0.0183 0.006
Minimum v/s Conventional tillage
-0.041 0.058 S-C – No till v/s Conventional tillage
-0.015 0.002
Soybean after chickpea S-C –Minimum v/s Conventional tillage
-0.020 0.009
No till v/s Minimum tillage 0.069 0.040 No till v/s Minimum tillage
-0.0008 0.0000
No till v/s Conventional tillage
0.040 0.016 No till v/s Conventional tillage
-0.108 0.089
Minimum v/s Conventional tillage
-0.028 0.021 Minimum v/s Conventional tillage
-0.105 0.193
Wheat after soybean Chickpea after soybean
No till v/s Minimum tillage -0.021 0.003 No till v/s Minimum tillage
-0.038 0.018
No till v/s Conventional tillage
-0.120 0.075 No till v/s Conventional tillage
-0.034 0.006
Minimum v/s Conventional tillage
-0.095 0.257 Minimum v/s Conventional tillage
0.005 0.0003

55
Table 7. Energy budgeting of cropping systems under different tillage systems Energy indices No-till Minimum tillage Conventional tillage Mean
S-W S-C Mean S-W S-C Mean S-W S-C Mean S-W S-C Mean
Energy input (MJ/ha)
18314 13135 15725 18897 13717 16307 23618 14770 19194 20276 13874 47202
Gross energy output (MJ/ha)
49216 41322 45276 52670 44321 48510 51744 43806 47775 51259 43145 47202
Net energy output (MJ/ha)
30902 28187 29551 33773 30604 32203 28126 29036 28581 30983 29271 30127
Energy Use Efficiency
2.69 3.15 2.88 2.79 3.23 2.97 2.19 3.19 2.49 2.53 3.11 2.82
Energy productivity (g/MJ)
182.81 214.01 195.87 189.60 219.80 202.36 149.04 201.76 169.32 171.98 211.55 191.77
Energy intensiveness (`/MJ)
0.497 0.425 0.464 0.479 0.414 0.449 0.610 0.451 0.537 0.529 0.429 0.479
Gross energy Net energy Energy use efficiency
Energy productivity
Energy intensiveness
SEm (±)
CD (P = 0.05)
SEm (±)
CD (P = 0.05)
SEm (±)
CD (P = 0.05)
SEm (±)
CD (P = 0.05)
SEm (±)
CD (P = 0.05)
Year 4532 12844 4440 12583 0.31 0.87 20.32 57.60 0.07 0.19
Tillage 2482 7035 2432 6892 0.17 0.48 11.13 31.55 0.04 0.10 Cropping system 2027 5979 1986 5858 0.14 0.40 9.09 26.81 0.03 0.09
Tillage x cropping system
3511 10033 3439 9829 0.24 0.68 15.74 44.99 0.05 0.15
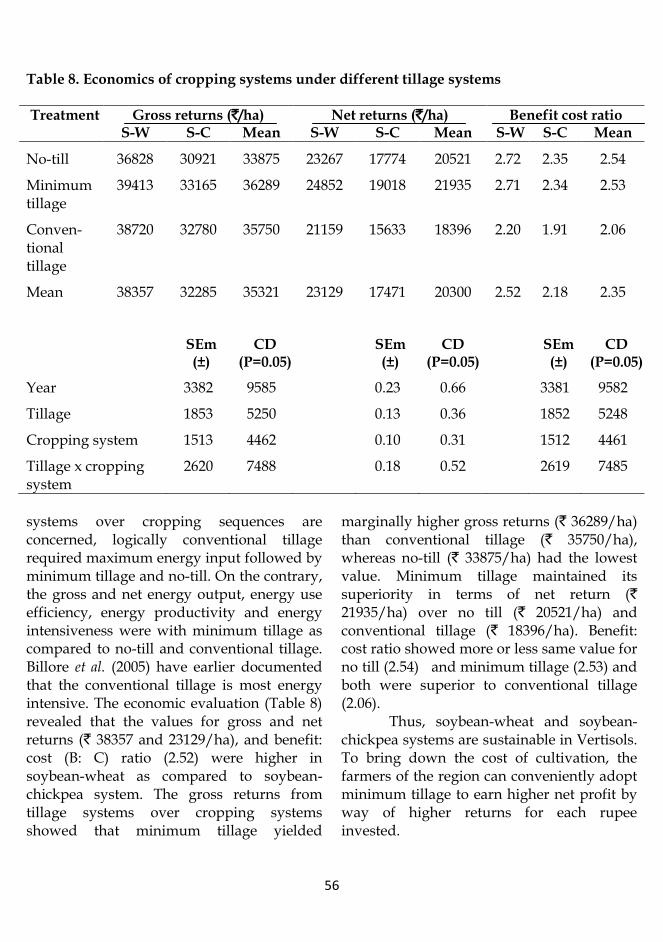
56
Table 8. Economics of cropping systems under different tillage systems
Treatment Gross returns (`/ha) Net returns (`/ha) Benefit cost ratio S-W S-C Mean S-W S-C Mean S-W S-C Mean
No-till 36828 30921 33875 23267 17774 20521 2.72 2.35 2.54
Minimum tillage
39413 33165 36289 24852 19018 21935 2.71 2.34 2.53
Conven-tional tillage
38720 32780 35750 21159 15633 18396 2.20 1.91 2.06
Mean 38357 32285 35321 23129 17471 20300 2.52 2.18 2.35
SEm (±)
CD (P=0.05)
SEm (±)
CD (P=0.05)
SEm (±)
CD (P=0.05)
Year 3382 9585 0.23 0.66 3381 9582
Tillage 1853 5250 0.13 0.36 1852 5248
Cropping system 1513 4462 0.10 0.31 1512 4461
Tillage x cropping system
2620 7488 0.18 0.52 2619 7485
systems over cropping sequences are concerned, logically conventional tillage required maximum energy input followed by minimum tillage and no-till. On the contrary, the gross and net energy output, energy use efficiency, energy productivity and energy intensiveness were with minimum tillage as compared to no-till and conventional tillage. Billore et al. (2005) have earlier documented that the conventional tillage is most energy intensive. The economic evaluation (Table 8) revealed that the values for gross and net returns (` 38357 and 23129/ha), and benefit: cost (B: C) ratio (2.52) were higher in soybean-wheat as compared to soybean-chickpea system. The gross returns from tillage systems over cropping systems showed that minimum tillage yielded
marginally higher gross returns (` 36289/ha) than conventional tillage (` 35750/ha), whereas no-till (` 33875/ha) had the lowest value. Minimum tillage maintained its superiority in terms of net return (` 21935/ha) over no till (` 20521/ha) and conventional tillage (` 18396/ha). Benefit: cost ratio showed more or less same value for no till (2.54) and minimum tillage (2.53) and both were superior to conventional tillage (2.06).
Thus, soybean-wheat and soybean-chickpea systems are sustainable in Vertisols. To bring down the cost of cultivation, the farmers of the region can conveniently adopt minimum tillage to earn higher net profit by way of higher returns for each rupee invested.

57
REFERENCES Billore S D, Ramesh A, Joshi O P and Vyas A K.
2005. Influence of tillage operations on sustainable production of soybean based cropping systems. Soybean Research 3: 17-22.
Burnett M. 1982. Energy analysis of three conserved agro-ecosystems. (In) Basic Techniques in Ecological Farming. pp. 183-195. Hill Stuart B (Ed.) Brikhauser Verlag, Boston.
Dobermann Achim, Dawe David, Remand P Rotter and Cassman Kenneth G. 2000. Reversal of rice yield decline in a long term cropping experiment. Agronomy Journal 92: 633-43.
Finlay K W and Wilkinson G N. 1963. The analysis of adoption in plant breeding programme. Australian Journal of Agriculture Research 14: 742-54.
Fluck R C. 1979. Energy Productivity: A measure of energy utilization in agricultural systems. Agricultural Systems 4: 29-37.
Ganagwar B, Katyal V and Anand K V. 2003. Productivity, stability and efficiency of different cropping sequences in Maharashtra. Indian Journal of Agricultural Sciences 73(9): 471-7.
Gangwar B and Prasad Kamta. 2005. Cropping system management for mitigation of second –generation problems in
agriculture. Indian Journal of Agricultural Sciences 75(2): 65-78.
Madari B, Machado Pedro L O A, Torres E, Andrade A G and Valencia L I O. 2005. No tillage and crop rotation effects on soil aggregation and organic carbon in a Rhodic Ferralsol from southern Brazil. Soil and Tillage Research 80: 185-200.
Mittal J P and Dhawan K C. 1988. Research manual on energy requirements in agricultural sector. ICAR/AICRP/ERAS-88-1, PAU, Ludhiana, pp. 20-23.
Raun W R, Barreto H J and Westerman R L. 1993. Use of stability analysis for long-term soil fertility experiments. Agronomy Journal 85: 159-67.
Singh R P, Das S K, Bhasker Rao W M. and Reddy M N. 1990. Towards Sustainable Dry land Agricultural Practices. CRIDA, Hyderabad, pp. 1-106.
Singh Yadvinder, Singh Bijay, Ladha J K, Khind C S, Gupta R K, Meelu O P and Pasuquin E. 2004. Long-term effects on organic inputs on yield and soil fertility in the rice –wheat rotation. Soil Science Society of America Journal 68: 845-53.
Write A L, Hons F M and Matocha Jr J E. 2005. Tillage impacts on microbial biomass and soil carbon and nitrogen dynamics of corn and cotton rotations. Applied Soil Ecology 29: 85-92.

58
Soybean Research 11(1): 58-65 (2013)
A Study on Farmers’ Seed Replacement Rate of Soybean and Related Problems in Major Soybean Growing States
B U DUPARE1, S D BILLORE2 and S K VERMA3 Directorate of Soybean Research,
Khandwa Road, Indore 452 001, Madhya Pradesh E-mail: [email protected]
Received: 25.10.2011; Accepted 14.09.2012
ABSTRACT
The average national productivity of soybean has been hovering around 1.1 tons per ha during last few years. Unavailability of quality seed and poor seed replacement rate in major soybean growing states have been perceived to be a major constraint to achieve increased productivity levels. A study was, therefore, conducted in order to study the different issues associated with soybean seed and its replacement rate at farmers’ level. The data was collected using structured interview schedule from 300 respondents belonging to major soybean growing states, namely Madhya Pradesh, Maharashtra and Rajasthan on proportionate basis. It was observed that among the 17 odd varieties grown by the farmers, soybean variety JS 335 is popular among majority of the farmers followed by newly released ones like JS 93-05, JS 95-60, and NRC 7, which are steadily making inroads in the farmers’ field. It was interesting to note that because of unavailability of seed of new varieties and lack of knowledge about them, some old cultivars are still grown by the farmers of Madhya Pradesh. The efforts of State Seed Corporation of Maharashtra in fulfilling the certified seed to its farmers is worth welcome compared to rest of the states. The study revealed that more than 86 per cent of the Maharashtra farmers used certified seed for planting each year as compared to only 8 per cent in Madhya Pradesh and none in Rajasthan. Further, sources other than the primary extension agencies like input suppliers and fellow farmers are found to be major source of information related to arrival of new variety/seed availability. Unavailability of quality seed of required varieties is further documented to be a major problem for soybean growers of Madhya Pradesh and Rajasthan whereas farmers from Maharashtra are more concerned on other biotic aspects as State Seed Corporation is able to meet their seed requirement.
Keywords: Farmers, problems, seed, seed replacement, soybean, varieties
1 Senior Scientist (Agricultural Extension): 2 Senior Scientist (Agronomy); 3Technical Assistant

59
Soybean is an important and premier oilseed crop of the country which was cultivated on all time high area of 10.29 million hectare during the year 2011-12 and is estimated to be producing nearly 12.57 million tons with an average productivity of 1221 kg per ha (DAC, 2011). The major soybean growing states are Madhya Pradesh, Maharashtra, Rajasthan, Karnataka and Andhra Pradesh, of which first three states almost contribute about 90 per cent area (about 9.0 of total 10.13 M ha). The introduction of soybean during the late seventies and its commercial cultivation thereafter by the farmers of major soybean growing states have not only contributed enormously in order to meet out edible oil demand of the country, but also brought out desirable socio-economic changes in the farmers‟ lifestyle (Dupare et al., 2008 and 2009).
Seed constitutes the most basic, important and expensive input for productive agriculture in case of all the crops. Seed system uses the appropriate combination of formal, informal, market and non-market channels to efficiently meet farmer‟s demand for quality seed. Farmers use different sources to meet his seed requirement (Ravinder Reddy et al., 2007). In an agrarian based economy like India, majority of farmers have continued the practice of using their own produce as seed (farm saved seed) for the next season. The seed collected from produce is normally not of desired quality, and has telling effect on
productivity of crops, particularly in soybean seed, which itself is a poor germinating entity. The use of poor quality of seed is considered to be one of the major constraints in enhancing the soybean productivity in the country which is showing an upward trend after hovering around one ton per ha during last few years. In view of above the present study was conducted to study in detail the seed related problems of farmers belonging to major soybean growing states. MATERIAL AND METHODS
The present study was conducted in
three leading soybean growing states of the country, namely Madhya Pradesh, Maharashtra and Rajasthan. The data for the study were gathered from the farmers belonging to major soybean growing districts representing different agro-ecological zones of the concerned state. A semi-structured interview schedule consisting on questions seeking information on seed related aspects was formulated initially and was utilized after pre-testing on a limited scale with the farmers of Madhya Pradesh. The same was used to collect data from the farmers. In all, 300 respondents were included in the study with the proportionate sample of 160 farmers from Madhya Pradesh (Indore, Ujjain, Dhar, Dewas, Khargone, Badwani, Shajapur, Hoshangabad, Betul, Chhindwara), 110 farmers from Maharashta (Nagpur, Wardha, Amaravti, Akola, Buldhana, Aurangabad, Parbhani, Beed, Nanded, Latur, Satara, Sangli, Kolhapur and Pune) and 30 farmers from

60
Rajasthan (Kota, Jhalawad and Bundi). The information so collected was coded, collated, scored and analyzed using simple statistical tools like frequency and percentages after undertaking content analysis.
RESULTS AND DISCUSSION
Soybean varieties grown by the farmers
Although released as early as in 1994, JS 335 still continued to be a most popular variety among farmers belonging to the three states. The variety JS 93-05, followed the suit, but more popular in Madhya Pradesh as compared to other two states. A recently released (2006), extra-early maturing variety, JS 95-60 is gaining popularity in the state of Madhya Pradesh followed by Rajasthan. The exhibited wider adoptability, good germinability, and consistency in performance of JS 335 places this variety as preferred choice for the farmers of Maharashtra and cent percent farmers grow it. In addition, varieties like JS 93-05, is being grown by sizeable number of farmers. On probe, it was observed that this variety is sold by the input dealers in the name of Surabhi too. Some of the varieties released by Marathwada Agricultural University (MAUS 71 and 81), and Agharkar Research Institute (MACS 450 and 124) are in cultivation to a limited extent, particularly in the neighboring villages. It is worth mentioning here that there is a very strong network of seed outlets (both public and private), which are producing seeds of the popular varieties
in plenty and making it available to the farmers.
In the soya-state of Madhya Pradesh, comparatively larger number of varieties is being cultivated by the farmers. Although, the variety JS 335 still preferred by 40 per cent farmers of the state, the later short maturity duration introductions like NRC 7, JS 93-05 and JS 95-60 have made inroads in sizable area. The variety JS 97-52, although of longer maturity duration, was preferred for cultivation by the farmers due to its suitability in high rainfall or high soil moisture conditions. However, it is quite interesting to see the presence of very old varieties like JS 71-05, PK 1044, Ankur and JS 72-44 in farmers‟ fields in spite of not being present in the seed chain. It is worth mentioning that in the absence of harmony between the PPV and FR Act 2001, Bidiversity Act 2002 and the existing Seed Act, 1966, a good number of varieties (Anamika, BS 2, Gold 301, Star 111, Delta, Surabhi) not released by the formal system, are grown by the farmers in sizable area. Since these varieties are not in seed chain, are being multiplied by farmers at their own level and utilized for next sowing or making it available to other farmers. In the absence of knowledge to maintain purity and retain quality during production and storage, the seed of these varieties is of poor quality limiting yield levels. Almost similar is the tendency of soybean farmers in Rajasthan (Table 1).

61
Table 1. Soybean varieties grown by the farmers
State Maharashtra
(n=110)
Madhya Pradesh (n=160)
Rajasthan
(n=30)
Total
(N= 300)
Anamika* - 21 (13.12) - 21 (7.00)
JS 335 110 (100.00) 65 (40.62) 17 (56.66) 192 (64.00)
Sonia* - 11 (6.87) - 11 (3.66)
DS 228 2 (1.81) - - 2 (0.66)
BS2* - 5 (3.12) - 5 (1.66)
NRC7 - 21 (13.12) - 2 (0.66)
PK 1044 - 11 (6.87) - 11 (3.66)
JS 71-05 - 9 (5.62) - 9 (3.00)
JS 93 05 14 (12.72) 58 (36.25) 8 (26.66) 80 (26.66)
JS 95 60 - 10 (6.25) 5 (16.66) 15 (5.00)
Gold 301*, Star 111*, Delta*, Ankur
- 4 (0.62) - 4 (1.33)
Surabhi* 4 (3.63) - - 4 (1.33)
JS 72 44 - 12 (7.50) - 12 (4.00)
JS 97 52 - 9 (5.62) - 9 (3.00)
KHB441, MACS 450, MACS 124
3 (2.72) - - 3 (1.00)
MAUS 71 6 (5.45) - - 6 (2.00)
MAUS 81 3 (02.72) - - 3 (1.00) *Varieties of common knowledge which are not released by the formal system; Figures in parentheses indicate percentages
Source/availability of seed
The multiple choice responses of the
respondents on sources of seed (Table 2) brings out that Maharashtra is the leading state to use certified seed by the farmers as about 76 per cent of the requirement is met by Mahabeej (Maharashtra State Seed Corporation), 5 per cent by Cooperative Societies and 4 per cent by University/Research Stations. Remaining 15
per cent of seed requirement is met from farm saved seed (10 %) and from progressive farmers (5 %). On the contrary in Madhya Pradesh, only 22 per cent farmers obtain certified seed (Seed Corporations – 9 %, Cooperative societies – 11 % and University/Research Station- 2 %). The major source of seed is being farm saved (54 %), followed by purchase from neighbour (18 %) and from progressive farmers (7.5 %). Only 5 per cent farmers meet their seed requirement

62
Table 2. Sources of seed available to the farmers
Source Maharashtra (n=110)
Madhya Pradesh (n=160)
Rajasthan (n=30)
Total (N= 300)
Farm saved seed 12 (10.90) 86 (53.75) 30 (100.0) 128 (42.66) Progressive farmer 6 (5.45) 12 (7.50) 11 (36.66) 29 (9.66) Relative 0 (0.00) 2 (1.25) 3 (10.00) 5 (1.66) Neighbor 0 (0.00) 29 (18.12) 2 (6.66) 31 (10.33) Seed corporations 84 (76.36) 14 (8.75) 8 (26.66) 106 (35.33) Private seed companies
26 (23.63) 8 (5.00) 0 (0.00) 34 (11.33)
Cooperative societies 6 (5.45) 17 (10.62) 0 (0.00) 23 (7.66) SAUs/Research stations
4 (3.63) 3 (1.87) 5 (16.66) 12 (4.00)
Figures in parentheses indicate percentages
Table 3. Seed replacement rate of soybean farmers
Frequency of seed replacement
Maharashtra (n=110)
Madhya Pradesh (n=160)
Rajasthan (n=30)
Total (N= 300)
Every year 95 (86.36) 8 (5.00) 0 (0.00) 103 (34.33) After 2 year 8 (7.27) 32 (20.00) 8 (26.66) 48 (16.00) After 3 yrs 5 (4.54) 48 (30.00) 7 (23.33) 60 (20.00) After 4 years 2 (1.81) 28 (17.50) 12 (40.00) 42 (14.00) After 5 years 0 (0.00) 44 (27.50) 3 (10.00) 47 (15.67) Figures in parentheses indicate percentages
from private seed companies. Logically, the higher use of certified seed in Maharashtra keeps the average state productivity higher as compared to other two major states Moreover, although substantial quantity of soybean seed is produced by the seed companies located at Indore and around, it is sold in Maharashtra or other states. The status of Rajasthan in this respect is still not encouraging as 100 per cent farmers use their own farm saved seed and the other sources utilized for quality seed are limited (Seed corporations – 27 % and University/Research farms – 17 %). The average yield performance
of these three states is in line with the proportion of certified/quality seed utilized.
Seed replacement pattern
The information gathered on
frequency of seed replacement with certified/foundation seed by the respondent farmers in the three targeted states (Table 3) presents an eye opening picture. The survey revealed that more than 86 per cent of the Maharashtra farmers used certified seed for planting

63
each year as compared to 8 per cent in Madhya Pradesh and none in Rajasthan. Based on their past experience, the farmers of Maharashtra believe that their farm saved seed is poor in germination leading to sub-optimal plant population, it is unhealthy and under size to fight against biotic and abiotic stresses, and prefer to replace seed each year as it is easy and convenient and adequate availability of certified seed at their doorsteps by the Seed Corporations/Cooperatives and Sugar factories in the localities. The last agency is said to supply the seed free of cost. Rest of the farmers who were identified to be seed producer for State Seed Cooperative/Seed Companies are technically sound to manage seed vigour but still replace their seed within 2-3 years. No such efforts and awareness exists in other two states. Overall seed replacement of 34 per cent annually on an average is misleading as do
not reflect the skewed seed replacement rate in different states.
On the contrary, majority of soybean growers from Madhya Pradesh and Rajasthan which contribute nearly 62 per cent area, do not replace their seed with certified seed on annual basis. A sizable number of farmers in these two states are not able to replace their seed even after 4-5 years. Although awareness on quality seed exists and there is willingness to purchase at higher prices, the certified seed of desired variety in required quantity is not available to them. The altered weather conditions coupled with early withdrawal of monsoon during past one decade on account of global climatic change, farmers are inclined to grow early maturing varieties. The State Seeds Corporation, Madhya Pradesh is making certified seed of JS 335 available in bulk, whereas the demand for short
Table 4. Source of information about new varieties
Information source Maharashtra (n=110)
Madhya Pradesh (n=160)
Rajasthan (n=30)
Total (N= 300)
Krishi Vigyan Kendra 11 (10.00) 2 (1.25) 5 (16.66) 18 (16.00)
Department of Agrilculture 18 (16.36) 15 (9.37) 8 (26.66) 41 (13.66)
Input supplying agency 86 (78.18) 15 (9.37) 7 (23.33) 108 (36.00)
Progressive farmer 3 (2.72) 2 (1.25) 4 (13.33) 9 (3.00)
Agricultural Assistant/
Gram Sewak
5 (4.54) 9 (5.62) 3 (10.00) 17 (5.66)
Agricultural Research Station
39 (35.45) 4 (2.50) 2 (6.66) 45 (15.00)
TV/Newspaper 4 (3.63) 0 (0.00) 2 (6.66) 6 (2.00)
Interaction among farmers 15 (13.63) 58 (52.72) 6 (20.00) 79 (26.33)
Seed Corporation 0 (0.00) 4 (2.50) 0 (0.00) 4 (1.33)
Neighbor/Relative 0 (0.00) 30 (18.75) 4 (13.33) 34 (11.33) Figures in parentheses indicate percentages

64
duration varieties like JS 93-05, JS 95-60 and NRC 7 is more among farmers. As far as the seed sector is concerned, there appears to be missing harmony between public-private-growers leading to lower seed replacement rate in other states than Maharashtra, thereby affecting national productivity.
Information Sources utilized by the farmers
The respondent farmers attempts to get information about new varieties from multiple sources. It is unpleasant to learn that in Maharashtra, farmers have better contacts with input supplying agencies rather than State Department of Agriculture/ Agricultural Assistant / Gram Sewak, which
should have been the primary agency to provide information. More faith to seek information is disposed on the Agricultural Research Stations followed by interaction among farmers. In Madhya Pradesh, the interaction among farmers turned out to be the major information source followed by flow of information from neighbour/relative, State Department of Agriculture/ Agricultural Assistant/Gram Sewak and input supplying agencies in that order. In Rajasthan, the formal system, State Department of Agriculture/ Agricultural Assistant/Gram Sewak constitute main source for providing information followed by input supplying agency, interaction among farmers, Krishi Vigyan
Table 5. Seed related problems
Problem Maharashtra (n=110)
Madhya Pradesh (n=160)
Rajasthan (n=30)
Total (N= 300)
Unavailability of seed 7 (6.36) 92 (57.50) 12 (40.00) 111 (37.00) Unavailability of new variety
5 (4.54) 27 (16.87) 7 (23.33) 39 (13.00)
Poor quality/undersize seed 0 (0.00) 34 (21.25) 8 (26.66) 42 (14.00) Lack of information on new varieties
0 (0.00) 13 (8.12) 14 (46.66) 27 (9.00)
Poor germination 0 (0.00) 30 (18.75) 0 (0.00) 30 (10.00) Other Problems
Management of Spodoptera litura
33 (30.00) 0 (0.00) 15 (50.00) 48 (16.00)
Weed management 26 (23.63) 39 (24.37) 3 (10.00) 68 (22.66) Insect attack (semilooper, girdle beetle, tobacco caterpillar)
0 (0.00) 57 (35.62) 12 (40.00) 69 (23.00)
Disease (YMV) 0 (0.00) 26 (16.25) 18 (60.00) 44 (14.66) Lack of knowledge about package of practices
0 (0.00) 48 (30.00) 6 (20.00) 54 (18.00)
Figures in parentheses indicate percentages

65
Kendras and progressive farmers. This brings out that there is an urgent need to look into the functioning of State Department of Agriculture functionaries, which should be largely responsible for dissemination of information. There is need to look into proper functioning of Krishi Vigyan Kendras also, which are supposed to play the role of information centres.
Seed related and other constraints
The data related to seed related problems faced by the farmers of major soybean growing states (Table 5) revealed that farmers of Maharashtra do not face the issue of non-availability of quality seed as the Maharashtra State Seed Corporation is capable of supplying the required quantity of soybean seed to meet their needs. Instead, farmers of Maharashtra were more worried on yield erosion due to weeds and management of insect-pests, particularly that of Spodoptera litura. On the contrary, seed related constraints (unavailability of required quantity of seed, unavailability of seed of
new varieties, poor quality/undersize seed and lack of information on newer varieties) along with management of insect-pests (semilooper, girdle beetle, tobacco caterpillar), disease (YMV) and lack of knowledge on production package constitute major flaws in Madhya Pradesh and Rajasthan.
From the aspects discussed above, it is imperative to promote varietal diversification in the soybean growing states for increasing the productivity of soybean in major soybean growing states of India,. Further, the constraints related to availability of quality seed in some of the states needs to be addressed by the appropriate institutions through popular seed outlets. The low seed replacement rate at farmers‟ level in the soy-state of Madhya Pradesh and Rajasthan is needed to be increased in order to harness the production potential of this golden bean. The state extension machinery should also take necessary steps to impart necessary skills to farmers in order to produce soybean crop for the quality seed purpose.
REFERENCES DAC, GOI. 2011.
(http://agricoop.nic.in/ncfcweather/ncfcasOct-07-2011.pdf) and (http://eands.dacnet.nic.in/Advance_Estimate/1stAdvance2011-12-English.pdf).
Dupare B U, Billore S D, Joshi O P and Husain S M. 2008. Origin, domestication, introduction and success of soybean in India. Asian Agri-History 12(3): 179-95.
Dupare B U, Billore S D, Joshi O P and Verma S K. 2009. Transformed post-soybean
introduction farming scenario in Madhya Pradesh. Soybean Research 7: 51-63.
Ravinder Reddy Ch, Tonapi V A, Bezkorowajnyj P G, Navi S S and Seetharama N. 2007. Seed system innovations in the semi-arid tropics of Andhra Pradesh, International Livestock Research Institute (ILRI), ICRISAT, Patancheru, Andhra Pradesh, 502324 India. Pp: 224.

66
Soybean Research 11(1): 66-73 (2013)
Yield Performance of Soybean in Vindhyan Plateau of Madhya Pradesh
R K SINGH*1, S R K SINGH**2, T K SINGH***3, U S GAUTAM**4 and A K DIXIT****5
Krishi Vigyan Kendra, Panna*, ZPD Zone VII, Jabalpur**, 3College of Agriculture, Rewa***, Krishi Vigyan Kendra Ujjain, Madhya Pradesh.
E mail: [email protected]:[email protected]
Received: 18.05.2012; Accepted: 21.12.2012
ABSTRACT
Demonstrations on improved production technology for soybean were organized on the farmers’ field of Sehore districts under Vindhyan plateau agro-climatic zone of Madhya Pradesh for consecutive four years (2007-08 to 2010-11). Results showed that by adoption of improved production technology by the farmers led to increase in average yield by 18.2 per cent and net returns by 31.6 per cent over farmers’ practice (1,320 kg/ha and ` 11,358/ha). The cost benefit ratio for improved practice worked out between 1:1.9 and 1:2.0 in case of adoption of improved module as compared to 1:1.7 and 1.8 in farmers’ practice. Key words: B: C ratio, relative spread index, technology gap, technology index, yield
Soybean is a predominant kharif crop
of Madhya Pradesh. Sehore is one of the key district devoting 3, 25, 421 hectares (Districts Statistics Book, 2010) area under the crop of 55, 00, 193 ha under soybean cultivation in Madhya Pradesh (Agrawal et al., 2010). Current productivity of the crop in the district is 1, 360 kg per ha as against national productivity of 1, 089 kg per ha, which is low as compared to its potential yield in the experimental station (Kumar, 1997). Some of the crucial factors for realized low productivity are inadequate and imbalanced nutrient management devoid of integrated
approach, and poor management of weeds and insect-pests. Although research emanated production technology has already been developed, yet could not effectively reach to the farmers. Organization of demonstration is one of the most effective extension techniques to persuade the farmers on adoption of improved technology. The present investigation deals with demonstration of a module with key production practices to convince the farmers of its advantages and popularize among them.
1Subject Matter Specialist; 2Senior Scientist; 3Assistant Professor; 4Principal Scientist 5Project Coordinator

67
MATERIAL AND METHODS
A total of 52 demonstrations (13 each year covering 5 ha) were organized in the adopted villages, namely Dhablamata, Amlaramjipura, Bheelkhedi and Rola of Sehore district of Madhya Pradesh during kharif seasons of consecutive four years (2007-08 to 2010-11) in the selected farmer‟s fields. For the selection of farmers to conduct the demonstrations, a farmers‟ group meeting was convened each year and the receptive and innovative farmers were selected. The module of improved practices demonstrated included use of balanced dose of fertilizers (20:60:20 N: P205:K2O kg/ha) after adjustment with soil test values, use of disease resistant variety and seed treatment with fungicide (carbendazime and thiaram @ 2 + 1 g/kg seed) and seed inoculation with Bradyrhizobium japonicum and phosphorus solubilizing bacteria (PSB) @ 5 g per kg seeds each and one spray of carbendazime (0.1 %) and endosulphon (0.07 %) at pod initiation stage. The performance of the crop under module was compared with the farmers‟ practice in the same location. The farmers practice included use of 50 kg diammonium phosphate per ha, use of higher seed rate (125 kg/ha) and seed sown without seed treatment with fungicides and inoculation with Bradyrhizobium japonicum and PSB. The soil of demonstrations fields belonged to Vertisols.
The soybean crop was sown between
second and last week of June and harvested in last week of September to first week of October The seed rate for variety JS 95-60 and
JS 93-05 used was 87 kg and 75 kg per ha. Soil test based tailored NPK fertilization was done as basal. The crop was protected from insect-pests and diseases as per recommendations. The observations on incidence of Rhizoctonia blight and unfilled pods by stem-fly infestation were taken at five places by randomly placing a quadrate in each demonstration and on selected five plants from each quadrate at pod initiation stage. The per cent damage by Rhizoctonia blight (No. of damaged plants/No. of plants observed × 100) and damaged pods (No. of damage pod per plant/Total No. of pods per plant observed × 100) was worked out. The yield data from each demonstration and farmer‟s crop was collected after harvesting the crop. Five plants were randomly selected from each quadrate, thus from each demonstration 25 plants were drawn for recording the observations on yield parameter such as pods per plant. A sample of 100 seeds was drawn and weighed to record the seed index.
For economic evaluation in term of grass and net returns and cost benefit ratio, the prevailing rates for input, labour and produce was utilized.
The technology gap, extension gap and technology index (Samui et al., 2000) and relative spreading indexes (Lanka, 1999) were worked..
A comprehensive questionaire was developed for the collection of data through rural agricultural extension officers (RAEO) regarding horizontal spread of both varieties in the study area. The questionnaire was pre-tested before actually conducting the interviews of the beneficiaries.

68
Extension gap = Demonstration yield - Farmers yield Technology gap
= Potential yield – Demonstration yield
Technology index
= (Potential yield – Demonstration yield)/ Potential yield × 100
Relative spread index
= Area of soybean crop expressed as per cent of total cultivated area of the district/Area of the crop expressed as per cent of total cultivated crop area in districts × 100
RESULTS AND DISCUSSION
Yield
Adoption of module of improved technology remarkably increased (16.8 to 20.7 %) the seeds yield of soybean over farmers‟ practice during the span of four years of demonstrations. On an average basis, irrespective of variety and seasonal variations, the average yield achieved under module was 1, 560 kg per ha as compared to that of 1, 320 kg per hectare under farmer‟s practice, which was 18.38 per cent higher. Although the potential yield of the two varieties (JS 93-05 and JS 95-60) is higher than the productivity achieved under real field conditions using the module (Table 1). This is in agreement with the suggestion of Cassman (1999), who reported that even cereals under
best production systems can perform to the maximum extent of 80 per cent of potential productivity under real field conditions. The very reason for improved productivity through the tested module appears to be soil test based balanced and integrated approach involving fertilizers and bio- fertilizers which play a vital role in making available N, P and K as per plant needs (Gautam and Pant, 2002 and Pauline et al., 2010). The results clearly indicated the impact of FLDs over the existing practices towards enhancing the
yield of soybean in Sehore district (Madhya Pradesh) as an cumulative effect of yield attributes namely number of pods per plant (19.9) and seed index (11.3 g/100 seeds) under recommended practices as compared to farmers‟ practices (16.3 and 11.2 g/100 seeds, respectively). The year-
Table 1. Effect of module on improved production technology on yield and yield attributes
in 52 demonstrations (thirteen each year)
Year Variety Yield Potential (kg/ha)
Plant population(No/m2)
Pods (No/plant)
Seed index (g/100 seeds)
Yield (kg/ha)
RM FP RM FP RM FP RM FP
2007-08 JS 9305 2000-2300 36.5 39.0 19.0 15.0 10.9 10.8 1460 1250 2008-09 JS 9305 2000-2300 38.0 39.0 19.0 15.5 10.9 10.8 1520 1280 2009-10 JS 9560 1800-2000 38.0 36.0 18.5 16.5 11.7 11.5 1480 1260 2010-11 JS 9560 1800-2000 38.0 39.5 23.0 18.0 11.7 11.6 1810 1500 Average 37.6 38.4 19.9 16.3 113 11.2 1560 1320
RM – Recommended module; FP – Farmer’s practice

69
to-year fluctuations in yield can be explained on the basis of variations in microclimatic condition of that particular village. The yield increase with the module under the farming situation of demonstration area is likely to be effective in area with similar microclimate. Mukherjee (2003) has also opined that depending on identification and use of farming situation, specific interventions may have greater implications in enhancing systems productivity. Yield enhancement in different crops in front line demonstration has amply been documented by Tiwari et al. (2003) and Tomer et al. (2003).
Economic evaluation
The cost of cultivation in demonstrations was comparatively higher (INR 14, 000 to 15, 500) as compared to farmer‟s practice (INR 12, 500 to 14, 600) on account of additional input provided in the demonstration. The gross returns (INR 26, 000 to 34, 295) and net returns (INR 12, 000 to 18, 795) were derived from demonstrations as compared to farmer‟s practices (INR 22, 500 to 28, 300) and net returns (INR 10, 000 to 13, 700). On average basis, the increase in net
returns from adaptation of improved production module was 31.56 per cent over farmer‟s practice (Table 2). The benefit cost ratio was accordingly reflected for demonstrations (1:1.9 to 1:2.0) and farmer‟s practice (1:1.7 to 1:1.8). Year to year variations in cost of cultivation was on account of variability in cost of inputs and that of produce. The result suggests economic viability and agronomic feasibility of demonstrated module in soybean cultivation. The observed results are in conformity of findings reported by Siddique et al. (2004), Deshmukh et al. (2005) and Jain and Trivedi (2006). Extension and technology gap and technology index
The variability technology gap (190 to
1, 040 kg/ha; average 683 kg/ha), which indicated lower exploitation of varietal potential, which might not have been feasible on account of variable and less favourable climate and deficit in crop management (Table 3). The extension gap varied between 210 to 310 kg per ha
Table 2. Economic evaluation of adaptation of module on improved production technology
Year Cost of cultivation (INR /ha)
Grass returns ( INR /ha)
Net returns (INR /ha)
B:C ratio
RM FP RM FP RM FP RM FP
2007-08 14000 12500 26000 22500 12000 10000 1:1.9 1:1.8
2008-09 14500 13000 28880 24132 14380 11320 1:2.0 1:1.8
2009-10 15500 14600 30100 25200 14600 10600 1:1.9 1:1.7
2010-11 15500 14600 34295 28300 18795 13700 1:2.0 1:1.8
Average 14875 13675 29819 25033 14943 11358 RM – Recommended module; FP – Farmer’s practice

70
Table 3. Extension gap, technology gap and technology index
Year Technology gap (kg/ha) Extension gap (kg/ha) Technology Index (%)
2007-08 1040 210 32.1 2008-09 980 240 29.3 2009-10 520 220 35.1 2010-11 190 310 9.5 Average 683 245
(average 245 kg/ha) indicating the need for popularizing and adaptation of improved technology by the farmers. The technology index indicating the inverse relation with feasibility of technology varied between 9.5 and 35.1 per cent. Although, the fluctuation and uncertainty of prevailing climate regulates the feasibility, the reduction in technology index to 9.5 is good indicator of increased feasibility of suggested production module in these demonstrations and can be adopted by the farmers of the region. Similar results were reported by Sagar and Chandra (2004).
Disease incidence
The data recorded on plants infested with Rhizoctonia blight caused by
(Rhizoctonia soloni) revealed lower infestation in crop under demonstrations as compared to farmer‟s practice. On an average basis only 5.1 plants per square meter showed wilting symptoms in demonstration as compared to
7.8 plants per square meter in farmers practice. Percentage of damaged plant was only 12.2 in demonstration vis a vis 16.1 in farmer‟s practice (Table 4). This indicated that seed treatment with fungicides (thiram and carbendazim) and spray of carbendazim must have been influential. This observation gets the support the work of other workers (Maunio et al., 2006 and Jatender et al., 2006), who reported that thiram alone and in combination with carbendazim is highly effective inhibiting mycelia and fungal germ tube growth of
Table 4 Impact of imparted module on pest and diseases incidence
Year Wilt affected plants (No/m2)
Damage (%) Shading of premature pods
(No/plant)
Damage (%)
RM FP RM FP RM FP RM FP
2007-08 4.5 7.0 10.9 15.2 6 10 24.1 40.0
2008-09 6.0 9.0 14.3 15.2 5 9 20.8 36.7
2009-10 5.0 8.0 11.9 18.2 5 8 21.2 32.6
2010-11 5.0 7.5 11.6 15.9 4 6 15.1 18.2
Average 5.1 7.8 12.2 16.1 5 8.3 20.3 31.8 RM – Recommended module; FP – Farmer’s practice

71
the pathogen and in reducing Rhizoctonia blight incidence and increased seed yield. Insect pest infestation
Infestation of stem-fly (Melanagrousmyza sajae) in soybean leads premature shading of pods. Spraying of endosulfon @ 0.07 per cent at flowering and pod initiation stage reduced the premature shading by 33.8 per cent as compared to farmers practice (Table 4). Similar observations were reported by Bagle and Verma (1990), Parsai et al., (1991) and Savajji (2006).
Horizontal spread of the demonstrated technology
During 2007- 08 to 2010-11, the total horizontal spread of the module increased seven times (from 4 500 to 28 700 ha) with lesser change in cropped area under soybean cultivation in Sehore district. There has been remarkable increase in coverage of the two varieties. It was noted that during 2007-08 to 2010-11 with the increasing area (10.1 %) under the two varieties, the relative spread index was also increased. These two varieties
dominated from the point of view of adoption and productivity in the Sehore district. The adoption of soybean varieties namely, JS 95-60 and JS 93-05 along with suggested module by the farmers can improve their productivity with decreased cost. Impact of technology The mean yield of 52 FLDs conducted has exhibited 16.8 - 20.6 per cent increase seed yield of soybean at different locations against farmer‟s practice, which was primarily due to release of high yielding and disease resistant varieties and adoption of improved technology module. The assessment of horizontal spread of the technology amounted to its spread in 28, 700 ha over four years providing additional yield of 6, 888 tons. It was possibly a result of effective dissemination of evaluated module among practicing farmers and input by RAEOs in terms of field oriented activities involving training programmes, personal motivation and provision of literature on package and practices of soybean crop.
The demonstrations conducted for consistently four years pointed out that
Table 5. Horizontal spread of improved technology in farming community
Year Horizontal spread of
module (000 ha)
Kharif area (000 ha) of the districts
Soybean area in the
districts (000ha)
Per cent area covered by
soybean in the districts
Per cent area
under variety
Relative spread index
2007-08 4.5 304.6 265.8 87.2 1.6 1.8
2008-09 14.5 311.0 284.5 91.4 5.0 5.4
2009-10 21.6 309.0 282.5 91.2 7.6 8.3
2010-11 28.7 314.8 284.5 90.3 10.1 11.2

72
these can serve as an effective tool for transfer of improved technology culminating in enhanced yield of soybean in the demonstration area and also area with
similar microclimate. The module demonstrated is economically viable and agronomically feasible.
REFERENCES
Agrawal P, Matlani G and Agrawal R C. 2010. Area production estimate of Soybean Kharif.Ref.2010.SOPA/2.11JSP/2010/30. The Soybean Processors Association of India, pp. 1-5.
Bagle B G and Verma S.1990. Bioefficacy and persistence of phorate and monocrotophos on soybean. Indian Journal of Plant Protection 18 (2): 177-85.
Cassman K G. 1999. Ecological intensification of cereal production systems: Yield potential, soil quality and precision agriculture. Proceedings of National Academy of Science (USA) 96: 5952-9.
Deshmukh K K, Khatik S K and Dubey D P. 2005. Effect of integrated use of inorganic, organic and bio-fertilizer on production, nutrient availability and economic feasibility of soybean grown on soil of Kaymore Plateau and Satpura hills. Journal of soils and crops 15 (1): 21-5.
Districts statics book (2010). Crop wise area production and productivity, pp 34-8.
Gautam P and Pant L M. 2002. Effect of pseudomonas species and Bradyrizobium japonicum on nitrogen and phosphorus availability to soybean (Glycine max). Indian Journal of Agriculture Science 72 (40): 248-51.
Jain P C and Trivedi S K 2006. Response of soybean {Glycine max (L) Merrill} to phosphorus and bio-fertilizers. Legume Research 28(1): 30-3.
Jatender K, Hans prem D, Tyagi, Hans R, Kataria, Rajendra K and Grover. 2006. The Influence of soil and other physical factor on the antifungal activity of Carbendazime against Rhizoctonia solani. Pesticide Science 12(4): 425-32
Kumar J. 1997. Missed opportunities. In: The Hindu Survey of Indian Agriculture, pp. 49-53.
Lenka D. 1999. Commercial crop Kalayani Publisher Vol -1, pp 219.
Mauncio C, Meyere, Cesar J, Bueno, Nilton L, De Souza, Joset and Yorinon. 2006. Effect of doses of fungicides and plant resistant of Rhizoctonia foliar blight of soybean and on Rhizoctonia solani AG-1 in vitro development. Crop Protection 25(8): 848-54
Mukherjee N. 2003. Participatory Learning and Action. Concept Publishing Company, New Delhi, India, pp 63-5.
Parsai S, Choudhary R and Deshpande R. 1991. Efficacy and economics of some insecticides in the management of soybean stem fly, Melanagromyza sojae. Bharathiya Krishi Anudhana Patrika 6(2): 85-90.
Pauline M. Mabapa1, John B. O. Ogola1, Jude J. O. Odhiambo, Anthony Whitbread and John Hargreaves. 2010. Effect of phosphorus fertilizer rates on growth and yield of three soybean (Glycine max) cultivars in Limpopo Province. African Journal of Agricultural Research 5(19): 2653-60.

73
Sagar R L and Ganesh Chandra. 2004. Front Line demonstration on seasame in west Bengal. Agricultural Extension Review 16(2): 7-10.
Samui S K Moitra S, Ray D K, Mandal, A K and Saha D. 2000. Evaluation of front line demonstration on groundnut. Journal of the Indian Society of Costal Agriculture Research 18(2): 180-3.
Savajji Kavita. 2006. Biological and management of soybean stem fly Melanagromyza sojae (Zehntner). M Sc (Ag) Thesis University of Agricultural Sciences, Dharwad, Karnataka
Siddque M H, Lakho A A and Oad F C. 2004. Economics of inoculated and uninoculated soybean under different nitrogen level. Asian Journal of Plant Science 3: 254-5.
Tiwari R B. Singh Vinay and Parihar Pushpa. 2003. Role of front line demonstration in transfer of gram production technology. Maharashtra Journal of Extension Education 22 (1): 19-20.
Tomer L S, Sharma P B and Joshi K. 2003. Study on yield gap and adaptation level of potato production technology in gird region. Maharashtra Journal of Extension Education 22 (1): 15-18.

74
Soybean Research 11(1): 74-79 (2013)
Assessment of Improved Weeding Technology for Reducing Drudgery of Farm Women while Weeding Soybean Crop
REKHA TIWARI1, A K DIXIT 2 and S K KAUSHIK3
Krishi Vigyan Kendra (RVSKVV), Ujjain 456 010, Madhya Pradesh E mail: [email protected]
Received: 16.08.2012; Accepted: 16.10.2012
Key Words: Body discomfort, drudgery, weeding
The contribution of women farmer to the Indian agriculture is unparallel as they are accomplishing arduous field operation using traditional tools and gadgets along with household chores. These implements are not only the source of drudgery but also a major cause of low efficiency and output. AICRP on Home Science (1996-2001) conducted a study to find out the drudgery prone activities performed by women in the areas of farm, allied and home and it was observed that transplanting, cutting/uprooting and weeding activities were performed primarily by women. The time spent and difficulties experienced were also found high in these farm activities involving maximum drudgery. Another study quoted by Sadangi and Pattanaik (2006) also reported that, farm operations like weeding, cutting and carrying harvested crop were the moderately heavy activities. For minimizing the drudgery involved in any of such activities, would require
introduction and adoption of labour saving and drudgery reducing technologies enabling rural-women to participate more energetically with increased efficiency. According to Kulkarni and Gite (2009), the experimental studies of ergonomical characteristic gives information on capacity of person to work at different comfort levels and includes anthropometric data, muscular strength and maximum aerobic capacity. Hence, ergonomic study for minimizing the drudgery involved in the activities and to address adequately the realities of these rural women life and to assist them in obtaining equal access to resources and farm technologies is very much important. Keeping all these ergonomical views, the present comparative study was carried out to assess the perceived exertion and body discomfort of the working women for assessing the muscular stress involved in the activity and to assess the heart beat rate and energy expenditure of working farm women.
1,3SMS; 2Programme Coordinator
75
For the present study, randomly 20 women were exclusively selected from adopted cluster area (villages Jalalkhedi and Akasoda) of District Ujjain (Madhya Pradesh).
For analysis of the comparative study between existing tool (khurapi) and improved tool (twin wheel hand hoe weeder) while performing the weeding activity in kharif crop- soybean and the following parameters were studied. General information about the respondent was collected and analysed. Rate of perceived exertion (RPE): RPE was assessed by using the five point scale from very light to very heavy and at three periods, i.e. resting, working and recovery. The score of the scale was – very light (1), light (2), neutral (3), heavy (4), and very heavy (5). Muscular stress: Specially designed body map was used for assessing the body discomfort. The body map where all the body parts were denoted was shown to all the respondents and the assessed responses of the questions were recorded on five point scale basis with score of scale, very mild (1), mild (2), neutral (3), severe (4) and very Severe (5).
Heart beat rate: Heart beat rate per minute were counted down for resting (before) and recovery (after) period while performing the weeding activity in soybean. Digital apparatus (Acon, Acon Laboratories Inc.) automatic blood pressure monitor, REF OB 11-11 was used for collecting the data. On that equipment not only heart beat rate, but blood pressure (systolic and diastolic) in mm Hg was also recorded.
Energy expenditure: Based on heart beat rate, the energy expenditure was calculated using the formula given by Varghese et al. (1994). EE (Kj/min) = 0.159 x Heart beat rate (beats/min) - 8.72 Constraints: Constraints of the improved tool was also studied in the form of feed back of the respondents. Drudgery Index: Drudgery index was calculated by using the following formula given by (Anonymous, 1998-99) X + Y + Z / 3 *100
Where X = co-efficient of time, Y = co-efficient of degree of difficulty, and Z= co-efficient of frequency of performance
All the respondents were married and were in the age group of 25 to 40 years, weighed between 37 and 45 kg and were 140-153 cm tall. None of the respondent was suffering from any chronic illness and all were physically fit.
Comparison between existing and improved method was studied in terms of body discomfort in terms of muscular stress. The percentages were drawn as per the response received from the respondents. The consequences of the two methods of weeding under study also brought out that various body parts were affected considerably by execution of weeding operation by khurapi rather than by two wheeled hoe (Table 1). Majority of respondents reported severe to very severe pain in body parts in former method and the trend was just reverse in later. Very severe impact on cervical point (80 %), knee (80 %), lumber point (75 %),
76
thigh (75 %), neck (60 %) and feet (50 %) was noted in respondents while using khurapi. On the contrary, only 10 per cent experienced pain on cervical point and lumber point, 5 per cent on neck and no pain in thigh and knee when twin wheeled hoe was used. Discomfort in wrist was severe with khurpi (70 %), which was just 30 per cent in two wheeled hoe. Only 40 per cent of respondents experienced head-ache while weeding with khurpi (Table 1). All most all respondents were satisfied with two wheeled hoe which required less strain and body pain. The drudgery index was found to be lower (73 %) for the improved method (twin wheel hoe) as compared to 92 per cent for existing method (khurapi) of weeding (Table 2) indicating reduction in extent of drudgery. Apart from considerable reduction in drudgery in weeding with twin wheeled hoe, the efficiency of weeding operation was remarkably improved (Table 2). The weeded area covered was nearly double (55.9 m2/h/labour) in twin wheeled hoe as compared to performing the operation by khurpi (30.5 m2/h/labour). Although the heart beat during resting period was almost equal (75 and 76 beats/minute, respectively), it was comparatively lower (92 beats/minute) in operation with khurapi than twin wheeled hoe (101 beats/minute) during recovery period. Since energy expenditure was dependent exclusively on heart beat rate and hence it showed concomitant increase with heart beat rate. The demand for energy was more in weeding with twin wheeled hoe as compared to khurpi. The rate of perceived exertion representing the end feeling by the respondents was noticed maximum in case of improved method.
Posture, an important causative factors for increasing or decreasing the drudgery, showed a change from squatting (weeding by khurpi) to standing (weeding by twin wheeled hand hoe) indicating comfort to the operator. In many studies, it was quoted that squatting posture for continuous and for prolonged period was very harmful as compared to any other posture. According to the Saha (1994), the major health problems related to abnormal working posture are 'the problems of aches' of the muscular skeletal system. Working at abnormal posture such as bending, stooping, twisting etc., might be the likely cause of many health problems, particularly in the muscle skeletal system in the long-run. Posture related discomfort (muscilo-skeletal problems as measured by lumber and cervical point) to respondents was reported to be more in farm activity like weeding as compared to household and allied chores (Anonymous, 1998-99) .
Analysis of work out put revealed
that one labour covered 30.5 m2 per ha by using traditional khurapi amounting to 244 m2 in a day of 8 hours working. This means 40 labours would be required to cover one hectare in a day costing INR 6 360 (@ INR 159/day/labour). In case of improved method, one labour covered 55.9 m2 per ha amounting to 447.2 m2 in a day. This would require only 22 labours for covering one hectare in day and the total cost on labour would be INR 3 498 (@ INR 159/day/labour) only. This brings out that switching weeding operation from khurpi to twin wheeled hand hoe will save INR 2 862 per hectare saving expenditure and energy of farm women coupled with reduction in drudgery.

77
Table 1. Assessment of body discomforts in existing and improved method (N = 20)
Body parts Existing method (Khurapi) Improved method (Twin wheel hand hoe)
Very mild
Mild Neutral Severe Very severe
Very mild
Mild Neutral Severe Very severe
Eye 2 (10) 4 (20) 5 (25) 7 (35) 2 (10) 8 (40) 7 (35) 1 (05) 3 (15) 1 (05)
Neck - 1 (05) 4 (20) 3 (15) 12 (60) 6 (30) 11 (55) 1 (05) 1 (05) 1 (05)
Cervical point
- - 1 (05) 3 (15) 16 (80) 1 (05) 4 (20) 7 (35) 7 (35) 1 (05)
Lumbar point
- - - 5 (25) 15 (75) - 2 (10) 11 (55) 5 (25) 2 (10)
Fingers - - 8 (40) 8 (40) 4 (20) 1 (05) 10 (50) 7 (35) 1 (05) 1 (05)
Wrist - - - 14 ((70) 6 (30) 1 (05) 5 (25) 5 (25) 6 (30) 3 (15)
Leg - - 5 (25) 7 (35) 8 (40) - 4 (20) 16 (80) - -
Thigh - - 1 (05) 4 (20) 15 (75) 5 (25) 9 (45) 6 (30) - -
Knee - - 1 (05) 3 (15) 16 (80) 5 (25) 9 (45) 6 (30) - -
Feet - - 1 (05) 9 (45) 10 (50) 3 (15) 9 (45) 7 (35) 1 (05) -
Head- ache 12 (60) - 8 (40) - - - - - - - Figures in parenthesis are per cent values.

78
Table 2. Comparative parameters of exiting and improved method (N = 20)
Parameters Existing method (Khurapi)
Improved method (Twin wheel hand hoe)
Drudgery index (%) 92 73
Heart Rate (beats/min)
Resting period 75 76
Recovery period 92 101
Energy Expenditure (Kj/min)
Resting period 3.24 3.38
Recovery period 5.91 7.33
Rate of perceived exertion
Resting period 1 1
Working period 3 4
Recovery period 2 3
Posture Squatting Standing
Total area covered (m2/h/labour) 30.5 55.9
The data generated on feedback from
respondents on constraints of performing the weeding by twin wheeled hand hoe brought out that it requires practice for smooth functioning (70 %). About 80 and 90 per cent respondents expressed that sometimes during incessant rain and on wet land surface, respectively it becomes difficult to operate the hoe in the field. Responses from respondents also revealed that the improvement in twin wheeled hoe with respect to slight reduction in weight (65 %), adjustable height as per the height of worker (40 %), change in shape of handle making it straight rather than curved (70 %) can further
make it convenient and increase in efficiency of weeding.
The study clearly brings out that switching from existing method (khurapi) to improved method (twin wheeled had hoe) is effective in reducing drudgery and body discomfort coupled with double output per unit time in half the expenditure on weeding operation. For the kharif crop like soybean, timely weeding operation within the narrow window of time is important and can save the crop from weed competition and yield loss. Hence, the use of twin wheeled hand hoe needs popularisation in the women workers in order to reduce drudgery.

79
REFERENCES AICRP on Home Science. 1996-2001. Five years
report of All India Co-ordinated Research Project on Home Science, Education Division, ICAR, New Delhi, Pp-1-309.
Anonymous. 1998-99. Report of All India Coordinated Research Project (AICRP) on 'Ergonomic evaluation of farm women in Home, Farm and Allied activities'. , Department of Home Management, College of Home Science, Marathwada Agriculture University, Parbhani, Maharashtra State, pp 1-110.
Kulkarni S D and Gite L P. 2009. Drudgery reducing equipment for farm women. Published material of ICAR Winter School, Gender Empowerment in Agriculture, 18 Feb 10 to March 2009. Division of Agricultural Extension, ICAR New Delhi, pp 83-91.
Sadangi B N and Pattainaik Saswati. 2006. Drudgery reduction – a step towards women empowerment. Indian Farming: 7-9 and 14.
Saha P N. 1994. Ergonomics and its scope in the modern industrial society. Training Background Material of Course on Ergonomics, organised by P. G. Department of Family Resource Management, SNDT. Women's University, Mumbai, Maharashtra State.
Varghese M A and Surabhatula P. 1994. Ergonomic evaluation of floor care activities using different equipments. Training Manual of Ergonomics Background Material, organised by Post-Graduate Development of Family Resource Management SNDT, Women University, Pp. 1-210.

80
Soybean Research 11(1): 80-83 (2013)
Effect of Sulphur on Seed Yield, Nutrient Content and Uptake by Soybean [Glycine max (L.) Merrill]
S R S RAGHUWANSHI1, O P S RAGHUWANSHI2, R UMAT3, G R AMBAWATIA4 and K S BHARGAV5
Krishi Vigyan Kendra (RVSKVV), Shajapur 465 001, Madhya Pradesh (E-mail: kvkshajapur @rediffmail.com)
Received: 30.12.2011; Accepted: 01.01.2013
Keywords: Levels of sulphur, gypsum, soybean yield Sulphur is one of the essential secondary plant nutrients. Its importance in Indian Agriculture is being increasingly emphasized. Its role in crop production particularly in oilseed and pulse crops has earlier been reported (Prasad, 2006). Sulphur deficiency causes 12-15 per cent reduction in seed yield of soybean (Kandpal and Chandel, 1993; Sharma, 2003). Since, adequate information on soybean responses to sulphur application on medium black clay soil of Madhya Pradesh is not available, the present study was undertaken to know the effect of sulphur levels on performance and nutrient acquisition by soybean.
A field experiment was conducted during the kharif seasons 2007 and 2008 at Krishi Vigyan Kendra farm, Shajapur. The soil was medium black, clayey in texture with pH 7.80. The available nitrogen, phosphorus, potassium and sulphur contents
were 218 kg N , 13 kg P2O5, 580 kg K20 and 9.75 S kg per ha, respectively. The experiment was laid out in randomized block design with four replications. The treatments consisted 6 levels of sulphur (0, 10, 20, 30, 40 and 50 kg/ha). Sulphur was applied through gypsum at the time of sowing with a recommended dose of fertilizers (20 kg N + 60 Kg P2O5 +20 kg K2O). The seeds were treated with Bradyrhizobium japonicum and phosphate-solubilizing bacteria, each @ 10 g per kg seed. Soybean JS 93-05 was sown at 45 cm apart in rows using 80 kg seed per ha in last week of June during in both the years. Statistical analysis was carried out using standard analysis of variance (Panse and Sukhatme, 1985).The processed seed and straw samples were analyzed for total nitrogen (Kjeldhal, 1983), phosphorus by vanadomolybdo phosphoric yellow colour method in nitric acid system
1Associate Professor, COA, Tikamgarh; 2Field Extension Officer, Gangbasoda;3. Programme Coordinator; 4.5Subject Matter Specialist
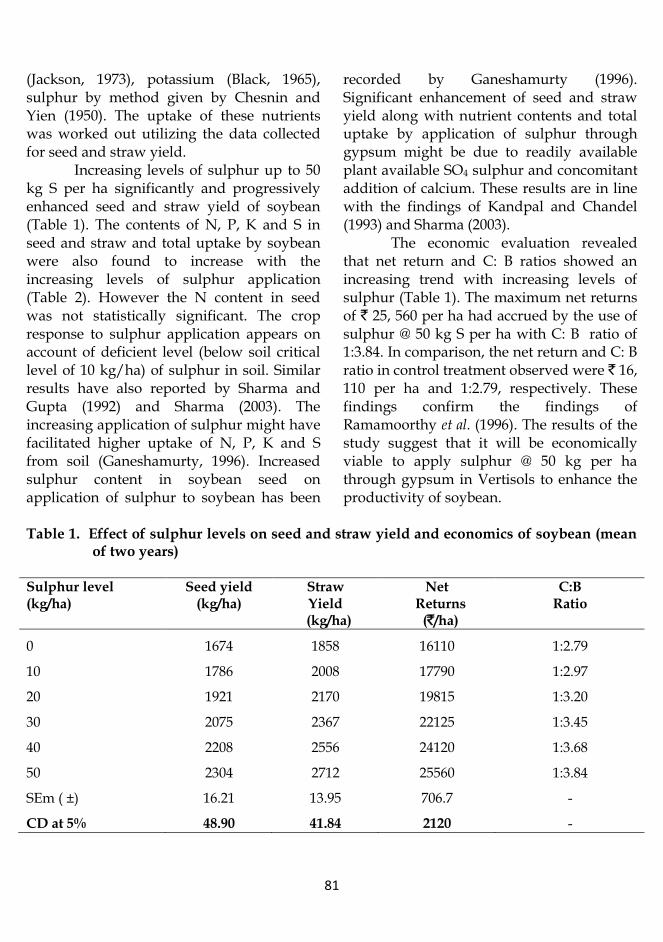
81
(Jackson, 1973), potassium (Black, 1965), sulphur by method given by Chesnin and Yien (1950). The uptake of these nutrients was worked out utilizing the data collected for seed and straw yield.
Increasing levels of sulphur up to 50 kg S per ha significantly and progressively enhanced seed and straw yield of soybean (Table 1). The contents of N, P, K and S in seed and straw and total uptake by soybean were also found to increase with the increasing levels of sulphur application (Table 2). However the N content in seed was not statistically significant. The crop response to sulphur application appears on account of deficient level (below soil critical level of 10 kg/ha) of sulphur in soil. Similar results have also reported by Sharma and Gupta (1992) and Sharma (2003). The increasing application of sulphur might have facilitated higher uptake of N, P, K and S from soil (Ganeshamurty, 1996). Increased sulphur content in soybean seed on application of sulphur to soybean has been
recorded by Ganeshamurty (1996). Significant enhancement of seed and straw yield along with nutrient contents and total uptake by application of sulphur through gypsum might be due to readily available plant available SO4 sulphur and concomitant addition of calcium. These results are in line with the findings of Kandpal and Chandel (1993) and Sharma (2003).
The economic evaluation revealed that net return and C: B ratios showed an increasing trend with increasing levels of sulphur (Table 1). The maximum net returns of ` 25, 560 per ha had accrued by the use of sulphur @ 50 kg S per ha with C: B ratio of 1:3.84. In comparison, the net return and C: B ratio in control treatment observed were ` 16, 110 per ha and 1:2.79, respectively. These findings confirm the findings of Ramamoorthy et al. (1996). The results of the study suggest that it will be economically viable to apply sulphur @ 50 kg per ha through gypsum in Vertisols to enhance the productivity of soybean.
Table 1. Effect of sulphur levels on seed and straw yield and economics of soybean (mean
of two years) Sulphur level (kg/ha)
Seed yield (kg/ha)
Straw Yield (kg/ha)
Net Returns
(`/ha)
C:B Ratio
0 1674 1858 16110 1:2.79
10 1786 2008 17790 1:2.97
20 1921 2170 19815 1:3.20
30 2075 2367 22125 1:3.45
40 2208 2556 24120 1:3.68
50 2304 2712 25560 1:3.84
SEm ( ±) 16.21 13.95 706.7 -
CD at 5% 48.90 41.84 2120 -
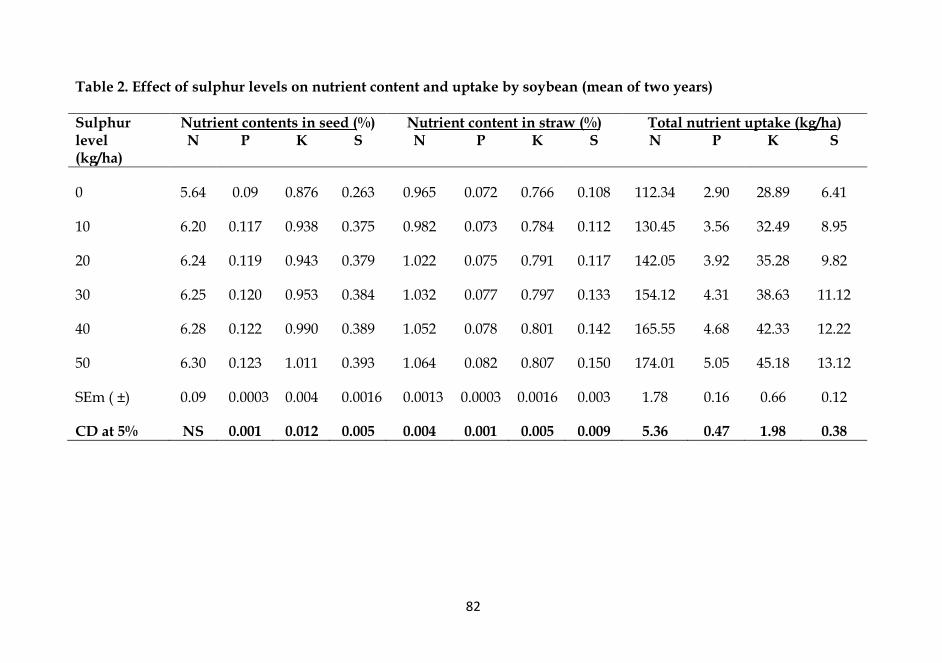
82
Table 2. Effect of sulphur levels on nutrient content and uptake by soybean (mean of two years)
Sulphur level (kg/ha)
Nutrient contents in seed (%) Nutrient content in straw (%) Total nutrient uptake (kg/ha) N P K S N P K S N P K S
0 5.64 0.09 0.876 0.263 0.965 0.072 0.766 0.108 112.34 2.90 28.89 6.41
10 6.20 0.117 0.938 0.375 0.982 0.073 0.784 0.112 130.45 3.56 32.49 8.95
20 6.24 0.119 0.943 0.379 1.022 0.075 0.791 0.117 142.05 3.92 35.28 9.82
30 6.25 0.120 0.953 0.384 1.032 0.077 0.797 0.133 154.12 4.31 38.63 11.12
40 6.28 0.122 0.990 0.389 1.052 0.078 0.801 0.142 165.55 4.68 42.33 12.22
50 6.30 0.123 1.011 0.393 1.064 0.082 0.807 0.150 174.01 5.05 45.18 13.12
SEm ( ±) 0.09 0.0003 0.004 0.0016 0.0013 0.0003 0.0016 0.003 1.78 0.16 0.66 0.12
CD at 5% NS 0.001 0.012 0.005 0.004 0.001 0.005 0.009 5.36 0.47 1.98 0.38

83
REFERENCES
Black C A. 1965. Methods of Soil Analysis (Part 2)
American Society of Agronomy, Madison, Wisconsin, USA.
Chesnin L and Yien C H. 1950. Turbidimetric determination of available sulphates. Soil Science Society America Proceedings 15: 149-51.
Ganeshamurthy A N. 1996. Critical plant S content and effect of sulphur application on grain and oil yield of rainfed soybean in vertic Ustochrepts. Journal of Indian Society of Soil Science 44: 290-4.
Jackson M L. 1973. Soil Chemical Analysis. Prentice Hall of India Pvt. Ltd. New Delhi, pp 151-157, 181-190.
Kjeldhal J. 1983. A new method for estimation of nitrogen in organic compounds. Z Analytical Chemistry 22: 366.
Kandpal B M and Chandel A S. 1993. Effect of gypsum and pyrite as source of sulphur on nitrogen fixation, dry matter, yield and quality of soybean {Glycine max (L.)
Merrill}. Indian Journal of Agronomy 38: 137-9.
Panse V G and Sukhatme P V. 1985. Statistical Methods for Agricultural Workers (3rd ed.). Pub. ICAR, New Delhi.
Prasad R. 2006. Text-book of Field Crops Production. Directrate of Information and Publication of Agriculture, ICAR, Krishi Anusandhan Bhavan, New Delhi.
Ramamoorthy K, Ramasamy M and Vairavan K. 1996. Effect of source and level of sulphur on production of soybean. Indian Journal of Agronomy 41: 654-5
Sharma R A and Gupta R K. 1992. Sulphur phosphorus interaction in synthesis of nitrogenous fraction and oil in soybean. Journal of the Indian Society of Soil Science 46(2): 254-7
Sharma R K. 2003. Effect of sulphur application on seed yield, nutrient content and uptake by soybean Glycine max (L.) Merrill. Haryana Journal of Agronomy 19(2): 71-3.
84
Soybean Research 11(1): 84-88 (2013)
Pratap Raj 24 (RKS 24) – A High Yielding Variety of Soybean for Rajasthan
R K MAHAWAR1, D S MEENA2, H R CHAUDHARY3, V P GUPTA3 and MASHIAT ALI5
Agricultural Research Station (Maharana Pratap University of Agriculture and Technology), Ummedganj, Kota 324 001, Rajasthan
E-mail: [email protected]
Received: 13.04.2013; Accepted: 07.06.2013 Key words: Varietal diversification, RKS 24, lysine, miracle bean, soybean
Soybean [Glycine max (L.) Merrill] has emerged as a major oilseed crop grown during kharif season in India. It is termed as wonder bean or miracle bean as it contains 38-42 per cent good quality protein rich in lysine and 18-22 per cent oil high in essential fatty acids (omega-6 and omega-3). Soybean cultivation in India has shown an unparallel growth during past four decades. The limited area of 0.03 m ha under cultivation of soybean in 1970 is now estimated to be 10.18 million ha. Rajasthan, the third major soybean producing state in the country has 0.90 million ha under the crop producing 1.39 million tons with an average productivity of 1 544 kg per ha during 2011 (Anonymous, 2012). Although the productivity of the state is higher than national productivity of 1 207 kg per ha, it is much lower than the potentials of existing predominant varieties
(JS 335, JS 93-05 and JS 95-60) in cultivation (> 2500 kg/ha). With passage of time, these varieties have become susceptible to major insect-pest (girdle beetle, semi-looper, and tobacco caterpillar) and diseases (yellow mosaic virus, charcoal rot, bacterial pustules and bacterial blight). Under the situation, a new variety named Pratap Raj 24 (RKS 24) was released and notified for Rajasthan with high yield potential of 3 000-3 500 kg per ha, a comparative higher oil content (21.25 %) and moderate resistance to various insect-pest and diseases. It will provide an option to farmers of the region to improve yield levels and to promote varietal diversification.
Pratap Raj 24 (RKS 24) was developed from two genetically diverse genotypes through single cross between PK 472 x PK 1024. Segregating generations
1Assistant Professor (PBG): 2Assistant Professor (Agronomy); 3Professor (Entomology); 4Associate Professor (Plant Pathology); 5Professor (Plant Breeding and Genetics)

85
of this cross were handled by pedigree selection programme at the experimental farm of Agricultural Research Station, Ummedganj, Kota. The F8 progeny of this cross was evaluated in replicated trials for seven years (kharif 2002-2008) at Agricultural Research Station, Kota, for three years in multi-location trials (kharif 2006-2008), for three years under moisture stress condition (kharif 2006-2008) and for five years (kharif 2004-2008) in different coordinated trials with popular check varieties. On the basis of average of seven years (2002-2008) testing, the variety RKS 24 yielded 2 360 kg per ha (Table 1) and was found 25.27 and 104.51 per cent superior over the national checks JS 335 (1 884 kg/ha) and Bragg (1 154 kg/ha), respectively, while 28.26 per cent superiority for seed yield was observed over the zonal check JS 93-05 (1 840 kg/ha). Under multi-location trials (Table 2) conducted at
ten different coordinated centers, the variety RKS 24 gave an average yield of 1 632 kg per ha which was 23.7 and 35.2 per cent higher over the checks JS 335 (12.7 kg/ha) and JS 93-05 (1 319 kg/ha), respectively. Thus, the present variety showed better performance over both the most popular and best adopted varieties of the zone.
Since, soybean is predominantly cultivated under rainfed condition in kharif season in the country as well as in Rajasthan, the performance of the variety RKS 24 was also evaluated in moisture stress conditions by not providing any irrigation even if needed (Table 3), with national, zonal and local check varieties adapted to this zone. This variety yielded 1 333 kg per ha seed yield under moisture stress conditions, which is 51.95, 21.85, 12.68 and 7.86 per cent higher over JS 335, JS 93-05 and Pratap Soya 1, respectively.
Table 1. Performance of RKS 24 in state trials
Name of trial
Year RKS 24 National check Zonal check CD (P = 0.05) JS 335 Bragg
RST-I Kharif 2002 2910 2536 2012 2195 283.5
RST-II Kharif 2003 2825 2420 1850 2110 262.2
IVT Kharif 2004 2429 2223 1070 1811 270.1
AVT -I Kharif 2005 2743 2373 1840 1910 234.8
AVT-II Kharif 2006 2060 1693 1318 1755 207.9
AVT-II* Kharif 2007 2196 2429 1651 1887 160.7
AVT-II * Kharif 2008 1357 0513 0347 1214
Mean 2360 1884 1154 1840
% increase of RKS-24 over 25.27 104.51 28.26 *Repeat

86
Table 2. Performance of RKS-24 in multi-location trials
Location Year Released Variety
(RKS 24)
Zonal Check (JS
93 05)
National Check (JS
335)
CD (P = 0.05)
ATC Nanta, Kota Kharif 2006 1570 1215 1344 150.7
ATC, Bundi Kharif 2007 1978 1890 1628 169.3
ATC, Chittorgarh Kharif 2008 1250 1100 1150 -
ARS, Kota Kharif 2008 1357 1214 0513 174.1
RCA, Udaipur Kharif 2008 1685 1251 1008 178.0
KVK, Bundi Kharif 2008 1744 1510 1337 248.3
KVK, Anta Kharif 2008 1370 1190 0593 -
KVK, Chittorgarh Kharif 2008 1878 1287 1607 176.2
ARSS, Aklera Kharif 2008 1152 0965 0835 152.2
ARSS, Pratapgarh Kharif 2008 2333 1567 2056 383.1
Mean 1632 1319 1207 -
% increase of RKS-24 over 23.7 35.2 ATC=Adaptive Trial Centre, ARS=Agricultural Research Station, RCA= Rajasthan College of Agriculture, KVK= Krishi Vigyan Kendra, ARSS= Agricultural Research Sub-Station
RKS 24 was found with high yield potential (2 145 kg/ha) having18.50, 7.84 and 18.66 per cent higher yield over national and zonal checks namely, Bragg, JS 335 and JS 93-05 respectively, under irrigated condition in 32 coordinated trials (Table 4) conducted at different centers of India in Central zone during the evaluation span of four years (kharif 2004-2007).
RKS 24 has high mean oil content (21.25 %) as compared to checks Bragg (19.15 %), JS 335 (19.42 %) and JS 93-05 (19.50 %); ensuring higher oil yield per unit area along with higher seed yield. Thus, the present
variety RKS 24 is also likely be preferred by the oil industry.
RKS 24 is medium tall with
determinate growth habit, medium maturity, white flower, high number of primary branches, dark, broad and thick leaf, tawny pubescence on stem, leaf and pod surface, cream yellow seed, round and medium bold in shape and size, pink hypocotyle and brown hylum (Fig. 1 and 2). It is non-lodging and non-shattering type. This variety possesses multiple moderate resistances to various diseases
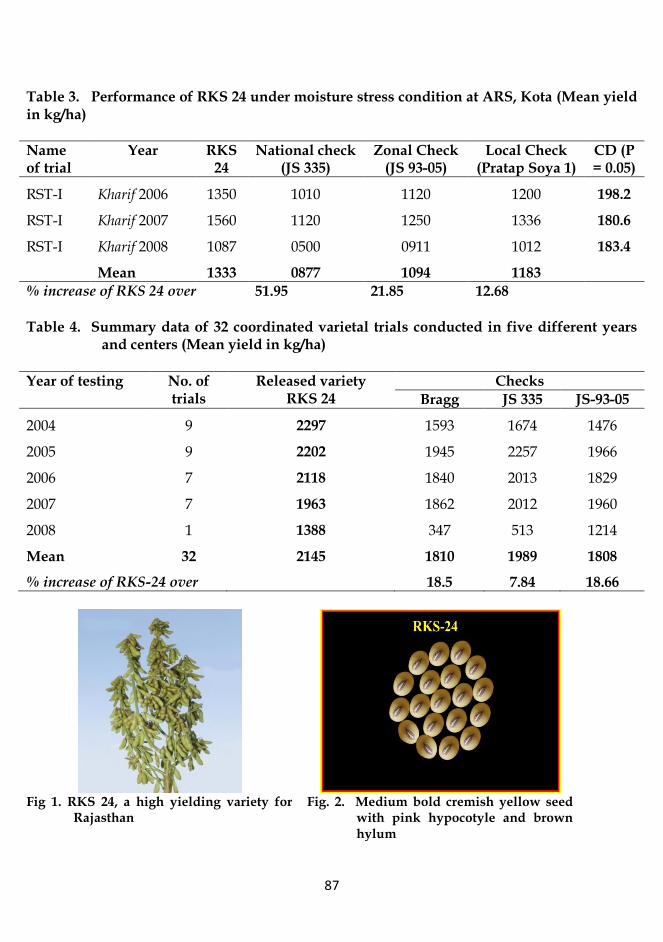
87
Table 3. Performance of RKS 24 under moisture stress condition at ARS, Kota (Mean yield in kg/ha)
Name of trial
Year RKS 24
National check (JS 335)
Zonal Check (JS 93-05)
Local Check (Pratap Soya 1)
CD (P = 0.05)
RST-I Kharif 2006 1350 1010 1120 1200 198.2
RST-I Kharif 2007 1560 1120 1250 1336 180.6
RST-I Kharif 2008 1087 0500 0911 1012 183.4
Mean 1333 0877 1094 1183
% increase of RKS 24 over 51.95 21.85 12.68
Table 4. Summary data of 32 coordinated varietal trials conducted in five different years and centers (Mean yield in kg/ha)
Year of testing No. of trials
Released variety RKS 24
Checks
Bragg JS 335 JS-93-05
2004 9 2297 1593 1674 1476
2005 9 2202 1945 2257 1966
2006 7 2118 1840 2013 1829
2007 7 1963 1862 2012 1960
2008 1 1388 347 513 1214
Mean 32 2145 1810 1989 1808
% increase of RKS-24 over 18.5 7.84 18.66
Fig 1. RKS 24, a high yielding variety for
Rajasthan Fig. 2. Medium bold cremish yellow seed
with pink hypocotyle and brown hylum
88
like bacterial pustules, charcoal rot and yellow mosaic virus and major insect-pests like stem fly, lepidopterous defoliators, girdle beetle and tobacco caterpillar. The variety is released and notified (Notification number S.O. 283 (E) on 7th, February, 2011) by the Central Varietal Release Sub-
Committee on Crop Standards, Notification and Release of Varieties 2011) for timely sown, high fertility, irrigated condition of Rajasthan and maintains good germination (80-90 %) under ambient condition of storage for the seven months with yield potential of 3000-3500 kg per ha.
REFERENCE Anonymous. 2012. http://eands.dacnet.nic.in/Publication12-12-
2012/Agriculture _at_a_Glance%202012/ Pages 85-136.pdf.
89
Society for Soybean Research and Development is thankful to following persons who helped as referees to review the research articles submitted to Soybean Research for their suitability and better presentation Agrawal D K Dr; Senior Scientist (Plant Breeding), Directorate of Soybean Research, Khandwa Road, Indore 452 001, Madhya Pradesh Bharadwaj C Dr; Principal Scientist (Plant Breeding), Division of Genetics, Indian Agricultural Research Institute, Pusa, New Delhi 110 012 Bhati TK Dr; Principal Scientist (Agronomy), Central Arid Zone Research Institute, Jodhpur 342 003, Rajasthan Bhatnagar PS Dr; Retired Director, NRC for Soybean, Khandwa Road, Indore 452 001, Indore, Madhya Pradesh Bhogal NS Dr; Senior Scientist (Soil Science), NRC for Rapeseed Mustard, Sewar Road, Bharatpur, Rajasthan Billore M Dr (Mrs); Professor (Plant Breeding), College of Agriculture (RVSKVV), Indore, Madhya Pradesh Burman Rajarshi Roy Dr; Senior Scientist (Agricultural Extension), Division of Agricultural Extension, Indian Agricultural Research Institute, New Delhi 110 012 Chandel AS Dr; Ex-Professor (Agronomy), GBPUA&T, Pantnagar Choudhry SK Dr: Principal Scientist (Agronomy), Dryland (ORP) Project, College of Agriculture (RVSKVV), Indore 452 001, Madhya Pradesh
Dadheech RC Dr; Associate Professor (Agronomy), Maharana Pratap University of Agriculture and Technology, Udaipur, Rajasthan Deshmukh SC Dr; Ex-Professor, College of Agriculture, Jawaharlal Nehru Vishwa Vidyalaya), Indore, Madhya Pradesh Chapke Rajendra Dr; Senior Scientist (Agricultural Extension), Directorate of Sorghum Research, Rajendranagar, Hyderabad 500 030 Dupare BU Dr; Senior Scientist, Directorate of Soybean Research, Indore 452 001, Madhya Pradesh Joshi OP Dr; Ex-Principal Scientist (Soil Science), Directorate of Soybean Research, Indore 452 001, Madhya Pradesh

90
Kumbhare NV Dr; Senior Scientist, Division of Agricultural Extension, Indian Agricultural Research Institute, New Delhi 110 012 Mankar DM Dr; Professor and Head (Agricultural Extension), Department of Extension Education, Post Graduate Institute, Dr PDKV, Krishi Nagar, Akola 444 104, Maharashtra Nahatkar SB Dr; Senior Scientist (Agricultural Economics), Directorate of Research Services, Jawaharlal Nehru Krishi Vishwa Vidyalaya, Adhartal, Jabalpur 482 004, Madhya Pradesh Ramesh A Dr; Senior Scientist, Directorate of Soybean Research, Indore 452 001, Madhya Pradesh Tiwari SP; Former Deputy Director General (Education), ICAR and Ex-Vice Chancellor, SK Rajasthan University, Bikaner, Rajasthan Tomar SS Dr; Dean, Faculty of Agriculture and Director of Research Services, Jawaharlal Nehru Krishi Vishwavidyalaya, Adhar Tal, Jabalpur 482 004, Madhya Pradesh Sharma Kamalesh Kumar Dr; Associate Professor (Soil Science). SKN College of Agriculture, Jobner 303 329, Rajasthan Singh Muneshwar Dr; Project Coordinator (LTFE), Indian Institute of Soil Science, Bhopa 462 038, Madhya Pradesh Tyagi LK Dr; Senior Scientist (Extension), National Bureau of Fish Genetic Resources, Canal Ring Road Post Office Dilkusha, Lucknow 226 002, Uttar Pradesh
Vyas AK Dr; Head (Department of Agronomy), Indian Agricultural Research Institute, Pusa, New Delhi 110 012 Vyas MD Dr; Associate Professor, RAK College of Agriculture (RVSKVV), Sehore, Madhya Pradesh

91
SOYBEAN RESEARCH
GUIDE LINES FOR SUBMISSION OF MANUSCRIPT Where to submit?
The Society of Soybean Research and Development publishes full paper, short communications, and review articles related to soybean research and development in its official journal “SOYBEAN RESEARCH”. The journal is published once in a calendar year at present. All submissions should be addressed to: The Editor-in-Chief, Society of Soybean Research and Development (SSRD), Directorate of Soybean Research, Khandwa Road, Indore 452 017, India (E-mail: [email protected]). The submissions of the manuscripts may preferably be done on Society‟s web-site (www.ssrd.co.in). Editorial Policy
All authors in a manuscript (MS) for publication in Soybean Research should be member of the society.
(a) Annual member Subscription
Indian Foreign
`. 500.00 US $ 125.00
(b) Student member
Indian Foreign
`. 250.00 US $ 100.00
(c) Institution member
Indian Foreign
`. 2, 000.00 US $ 150.00
(d) Life member
Indian Foreign
`. 3, 000.00 (1 or in 3 equal instalments. in a year)
US $ 1000.00
(e) Corporate member
Indian Foreign
`. 20, 000.00 US $ 2,000.00
92
An admission fee of `.50/- for Indian citizen and US $ 5.00 for Foreign National shall be paid at the time of enrolment.
MS must be original and contribute substantially to the advancement of knowledge in soybean research and development.
MS should have unpublished data and not submitted elsewhere (wholly or in part) for publication.
MSs are subjected to „peer review‟ by two experts in the relevant field and by the members of Editorial Board. The decision of Editor-in Chief in accepting the MS with major/minor revision or rejecting the paper would be final. MSs sent for revision to authors, should be returned within four weeks.
All submission must accompany a self-addressed appropriately stamped envelope for sending the MS for revision/change if any or the proof for corrections.
Manuscript Format
Manuscript should be initially submitted in triplicate and it should also carry the E-mail address of the corresponding author in addition to the postal address. MS should be printed in double space on A-4 size paper in Times New Roman with font size 12 with a 4 cm margin at top bottom and left. All pages including text, references, tables and legends to figures should be numbered. MS should be concise and devoid of repetition between Materials and Methods and Results or Results and Discussion. Revised and corrected MS should be submitted with a soft copy in a CD/floppy diskette.
Full Paper
A full paper should not exceed 4000 words (up to 15 typed pages, including references, tables etc.) Its contents should be organized as: Title, Author(s), Address, Abstract, Key words, Introduction, Material and Methods, Results and Discussion, Acknowledgements and References.
Title: It should be short, concise and informative, typed in first letter capital, Latin name
italicized. Authors: Name of the authors may be typed in all capitals.
Abstract: This should not exceed 150 words and should indicate main findings of the paper,
without presenting experimental details.
93
Key words: There should be 4-5 key words indicating the contents of the MS and should follow the abstract. Invariably the name of host and pest should be included in key words.
Results: Data should be presented in text, tables or figures. Repetition of data in two or three forms should be avoided. All quantitative data should be in standard/metric units. Each table, figure or illustration must have a self-contained legend. Use prefixes to avoid citing units as decimals or as large numbers, thus, 14 mg, not 0.014 g or 14000 µg. The following abbreviations should be used: yr, wk, h, min, sec., RH, g, ml, g/l, temp., kg/ha, a.i., 2:1(v/v), 1:2 (w/w), 0:20: 10 (N:P:K), mm, cm, nm, cv. (cvs., for plural), % etc.
References: References should be cited by authors and year: Ansari (2000) or Ansari and Sharma (2000) in the text. References should be arranged in alphabetical order and listed at the end of the paper as follows:
Ansari M M and Sharma A N. 2000. Compatibility of Bacillus thuringiensis with chemical insecticides used for insect control in soybean (Glycine max). Indian Journal of Agricultural Sciences 70: 48-9. (Journal)
Joshi O P, Billore S D, Ramesh A and Bhardwaj Ch . 2002. Soybean-A remunerative crop for rainfed forming. In: Agro technology for dry land forming, pp 543-68. Dhopte AM (Eds.). Scientific Publishers (India), Jodhpur. ( Book chapter)
Ansari M M and Gupta G K. 1999. Epidemiological studies of foliar diseases of soybean in Malwa plateau of India. Proceedings, World Soybean Research Conference VI, Aug 4-7, 1999, Chicago, Illinois, USA, 611p. (Symposium/ Conf./Workshop)
Pansae V G and Sukhatme P V. 1978. Statistical Methods for Agricultural Workers. Indian Council of Agricultural Research, New Delhi. pp.186. (Book)
Table: Each table should be typed on separate page and numbered sequentially. Tables should have descriptive heading. Authors are advised to avoid large table with complex columns. Data are restricted to only one or two decimal figures only. Transformed values should be included if these are discussed in the text.
Illustrations: Number all illustrations consecutively in the text. Line drawing should be made in undiluted black ink on smooth white card or tracing paper. Original and two Photostat copies should be drawn approximately twice the size of reproduction. Original should not be labeled and should also not be numbered. Line diagrams of plants, fungi etc. should indicate the scale.
Photographs: Photographs should be on glossy paper and have good contrast. Trim unnecessary areas. Three copies of the photographs should be provided. On the back of the photographs write names of authors, figures numbers and indicate top of the photographs with an arrow using a soft pencil. Show magnification with a bar scale. Coloured photographs can be printed on payment of full printing cost by the authors. Legends for figures should be typed separately and numbered consequently.
94
Short research notes They should not exceed more than 1300 words (total 5 typed pages, which deal with (i) research results that are complete but do not warrant comprehensive treatment, (ii) description of new material or improved techniques or equipment, with supporting data and (iii) a part of thesis or study. Such notes require no heading of sections. It should include key words. Figures and tables should be kept to a minimum.
Review articles
Authors with in-depth knowledge of the subject are welcome to submit review
articles. It is expected that such articles should consist of a critical synthesis of work
done in a field of research both in India and/or abroad, and should not merely be a
compilation.
Proofs Authors should correct the proof very critically by ink in the margin. All queries
marked in the article should be answered. Proofs are supplied for a check-up of the
correctness of the type settings and facts. Excessive alterations will be charged from
the author, Proof must be returned immediately to shorten the reproduction time.

95
Application for Membership SOCIETY FOR SOYBEAN RESEARCH AND DEVELOPMENT
(Registration No. 03/27/03/07918/04) Directorate of Soybean Research Khandwa Road, Indore-452 001
Ph.: 0731-2478414; 236 4879; FAX: 2470520 (E-mail: [email protected])
(Website: www.ssrd.co.in)
The Secretary Society for Soybean Research & Development Directorate of Soybean Research Khandwa Road, Indore –452 001 Dear Sir, I wish to enroll myself as a Life Member/Annual Member of the Society for Soybean Research & Development. I remit Rupees (in words)-------------------------------------------------------------------------------------------------------------by Demand Draft No.-------------------------------------------------date-----------------------of ------------------------------bank in favour of the Society for Soybean Research & Development, Indore as membership and admission fee for the year--------------------------. I agree hereby to abide by the Rules and Regulations of the Society.
Yours faithfully,
Name (in Block letters) ------------------------------------------------------------------ Designation ------------------------------------------------------------------ Date of birth ------------------------------------------------------------------ Area of specialization --------------------------------------------------------- Address (in Block letters) ------------------------------------------------------------------ ------------------------------------------------------------------ Tel: ----- Fax: --- E-mail :----- Proposed by: Signature & Name-----------------------------------------
Address