sox 404 dashboard - audit analyticsdisclosures made pursuant to the securities laws, and for other...
TRANSCRIPT

SOX 404 Dashboard Year 6 Update
October 2010
Don Whalen, Esq. Research [email protected] x222
Mark Cheffers, CPA, ABV, [email protected] x223
Maggie Thrun, Research [email protected] 508.476.7007 x236

Audit Analytics® October 2010
AuditAnalytics.com ● 9 Main Street 2F, Sutton, MA 01590 ● (508) 476-7007 ● [email protected]
Table of Contents
Page
A. Summary 1 B. Introduction 2 C. SOX 404 Requirement History: The Staggered and Two-Tiered Implementation of SOX 404 2 D. Executive Summary – Year 6 Section SOX 404 Update 3 E. SOX 404 Year 5 Tables 7 F. SOX 404 Year 6 Tables (Partial Year Data) 20 G. Definitions for the Internal Control Issues 33 H. Definitions for the GAAP/Accounting Areas of Failure 35 I. Definitions for Exemption Reasons 37 J. Overview: Audit Analytics 38
Audit Analytics® October 2010
SOX 404 Dashboard; Year 6 Update Summary
AuditAnalytics.com - 9 Main Street 2F, Sutton, MA 01590 - (508)476-7007 - [email protected] 1
In response to the Enron and Worldcom collapses, Congress passed the Sarbanes-Oxley Act of 2002 (“SOX”) to better protect investors. Section 404 of SOX (“SOX 404”) requires companies to review their internal controls over financial reporting (“ICFRs”) and declare whether their ICFRs are “effective” or “ineffective.” In other words, they must determine if their ICFRs are adequate enough to produce financial statements that are complete and accurate. At this stage of SOX 404 implementation, large companies must have an auditor attest to the management’s assessment of ICFRs while smaller companies are not required to include the auditor in the process. (These small company filings are referred to as management-only reports.) SOX 404 first applied to United States accelerated filers in their annual reports for fiscal years ending on or after November 15, 2004. By mid July 2007, SOX 404 also applied to all foreign accelerated filers. Non-accelerated filers began filing management-only assessments in annual reports for the fiscal years ending on or after December 15, 2007. The Dodd-Frank Act exempted non-accelerated filers from the requirements of SOX 404(b), the audit attestation submission.
Based on the start date of November 15, 2004, SOX 404 is presently in its sixth year of
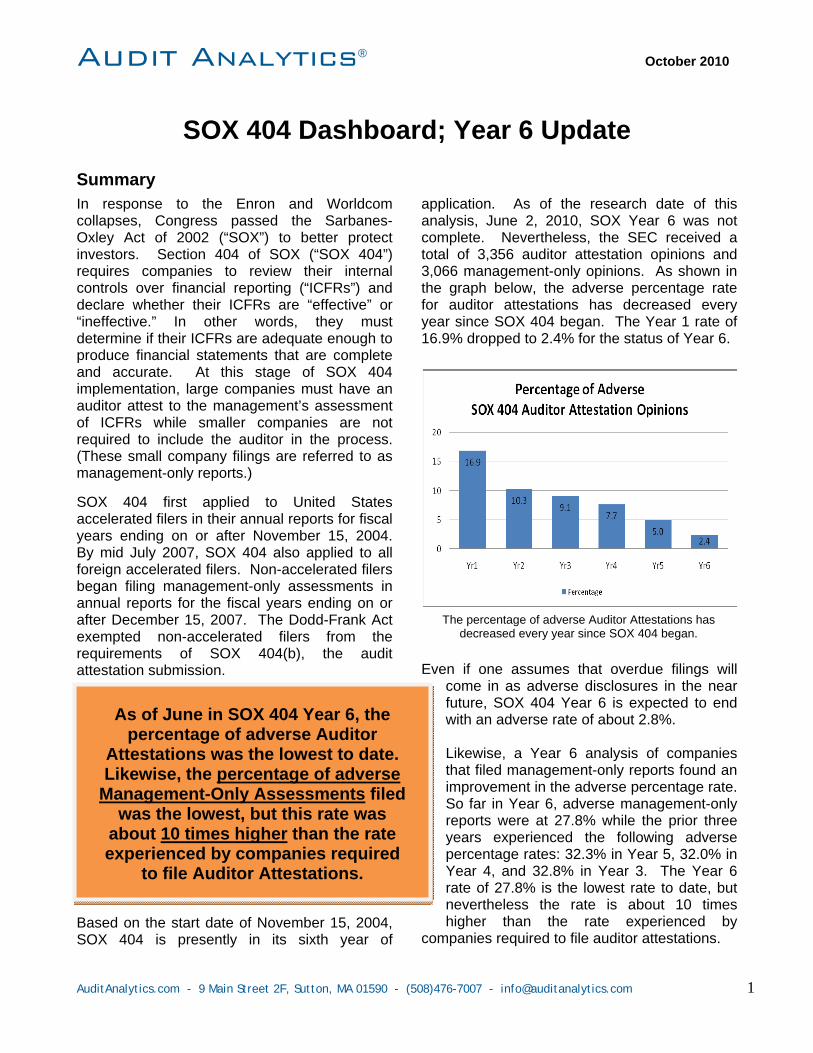
application. As of the research date of this analysis, June 2, 2010, SOX Year 6 was not complete. Nevertheless, the SEC received a total of 3,356 auditor attestation opinions and 3,066 management-only opinions. As shown in the graph below, the adverse percentage rate for auditor attestations has decreased every year since SOX 404 began. The Year 1 rate of 16.9% dropped to 2.4% for the status of Year 6.
Even if one assumes that overdue filings will come in as adverse disclosures in the near future, SOX 404 Year 6 is expected to end with an adverse rate of about 2.8%. Likewise, a Year 6 analysis of companies that filed management-only reports found an improvement in the adverse percentage rate. So far in Year 6, adverse management-only reports were at 27.8% while the prior three years experienced the following adverse percentage rates: 32.3% in Year 5, 32.0% in Year 4, and 32.8% in Year 3. The Year 6 rate of 27.8% is the lowest rate to date, but nevertheless the rate is about 10 times higher than the rate experienced by
companies required to file auditor attestations.
The percentage of adverse Auditor Attestations has decreased every year since SOX 404 began.
As of June in SOX 404 Year 6, the percentage of adverse Auditor
Attestations was the lowest to date. Likewise, the percentage of adverse
Management-Only Assessments filed was the lowest, but this rate was
about 10 times higher than the rate experienced by companies required
to file Auditor Attestations.

Audit Analytics® October 2010
AuditAnalytics.com - 9 Main Street 2F, Sutton, MA 01590 - (508)476-7007 - [email protected] 2
Introduction
Both the Enron and Worldcom collapse culminated from a practice of disguising the true operating performance of the companies. In response these meltdowns, Congress passed the Sarbanes-Oxley Act of 2002 (“SOX”). In its title, the declared purpose of SOX is to “protect investors by improving the accuracy and reliability of corporate disclosures made pursuant to the securities laws, and for other purposes.” One section of SOX, Section 404 (“SOX 404”), furthers this goal by instructing the SEC to prescribe rules imposing a duty on officers and management to implement, review, and certify the effectiveness of a company’s internal controls for financial reporting (ICFRs).1 In addition, the registered public accountant is to attest to and report on the management’s assessment. In short, SOX 404(a) requires management to assess a company’s ICFRs while SOX 404(b) requires a registered public accountant to attest to the management’s report. SOX 404 Requirements History: The Staggered and Two-Tiered Implementation of SOX 404.
SOX 404, presently in its sixth year of application,2 began to apply to different categories of companies at different times. Moreover, as summarized in the table below, the two subsections of SOX 404, subsection 404(a) and 404(b), did not necessarily come into effect at the same time. United States accelerated filers3 were first required to provide SOX 404 certifications in annual reports for fiscal years ending on or after November 15, 2004. At that time both provisions were required: the management assessment (subsection 404(a)) and the auditor attestation (subsection 404(b)). During SOX 404’s third year of application, its provisions began to apply a new category of public registrant: accelerated foreign filers. For year 3, a large accelerated foreign filer was required to adhere to both provisions in its annual report for the fiscal year ending on or after July 15, 2006. However, an accelerated foreign filer that was not a large accelerated foreign filer was given a gradual two-tier requirement. That category of foreign filer was only required to provide a management opinion for July 15, 2006 and did not need to give an auditor attestation until the following year. In similar fashion, the SEC initially intended to apply a two-step approach to non-accelerated filers. Non-accelerated filers were required to provide a management opinion (but not an auditor attestation) in their annual reports for the fiscal years ending on or after December 15, 2007. Before subsection 404(b) became effective, however, the Dodd-Frank Act exempted the non-accelerated filers from the auditor attestation requirement.4 Therefore, except for asset backed securities and registered investment companies,5 all SEC registrants are required to provide at least a management report and accompanying certification6 in their annual reports unless the annual report is their very first (unless the registrant is a “newly public company”7).
1 In general, Section 404 requires that each annual report contain an “internal control report” that (1) acknowledges the management’s responsibility to maintain adequate internal controls, (2) identifies the “framework” used to evaluate the effectiveness of the internal controls over financial reporting, and (3) provides an assessment of the effectiveness of these internal controls as of the end of the fiscal year. 2 In this analysis, Year 6 (still ongoing) is defined as November 15, 2009 to November 14, 2010, inclusive. This 12-month period is consistent with the initial SEC requirement that United States accelerated filers comply with Section 404 in annual reports for fiscal years ending on or after Nov. 15, 2004. 3 An accelerated filer is a company whose public Float (as opposed to Market Capitalization) exceeds $75 million as of the last day of their second quarter. Once a registrant becomes an accelerated filer, it will not lose this status unless its float drops below $50 million. A large accelerated filer is a company whose public Float exceeds $700 million. See Rule 12b-2 of the Securities Exchange Act of 1934. 4 See Section 989G of the Dodd-Frank Wall Street Reform and Consumer Protection Act. 5 Registered investment companies are expressly exempt from Section 404 by Section 405 of SOX. 6 The SEC provides a form entitled “CERTIFICATIONS” to be attached to the annual report that contains the necessary language for a 404 certification. A separate copy of this form must be signed by both the CEO and CFO without any change in the language and attached as Exhibit 31. 7 Pursuant to the SEC instructions to Item 308 under regulation S-K, a registrant need not comply with SOX 404 “until it either had been required to file an annual report . . . for the prior fiscal year or had filed an annual report with the Commission for the prior fiscal year.” See also, SEC Release No. 33-8731 (Aug. 9, 2006).

Audit Analytics® October 2010
AuditAnalytics.com - 9 Main Street 2F, Sutton, MA 01590 - (508)476-7007 - [email protected] 3
Executive Summary – Year 6 Section 404 Update
For SOX 404 Year 6, as of June 2, 2010, the SEC had received a total of 3,356 auditor attestation opinions and 3,066 management-only opinions (6,422 total).8 The adverse auditor attestation disclosures filed represented 2.4% of the attestation filings. This figure is expected to increase to about 2.8%, assuming that overdue filings disclose adverse conditions. The 2.8% figure could further increase as some companies ascertain, mostly through financial restatements, that they erred in the original clean assessment. Nevertheless, this adverse figure of 2.8% is the lowest disclosed to date, down from 5.0% in year 5; 7.7% in year 4; 9.1% in year 3; 10.3% in Year 2 and 16.9% in Year 1. The management-only assessments also showed improvement. The adverse disclosures in the management-only assessments represented 27.8% of those filed. This is the first time the figure is below 30%, with the prior three years experiencing the following adverse percentage rates: 32.3% in year 5; 32.0% in year 4 and 32.8% in year 3.
1. As of June 2, 2010, the overall rate of adverse Year 6 auditor attestations has continued to declined.
In SOX 404 Year 1, when U.S. accelerated filers first provided auditor attestations (in their annual reports for fiscal years ending on or after November 15, 2004), the adverse disclosure rate came in at 16.9%. Thereafter, each year experienced a decline in the percentage of adverse auditor attestations. The Year 1 rate of 16.9% dropped to 10.3% in Year 2, to 9.1% in Year 3, to 7.7% in Year 4, to 5.0% in Year 5, and to 2.4% in Year 6. (See graph on right.) Even if one assumes that overdue filings will come in as adverse disclosures in the near future, Year 6 is expected to end with an adverse rate of about 2.8%. (See table on page 21: SOX 404 Auditor Attestations: Year 6 Update with Year 1, Year 2, Year 3, Year 4, and Year 5 Adverse Opinion Comparison.) This incremental drop from year to year suggests that the ICFRs of companies improve over time when auditors are involved in the evaluation process. The improvement over this time has been dramatic. 2. When management-only assessments are added to the population of SOX 404 filings, the adverse
percentage rate for Year 6 increases to 14.6%.
In Year 6, the SEC has received 3,066 annual reports with management-only assessments. Of those disclosures, 853 provided an adverse assessment regarding ICFRs, an adverse opinion rate of 27.8%. The high percentage indicates that non-accelerated filers fail to maintain ICFRs that are as reliable as accelerated filers. The high adverse percentage rate is due, in large part, to the fact that many non-accelerated filers are comprised of many small companies, including many 10KSB (small business) filers, with fewer employees and other resources. When this population is added to the 3,356 auditor attestation opinions, the adverse percentage of the total population of 6,422 disclosures becomes 14.6%. (See table on page 22: SOX 404 Disclosures including Management Only Reports: Year 6 Update with Year 1, Year 2, Year 3, Year 4, and Year 5 Adverse Opinion Comparison.) Although the adverse opinion rate for management-only assessments is high, the 27.8% figure is lower the three prior years. As shown in the table above, the prior three years experienced an adverse percentage rate of about 32%. (See also, table on page 22.)
8 The count of Opinions Filed excludes (1) non-tickered funds and trusts within a group if the group is represented in the population by the presence of at least one remaining entity (tickered or non-tickered) and (2) non-tickered subsidiaries if the parent company submitted a comparable filing (to exclude duplicate material weakness filings by non-tickered subsidiaries).
Audit Analytics® October 2010
AuditAnalytics.com - 9 Main Street 2F, Sutton, MA 01590 - (508)476-7007 - [email protected] 4
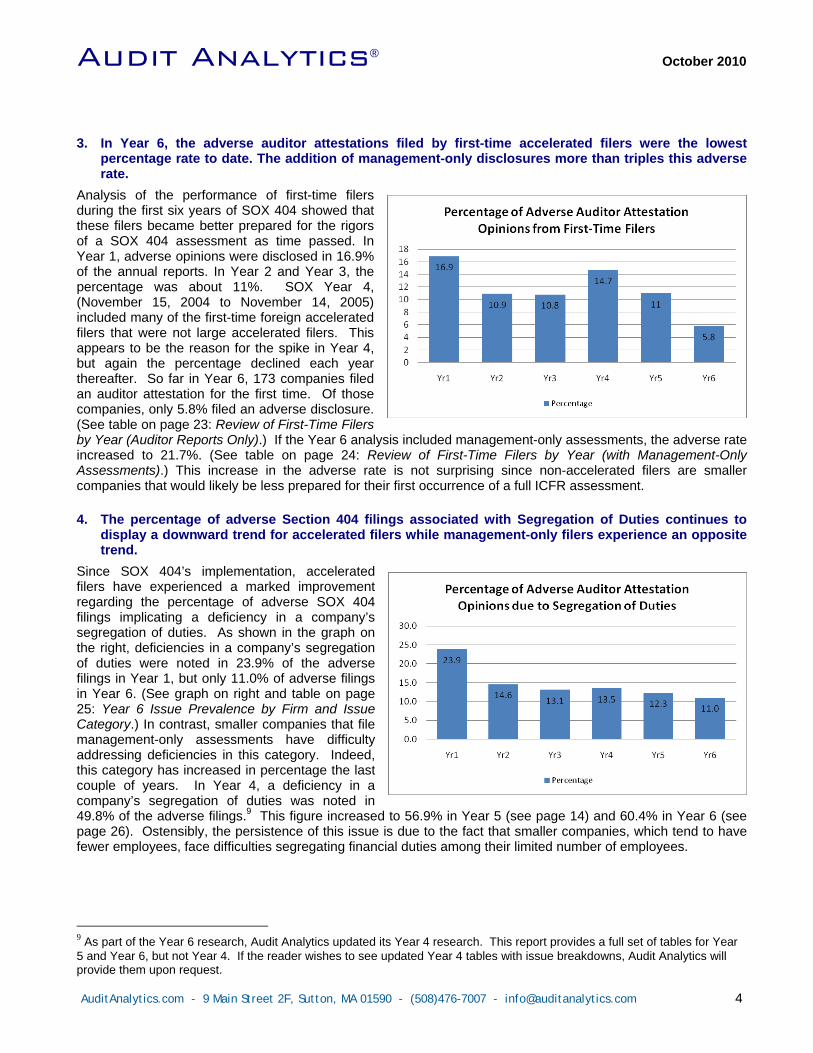
3. In Year 6, the adverse auditor attestations filed by first-time accelerated filers were the lowest
percentage rate to date. The addition of management-only disclosures more than triples this adverse rate.
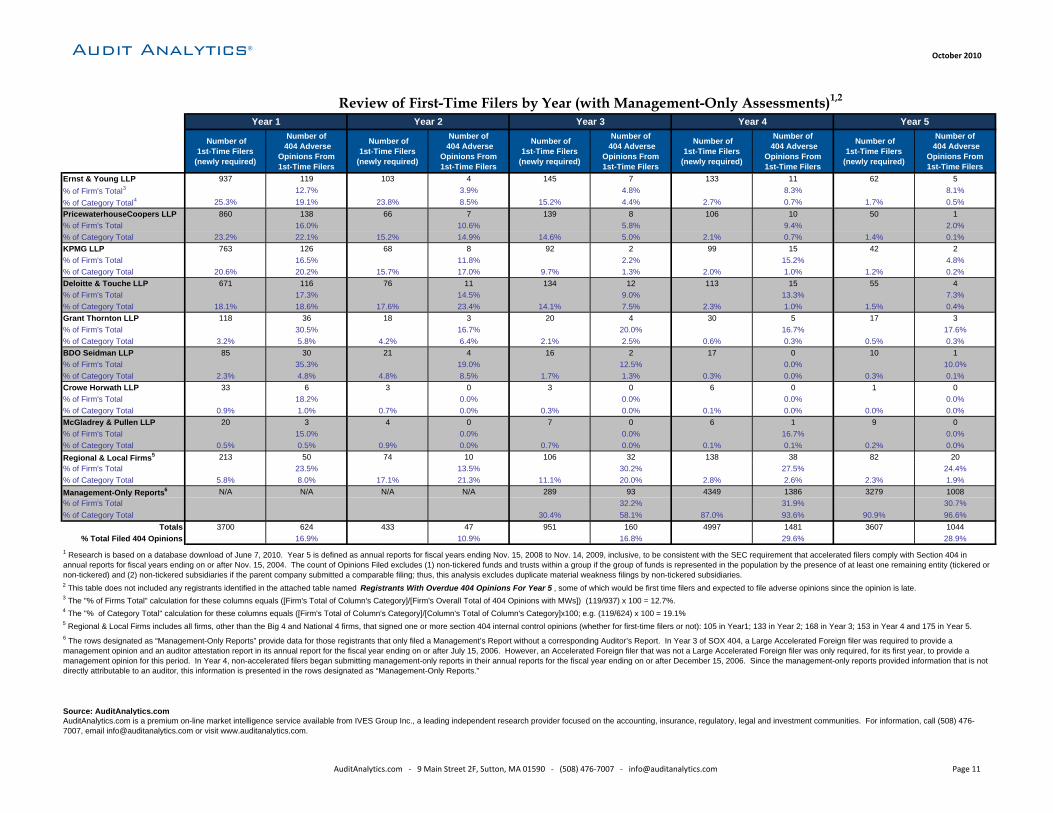
Analysis of the performance of first-time filers during the first six years of SOX 404 showed that these filers became better prepared for the rigors of a SOX 404 assessment as time passed. In Year 1, adverse opinions were disclosed in 16.9% of the annual reports. In Year 2 and Year 3, the percentage was about 11%. SOX Year 4, (November 15, 2004 to November 14, 2005) included many of the first-time foreign accelerated filers that were not large accelerated filers. This appears to be the reason for the spike in Year 4, but again the percentage declined each year thereafter. So far in Year 6, 173 companies filed an auditor attestation for the first time. Of those companies, only 5.8% filed an adverse disclosure. (See table on page 23: Review of First-Time Filers by Year (Auditor Reports Only).) If the Year 6 analysis included management-only assessments, the adverse rate increased to 21.7%. (See table on page 24: Review of First-Time Filers by Year (with Management-Only Assessments).) This increase in the adverse rate is not surprising since non-accelerated filers are smaller companies that would likely be less prepared for their first occurrence of a full ICFR assessment. 4. The percentage of adverse Section 404 filings associated with Segregation of Duties continues to
display a downward trend for accelerated filers while management-only filers experience an opposite trend.
Since SOX 404’s implementation, accelerated filers have experienced a marked improvement regarding the percentage of adverse SOX 404 filings implicating a deficiency in a company’s segregation of duties. As shown in the graph on the right, deficiencies in a company’s segregation of duties were noted in 23.9% of the adverse filings in Year 1, but only 11.0% of adverse filings in Year 6. (See graph on right and table on page 25: Year 6 Issue Prevalence by Firm and Issue Category.) In contrast, smaller companies that file management-only assessments have difficulty addressing deficiencies in this category. Indeed, this category has increased in percentage the last couple of years. In Year 4, a deficiency in a company’s segregation of duties was noted in 49.8% of the adverse filings.9 This figure increased to 56.9% in Year 5 (see page 14) and 60.4% in Year 6 (see page 26). Ostensibly, the persistence of this issue is due to the fact that smaller companies, which tend to have fewer employees, face difficulties segregating financial duties among their limited number of employees. 9 As part of the Year 6 research, Audit Analytics updated its Year 4 research. This report provides a full set of tables for Year 5 and Year 6, but not Year 4. If the reader wishes to see updated Year 4 tables with issue breakdowns, Audit Analytics will provide them upon request.

Audit Analytics® October 2010
AuditAnalytics.com - 9 Main Street 2F, Sutton, MA 01590 - (508)476-7007 - [email protected] 5
5. The percentage of adverse auditor attestations implicating Depreciation/Amortization has steadily decreased since SOX Year 1.
In Year 1 of SOX 404, accelerated filers disclosed a deficiency in their accounting of Depreciation and/or Amortization in 12.5% of their adverse filings. (See graph on right.) This percentage dropped dramatically the next year to 6.7% and continued to decline each year thereafter. So far in Year 6, 2.4% of adverse SOX 404 filings implicated Depreciation and/or Amortization issues. The high percentage in Year 1 is likely due to the letter dated February 7, 2005 from SEC chief accountant Donald Nicolaise to the AICPA.10 The SEC letter provided lease accounting clarification on (1) the amortization of lessor improvements, (2) rent holidays, and (3) landlord construction incentives. This clarification appears to have caused a high percentage of adverse 404 disclosures. Since Year 1, companies have steadily improved their accounting procedures in this area. 6. During SOX Year 5, the top-three accounting issues identified by the clients of each of the Big-4
accounting firms fall within seven taxonomy categories.
The last SOX 404 report published by Audit Analytics provided an update for SOX Year 4 disclosures.11 As a result, Audit Analytics attached a Year 5 set of tables to the appendix of this report in addition to the Year 6 tables. The table on page 17 of this report lists 22 accounting issues that can be disclosed in an adverse SOX 404 assessment. (See table on page 17: SOX 404 Disclosures: Year 5 Issue Update; GAAP Financial Issues in Adverse Disclosures.) A review of the clients of the Big-4 accounting firms found that the total number of adverse disclosures filed by clients of Ernst & Young, PricewaterhouseCoopers, KPMG, and Deloitte & Touche totaled 40, 23, 30 and 31, respectively. All these adverse disclosures identified over 20 taxonomy issues, but a review of each client grouping by auditor revealed that the top-three issues of each group all fell within a list of only seven taxonomy issues.12 The table below groups the SOX Year 5, Big-4 clients by their auditor and provides the percentage of occurrence for the top-three issues for each group. If there was a tie in the third-place ranking, all issues with the third-place percentage are shown. As shown below, all four client groupings have the same two taxonomy issues in their top-three list: (1) Revenue Recognition Issues and (2) Tax Expense/Benefit/Deferral/ Other (FAS 109) Issues.
Percentage of Occurrence of the Top-Three Accounting Issues in SOX 404 Year 5 As Identified by Companies Filing Auditor Attestations from Big-4 Audit Firms
(Companies Grouped by Auditor) 10 A group of restatements caused the AICPA to request a clarification from the SEC and the letter followed. 11 See Audit Analytics, 404 Dashboard, Year 4 Update, December 2008. 12 The top-three issue does not include the broad category, Unspecified/Unidentified/Inapplicable FASB/GAAP Issues.

Audit Analytics® October 2010
AuditAnalytics.com - 9 Main Street 2F, Sutton, MA 01590 - (508)476-7007 - [email protected] 6
7. During SOX Year 6, the top-three accounting issues identified by the clients of each of the Big-4
accounting firms fall within eight taxonomy categories.
Similar to the Year 5 analysis above, Audit Analytics reviewed SOX 404 Year 6 to identify the top-three issues. The total number of adverse disclosures filed by clients of Ernst & Young, PricewaterhouseCoopers, KPMG, and Deloitte & Touche totaled 12, 17, 10 and 16, respectively. (See table on page 30: SOX 404 Disclosures: Year 6 Issue Update; GAAP Financial Issues in Adverse Disclosures.) All these adverse disclosures identified 18 taxonomy issues, but the top-three issues of each client group all fell within a list of only eight taxonomy issues. The table below groups the SOX Year 6, Big-4 clients by their auditor and provides the percentage of occurrence for the top-three issues for each group. If there was a tie in the third-place ranking, all issues with the third-place percentage are shown. Unlike Year 5, no single issue appeared as a top-three category for all four client groupings. While one issue disappeared from the top-three list (Deferred, Stock-Based or Executive Compensation Issues), two new categories emerged: (1) Debt, Quasi-Debt, Warrants & Equity ( BCF) Security Issues and (2) Foreign, Related Party, Affiliated and/or Subsidiary Entity Issues) Issues.
Percentage of Occurrence of the Top-Three Accounting Issues in SOX 404 Year 6 As Identified by Companies Filing Auditor Attestations from Big-4 Audit Firms
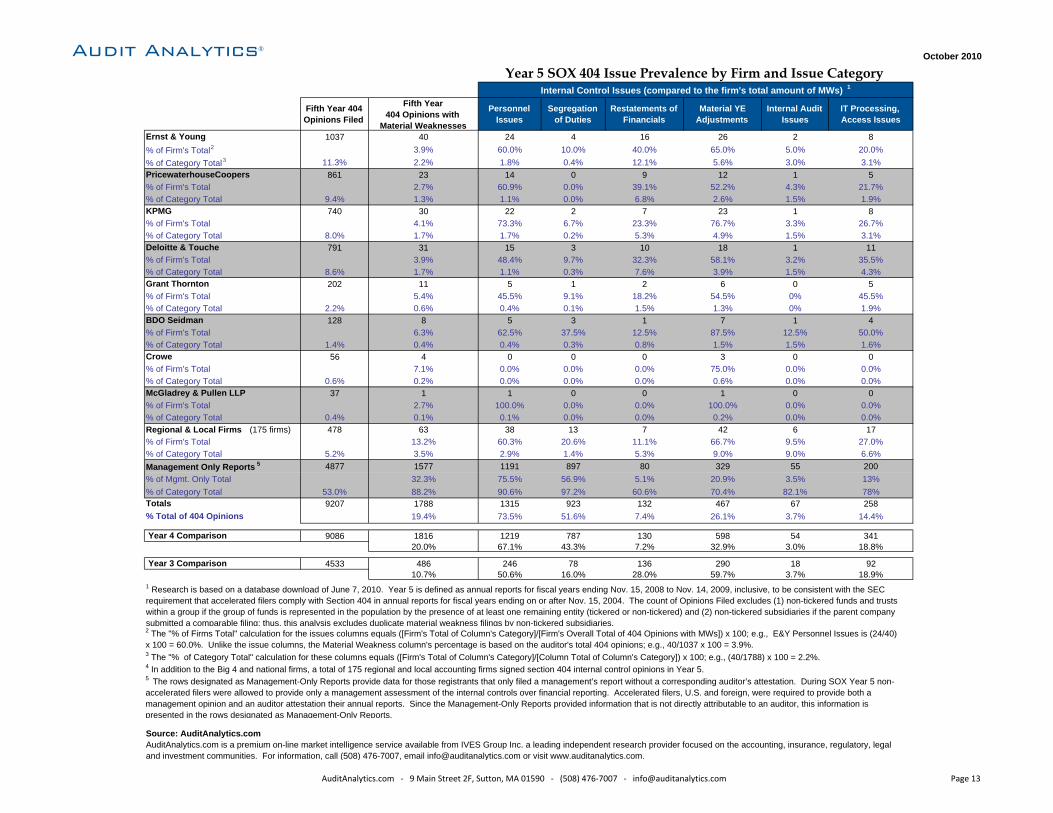
(Companies Grouped by Auditor) 8. During SOX Year 5 and Year 6, the top-two internal control issues identified by the clients of each of
the Big-4 accounting firms were the same for both years.
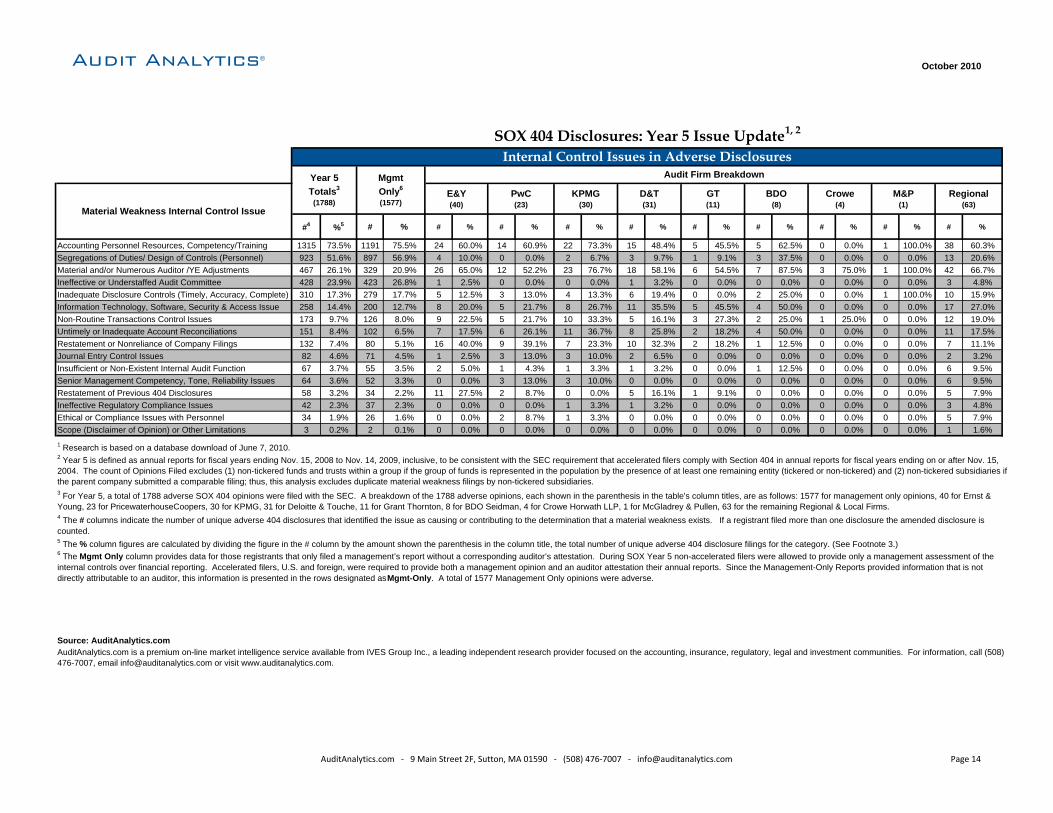
The tables on page 14 and page 27 list sixteen internal control issues and quantify how often these issues were disclosed in adverse SOX 404 filings. A review of Year 5 and Year 6 that focused on Big-4 client groupings found that the same two issues ranked in the top of the list for both years: (1) Accounting Personnel Resources, Competency/Training and (2) Material and/or Numerous Auditor /YE Adjustments. Although the percentage of adverse auditor attestations has decreased every year since SOX Year 1, the adverse attestations that were filed commonly disclosed personnel resources and/or competency as an issue of concern. As shown in the graph on the right, in recent years larger companies that filed adverse SOX 404 disclosures more often than not had personnel issues as at least one of their internal control weaknesses. (See table on page 25: Year 6 Issue Prevalence by Firm and Issue Category.)

Audit Analytics® October 2010
AuditAnalytics.com ● 9 Main Street, Sutton 2F, MA 01590 ● (508) 476-7007 ● [email protected] Page 7
SOX 404 Year 5 Tables
Audit Analytics®October 2010
SOX 404Year 4
SOX 404Year 3
SOX 404Year 2
SOX 404Year 1
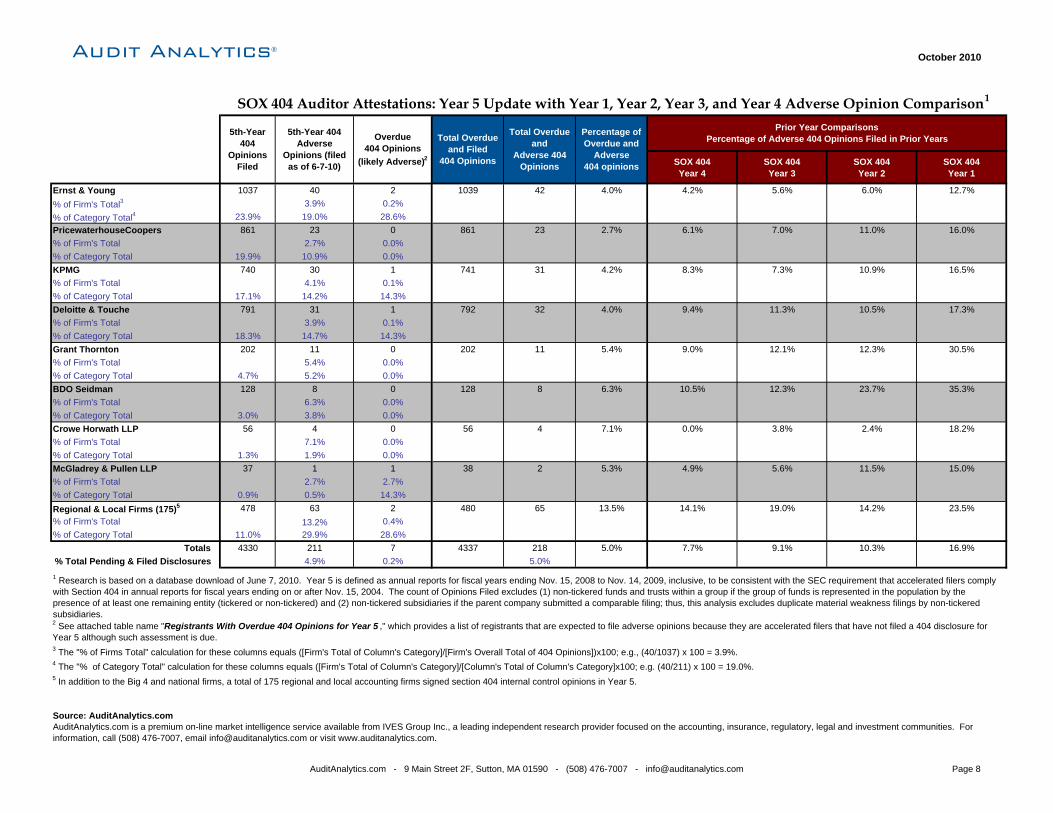
Ernst & Young 1037 40 2 1039 42 4.0% 4.2% 5.6% 6.0% 12.7%% of Firm's Total3 3.9% 0.2%% of Category Total4 23.9% 19.0% 28.6%PricewaterhouseCoopers 861 23 0 861 23 2.7% 6.1% 7.0% 11.0% 16.0%% of Firm's Total 2.7% 0.0%% of Category Total 19.9% 10.9% 0.0%KPMG 740 30 1 741 31 4.2% 8.3% 7.3% 10.9% 16.5%% of Firm's Total 4.1% 0.1%% of Category Total 17.1% 14.2% 14.3%Deloitte & Touche 791 31 1 792 32 4.0% 9.4% 11.3% 10.5% 17.3%% of Firm's Total 3.9% 0.1%% of Category Total 18.3% 14.7% 14.3%Grant Thornton 202 11 0 202 11 5.4% 9.0% 12.1% 12.3% 30.5%% of Firm's Total 5.4% 0.0%% of Category Total 4.7% 5.2% 0.0%BDO Seidman 128 8 0 128 8 6.3% 10.5% 12.3% 23.7% 35.3%% of Firm's Total 6.3% 0.0%% of Category Total 3.0% 3.8% 0.0%Crowe Horwath LLP 56 4 0 56 4 7.1% 0.0% 3.8% 2.4% 18.2%% of Firm's Total 7.1% 0.0%% of Category Total 1.3% 1.9% 0.0%McGladrey & Pullen LLP 37 1 1 38 2 5.3% 4.9% 5.6% 11.5% 15.0%% of Firm's Total 2.7% 2.7%% of Category Total 0.9% 0.5% 14.3%Regional & Local Firms (175)5 478 63 2 480 65 13.5% 14.1% 19.0% 14.2% 23.5%% of Firm's Total 13.2% 0.4%% of Category Total 11.0% 29.9% 28.6%
Totals 4330 211 7 4337 218 5.0% 7.7% 9.1% 10.3% 16.9%% Total Pending & Filed Disclosures 4.9% 0.2% 5.0%
Source: AuditAnalytics.com
Percentage ofOverdue and
Adverse404 opinions
Prior Year ComparisonsPercentage of Adverse 404 Opinions Filed in Prior Years
SOX 404 Auditor Attestations: Year 5 Update with Year 1, Year 2, Year 3, and Year 4 Adverse Opinion Comparison1
4 The "% of Category Total" calculation for these columns equals ([Firm's Total of Column's Category]/[Column's Total of Column's Category]x100; e.g. (40/211) x 100 = 19.0%.
AuditAnalytics.com is a premium on-line market intelligence service available from IVES Group Inc., a leading independent research provider focused on the accounting, insurance, regulatory, legal and investment communities. For information, call (508) 476-7007, email [email protected] or visit www.auditanalytics.com.
1 Research is based on a database download of June 7, 2010. Year 5 is defined as annual reports for fiscal years ending Nov. 15, 2008 to Nov. 14, 2009, inclusive, to be consistent with the SEC requirement that accelerated filers comply with Section 404 in annual reports for fiscal years ending on or after Nov. 15, 2004. The count of Opinions Filed excludes (1) non-tickered funds and trusts within a group if the group of funds is represented in the population by the presence of at least one remaining entity (tickered or non-tickered) and (2) non-tickered subsidiaries if the parent company submitted a comparable filing; thus, this analysis excludes duplicate material weakness filings by non-tickered subsidiaries. 2 See attached table name "Registrants With Overdue 404 Opinions for Year 5 ," which provides a list of registrants that are expected to file adverse opinions because they are accelerated filers that have not filed a 404 disclosure for Year 5 although such assessment is due. 3 The "% of Firms Total" calculation for these columns equals ([Firm's Total of Column's Category]/[Firm's Overall Total of 404 Opinions])x100; e.g., (40/1037) x 100 = 3.9%.
5 In addition to the Big 4 and national firms, a total of 175 regional and local accounting firms signed section 404 internal control opinions in Year 5.
5th-Year404
OpinionsFiled
5th-Year 404 Adverse
Opinions (filed as of 6-7-10)
Overdue404 Opinions
(likely Adverse)2
Total Overdueand Filed
404 Opinions
Total Overdueand
Adverse 404Opinions
AuditAnalytics.com - 9 Main Street 2F, Sutton, MA 01590 - (508) 476-7007 - [email protected] Page 8
Audit Analytics®October 2010
SOX 404Year 4
SOX 404Year 3
SOX 404Year 2
SOX 404Year 1
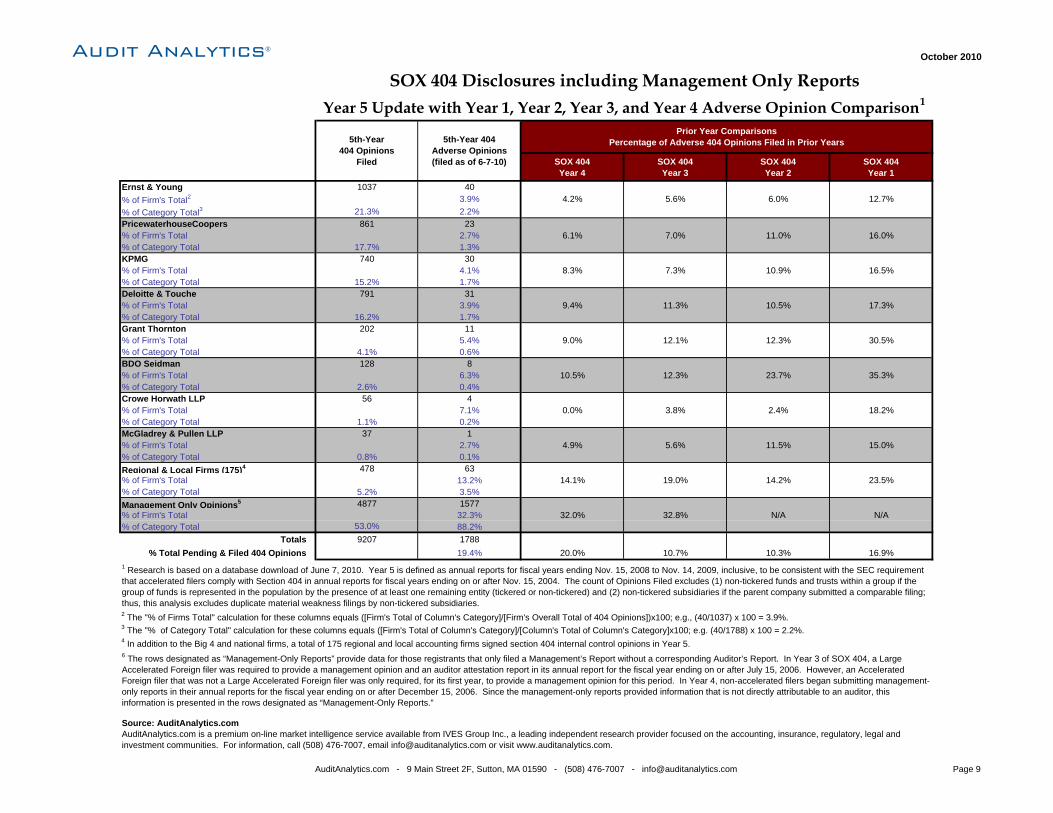
Ernst & Young 1037 40% of Firm's Total2 3.9% 4.2% 5.6% 6.0% 12.7%% of Category Total3 21.3% 2.2%PricewaterhouseCoopers 861 23% of Firm's Total 2.7% 6.1% 7.0% 11.0% 16.0%% of Category Total 17.7% 1.3%KPMG 740 30% of Firm's Total 4.1% 8.3% 7.3% 10.9% 16.5%% of Category Total 15.2% 1.7%Deloitte & Touche 791 31% of Firm's Total 3.9% 9.4% 11.3% 10.5% 17.3%% of Category Total 16.2% 1.7%Grant Thornton 202 11% of Firm's Total 5.4% 9.0% 12.1% 12.3% 30.5%% of Category Total 4.1% 0.6%BDO Seidman 128 8% of Firm's Total 6.3% 10.5% 12.3% 23.7% 35.3%% of Category Total 2.6% 0.4%Crowe Horwath LLP 56 4% of Firm's Total 7.1% 0.0% 3.8% 2.4% 18.2%% of Category Total 1.1% 0.2%McGladrey & Pullen LLP 37 1% of Firm's Total 2.7% 4.9% 5.6% 11.5% 15.0%% of Category Total 0.8% 0.1%Regional & Local Firms (175)4 478 63% of Firm's Total 13.2% 14.1% 19.0% 14.2% 23.5%% of Category Total 5.2% 3.5%Management Only Opinions5 4877 1577% of Firm's Total 32.3% 32.0% 32.8% N/A N/A% of Category Total 53.0% 88.2%
Totals 9207 1788% Total Pending & Filed 404 Opinions 19.4% 20.0% 10.7% 10.3% 16.9%
Source: AuditAnalytics.com
SOX 404 Disclosures including Management Only ReportsYear 5 Update with Year 1, Year 2, Year 3, and Year 4 Adverse Opinion Comparison1
1 Research is based on a database download of June 7, 2010. Year 5 is defined as annual reports for fiscal years ending Nov. 15, 2008 to Nov. 14, 2009, inclusive, to be consistent with the SEC requirement that accelerated filers comply with Section 404 in annual reports for fiscal years ending on or after Nov. 15, 2004. The count of Opinions Filed excludes (1) non-tickered funds and trusts within a group if the group of funds is represented in the population by the presence of at least one remaining entity (tickered or non-tickered) and (2) non-tickered subsidiaries if the parent company submitted a comparable filing; thus, this analysis excludes duplicate material weakness filings by non-tickered subsidiaries.2 The "% of Firms Total" calculation for these columns equals ([Firm's Total of Column's Category]/[Firm's Overall Total of 404 Opinions])x100; e.g., (40/1037) x 100 = 3.9%.3 The "% of Category Total" calculation for these columns equals ([Firm's Total of Column's Category]/[Column's Total of Column's Category]x100; e.g. (40/1788) x 100 = 2.2%.
5th-Year404 Opinions
Filed
5th-Year 404Adverse Opinions(filed as of 6-7-10)
Prior Year ComparisonsPercentage of Adverse 404 Opinions Filed in Prior Years
4 In addition to the Big 4 and national firms, a total of 175 regional and local accounting firms signed section 404 internal control opinions in Year 5.6 The rows designated as “Management-Only Reports” provide data for those registrants that only filed a Management’s Report without a corresponding Auditor’s Report. In Year 3 of SOX 404, a Large Accelerated Foreign filer was required to provide a management opinion and an auditor attestation report in its annual report for the fiscal year ending on or after July 15, 2006. However, an Accelerated Foreign filer that was not a Large Accelerated Foreign filer was only required, for its first year, to provide a management opinion for this period. In Year 4, non-accelerated filers began submitting management-only reports in their annual reports for the fiscal year ending on or after December 15, 2006. Since the management-only reports provided information that is not directly attributable to an auditor, this information is presented in the rows designated as “Management-Only Reports.”
AuditAnalytics.com is a premium on-line market intelligence service available from IVES Group Inc., a leading independent research provider focused on the accounting, insurance, regulatory, legal and investment communities. For information, call (508) 476-7007, email [email protected] or visit www.auditanalytics.com.
AuditAnalytics.com - 9 Main Street 2F, Sutton, MA 01590 - (508) 476-7007 - [email protected] Page 9

Audit Analytics® October 2010
Number of1st-Time Filers
(newly required)
Number of 404 Adverse
Opinions From1st-Time Filers
Number of1st-Time Filers
(newly required)
Number of 404 Adverse
Opinions From1st-Time Filers
Number of1st-Time Filers
(newly required)
Number of 404 Adverse
Opinions From1st-Time Filers
Number of1st-Time Filers
(newly required)
Number of 404 Adverse
Opinions From1st-Time Filers
Number of1st-Time Filers
(newly required)
Number of 404 Adverse
Opinions From1st-Time Filers
Ernst & Young LLP 937 119 103 4 149 7 133 11 62 5% of Firm's Total4 12.7% 3.9% 4.7% 8.3% 8.1%% of Category Total5 25.3% 19.1% 23.8% 8.5% 21.1% 9.2% 20.5% 11.6% 18.9% 13.9%PricewaterhouseCoopers LLP 860 138 66 7 150 10 106 10 50 1% of Firm's Total 16.0% 10.6% 6.7% 9.4% 2.0%% of Category Total 23.2% 22.1% 15.2% 14.9% 21.2% 13.2% 16.4% 10.5% 15.2% 2.8%KPMG LLP 763 126 68 8 102 3 99 15 42 2% of Firm's Total 16.5% 11.8% 2.9% 15.2% 4.8%% of Category Total 20.6% 20.2% 15.7% 17.0% 14.4% 3.9% 15.3% 15.8% 12.8% 5.6%Deloitte & Touche LLP 671 116 76 11 134 12 113 15 55 4% of Firm's Total 17.3% 14.5% 9.0% 13.3% 7.3%% of Category Total 18.1% 18.6% 17.6% 23.4% 19.0% 15.8% 17.4% 15.8% 16.8% 11.1%Grant Thornton LLP 118 36 18 3 23 4 30 5 17 3% of Firm's Total 30.5% 16.7% 17.4% 16.7% 17.6%% of Category Total 3.2% 5.8% 4.2% 6.4% 3.3% 5.3% 4.6% 5.3% 5.2% 8.3%BDO Seidman LLP 85 30 21 4 18 4 17 0 10 1% of Firm's Total 35.3% 19.0% 22.2% 0.0% 10.0%% of Category Total 2.3% 4.8% 4.8% 8.5% 2.5% 5.3% 2.6% 0.0% 3.0% 2.8%Crowe Horwath LLP 33 6 3 0 3 0 6 0 1 0% of Firm's Total 18.2% 0.0% 0.0% 0.0% 0.0%% of Category Total 0.9% 1.0% 0.7% 0.0% 0.4% 0.0% 0.9% 0.0% 0.3% 0.0%McGladrey & Pullen LLP 20 3 4 0 8 0 6 1 9 0% of Firm's Total 15.0% 0.0% 0.0% 16.7% 0.0%% of Category Total 0.5% 0.5% 0.9% 0.0% 1.1% 0.0% 0.9% 1.1% 2.7% 0.0%Regional & Local Firms6 213 50 74 10 119 36 138 38 82 20% of Firm's Total 23.5% 13.5% 30.3% 27.5% 24.4%% of Category Total 5.8% 8.0% 17.1% 21.3% 16.9% 47.4% 21.3% 40.0% 25.0% 55.6%
Totals 3700 624 433 47 706 76 648 95 328 36 % Total Filed 404 Opinions 16.9% 10.9% 10.8% 14.7% 11.0%
Source: AuditAnalytics.com AuditAnalytics.com is a premium on-line market intelligence service available from IVES Group Inc., a leading independent research provider focused on the accounting, insurance, regulatory, legal and investment communities. For information, call (508) 476-7007, email [email protected] or visit www.auditanalytics.com.
1 Research is based on a database download of June 7, 2010. Year 5 is defined as annual reports for fiscal years ending Nov. 15, 2008 to Nov. 14, 2009, inclusive, to be consistent with the SEC requirement that accelerated filers comply with Section 404 in annual reports for fiscal years ending on or after Nov. 15, 2004. The count of Opinions Filed excludes (1) non-tickered funds and trusts within a group if the group of funds is represented in the population by the presence of at least one remaining entity (tickered or non-tickered) and (2) non-tickered subsidiaries if the parent company submitted a comparable filing; thus, this analysis excludes duplicate material weakness filings by non-tickered subsidiaries.
3 This table does not include any registrants identified in the attached table named Registrants With Overdue 404 Opinions For Year 5 , some of which would be first time filers and expected to file adverse opinions since the opinion is late.4 The "% of Firms Total" calculation for these columns equals ([Firm's Total of Column's Category]/[Firm's Overall Total of 404 Opinions with MWs]) (119/937) x 100 = 12.7%.
6 Regional & Local Firms includes all firms, other than the Big 4 and National 4 firms, that signed one or more section 404 internal control opinions (whether for first-time filers or not): 105 in Year1; 133 in Year 2; 168 in Year 3; 153 in Year 4 and 175 in Year 5.
2 The table above does not list the data regarding Management-Only opinions. To view this data incoporated into the table, see table on next page: Review of First-Time Filers by Year (with Management-Only Assessments) .
Year 1 Year 2 Year 5
Review of First-Time Filers by Year (Auditor Reports Only)1, 2, 3
5 The "% of Category Total" calculation for these columns equals ([Firm's Total of Column's Category]/[Column's Total of Column's Category]) x 100; e.g. (119/624) x 100 = 19.1%
Year 3 Year 4
AuditAnalytics.com - 9 Main Street 2F, Sutton, MA 01590 - (508) 476-7007 - [email protected] Page 10
Audit Analytics®October 2010
Number of1st-Time Filers
(newly required)
Number of 404 Adverse
Opinions From1st-Time Filers
Number of1st-Time Filers
(newly required)
Number of 404 Adverse
Opinions From1st-Time Filers
Number of1st-Time Filers
(newly required)
Number of 404 Adverse
Opinions From1st-Time Filers
Number of1st-Time Filers
(newly required)
Number of 404 Adverse
Opinions From1st-Time Filers
Number of1st-Time Filers
(newly required)
Number of 404 Adverse
Opinions From1st-Time Filers
Ernst & Young LLP 937 119 103 4 145 7 133 11 62 5% of Firm's Total3 12.7% 3.9% 4.8% 8.3% 8.1%% of Category Total4 25.3% 19.1% 23.8% 8.5% 15.2% 4.4% 2.7% 0.7% 1.7% 0.5%PricewaterhouseCoopers LLP 860 138 66 7 139 8 106 10 50 1% of Firm's Total 16.0% 10.6% 5.8% 9.4% 2.0%% of Category Total 23.2% 22.1% 15.2% 14.9% 14.6% 5.0% 2.1% 0.7% 1.4% 0.1%KPMG LLP 763 126 68 8 92 2 99 15 42 2% of Firm's Total 16.5% 11.8% 2.2% 15.2% 4.8%% of Category Total 20.6% 20.2% 15.7% 17.0% 9.7% 1.3% 2.0% 1.0% 1.2% 0.2%Deloitte & Touche LLP 671 116 76 11 134 12 113 15 55 4% of Firm's Total 17.3% 14.5% 9.0% 13.3% 7.3%% of Category Total 18.1% 18.6% 17.6% 23.4% 14.1% 7.5% 2.3% 1.0% 1.5% 0.4%Grant Thornton LLP 118 36 18 3 20 4 30 5 17 3% of Firm's Total 30.5% 16.7% 20.0% 16.7% 17.6%% of Category Total 3.2% 5.8% 4.2% 6.4% 2.1% 2.5% 0.6% 0.3% 0.5% 0.3%BDO Seidman LLP 85 30 21 4 16 2 17 0 10 1% of Firm's Total 35.3% 19.0% 12.5% 0.0% 10.0%% of Category Total 2.3% 4.8% 4.8% 8.5% 1.7% 1.3% 0.3% 0.0% 0.3% 0.1%Crowe Horwath LLP 33 6 3 0 3 0 6 0 1 0% of Firm's Total 18.2% 0.0% 0.0% 0.0% 0.0%% of Category Total 0.9% 1.0% 0.7% 0.0% 0.3% 0.0% 0.1% 0.0% 0.0% 0.0%McGladrey & Pullen LLP 20 3 4 0 7 0 6 1 9 0% of Firm's Total 15.0% 0.0% 0.0% 16.7% 0.0%% of Category Total 0.5% 0.5% 0.9% 0.0% 0.7% 0.0% 0.1% 0.1% 0.2% 0.0%Regional & Local Firms5 213 50 74 10 106 32 138 38 82 20% of Firm's Total 23.5% 13.5% 30.2% 27.5% 24.4%% of Category Total 5.8% 8.0% 17.1% 21.3% 11.1% 20.0% 2.8% 2.6% 2.3% 1.9%Management-Only Reports6 N/A N/A N/A N/A 289 93 4349 1386 3279 1008% of Firm's Total 32.2% 31.9% 30.7%% of Category Total 30.4% 58.1% 87.0% 93.6% 90.9% 96.6%
Totals 3700 624 433 47 951 160 4997 1481 3607 1044 % Total Filed 404 Opinions 16.9% 10.9% 16.8% 29.6% 28.9%
Source: AuditAnalytics.com
Year 1 Year 2 Year 5
Review of First-Time Filers by Year (with Management-Only Assessments)1,2
4 The "% of Category Total" calculation for these columns equals ([Firm's Total of Column's Category]/[Column's Total of Column's Category]x100; e.g. (119/624) x 100 = 19.1%
AuditAnalytics.com is a premium on-line market intelligence service available from IVES Group Inc., a leading independent research provider focused on the accounting, insurance, regulatory, legal and investment communities. For information, call (508) 476-7007, email [email protected] or visit www.auditanalytics.com.
1 Research is based on a database download of June 7, 2010. Year 5 is defined as annual reports for fiscal years ending Nov. 15, 2008 to Nov. 14, 2009, inclusive, to be consistent with the SEC requirement that accelerated filers comply with Section 404 in annual reports for fiscal years ending on or after Nov. 15, 2004. The count of Opinions Filed excludes (1) non-tickered funds and trusts within a group if the group of funds is represented in the population by the presence of at least one remaining entity (tickered or non-tickered) and (2) non-tickered subsidiaries if the parent company submitted a comparable filing; thus, this analysis excludes duplicate material weakness filings by non-tickered subsidiaries. 2 This table does not included any registrants identified in the attached table named Registrants With Overdue 404 Opinions For Year 5 , some of which would be first time filers and expected to file adverse opinions since the opinion is late.3 The "% of Firms Total" calculation for these columns equals ([Firm's Total of Column's Category]/[Firm's Overall Total of 404 Opinions with MWs]) (119/937) x 100 = 12.7%.
5 Regional & Local Firms includes all firms, other than the Big 4 and National 4 firms, that signed one or more section 404 internal control opinions (whether for first-time filers or not): 105 in Year1; 133 in Year 2; 168 in Year 3; 153 in Year 4 and 175 in Year 5.
Year 3
6 The rows designated as “Management-Only Reports” provide data for those registrants that only filed a Management’s Report without a corresponding Auditor’s Report. In Year 3 of SOX 404, a Large Accelerated Foreign filer was required to provide a management opinion and an auditor attestation report in its annual report for the fiscal year ending on or after July 15, 2006. However, an Accelerated Foreign filer that was not a Large Accelerated Foreign filer was only required, for its first year, to provide a management opinion for this period. In Year 4, non-accelerated filers began submitting management-only reports in their annual reports for the fiscal year ending on or after December 15, 2006. Since the management-only reports provided information that is not directly attributable to an auditor, this information is presented in the rows designated as “Management-Only Reports.”
Year 4
AuditAnalytics.com ‐ 9 Main Street 2F, Sutton, MA 01590 ‐ (508) 476‐7007 ‐ [email protected] Page 11

Audit Analytics® October 2010
Fifth Year 404 Opinions Filed
Fifth Year 404 Opinions with Material Weaknesses
Personnel Issues
Segregation of Duties
Restatements of Financials
Material YE Adjustments
Internal Audit Issues
IT Processing, Access Issues
Ernst & Young 1037 40 24 4 16 26 2 8% of Firm's Total2 3.9% 60.0% 10.0% 40.0% 65.0% 5.0% 20.0%% of Category Total3 23.9% 19.0% 19.4% 15.4% 30.8% 18.8% 16.7% 13.8%PricewaterhouseCoopers 861 23 14 0 9 12 1 5% of Firm's Total 2.7% 60.9% 0.0% 39.1% 52.2% 4.3% 21.7%% of Category Total 19.9% 10.9% 11.3% 0.0% 17.3% 8.7% 8.3% 8.6%KPMG 740 30 22 2 7 23 1 8% of Firm's Total 4.1% 73.3% 6.7% 23.3% 76.7% 3.3% 26.7%% of Category Total 17.1% 14.2% 17.7% 7.7% 13.5% 16.7% 8.3% 13.8%Deloitte & Touche 791 31 15 3 10 18 1 11% of Firm's Total 3.9% 48.4% 9.7% 32.3% 58.1% 3.2% 35.5%% of Category Total 18.3% 14.7% 12.1% 11.5% 19.2% 13.0% 8.3% 19.0%Grant Thornton 202 11 5 1 2 6 0 5% of Firm's Total 5.4% 45.5% 9.1% 18.2% 54.5% 0% 45.5%% of Category Total 4.7% 5.2% 4.0% 3.8% 3.8% 4.3% 0% 8.6%BDO Seidman 128 8 5 3 1 7 1 4% of Firm's Total 6.3% 62.5% 37.5% 12.5% 87.5% 12.5% 50.0%% of Category Total 3.0% 3.8% 4.0% 11.5% 1.9% 5.1% 8.3% 6.9%Crowe 56 4 0 0 0 3 0 0% of Firm's Total 7.1% 0.0% 0.0% 0.0% 75.0% 0.0% 0.0%% of Category Total 1.3% 1.9% 0.0% 0.0% 0.0% 2.2% 0.0% 0.0%McGladrey & Pullen LLP 37 1 1 0 0 1 0 0% of Firm's Total 2.7% 100.0% 0.0% 0.0% 100.0% 0.0% 0.0%% of Category Total 0.9% 0.5% 0.8% 0.0% 0.0% 0.7% 0.0% 0.0%Regional & Local Firms (175 firms) 478 63 38 13 7 42 6 17% of Firm's Total 13.2% 60.3% 20.6% 11.1% 66.7% 9.5% 27.0%% of Category Total 11.0% 29.9% 30.6% 50.0% 13.5% 30.4% 50.0% 29.3%Totals 4330 211 124 26 52 138 12 58% Total of 404 Opinions 4.9% 58.8% 12.3% 24.6% 65.4% 5.7% 27.5%
Year 4 Comparison 4496 347 226 47 77 233 12 907.7% 65.1% 13.5% 22.2% 67.1% 3.5% 25.9%
Year 3 Comparison 4216 382 179 50 126 260 14 749.1% 46.9% 13.1% 33.0% 68.1% 3.7% 19.4%
Year 2 Comparison 3791 390 207 57 177 250 4 7910.3% 53.1% 14.6% 45.4% 64.1% 1.0% 20.3%
Year 1 Comparison 3700 624 304 149 324 335 17 13516.9% 48.7% 23.9% 51.9% 53.7% 2.7% 21.6%
Source: AuditAnalytics.com AuditAnalytics.com is a premium on-line market intelligence service available from IVES Group Inc. a leading independent research provider focused on the accounting, insurance, regulatory, legal and investment communities. For information, call (508) 476-7007, email [email protected] or visit www.auditanalytics.com.
Year 5 SOX 404 Issue Prevalence by Firm and Issue CategoryInternal Control Issues (compared to the firm's total amount of MWs) 1
1 Research is based on a database download of June 7, 2010. Year 5 is defined as annual reports for fiscal years ending Nov. 15, 2008 to Nov. 14, 2009, inclusive, to be consistent with the SEC requirement that accelerated filers comply with Section 404 in annual reports for fiscal years ending on or after Nov. 15, 2004. The count of Opinions Filed excludes (1) non-tickered funds and trusts within a group if the group of funds is represented in the population by the presence of at least one remaining entity (tickered or non-tickered) and (2) non-tickered subsidiaries if the parent company submitted a comparable filing; thus, this analysis excludes duplicate material weakness filings by non-tickered subsidiaries. 2 The "% of Firms Total" calculation for the issues columns equals ([Firm's Total of Column's Category]/[Firm's Overall Total of 404 Opinions with MWs]) x 100; e.g., E&Y Personnel Issues is (24/40) x 100 = 60.0%. Unlike the issue columns, the Material Weakness column's percentage is based on the auditor's total 404 opinions; e.g., 40/1037 x 100 = 3.9%.3 The "% of Category Total" calculation for these columns equals ([Firm's Total of Column's Category]/[Column Total of Column's Category]) x 100; e.g., (40/211) x 100 = 19.0%.4 In addition to the Big 4 and national firms, a total of 175 regional and local accounting firms signed section 404 internal control opinions in Year 5.
AuditAnalytics.com ‐ 9 Main Street 2F, Sutton, MA 01590 ‐ (508) 476‐7007 ‐ [email protected] Page 12
Audit Analytics®October 2010
Fifth Year 404 Opinions Filed
Fifth Year 404 Opinions with
Material Weaknesses
Personnel Issues
Segregation of Duties
Restatements of Financials
Material YE Adjustments
Internal Audit Issues
IT Processing, Access Issues
Ernst & Young 1037 40 24 4 16 26 2 8% of Firm's Total2 3.9% 60.0% 10.0% 40.0% 65.0% 5.0% 20.0%% of Category Total3 11.3% 2.2% 1.8% 0.4% 12.1% 5.6% 3.0% 3.1%PricewaterhouseCoopers 861 23 14 0 9 12 1 5% of Firm's Total 2.7% 60.9% 0.0% 39.1% 52.2% 4.3% 21.7%% of Category Total 9.4% 1.3% 1.1% 0.0% 6.8% 2.6% 1.5% 1.9%KPMG 740 30 22 2 7 23 1 8% of Firm's Total 4.1% 73.3% 6.7% 23.3% 76.7% 3.3% 26.7%% of Category Total 8.0% 1.7% 1.7% 0.2% 5.3% 4.9% 1.5% 3.1%Deloitte & Touche 791 31 15 3 10 18 1 11% of Firm's Total 3.9% 48.4% 9.7% 32.3% 58.1% 3.2% 35.5%% of Category Total 8.6% 1.7% 1.1% 0.3% 7.6% 3.9% 1.5% 4.3%Grant Thornton 202 11 5 1 2 6 0 5% of Firm's Total 5.4% 45.5% 9.1% 18.2% 54.5% 0% 45.5%% of Category Total 2.2% 0.6% 0.4% 0.1% 1.5% 1.3% 0% 1.9%BDO Seidman 128 8 5 3 1 7 1 4% of Firm's Total 6.3% 62.5% 37.5% 12.5% 87.5% 12.5% 50.0%% of Category Total 1.4% 0.4% 0.4% 0.3% 0.8% 1.5% 1.5% 1.6%Crowe 56 4 0 0 0 3 0 0% of Firm's Total 7.1% 0.0% 0.0% 0.0% 75.0% 0.0% 0.0%% of Category Total 0.6% 0.2% 0.0% 0.0% 0.0% 0.6% 0.0% 0.0%McGladrey & Pullen LLP 37 1 1 0 0 1 0 0% of Firm's Total 2.7% 100.0% 0.0% 0.0% 100.0% 0.0% 0.0%% of Category Total 0.4% 0.1% 0.1% 0.0% 0.0% 0.2% 0.0% 0.0%Regional & Local Firms (175 firms) 478 63 38 13 7 42 6 17% of Firm's Total 13.2% 60.3% 20.6% 11.1% 66.7% 9.5% 27.0%% of Category Total 5.2% 3.5% 2.9% 1.4% 5.3% 9.0% 9.0% 6.6%Management Only Reports 5 4877 1577 1191 897 80 329 55 200% of Mgmt. Only Total 32.3% 75.5% 56.9% 5.1% 20.9% 3.5% 13%% of Category Total 53.0% 88.2% 90.6% 97.2% 60.6% 70.4% 82.1% 78%Totals 9207 1788 1315 923 132 467 67 258% Total of 404 Opinions 19.4% 73.5% 51.6% 7.4% 26.1% 3.7% 14.4%
Year 4 Comparison 9086 1816 1219 787 130 598 54 34120.0% 67.1% 43.3% 7.2% 32.9% 3.0% 18.8%
Year 3 Comparison 4533 486 246 78 136 290 18 9210.7% 50.6% 16.0% 28.0% 59.7% 3.7% 18.9%
Source: AuditAnalytics.com
5 The rows designated as Management-Only Reports provide data for those registrants that only filed a management’s report without a corresponding auditor’s attestation. During SOX Year 5 non-accelerated filers were allowed to provide only a management assessment of the internal controls over financial reporting. Accelerated filers, U.S. and foreign, were required to provide both a management opinion and an auditor attestation their annual reports. Since the Management-Only Reports provided information that is not directly attributable to an auditor, this information is presented in the rows designated as Management-Only Reports.
AuditAnalytics.com is a premium on-line market intelligence service available from IVES Group Inc. a leading independent research provider focused on the accounting, insurance, regulatory, legal and investment communities. For information, call (508) 476-7007, email [email protected] or visit www.auditanalytics.com.
Year 5 SOX 404 Issue Prevalence by Firm and Issue CategoryInternal Control Issues (compared to the firm's total amount of MWs) 1
1 Research is based on a database download of June 7, 2010. Year 5 is defined as annual reports for fiscal years ending Nov. 15, 2008 to Nov. 14, 2009, inclusive, to be consistent with the SEC requirement that accelerated filers comply with Section 404 in annual reports for fiscal years ending on or after Nov. 15, 2004. The count of Opinions Filed excludes (1) non-tickered funds and trusts within a group if the group of funds is represented in the population by the presence of at least one remaining entity (tickered or non-tickered) and (2) non-tickered subsidiaries if the parent company submitted a comparable filing; thus, this analysis excludes duplicate material weakness filings by non-tickered subsidiaries. 2 The "% of Firms Total" calculation for the issues columns equals ([Firm's Total of Column's Category]/[Firm's Overall Total of 404 Opinions with MWs]) x 100; e.g., E&Y Personnel Issues is (24/40) x 100 = 60.0%. Unlike the issue columns, the Material Weakness column's percentage is based on the auditor's total 404 opinions; e.g., 40/1037 x 100 = 3.9%.3 The "% of Category Total" calculation for these columns equals ([Firm's Total of Column's Category]/[Column Total of Column's Category]) x 100; e.g., (40/1788) x 100 = 2.2%.4 In addition to the Big 4 and national firms, a total of 175 regional and local accounting firms signed section 404 internal control opinions in Year 5.
AuditAnalytics.com ‐ 9 Main Street 2F, Sutton, MA 01590 ‐ (508) 476‐7007 ‐ [email protected] Page 13
Audit Analytics®October 2010
#4 %5 # % # % # % # % # % # % # % # % # % # %
Accounting Personnel Resources, Competency/Training 1315 73.5% 1191 75.5% 24 60.0% 14 60.9% 22 73.3% 15 48.4% 5 45.5% 5 62.5% 0 0.0% 1 100.0% 38 60.3%Segregations of Duties/ Design of Controls (Personnel) 923 51.6% 897 56.9% 4 10.0% 0 0.0% 2 6.7% 3 9.7% 1 9.1% 3 37.5% 0 0.0% 0 0.0% 13 20.6%Material and/or Numerous Auditor /YE Adjustments 467 26.1% 329 20.9% 26 65.0% 12 52.2% 23 76.7% 18 58.1% 6 54.5% 7 87.5% 3 75.0% 1 100.0% 42 66.7%Ineffective or Understaffed Audit Committee 428 23.9% 423 26.8% 1 2.5% 0 0.0% 0 0.0% 1 3.2% 0 0.0% 0 0.0% 0 0.0% 0 0.0% 3 4.8%Inadequate Disclosure Controls (Timely, Accuracy, Complete) 310 17.3% 279 17.7% 5 12.5% 3 13.0% 4 13.3% 6 19.4% 0 0.0% 2 25.0% 0 0.0% 1 100.0% 10 15.9%Information Technology, Software, Security & Access Issue 258 14.4% 200 12.7% 8 20.0% 5 21.7% 8 26.7% 11 35.5% 5 45.5% 4 50.0% 0 0.0% 0 0.0% 17 27.0%Non-Routine Transactions Control Issues 173 9.7% 126 8.0% 9 22.5% 5 21.7% 10 33.3% 5 16.1% 3 27.3% 2 25.0% 1 25.0% 0 0.0% 12 19.0%Untimely or Inadequate Account Reconciliations 151 8.4% 102 6.5% 7 17.5% 6 26.1% 11 36.7% 8 25.8% 2 18.2% 4 50.0% 0 0.0% 0 0.0% 11 17.5%Restatement or Nonreliance of Company Filings 132 7.4% 80 5.1% 16 40.0% 9 39.1% 7 23.3% 10 32.3% 2 18.2% 1 12.5% 0 0.0% 0 0.0% 7 11.1%Journal Entry Control Issues 82 4.6% 71 4.5% 1 2.5% 3 13.0% 3 10.0% 2 6.5% 0 0.0% 0 0.0% 0 0.0% 0 0.0% 2 3.2%Insufficient or Non-Existent Internal Audit Function 67 3.7% 55 3.5% 2 5.0% 1 4.3% 1 3.3% 1 3.2% 0 0.0% 1 12.5% 0 0.0% 0 0.0% 6 9.5%Senior Management Competency, Tone, Reliability Issues 64 3.6% 52 3.3% 0 0.0% 3 13.0% 3 10.0% 0 0.0% 0 0.0% 0 0.0% 0 0.0% 0 0.0% 6 9.5%Restatement of Previous 404 Disclosures 58 3.2% 34 2.2% 11 27.5% 2 8.7% 0 0.0% 5 16.1% 1 9.1% 0 0.0% 0 0.0% 0 0.0% 5 7.9%Ineffective Regulatory Compliance Issues 42 2.3% 37 2.3% 0 0.0% 0 0.0% 1 3.3% 1 3.2% 0 0.0% 0 0.0% 0 0.0% 0 0.0% 3 4.8%Ethical or Compliance Issues with Personnel 34 1.9% 26 1.6% 0 0.0% 2 8.7% 1 3.3% 0 0.0% 0 0.0% 0 0.0% 0 0.0% 0 0.0% 5 7.9%Scope (Disclaimer of Opinion) or Other Limitations 3 0.2% 2 0.1% 0 0.0% 0 0.0% 0 0.0% 0 0.0% 0 0.0% 0 0.0% 0 0.0% 0 0.0% 1 1.6%
Source: AuditAnalytics.com
SOX 404 Disclosures: Year 5 Issue Update1, 2
Internal Control Issues in Adverse DisclosuresYear 5Totals3
(1788)
MgmtOnly6
(1577)
Audit Firm Breakdown
Material Weakness Internal Control Issue
E&Y(40)
PwC(23)
KPMG(30)
D&T(31)
GT(11)
BDO(8)
Crowe(4)
M&P(1)
Regional(63)
AuditAnalytics.com is a premium on-line market intelligence service available from IVES Group Inc., a leading independent research provider focused on the accounting, insurance, regulatory, legal and investment communities. For information, call (508) 476-7007, email [email protected] or visit www.auditanalytics.com.
1 Research is based on a database download of June 7, 2010.2 Year 5 is defined as annual reports for fiscal years ending Nov. 15, 2008 to Nov. 14, 2009, inclusive, to be consistent with the SEC requirement that accelerated filers comply with Section 404 in annual reports for fiscal years ending on or after Nov. 15, 2004. The count of Opinions Filed excludes (1) non-tickered funds and trusts within a group if the group of funds is represented in the population by the presence of at least one remaining entity (tickered or non-tickered) and (2) non-tickered subsidiaries if the parent company submitted a comparable filing; thus, this analysis excludes duplicate material weakness filings by non-tickered subsidiaries. 3 For Year 5, a total of 1788 adverse SOX 404 opinions were filed with the SEC. A breakdown of the 1788 adverse opinions, each shown in the parenthesis in the table's column titles, are as follows: 1577 for management only opinions, 40 for Ernst & Young, 23 for PricewaterhouseCoopers, 30 for KPMG, 31 for Deloitte & Touche, 11 for Grant Thornton, 8 for BDO Seidman, 4 for Crowe Horwath LLP, 1 for McGladrey & Pullen, 63 for the remaining Regional & Local Firms.4 The # columns indicate the number of unique adverse 404 disclosures that identified the issue as causing or contributing to the determination that a material weakness exists. If a registrant filed more than one disclosure the amended disclosure is counted.5 The % column figures are calculated by dividing the figure in the # column by the amount shown the parenthesis in the column title, the total number of unique adverse 404 disclosure filings for the category. (See Footnote 3.) 6 The Mgmt Only column provides data for those registrants that only filed a management’s report without a corresponding auditor’s attestation. During SOX Year 5 non-accelerated filers were allowed to provide only a management assessment of the internal controls over financial reporting. Accelerated filers, U.S. and foreign, were required to provide both a management opinion and an auditor attestation their annual reports. Since the Management-Only Reports provided information that is not directly attributable to an auditor, this information is presented in the rows designated as Mgmt-Only. A total of 1577 Management Only opinions were adverse.
AuditAnalytics.com ‐ 9 Main Street 2F, Sutton, MA 01590 ‐ (508) 476‐7007 ‐ [email protected] Page 14

Audit Analytics®October 2010
Fifth-Year404
OpinionsFiled
Fifth Year 404Opinions with
Material Weaknesses
Cash FlowStatement
(FAS 95) Error
Debt, Warrants& Equity (BCF)Security Issues
Depreciation /Amortization
Inventory /Vendor Cost
of Sales
Leases orContingencies
Fixed /Intangible
Assets
Revenue Recognition
Tax AccrualsDeferrals etc.
ConsolidationFin (46) Issues
Ernst & Young 1037 40 2 3 0 4 3 6 12 15 4% of Firm's Total2 3.9% 5.0% 7.5% 0.0% 10.0% 7.5% 15.0% 30.0% 37.5% 10.0%% of Category Total3 23.9% 19.0% 100.0% 25.0% 0.0% 10.5% 37.5% 20.0% 24.0% 28.8% 36.4%PricewaterhouseCoopers 861 23 0 0 2 4 1 6 6 7 1% of Firm's Total 2.7% 0.0% 0.0% 8.7% 17.4% 4.3% 26.1% 26.1% 30.4% 4.3%% of Category Total 19.9% 10.9% 0.0% 0.0% 25.0% 10.5% 12.5% 20.0% 12.0% 13.5% 9.1%KPMG 740 30 0 1 1 7 2 3 10 11 1% of Firm's Total 4.1% 0.0% 3.3% 3.3% 23.3% 6.7% 10.0% 33.3% 36.7% 3.3%% of Category Total 17.1% 14.2% 0.0% 8.3% 12.5% 18.4% 25.0% 10.0% 20.0% 21.2% 9.1%Deloitte & Touche 791 31 0 2 1 5 1 3 5 8 3% of Firm's Total 3.9% 0.0% 6.5% 3.2% 16.1% 3.2% 9.7% 16.1% 25.8% 9.7%% of Category Total 18.3% 14.7% 0.0% 16.7% 12.5% 13.2% 12.5% 10.0% 10.0% 15.4% 27.3%Grant Thornton 202 11 0 0 0 1 0 1 1 2 0% of Firm's Total 5.4% 0.0% 0.0% 0.0% 9.1% 0.0% 9.1% 9% 18% 0.0%% of Category Total 4.7% 5.2% 0.0% 0.0% 0.0% 2.6% 0.0% 3.3% 2% 4% 0.0%BDO Seidman 128 8 0 1 0 4 0 1 2 2 0% of Firm's Total 6.3% 0.0% 12.5% 0.0% 50.0% 0.0% 12.5% 25.0% 25.0% 0.0%% of Category Total 3.0% 3.8% 0.0% 8.3% 0.0% 10.5% 0.0% 3.3% 4.0% 3.8% 0.0%Crowe 56 4 0 1 0 0 0 0 0 1 0% of Firm's Total 7.1% 0.0% 25.0% 0.0% 0.0% 0.0% 0.0% 0.0% 25.0% 0.0%% of Category Total 1.3% 1.9% 0.0% 8.3% 0.0% 0.0% 0.0% 0.0% 0.0% 1.9% 0.0%McGladrey & Pullen LLP 37 1 0 0 0 0 0 1 0 0 0% of Firm's Total 2.7% 0.0% 0.0% 0.0% 0.0% 0.0% 100.0% 0.0% 0.0% 0.0%% of Category Total 0.9% 0.5% 0.0% 0.0% 0.0% 0.0% 0.0% 3.3% 0.0% 0.0% 0.0%Regional & Local Firms (175 firms) 478 63 0 4 4 13 1 9 14 6 2% of Firm's Total 13.2% 0.0% 6.3% 6.3% 20.6% 1.6% 14.3% 22.2% 9.5% 3.2%% of Category Total 11.0% 29.9% 0.0% 33.3% 50.0% 34.2% 12.5% 30.0% 28.0% 11.5% 18.2%Totals 4330 211 2 12 8 38 8 30 50 52 11% Total of 404 Opinions 4.9% 0.9% 5.7% 3.8% 18.0% 3.8% 14.2% 23.7% 24.6% 5.2%
Year 4 Comparison 4496 347 11 15 17 77 31 58 90 104 337.7% 3.2% 4.3% 4.9% 22.2% 8.9% 16.7% 25.9% 30.0% 9.5%
Year 3 Comparison 4216 382 16 22 25 72 30 79 106 124 319.1% 4.2% 5.8% 6.5% 18.8% 7.9% 20.7% 27.7% 32.5% 8.1%
Year 2 Comparison 3791 390 28 19 26 102 45 70 119 133 3710.3% 7.2% 4.9% 6.7% 26.2% 11.5% 17.9% 30.5% 34.1% 9.5%
Year 1 Comparison 3700 624 44 45 78 172 106 120 198 198 5816.9% 7.1% 7.2% 12.5% 27.6% 17.0% 19.2% 31.7% 31.7% 9.3%
Source: AuditAnalytics.com AuditAnalytics.com is a premium on-line market intelligence service available from IVES Group Inc. a leading independent research provider focused on the accounting, insurance, regulatory, legal and investment communities. For information, call (508) 476-7007, email [email protected] or visit www.auditanalytics.com.
Year 5 SOX 404 Issue Prevalence by Firm and Issue CategoryGAAP / Accounting Areas of Failure (compared to the firm's total amount of MWs) 1
1 Research is based on a database download of June 7, 2010. Year 5 is defined as annual reports for fiscal years ending Nov. 15, 2008 to Nov. 14, 2009, inclusive, to be consistent with the SEC requirement that accelerated filers comply with Section 404 in annual reports for fiscal years ending on or after Nov. 15, 2004. The count of Opinions Filed excludes (1) non-tickered funds and trusts within a group if the group of funds is represented in the population by the presence of at least one remaining entity (tickered or non-tickered) and (2) non-tickered subsidiaries if the parent company submitted a comparable filing; thus, this analysis excludes duplicate material weakness filings by non-tickered subsidiaries. 2 The "% of Firms Total" calculation for the issues columns equals ([Firm's Total of Column's Category]/[Firm's Overall Total of 404 Opinions with MWs]) x 100; e.g., E&Y Cash Flow is (2/40) x 100 = 5.0%. Unlike the issue columns, the Material Weakness column's percentage is based on the auditor's total 404 opinions; e.g., 40/1037 x 100 = 3.9%.3 The "% of Category Total" calculation for these columns equals ([Firm's Total of Column's Category]/[Column Total of Column's Category]) x 100; e.g., (2/2) x 100 = 100%.4 In addition to the Big 4 and national firms, a total of 175 regional and local accounting firms signed section 404 internal control opinions in Year 5.
AuditAnalytics.com ‐ 9 Main Street 2F, Sutton, MA 01590 ‐ (508) 476‐7007 ‐ [email protected] Page 15

Audit Analytics®October 2010
Fifth Year404
OpinionsFiled
Fifth Year 404Opinions with
Material Weaknesses
Cash FlowStatement
(FAS 95) Error
Debt, Warrants& Equity (BCF)Security Issues
Depreciation /Amortization
Inventory /Vendor Cost
of Sales
Leases orContingencies
Fixed /Intangible
Assets
Revenue Recognition
Tax AccrualsDeferrals etc.
ConsolidationFin (46) Issues
Ernst & Young 1037 40 2 3 0 4 3 6 12 15 4% of Firm's Total2 3.9% 5.0% 7.5% 0.0% 10.0% 7.5% 15.0% 30.0% 37.5% 10.0%% of Category Total3 11.3% 2.2% 25.0% 2.7% 0.0% 4.3% 18.8% 7.7% 9.4% 13.2% 12.5%PricewaterhouseCoopers 861 23 0 0 2 4 1 6 6 7 1% of Firm's Total 2.7% 0.0% 0.0% 8.7% 17.4% 4.3% 26.1% 26.1% 30.4% 4.3%% of Category Total 9.4% 1.3% 0.0% 0.0% 11.1% 4.3% 6.3% 7.7% 4.7% 6.1% 3.1%KPMG 740 30 0 1 1 7 2 3 10 11 1% of Firm's Total 4.1% 0.0% 3.3% 3.3% 23.3% 6.7% 10.0% 33.3% 36.7% 3.3%% of Category Total 8.0% 1.7% 0.0% 0.9% 5.6% 7.5% 12.5% 3.8% 7.9% 9.6% 3.1%Deloitte & Touche 791 31 0 2 1 5 1 3 5 8 3% of Firm's Total 3.9% 0.0% 6.5% 3.2% 16.1% 3.2% 9.7% 16.1% 25.8% 9.7%% of Category Total 8.6% 1.7% 0.0% 1.8% 5.6% 5.4% 6.3% 3.8% 3.9% 7.0% 9.4%Grant Thornton 202 11 0 0 0 1 0 1 1 2 0% of Firm's Total 5.4% 0.0% 0.0% 0.0% 9.1% 0.0% 9.1% 9% 18% 0.0%% of Category Total 2.2% 0.6% 0.0% 0.0% 0.0% 1.1% 0.0% 1.3% 1% 2% 0.0%BDO Seidman 128 8 0 1 0 4 0 1 2 2 0% of Firm's Total 6.3% 0.0% 12.5% 0.0% 50.0% 0.0% 12.5% 25.0% 25.0% 0.0%% of Category Total 1.4% 0.4% 0.0% 0.9% 0.0% 4.3% 0.0% 1.3% 1.6% 1.8% 0.0%Crowe 56 4 0 1 0 0 0 0 0 1 0% of Firm's Total 7.1% 0.0% 25.0% 0.0% 0.0% 0.0% 0.0% 0.0% 25.0% 0.0%% of Category Total 0.6% 0.2% 0.0% 0.9% 0.0% 0.0% 0.0% 0.0% 0.0% 0.9% 0.0%McGladrey & Pullen LLP 37 1 0 0 0 0 0 1 0 0 0% of Firm's Total 2.7% 0.0% 0.0% 0.0% 0.0% 0.0% 100.0% 0.0% 0.0% 0.0%% of Category Total 0.4% 0.1% 0.0% 0.0% 0.0% 0.0% 0.0% 1.3% 0.0% 0.0% 0.0%Regional & Local Firms (175 firms) 478 63 0 4 4 13 1 9 14 6 2% of Firm's Total 13.2% 0.0% 6.3% 6.3% 20.6% 1.6% 14.3% 22.2% 9.5% 3.2%% of Category Total 5.2% 3.5% 0.0% 3.6% 22.2% 14.0% 6.3% 11.5% 11.0% 5.3% 6.3%Management-Only Reports 5 4877 1577 6 99 10 55 8 48 77 62 21% of Mgmt. Only Total 32.3% 0.4% 6.3% 0.6% 3.5% 0.5% 3.0% 4.9% 4% 1%% of Category Total 53.0% 88.2% 75.0% 89.2% 55.6% 59.1% 50.0% 61.5% 60.6% 54% 66%Totals 9207 1788 8 111 18 93 16 78 127 114 32% Total of 404 Opinions 19.4% 0.4% 6.2% 1.0% 5.2% 0.9% 4.4% 7.1% 6.4% 1.8%
Year 4 Comparison 9086 1816 19 93 34 172 49 116 193 179 5920.0% 1.0% 5.1% 1.9% 9.5% 2.7% 6.4% 10.6% 9.9% 3.2%
Year 3 Comparison 4533 486 16 29 28 83 33 85 117 132 4010.7% 3.3% 6.0% 5.8% 17.1% 6.8% 17.5% 24.1% 27.2% 8.2%
Source: AuditAnalytics.com
5 The rows designated as Management-Only Reports provide data for those registrants that only filed a management’s report without a corresponding auditor’s attestation. During SOX Year 5 non-accelerated filers were allowed to provide only a management assessment of the internal controls over financial reporting. Accelerated filers, U.S. and foreign, were required to provide both a management opinion and an auditor attestation their annual reports. Since the Management-Only Reports provided information that is not directly attributable to an auditor, this information is presented in the rows designated as Management-Only Reports.
AuditAnalytics.com is a premium on-line market intelligence service available from IVES Group Inc. a leading independent research provider focused on the accounting, insurance, regulatory, legal and investment communities. For information, call (508) 476-7007, email [email protected] or visit www.auditanalytics.com.
Year 5 SOX 404 Issue Prevalence by Firm and Issue CategoryGAAP / Accounting Areas of Failure (compared to the firm's total amount of MWs) 1
1 Research is based on a database download of June 7, 2010. Year 5 is defined as annual reports for fiscal years ending Nov. 15, 2008 to Nov. 14, 2009, inclusive, to be consistent with the SEC requirement that accelerated filers comply with Section 404 in annual reports for fiscal years ending on or after Nov. 15, 2004. The count of Opinions Filed excludes (1) non-tickered funds and trusts within a group if the group of funds is represented in the population by the presence of at least one remaining entity (tickered or non-tickered) and (2) non-tickered subsidiaries if the parent company submitted a comparable filing; thus, this analysis excludes duplicate material weakness filings by non-tickered subsidiaries. 2 The "% of Firms Total" calculation for the issues columns equals ([Firm's Total of Column's Category]/[Firm's Overall Total of 404 Opinions with MWs]) x 100; e.g., E&Y Cash Flow is (2/40) x 100 = 5.0%. Unlike the issue columns, the Material Weakness column's percentage is based on the auditor's total 404 opinions; e.g., 40/1037 x 100 = 3.9%.3 The "% of Category Total" calculation for these columns equals ([Firm's Total of Column's Category]/[Column Total of Column's Category]) x 100; e.g., (2/8) x 100 = 25.0%4 In addition to the Big 4 and national firms, a total of 175 regional and local accounting firms signed section 404 internal control opinions in Year 5.
AuditAnalytics.com ‐ 9 Main Street 2F, Sutton, MA 01590 ‐ (508) 476‐7007 ‐ [email protected] Page 16

Audit Analytics®October 2010
#4 %5 # % # % # % # % # % # % # % # % # % # %
Unspecified/Unidentified/Inapplicable FASB/GAAP Issues 1095 61.2% 1056 67.0% 4 10.0% 2 8.7% 5 16.7% 7 22.6% 5 45.5% 1 12.5% 0 0.0% 0 0.0% 15 23.8%Accounts/Loans Receivable, Investments & Cash Issues 167 9.3% 118 7.5% 9 22.5% 6 26.1% 7 23.3% 4 12.9% 3 27.3% 2 25.0% 3 75.0% 1 100.0% 14 22.2%Revenue Recognition Issues 127 7.1% 77 4.9% 12 30.0% 6 26.1% 10 33.3% 5 16.1% 1 9.1% 2 25.0% 0 0.0% 0 0.0% 14 22.2%Foreign, Related Party, Affiliated and/or Subsidiary Entity Issues 117 6.5% 84 5.3% 4 10.0% 1 4.3% 9 30.0% 4 12.9% 3 27.3% 1 12.5% 1 25.0% 0 0.0% 10 15.9%Tax Expense/Benefit/Deferral/Other (FAS 109) Issues 114 6.4% 62 3.9% 15 37.5% 7 30.4% 11 36.7% 8 25.8% 2 18.2% 2 25.0% 1 25.0% 0 0.0% 6 9.5%Debt,Quasi-Debt, Warrants & Equity ( BCF) Security Issues 111 6.2% 99 6.3% 3 7.5% 0 0.0% 1 3.3% 2 6.5% 0 0.0% 1 12.5% 1 25.0% 0 0.0% 4 6.3%Liabilities, Payables, Reserves and Accrual Estimate Failures 104 5.8% 72 4.6% 3 7.5% 7 30.4% 5 16.7% 5 16.1% 2 18.2% 0 0.0% 1 25.0% 0 0.0% 9 14.3%Inventory, Vendor and Cost of Sales Issues 93 5.2% 55 3.5% 4 10.0% 4 17.4% 7 23.3% 5 16.1% 1 9.1% 4 50.0% 0 0.0% 0 0.0% 13 20.6%PPE, Intangible or Fixed Asset (Value/Diminution) Issues 78 4.4% 48 3.0% 6 15.0% 6 26.1% 3 10.0% 3 9.7% 1 9.1% 1 12.5% 0 0.0% 1 100.0% 9 14.3%Expense Recording (Payroll, SG&A) Issues 75 4.2% 54 3.4% 3 7.5% 3 13.0% 5 16.7% 0 0.0% 1 9.1% 1 12.5% 0 0.0% 0 0.0% 8 12.7%Deferred, Stock-Based or Executive Compensation Issues 61 3.4% 42 2.7% 2 5.0% 4 17.4% 3 10.0% 6 19.4% 0 0.0% 1 12.5% 0 0.0% 0 0.0% 3 4.8%Acquisition, Merger, Disposal or Reorganization Issues 52 2.9% 33 2.1% 6 15.0% 5 21.7% 2 6.7% 1 3.2% 1 9.1% 1 12.5% 0 0.0% 0 0.0% 3 4.8%Consolidation, (Fin46r/Off BS) & Foreign Currency Translation 32 1.8% 21 1.3% 4 10.0% 1 4.3% 1 3.3% 3 9.7% 0 0.0% 0 0.0% 0 0.0% 0 0.0% 2 3.2%Intercompany/Investment with Subsidiary/Affiliate Entity Issues 26 1.5% 14 0.9% 2 5.0% 3 13.0% 2 6.7% 2 6.5% 0 0.0% 0 0.0% 0 0.0% 0 0.0% 3 4.8%Financial Derivatives/Hedging (FAS 133) Accounting Issues 24 1.3% 15 1.0% 2 5.0% 1 4.3% 1 3.3% 2 6.5% 0 0.0% 0 0.0% 0 0.0% 0 0.0% 3 4.8%Depreciation, Depletion or Amortization Issues 18 1.0% 10 0.6% 0 0.0% 2 8.7% 1 3.3% 1 3.2% 0 0.0% 0 0.0% 0 0.0% 0 0.0% 4 6.3%Lease, FAS 5, Legal, Contingency & Commitments Issues 16 0.9% 8 0.5% 3 7.5% 1 4.3% 2 6.7% 1 3.2% 0 0.0% 0 0.0% 0 0.0% 0 0.0% 1 1.6%Capitalization of Expenditures Issues 14 0.8% 8 0.5% 1 2.5% 1 4.3% 0 0.0% 1 3.2% 0 0.0% 0 0.0% 0 0.0% 0 0.0% 3 4.8%Income Statement Classification, Margin and EPS Issues 11 0.6% 6 0.4% 1 2.5% 1 4.3% 0 0.0% 2 6.5% 0 0.0% 0 0.0% 0 0.0% 0 0.0% 1 1.6%Cash Flow Statement (FAS 95) Classification Errors 8 0.4% 6 0.4% 2 5.0% 0 0.0% 0 0.0% 0 0.0% 0 0.0% 0 0.0% 0 0.0% 0 0.0% 0 0.0%Gain or Loss Recognition Issues 5 0.3% 5 0.3% 0 0.0% 0 0.0% 0 0.0% 0 0.0% 0 0.0% 0 0.0% 0 0.0% 0 0.0% 0 0.0%Debt and/or Equity Classification Issues 4 0.2% 3 0.2% 0 0.0% 0 0.0% 1 3.3% 0 0.0% 0 0.0% 0 0.0% 0 0.0% 0 0.0% 0 0.0%
Source: AuditAnalytics.com
4 The # columns indicate the number of unique adverse 404 disclosures that identified the issue as causing or contributing to the determination that a material weakness exists. If a registrants filed more than one disclosure the amended disclosure is counted.5 The % column figures are calculated by dividing the figure in the # column by the amount shown the parenthesis in the column title, the total number of unique adverse 404 disclosure filings for the category. (See Footnote 3.)
KPMG(30)
D&T(31)
Audit Firm Breakdown
Material Weakness GAAP Financial Issue
E&Y(40)
PwC(23)
6 The Mgmt Only column provides data for those registrants that only filed a management’s report without a corresponding auditor’s attestation. During SOX Year 5 non-accelerated filers were allowed to provide only a management assessment of the internal controls over financial reporting. Accelerated filers, U.S. and foreign, were required to provide both a management opinion and an auditor attestation their annual reports. Since the Management-Only Reports provided information that is not directly attributable to an auditor, this information is presented in the rows designated as Mgmt-Only. A total of 1577 Management Only opinions were adverse.
AuditAnalytics.com is a premium on-line market intelligence service available from IVES Group Inc., a leading independent research provider focused on the accounting, insurance, regulatory, legal and investment communities. For information, call (508) 476-7007, email [email protected] or visit www.auditanalytics.com.
Regional(63)
1 Research is based on a database download of June 7, 2010. 2 Year 5 is defined as annual reports for fiscal years ending Nov. 15, 2008 to Nov. 14, 2009, inclusive, to be consistent with the SEC requirement that accelerated filers comply with Section 404 in annual reports for fiscal years ending on or after Nov. 15, 2004. The count of Opinions Filed excludes (1) non-tickered funds and trusts within a group if the group of funds is represented in the population by the presence of at least one remaining entity (tickered or non-tickered) and (2) non-tickered subsidiaries if the parent company submitted a comparable filing; thus, this analysis excludes duplicate material weakness filings by non-tickered subsidiaries. 3 For Year 5, a total of 1788 adverse SOX 404 opinions were filed with the SEC. A breakdown of the 1788 adverse opinions, each shown in the parenthesis in the table's column titles, are as follows: 1577 for management only opinions, 40 for Ernst & Young, 23 for PricewaterhouseCoopers, 30 for KPMG, 31 for Deloitte & Touche, 11 for Grant Thornton, 8 for BDO Seidman, 4 for Crowe Horwath LLP, 1 for McGladrey & Pullen, 63 for the remaining Regional & Local Firms.
GT(11)
BDO(8)
Crowe(4)
M&P(1)
SOX 404 Disclosures: Year 5 Issue Update1, 2
GAAP Financial Issues in Adverse DisclosuresYear 5Totals3
(1788)
MgmtOnly6
(1577)
AuditAnalytics.com ‐ 9 Main Street 2F, Sutton, MA 01590 ‐ (508) 476‐7007 ‐ [email protected] Page 17

Audit Analytics®October 2010
Fifth Year 404 Opinions Filed3
Fifth Year 404 Opinionswith Exemptions Acquisitions during the past year Equity Method Investee (Fin 46R) Issues
Ernst & Young 1037 40 92 1% of Firm's Total2 3.9% 8.9% 0.1%% of Category Total3 11.3% 2.2% 22.5% 100.0%PricewaterhouseCoopers 861 23 82 0% of Firm's Total 2.7% 9.5% 0.0%% of Category Total 9.4% 1.3% 20.1% 0.0%KPMG 740 30 49 0% of Firm's Total 4.1% 6.6% 0.0%% of Category Total 8.0% 1.7% 12.0% 0.0%Deloitte & Touche 791 31 82 0% of Firm's Total 3.9% 10.4% 0.0%% of Category Total 8.6% 1.7% 20.1% 0.0%Grant Thornton 202 11 15 0% of Firm's Total 5.4% 7.4% 0%% of Category Total 2.2% 0.6% 3.7% 0%BDO Seidman 128 8 17 0% of Firm's Total 6.3% 13.3% 0%% of Category Total 1.4% 0.4% 4.2% 0%Crowe 56 4 1 0% of Firm's Total 7.1% 1.8% 0%% of Category Total 0.6% 0.2% 0.2% 0%McGladrey & Pullen LLP 37 1 4 0% of Firm's Total 2.7% 10.8% 0%% of Category Total 0.4% 0.1% 1% 0%Regional & Local Firms (175 firms) 4 5 478 63 30 0% of Firm's Total 13.2% 6.3% 0%% of Category Total 5.2% 3.5% 7.4% 0%Management Only Reports 4877 1577 36 0% of Firm's Total 32.3% 0.7% 0%% of Category Total 53.0% 88.2% 8.8% 0%Totals 9207 1788 408 1% Total of 404 Opinions 19.4% 4.4% 0.0%
Year 4 Comparison 9086 534 514 205.9% 5.7% 0.2%
Year 3 Comparison 4533 520 502 1811.5% 11.1% 0.4%
Source: AuditAnalytics.com
5 The rows designated as Management-Only Reports provide data for those registrants that only filed a management’s report without a corresponding auditor’s attestation. During SOX Year 5 non-accelerated filers were allowed to provide only a management assessment of the internal controls over financial reporting. Accelerated filers, U.S. and foreign, were required to provide both a management opinion and an auditor attestation their annual reports. Since the Management-Only Reports provided information that is not directly attributable to an auditor, this information is presented in the rows designated as Management-Only Reports.
AuditAnalytics.com is a premium on-line market intelligence service available from IVES Group Inc. a leading independent research provider focused on the accounting, insurance, regulatory, legal and investment communities. For information, call (508) 476-7007, email [email protected] or visit www.auditanalytics.com.
Year 5 Exemptions to SOX 404Exemptions (compared to the total number of firm's 404 opinions filed) 1
1 Research is based on a database download of June 7, 2010. Year 5 is defined as annual reports for fiscal years ending Nov. 15, 2008 to Nov. 14, 2009, inclusive, to be consistent with the SEC requirement that accelerated filers comply with Section 404 in annual reports for fiscal years ending on or after Nov. 15, 2004. The count of Opinions Filed excludes (1) non-tickered funds and trusts within a group if the group of funds is represented in the population by the presence of at least one remaining entity (tickered or non-tickered) and (2) non-tickered subsidiaries if the parent company submitted a comparable filing; thus, this analysis excludes duplicate material weakness filings by non-tickered subsidiaries. 2 The "% of Firms Total" calculation for these columns equals ([Firm's Total of Column's Category]/[Firm's Overall Total of 404 Opinions with MWs]) x 100; e.g., (92/1037) x 100 = 8.9%.3 The "% of Category Total" calculation for these columns equals ([Firm's Total of Column's Category]/[Column Total of Column's Category]) x 100; e.g., (92/408) x 100 = 22.5%.4 In addition to the Big 4 and national firms, a total of 175 regional and local accounting firms signed section 404 internal control opinions in Year 5.
AuditAnalytics.com ‐ 9 Main Street 2F, Sutton, MA 01590 ‐ (508) 476‐7007 ‐ [email protected] Page 18

Audit Analytics® October 2010
Company CIK Code Ticker Auditor Name Accelerated FilerFiscal
YE2 Status Summary
Wilson Bank Holding Co. 885275 WBHC Maggart & Associates PC Accelerated Filer 12/31 Claimed to file auditor attestation, unable to locate in any SEC filing
Fairpoint Communications Inc. 1062613 Ernst & Young LLP Accelerated Filer 12/31 Accelerated filer, no auditor attestation filed
Heckmann Corp. 1403853 HEK GHP Horwath PC Accelerated Filer 12/31 Accelerated filer, no auditor attestation filed
Medifast Inc. 910329 MED McGladrey & Pullen LLP Accelerated Filer 12/31 Accelerated filer, no auditor attestation filed
YM Biosciences Inc. 1178347 YMI KPMG LLP Accelerated Filer 6/30 Accelerated filer, no auditor attestation filed
Mesa Air Group Inc. 810332 Deloitte & Touche LLP Accelerated Filer 9/30 Subsequent NT-10K filed 12/30/09; Disclosure Due: FYE = 9/30/09 + 75 days = 12/14/09
Volt Information Sciences, Inc. 103872 VOL Ernst & Young LLP Accelerated Filer 11/1 Filed 10-K on 2/2/09 for FYE 11/1/08 (SOX Yr 4), then filed NT-10K on 1/15/10
Company CIK Code Ticker Auditor Name Accelerated FilerFiscal
YE2 Status Summary
American Bancorp Of New Jersey Inc. 1330039 Crowe Horwath LLP Accelerated Filer 9/30 Subsequent Termination filed on 2/8/2010; Disclosure Due: FYE = 9/30/09 + 75 days = 12/14/09
Asyst Technologies Inc. 909326 PricewaterhouseCoopers LLP Accelerated Filer 3/31 Subsequent Termination filed on 3/12/2010; Disclosure Due: FYE = 3/31/09 + 75 days = 6/14/09
Avanex Corp. 1056794 Deloitte & Touche LLP Accelerated Filer 6/30 Subsequent Termination filed on 10/14/2009; Disclosure Due: FYE = 6/30/09 + 75 days = 9/13/09
Brink's Home Security Holdings, Inc. 1436040 KPMG LLP Large Accelerated Filer 12/31 Subsequent Termination filed on 5/25/2010; Disclosure Due: FYE = 12/31/08 + 60 days = 3/1/09
Charlotte Russe Holding, Inc. 1092006 Ernst & Young LLP Accelerated Filer 9/26 Subsequent Termination filed on 12/9/2009; Disclosure Due: FYE = 9/26/09 + 75 days = 12/10/09
Fleetwood Enterprises Inc./DE/ 314132 Ernst & Young LLP Accelerated Filer 4/30 Subsequent Termination filed 8/23/10; Disclosure Due: FYE = 4/27/08 + 75 days = 7/11/08
GDF Suez 1243443 Ernst & Young LLP Large Accelerated Filer 12/31 Subsequent Termination filed on 7/30/2009; Disclosure Due: FYE = 12/31/08 + 60 days = 3/1/09
Media & Entertainment Holdings, Inc. 1337749 Marcum & Kliegman LLP Accelerated Filer 3/31 Subsequent Termination filed on 6/19/2009; Disclosure Due: FYE = 3/31/09 + 75 days = 6/14/09
Source: AuditAnalytics.com
Registrants with Overdue SOX 404 Auditor Attestations for Year 5 (and thus Expected to File an Adverse 404 in the Future)1
1 Research is based on a database download of June 7, 2010. Year 5 is defined as annual reports for fiscal years ending Nov. 15, 2008 to Nov. 14, 2009, inclusive, to be consistent with the SEC requirement that accelerated filers comply with Section 404 in annual reports for fiscal years ending on or after Nov. 15, 2004. The count of Opinions Filed excludes (1) non-tickered funds and trusts within a group if the group of funds is represented in the population by the presence of at least one remaining entity (tickered or non-tickered) and (2) non-tickered subsidiaries if the parent company submitted a comparable filing; thus, this analysis excludes duplicate material weakness filings by non-tickered subsidiaries.2 Large accelerated filers have 60 days to file an annual report, accelerated filers have 75 days, and foreign filers have 6 months.
AuditAnalytics.com is a premium on-line market intelligence service available from IVES Group Inc., a leading independent research provider focused on the accounting, insurance, regulatory, legal and investment communities. For information, call (508) 476-7007, email [email protected] or visit www.auditanalytics.com.
3 Geeknet, Inc. (CIK 1096199) and Charlotte Russe Holding, Inc. (CIK 1092006) did not file a SOX 404 disclosure for Year 5, but were not required to do so because the companies changed their fiscal year end(s) for Aug. 31 to Dec. 31.
Registrants that Failed to File a SOX 404 Auditor Attestations for Year 5 but Subsequently Filed a Termination
1 The following companies filed a termination (Form 15) with the SEC before the their annual reports were due: Endo Pharmaceuticals Solutions Inc. (CIK 854222), hi/fn, inc. (CIK 1065246), Tailwind Financial Inc. (CIK 1368879), Stoneleigh Partners Acquisition Corp. (CIK 1345715), Accenture Ltd. (CIK 1134538), Zila, Inc (CIK 827156), Particle Drilling Technologies, Inc. (CIK 759153), FCStone Group, Inc. (CIK 1297846).
AuditAnalytics.com - 9 Main Street 2F, Sutton, MA 01590 - (508) 476-7007 - [email protected] Page 19

Audit Analytics® October 2010
AuditAnalytics.com ● 9 Main Street, Sutton 2F, MA 01590 ● (508) 476-7007 ● [email protected] Page 20
SOX 404 Year 6 Tables (Partial Year Data)

Audit Analytics®October 2010
SOX 404Year 5
SOX 404Year 4
SOX 404Year 3
SOX 404Year 2
SOX 404Year 1
Ernst & Young 830 12 1 831 13 1.6% 4.0% 4.2% 5.6% 6.0% 12.7%% of Firm's Total3 1.4% 0.1%% of Category Total4 24.7% 14.6% 9.1%PricewaterhouseCoopers 684 17 2 686 19 2.8% 2.7% 6.1% 7.0% 11.0% 16.0%% of Firm's Total 2.5% 0.3%% of Category Total 20.4% 20.7% 18.2%KPMG 599 10 1 600 11 1.8% 4.2% 8.3% 7.3% 10.9% 16.5%% of Firm's Total 1.7% 0.2%% of Category Total 17.8% 12.2% 9.1%Deloitte & Touche 617 16 2 619 18 2.9% 4.0% 9.4% 11.3% 10.5% 17.3%% of Firm's Total 2.6% 0.3%% of Category Total 18.4% 19.5% 18.2%Grant Thornton 154 8 0 154 8 5.2% 5.4% 9.0% 12.1% 12.3% 30.5%% of Firm's Total 5.2% 0.0%% of Category Total 4.6% 9.8% 0.0%BDO Seidman 86 2 2 88 4 4.5% 6.3% 10.5% 12.3% 23.7% 35.3%% of Firm's Total 2.3% 2.3%% of Category Total 2.6% 2.4% 18.2%Crowe Horwath LLP 49 1 0 49 1 2.0% 7.1% 0.0% 3.8% 2.4% 18.2%% of Firm's Total 2.0% 0.0%% of Category Total 1.5% 1.2% 0.0%McGladrey & Pullen LLP 27 1 0 27 1 3.7% 5.3% 4.9% 5.6% 11.5% 15.0%% of Firm's Total 3.7% 0.0%% of Category Total 0.8% 1.2% 0.0%Regional & Local Firms (128)5 310 15 3 313 18 5.8% 13.5% 14.1% 19.0% 14.2% 23.5%% of Firm's Total 4.8% 1.0%% of Category Total 9.2% 18.3% 27.3%
Totals 3356 82 11 3367 93 2.8% 5.0% 7.7% 9.1% 10.3% 16.9%% Total Pending & Filed 404 Opinions 2.4% 0.3% 2.8%
Source: AuditAnalytics.com
Total Overdueand Filed
404 Opinions
Overdue404 Opinions
(likely Adverse)2
6th-Year 404 Adverse
Opinions (filed as of 6-7-10)
6th-Year404
OpinionsFiled
Prior Year ComparisonsPercentage of Adverse 404 Opinions Filed in Prior Years2
SOX 404 Auditor Attestations: Year 6 Update with Year 1, Year 2, Year 3, Year 4, and Year 5 Adverse Opinion Comparison1
Percentage ofOverdue and
Adverse404 opinions
Total Overdueand
Adverse 404Opinions
5 The "% of Category Total" calculation for these columns equals ([Firm's Total of Column's Category]/[Column's Total of Column's Category]x100; e.g. (12/82) x 100 = 14.6%.
AuditAnalytics.com is a premium on-line market intelligence service available from IVES Group Inc., a leading independent research provider focused on the accounting, insurance, regulatory, legal and investment communities. For information, call (508) 476-7007, email [email protected] or visit www.auditanalytics.com.
1 Research is based on a database download on June 7, 2010. Year 6 is defined as annual reports for fiscal years ending Nov. 15, 2009 to Nov. 14, 2010, inclusive, to be consistent with the SEC requirement that accelerated filers comply with Section 404 in annual reports for fiscal years ending on or after Nov. 15, 2004. The count of Opinions Filed excludes (1) non-tickered funds and trusts within a group if the group of funds is represented in the population by the presence of at least one remaining entity (tickered or non-tickered) and (2) non-tickered subsidiaries if the parent company submitted a comparable filing; thus, this analysis excludes duplicate material weakness filings by non-tickered subsidiaries.2 See attached table named "Registrants With Overdue 404 Opinions for Year 6 ," which provides a list of registrants that are expected to file adverse opinions because they are accelerated filers that have not filed a 404 disclosure for Year 6 although such assessment is due. The 7 overdue opinions identified in the Regional & Local Firms row includes 2 companies that have not disclosed a new auditor subsequent to an auditor dismissal or resignation.3 Year 1, Year 2, Year 3 and Year 4 Comparison values are obtained from prior research performed and published by Audit Analytics. 4 The "% of Firms Total" calculation for these columns equals ([Firm's Total of Column's Category]/[Firm's Overall Total of 404 Opinions])x100; e.g., (12/830) x 100 = 1.4%.
6 In addition to the Big 4 and national firms, a total of 128 regional and local accounting firms signed section 404 internal control opinions in Year 6.
AuditAnalytics.com - 9 Main Street 2F, Sutton, MA 01590 - (508) 476-7007 - [email protected] Page 21

Audit Analytics®October 2010
SOX 404Year 5
SOX 404Year 4
SOX 404Year 3
SOX 404Year 2
SOX 404Year 1
Ernst & Young 830 12% of Firm's Total3 1.4% 4.0% 4.2% 5.6% 6.0% 12.7%% of Category Total4 12.9% 1.3%PricewaterhouseCoopers 684 17% of Firm's Total 2.5% 2.7% 6.1% 7.0% 11.0% 16.0%% of Category Total 10.7% 1.8%KPMG 599 10% of Firm's Total 1.7% 4.2% 8.3% 7.3% 10.9% 16.5%% of Category Total 9.3% 1.1%Deloitte & Touche 617 16% of Firm's Total 2.6% 4.0% 9.4% 11.3% 10.5% 17.3%% of Category Total 9.6% 1.7%Grant Thornton 154 8% of Firm's Total 5.2% 5.4% 9.0% 12.1% 12.3% 30.5%% of Category Total 2.4% 0.9%BDO Seidman 86 2% of Firm's Total 2.3% 6.3% 10.5% 12.3% 23.7% 35.3%% of Category Total 1.3% 0.2%Crowe Horwath LLP 49 1% of Firm's Total 2.0% 7.1% 0.0% 3.8% 2.4% 18.2%% of Category Total 0.8% 0.1%McGladrey & Pullen LLP 27 1% of Firm's Total 3.7% 5.3% 4.9% 5.6% 11.5% 15.0%% of Category Total 0.4% 0.1%Regional & Local Firms (128)5 310 15% of Firm's Total 4.8% 13.5% 14.1% 19.0% 14.2% 23.5%% of Category Total 4.8% 1.6%Management Only Opinions6 3066 853% of Firm's Total 27.8% 32.3% 32.0% 32.8% N/A N/A% of Category Total 47.7% 91.2%
Totals 6422 935% Total Pending & Filed 404 Opinions 14.6% 20.9% 20.0% 10.7% 10.3% 16.9%
Source: AuditAnalytics.com
4 The "% of Category Total" calculation for these columns equals ([Firm's Total of Column's Category]/[Column's Total of Column's Category]x100; e.g. (12/935) x 100 = 1.3%.
6th-Year404 Opinions
Filed
6th-Year 404Adverse Opinions(filed as of 6-7-10)
Prior Year ComparisonsPercentage of Adverse 404 Opinions Filed in Prior Years2
5 In addition to the Big 4 and national firms, a total of 128 regional and local accounting firms signed section 404 internal control opinions in Year 6.7 The rows designated as “Management-Only Reports” provide data for those registrants that only filed a Management’s Report without a corresponding Auditor’s Report. In Year 3 of SOX 404, a Large Accelerated Foreign filer was required to provide a management opinion and an auditor attestation report in its annual report for the fiscal year ending on or after July 15, 2006. However, an Accelerated Foreign filer that was not a Large Accelerated Foreign filer was only required, for its first year, to provide a management opinion for this period. In Year 4, non-accelerated filers began submitting management-only reports in their annual reports for the fiscal year ending on or after December 15, 2006. Since the management-only reports provided information that is not directly attributable to an auditor, this information is presented in the rows designated as “Management-Only Reports.”
AuditAnalytics.com is a premium on-line market intelligence service available from IVES Group Inc., a leading independent research provider focused on the accounting, insurance, regulatory, legal and investment communities. For information, call (508) 476-7007, email [email protected] or visit www.auditanalytics.com.
SOX 404 Disclosures including Management Only ReportsYear 6 Update with Year 1, Year 2, Year 3, Year 4, and Year 5 Adverse Opinion Comparison1
1 Research is based on a database download on June 7, 2010. Year 6 is defined as annual reports for fiscal years ending Nov. 15, 2009 to Nov. 14, 2010, inclusive, to be consistent with the SEC requirement that accelerated filers comply with Section 404 in annual reports for fiscal years ending on or after Nov. 15, 2004. The count of Opinions Filed excludes (1) non-tickered funds and trusts within a group if the group of funds is represented in the population by the presence of at least one remaining entity (tickered or non-tickered) and (2) non-tickered subsidiaries if the parent company submitted a comparable filing; thus, this analysis excludes duplicate material weakness filings by non-tickered subsidiaries. 2 Year 1, Year 2, Year 3 and Year 4 Comparison values are obtained from prior research performed and published by Audit Analytics. 3 The "% of Firms Total" calculation for these columns equals ([Firm's Total of Column's Category]/[Firm's Overall Total of 404 Opinions])x100; e.g., (12/830) x 100 = 1.4%.
AuditAnalytics.com - 9 Main Street 2F, Sutton, MA 01590 - (508) 476-7007 - [email protected] Page 22

Audit Analytics®October 2010
Number of1st-Time
Filers (newlyrequired)
Number of404 Adverse
OpinionsFrom 1st-Time
Filers
Number of1st-Time
Filers (newlyrequired)
Number of404 Adverse
OpinionsFrom 1st-Time
Filers
Number of1st-Time
Filers (newlyrequired)
Number of404 Adverse
OpinionsFrom 1st-Time
Filers
Number of1st-Time
Filers (newlyrequired)
Number of404 Adverse
OpinionsFrom 1st-Time
Filers
Number of1st-Time
Filers (newlyrequired)
Number of404 Adverse
OpinionsFrom 1st-Time
Filers
Number of1st-Time
Filers (newlyrequired)
Number of404 Adverse
OpinionsFrom 1st-Time
Filers
Ernst & Young LLP 937 119 103 4 149 7 133 11 62 5 29 1% of Firm's Total4 12.7% 3.9% 4.7% 8.3% 8.1% 3.4%% of Category Total5 25.3% 19.1% 23.8% 8.5% 21.1% 9.2% 20.5% 11.6% 18.9% 13.9% 16.8% 10.0%PricewaterhouseCoopers LLP 860 138 66 7 150 10 106 10 50 1 33 1% of Firm's Total 16.0% 10.6% 6.7% 9.4% 2.0% 3.0%% of Category Total 23.2% 22.1% 15.2% 14.9% 21.2% 13.2% 16.4% 10.5% 15.2% 2.8% 19.1% 10.0%KPMG LLP 763 126 68 8 102 3 99 15 42 2 36 1% of Firm's Total 16.5% 11.8% 2.9% 15.2% 4.8% 2.8%% of Category Total 20.6% 20.2% 15.7% 17.0% 14.4% 3.9% 15.3% 15.8% 12.8% 5.6% 20.8% 10.0%Deloitte & Touche LLP 671 116 76 11 134 12 113 15 55 4 36 3% of Firm's Total 17.3% 14.5% 9.0% 13.3% 7.3% 8.3%% of Category Total 18.1% 18.6% 17.6% 23.4% 19.0% 15.8% 17.4% 15.8% 16.8% 11.1% 20.8% 30.0%Grant Thornton LLP 118 36 18 3 23 4 30 5 17 3 8 0% of Firm's Total 30.5% 16.7% 17.4% 16.7% 17.6% 0.0%% of Category Total 3.2% 5.8% 4.2% 6.4% 3.3% 5.3% 4.6% 5.3% 5.2% 8.3% 4.6% 0.0%BDO Seidman LLP 85 30 21 4 18 4 17 0 10 1 3 1% of Firm's Total 35.3% 19.0% 22.2% 0.0% 10.0% 33.3%% of Category Total 2.3% 4.8% 4.8% 8.5% 2.5% 5.3% 2.6% 0.0% 3.0% 2.8% 1.7% 10.0%Crowe Horwath LLP 33 6 3 0 3 0 6 0 1 0 0 0% of Firm's Total 18.2% 0.0% 0.0% 0.0% 0.0% 0.0%% of Category Total 0.9% 1.0% 0.7% 0.0% 0.4% 0.0% 0.9% 0.0% 0.3% 0.0% 0.0% 0.0%McGladrey & Pullen LLP 20 3 4 0 8 0 6 1 9 0 2 0% of Firm's Total 15.0% 0.0% 0.0% 16.7% 0.0% 0.0%% of Category Total 0.5% 0.5% 0.9% 0.0% 1.1% 0.0% 0.9% 1.1% 2.7% 0.0% 1.2% 0.0%Regional & Local Firms6 213 50 74 10 119 36 138 38 82 20 26 3% of Firm's Total 23.5% 13.5% 30.3% 27.5% 24.4% 11.5%% of Category Total 5.8% 8.0% 17.1% 21.3% 16.9% 47.4% 21.3% 40.0% 25.0% 55.6% 15.0% 30.0%
Totals 3700 624 433 47 706 76 648 95 328 36 173 10 % Total Filed 404 Opinions 16.9% 10.9% 10.8% 14.7% 11.0% 5.8%
Source: AuditAnalytics.com AuditAnalytics.com is a premium on-line market intelligence service available from IVES Group Inc., a leading independent research provider focused on the accounting, insurance, regulatory, legal and investment communities. For information, call (508) 476-7007, email [email protected] or visit www.auditanalytics.com.
1 Research is based on a database download of June 7, 2010. Year 6 is defined as annual reports for fiscal years ending Nov. 15, 2009 to Nov. 14, 2010, inclusive, to be consistent with the SEC requirement that accelerated filers comply with Section 404 in annual reports for fiscal years ending on or after Nov. 15, 2004. The count of Opinions Filed excludes (1) non-tickered funds and trusts within a group if the group of funds is represented in the population by the presence of at least one remaining entity (tickered or non-tickered) and (2) non-tickered subsidiaries if the parent company submitted a comparable filing; thus, this analysis excludes duplicate material weakness filings by non-tickered subsidiaries.
3 The data for Year 6 is based on a partial year and on disclosures filed. This table does not included any registrants identified in the attached table named Registrants With Overdue 404 Opinions For Year 6 , some of which would be first time filers and expected to file adverse opinions since the opinion is late.4 The "% of Firms Total" calculation for these columns equals ([Firm's Total of Column's Category]/[Firm's Overall Total of 404 Opinions with MWs]) (119/937) x 100 = 12.7%.
6 Regional & Local Firms includes all firms, other than the Big 4 and National 4 firms, that signed one or more section 404 internal control opinions (whether for first-time filers or not): 105 in Year1; 133 in Year 2; 168 in Year 3; 153 in Year 4; 175 in Year 5; and 128 in Year 6.
2 The table above does not list the data regarding Management-Only opinions. To view this data incorporated into the table, see table on next page: Review of First-Time Filers by Year (with Management-Only Assessments) .
Year 1 Year 2 Year 6
Review of First-Time Filers by Year (Auditor Reports Only)1, 2
5 The "% of Category Total" calculation for these columns equals ([Firm's Total of Column's Category]/[Column's Total of Column's Category]) x 100; e.g. (119/624) x 100 = 19.1%
Year 3 Year 4 Year 5
AuditAnalytics.com - 9 Main Street 2F, Sutton, MA 01590 - (508) 476-7007 - [email protected] Page 23

Audit Analytics®October 2010
Number of1st-Time
Filers (newlyrequired)
Number of 404 Adverse
OpinionsFrom 1st-Time
Filers
Number of1st-Time
Filers (newlyrequired)
Number of 404 Adverse
OpinionsFrom 1st-Time
Filers
Number of1st-Time
Filers (newlyrequired)
Number of 404 Adverse
OpinionsFrom 1st-Time
Filers
Number of1st-Time
Filers (newlyrequired)
Number of 404 Adverse
OpinionsFrom 1st-Time
Filers
Number of1st-Time
Filers (newlyrequired)
Number of 404 Adverse
OpinionsFrom 1st-Time
Filers
Number of1st-Time
Filers (newlyrequired)
Number of 404 Adverse
OpinionsFrom 1st-Time
FilersErnst & Young LLP 937 119 103 4 145 7 133 11 62 5 29 1% of Firm's Total3 12.7% 3.9% 4.8% 8.3% 8.1% 3.4%% of Category Total4 25.3% 19.1% 23.8% 8.5% 15.2% 4.4% 2.7% 0.7% 1.7% 0.5% 5.1% 0.8%PricewaterhouseCoopers LLP 860 138 66 7 139 8 106 10 50 1 33 1% of Firm's Total 16.0% 10.6% 5.8% 9.4% 2.0% 3.0%% of Category Total 23.2% 22.1% 15.2% 14.9% 14.6% 5.0% 2.1% 0.7% 1.4% 0.1% 5.8% 0.8%KPMG LLP 763 126 68 8 92 2 99 15 42 2 36 1% of Firm's Total 16.5% 11.8% 2.2% 15.2% 4.8% 2.8%% of Category Total 20.6% 20.2% 15.7% 17.0% 9.7% 1.3% 2.0% 1.0% 1.2% 0.2% 6.3% 0.8%Deloitte & Touche LLP 671 116 76 11 134 12 113 15 55 4 36 3% of Firm's Total 17.3% 14.5% 9.0% 13.3% 7.3% 8.3%% of Category Total 18.1% 18.6% 17.6% 23.4% 14.1% 7.5% 2.3% 1.0% 1.5% 0.4% 6.3% 2.4%Grant Thornton LLP 118 36 18 3 20 4 30 5 17 3 8 0% of Firm's Total 30.5% 16.7% 20.0% 16.7% 17.6% 0.0%% of Category Total 3.2% 5.8% 4.2% 6.4% 2.1% 2.5% 0.6% 0.3% 0.5% 0.3% 1.4% 0.0%BDO Seidman LLP 85 30 21 4 16 2 17 0 10 1 3 1% of Firm's Total 35.3% 19.0% 12.5% 0.0% 10.0% 33.3%% of Category Total 2.3% 4.8% 4.8% 8.5% 1.7% 1.3% 0.3% 0.0% 0.3% 0.1% 0.5% 0.8%Crowe Horwath LLP 33 6 3 0 3 0 6 0 1 0 0 0% of Firm's Total 18.2% 0.0% 0.0% 0.0% 0.0% #DIV/0!% of Category Total 0.9% 1.0% 0.7% 0.0% 0.3% 0.0% 0.1% 0.0% 0.0% 0.0% 0.0% 0.0%McGladrey & Pullen LLP 20 3 4 0 7 0 6 1 9 0 2 0% of Firm's Total 15.0% 0.0% 0.0% 16.7% 0.0% 0.0%% of Category Total 0.5% 0.5% 0.9% 0.0% 0.7% 0.0% 0.1% 0.1% 0.2% 0.0% 0.4% 0.0%Regional & Local Firms5 213 50 74 10 106 32 138 38 82 20 26 3% of Firm's Total 23.5% 13.5% 30.2% 27.5% 24.4% 11.5%% of Category Total 5.8% 8.0% 17.1% 21.3% 11.1% 20.0% 2.8% 2.6% 2.3% 1.9% 4.6% 2.4%Management-Only Reports6 N/A N/A N/A N/A 289 93 4349 1386 3279 1008 394 113% of Firm's Total 32.2% 31.9% 30.7% 28.7%% of Category Total 30.4% 58.1% 87.0% 93.6% 90.9% 96.6% 69.5% 91.9%
Totals 3700 624 433 47 951 160 4997 1481 3607 1044 567 123 % Total Filed 404 Opinions 16.9% 10.9% 16.8% 29.6% 28.9% 21.7%
Source: AuditAnalytics.com
Year 2 Year 6
Review of First-Time Filers by Year (with Management-Only Assessments)1,2
4 The "% of Category Total" calculation for these columns equals ([Firm's Total of Column's Category]/[Column's Total of Column's Category]x100; e.g. (119/624) x 100 = 19.1%
AuditAnalytics.com is a premium on-line market intelligence service available from IVES Group Inc., a leading independent research provider focused on the accounting, insurance, regulatory, legal and investment communities. For information, call (508) 476-7007, email [email protected] or visit www.auditanalytics.com.
1 Research is based on a database download of June 7, 2010. Year 6 is defined as annual reports for fiscal years ending Nov. 15, 2009 to Nov. 14, 2010, inclusive, to be consistent with the SEC requirement that accelerated filers comply with Section 404 in annual reports for fiscal years ending on or after Nov. 15, 2004. The count of Opinions Filed excludes (1) non-tickered funds and trusts within a group if the group of funds is represented in the population by the presence of at least one remaining entity (tickered or non-tickered) and (2) non-tickered subsidiaries if the parent company submitted a comparable filing; thus, this analysis excludes duplicate material weakness filings by non-tickered subsidiaries. 2 This table does not included any registrants identified in the attached table named Registrants With Overdue 404 Opinions For Year 5 orYear6 , some of which would be first time filers and expected to file adverse opinions since the opinion is late.3 The "% of Firms Total" calculation for these columns equals ([Firm's Total of Column's Category]/[Firm's Overall Total of 404 Opinions with MWs]) (119/937) x 100 = 12.7%.
5 Regional & Local Firms includes all firms, other than the Big 4 and National 4 firms, that signed one or more section 404 internal control opinions (whether for first-time filers or not): 105 in Year1; 133 in Year 2; 168 in Year 3; 153 in Year 4; 175 in Year 5; and 128 in Year 6.
Year 5Year 3
6 The rows designated as “Management-Only Reports” provide data for those registrants that only filed a Management’s Report without a corresponding Auditor’s Report. In Year 3 of SOX 404, a Large Accelerated Foreign filer was required to provide a management opinion and an auditor attestation report in its annual report for the fiscal year ending on or after July 15, 2006. However, an Accelerated Foreign filer that was not a Large Accelerated Foreign filer was only required, for its first year, to provide a management opinion for this period. In Year 4, non-accelerated filers began submitting management-only reports in their annual reports for the fiscal year ending on or after December 15, 2006. Since the management-only reports provided information that is not directly attributable to an auditor, this information is presented in the rows designated as “Management-Only Reports.”
Year 4Year 1
AuditAnalytics.com ‐ 9 Main Street 2F, Sutton, MA 01590 ‐ (508) 476‐7007 ‐ [email protected] Page 24

Audit Analytics®October 2010
Sixth Year 404 Opinions Filed
Sixth Year 404 Opinions with Material Weaknesses
Personnel Issues
Segregation of Duties
Restatements of Financials
Material YE Adjustments
Internal Audit Issues
IT Processing, Access Issues
Ernst & Young 830 12 5 1 4 8 1 3% of Firm's Total2 1.4% 41.7% 8.3% 33.3% 66.7% 8.3% 25.0%% of Category Total3 24.7% 14.6% 10.9% 11.1% 19.0% 12.9% 16.7% 13.0%PricewaterhouseCoopers 684 17 10 2 7 13 3 7% of Firm's Total 2.5% 58.8% 11.8% 41.2% 76.5% 17.6% 41.2%% of Category Total 20.4% 20.7% 21.7% 22.2% 33.3% 21.0% 50.0% 30.4%KPMG 599 10 6 1 1 10 0 3% of Firm's Total 1.7% 60.0% 10.0% 10.0% 100.0% 0.0% 30.0%% of Category Total 17.8% 12.2% 13.0% 11.1% 4.8% 16.1% 0.0% 13.0%Deloitte & Touche 617 16 11 2 2 12 0 6% of Firm's Total 2.6% 68.8% 12.5% 12.5% 75.0% 0.0% 37.5%% of Category Total 18.4% 19.5% 23.9% 22.2% 9.5% 19.4% 0.0% 26.1%Grant Thornton 154 8 2 0 4 5 1 1% of Firm's Total 5.2% 25.0% 0.0% 50.0% 62.5% 13% 12.5%% of Category Total 4.6% 9.8% 4.3% 0.0% 19.0% 8.1% 17% 4.3%BDO Seidman 86 2 1 1 0 2 0 0% of Firm's Total 2.3% 50.0% 50.0% 0.0% 100.0% 0.0% 0.0%% of Category Total 2.6% 2.4% 2.2% 11.1% 0.0% 3.2% 0.0% 0.0%Crowe 49 1 1 0 0 1 0 0% of Firm's Total 2.0% 100.0% 0.0% 0.0% 100.0% 0.0% 0.0%% of Category Total 1.5% 1.2% 2.2% 0.0% 0.0% 1.6% 0.0% 0.0%McGladrey & Pullen LLP 27 1 1 0 1 1 0 0% of Firm's Total 3.7% 100.0% 0.0% 100.0% 100.0% 0.0% 0.0%% of Category Total 0.8% 1.2% 2.2% 0.0% 4.8% 1.6% 0.0% 0.0%Regional & Local Firms (128 firms) 310 15 9 2 2 10 1 3% of Firm's Total 4.8% 60.0% 13.3% 13.3% 66.7% 6.7% 20.0%% of Category Total 9.2% 18.3% 19.6% 22.2% 9.5% 16.1% 16.7% 13.0%Totals 3356 82 46 9 21 62 6 23% Total of 404 Opinions 2.4% 56.1% 11.0% 25.6% 75.6% 7.3% 28.0%
Year 5 Comparison 4330 211 124 26 52 138 12 584.9% 58.8% 12.3% 24.6% 65.4% 5.7% 27.5%
Year 4 Comparison 4496 347 226 47 77 233 12 907.7% 65.1% 13.5% 22.2% 67.1% 3.5% 25.9%
Year 3 Comparison 4216 382 179 50 126 260 14 749.1% 46.9% 13.1% 33.0% 68.1% 3.7% 19.4%
Year 2 Comparison 3791 390 207 57 177 250 4 7910.3% 53.1% 14.6% 45.4% 64.1% 1.0% 20.3%
Year 1 Comparison 3700 624 304 149 324 335 17 13516.9% 48.7% 23.9% 51.9% 53.7% 2.7% 21.6%
Source: AuditAnalytics.com AuditAnalytics.com is a premium on-line market intelligence service available from IVES Group Inc. a leading independent research provider focused on the accounting, insurance, regulatory, legal and investment communities. For information, call (508) 476-7007, email [email protected] or visit www.auditanalytics.com.
Year 6 SOX 404 Issue Prevalence by Firm and Issue CategoryInternal Control Issues (compared to the firm's total amount of MWs) 1
1 Research is based on a database download on June 7, 2010. Year 6 is defined as annual reports for fiscal years ending Nov. 15, 2009 to Nov. 14, 2010, inclusive, to be consistent with the SEC requirement that accelerated filers comply with Section 404 in annual reports for fiscal years ending on or after Nov. 15, 2004. The count of Opinions Filed excludes (1) non-tickered funds and trusts within a group if the group of funds is represented in the population by the presence of at least one remaining entity (tickered or non-tickered) and (2) non-tickered subsidiaries if the parent company submitted a comparable filing; thus, this analysis excludes duplicate material weakness filings by non-tickered subsidiaries. 2 The "% of Firms Total" calculation for these columns equals ([Firm's Total of Column's Category]/[Firm's Overall Total of 404 Opinions with MWs]) x 100; e.g., (5/12) x 100 = 41.7%. Unlike the issue columns, the MW column's percentage is based on the auditor's total 404 opinions; e.g., 12/830 x 100 = 1.4%.3 The "% of Category Total" calculation for these columns equals ([Firm's Total of Column's Category]/[Column Total of Column's Category]) x 100; e.g., (5/46) x 100 = 10.9%.4 In addition to the Big 4 and national firms, a total of 128 regional and local accounting firms signed section 404 internal control opinions in Year 6.
AuditAnalytics.com ‐ 9 Main Street 2F, Sutton, MA 01590 ‐ (508) 476‐7007 ‐ [email protected] Page 25

Audit Analytics®October 2010
Sixth Year 404 Opinions Filed
Sixth Year 404 Opinions with Material Weaknesses
Personnel Issues
Segregation of Duties
Restatements of Financials
Material YE Adjustments
Internal Audit Issues
IT Processing, Access Issues
Ernst & Young 830 12 5 1 4 8 1 3% of Firm's Total2 1.4% 41.7% 8.3% 33.3% 66.7% 8.3% 25.0%% of Category Total3 27.1% 1.4% 0.7% 0.2% 6.7% 3.5% 2.6% 2.8%PricewaterhouseCoopers 684 17 10 2 7 13 3 7% of Firm's Total 2.5% 58.8% 11.8% 41.2% 76.5% 17.6% 41.2%% of Category Total 22.3% 2.0% 1.5% 0.4% 11.7% 5.7% 7.9% 6.5%KPMG 599 10 6 1 1 10 0 3% of Firm's Total 1.7% 60.0% 10.0% 10.0% 100.0% 0.0% 30.0%% of Category Total 19.5% 1.2% 0.9% 0.2% 1.7% 4.4% 0.0% 2.8%Deloitte & Touche 617 16 11 2 2 12 0 6% of Firm's Total 2.6% 68.8% 12.5% 12.5% 75.0% 0.0% 37.5%% of Category Total 20.1% 1.9% 1.6% 0.4% 3.3% 5.3% 0.0% 5.6%Grant Thornton 154 8 2 0 4 5 1 1% of Firm's Total 5.2% 25.0% 0.0% 50.0% 62.5% 13% 12.5%% of Category Total 5.0% 0.9% 0.3% 0.0% 6.7% 2.2% 3% 0.9%BDO Seidman 86 2 1 1 0 2 0 0% of Firm's Total 2.3% 50.0% 50.0% 0.0% 100.0% 0.0% 0.0%% of Category Total 2.8% 0.2% 0.1% 0.2% 0.0% 0.9% 0.0% 0.0%Crowe 49 1 1 0 0 1 0 0% of Firm's Total 2.0% 100.0% 0.0% 0.0% 100.0% 0.0% 0.0%% of Category Total 1.6% 0.1% 0.1% 0.0% 0.0% 0.4% 0.0% 0.0%McGladrey & Pullen LLP 27 1 1 0 1 1 0 0% of Firm's Total 3.7% 100.0% 0.0% 100.0% 100.0% 0.0% 0.0%% of Category Total 0.9% 0.1% 0.1% 0.0% 1.7% 0.6% 0.0% 0.0%Regional & Local Firms (128 firms) 310 15 9 2 2 10 1 3% of Firm's Total 4.8% 60.0% 13.3% 13.3% 66.7% 6.7% 20.0%% of Category Total 4.8% 1.6% 1.3% 0.4% 3.3% 4.4% 2.6% 2.8%Management Only Reports 5 3066 853 621 515 39 165 32 84% of Mgmt. Only Total 27.8% 72.8% 60.4% 4.6% 19.3% 3.8% 10%% of Category Total 47.7% 91.2% 93.1% 98.3% 65.0% 72.7% 84.2% 79%Totals 6422 935 667 524 60 227 38 107% Total of 404 Opinions 14.6% 71.3% 56.0% 6.4% 24.3% 4.1% 11.4%
Year 5 Comparison 9207 1788 1315 923 132 467 67 25819.4% 73.5% 51.6% 7.4% 26.1% 3.7% 14.4%
Year 4 Comparison 9086 1816 1219 787 130 598 54 34120.0% 67.1% 43.3% 7.2% 32.9% 3.0% 18.8%
Year 3 Comparison 4533 486 246 78 136 290 18 9210.7% 50.6% 16.0% 28.0% 59.7% 3.7% 18.9%
Source: AuditAnalytics.com
5 The rows designated as Management-Only Reports provide data for those registrants that only filed a management’s report without a corresponding auditor’s attestation. During SOX Year 6 non-accelerated filers were allowed to provide only a management assessment of the internal controls over financial reporting. Accelerated filers, U.S. and foreign, were required to provide both a management opinion and an auditor attestation their annual reports. Since the Management-Only Reports provided information that is not directly attributable to an auditor, this information is presented in the rows designated as Management-Only Reports.
AuditAnalytics.com is a premium on-line market intelligence service available from IVES Group Inc. a leading independent research provider focused on the accounting, insurance, regulatory, legal and investment communities. For information, call (508) 476-7007, email [email protected] or visit www.auditanalytics.com.
Year 6 SOX 404 Issue Prevalence by Firm and Issue CategoryInternal Control Issues (compared to the firm's total amount of MWs) 1
1 Research is based on a database download on June 7, 2010. Year 6 is defined as annual reports for fiscal years ending Nov. 15, 2009 to Nov. 14, 2010, inclusive, to be consistent with the SEC requirement that accelerated filers comply with Section 404 in annual reports for fiscal years ending on or after Nov. 15, 2004. The count of Opinions Filed excludes (1) non-tickered funds and trusts within a group if the group of funds is represented in the population by the presence of at least one remaining entity (tickered or non-tickered) and (2) non-tickered subsidiaries if the parent company submitted a comparable filing; thus, this analysis excludes duplicate material weakness filings by non-tickered subsidiaries. 2 The "% of Firms Total" calculation for these columns equals ([Firm's Total of Column's Category]/[Firm's Overall Total of 404 Opinions with MWs]) x 100; e.g., (5/12) x 100 = 41.7%. Unlike the issue columns, the MW column's percentage is based on the auditor's total 404 opinions; e.g., 12/830 x 100 = 1.4%.3 The "% of Category Total" calculation for these columns equals ([Firm's Total of Column's Category]/[Column Total of Column's Category]) x 100; e.g., (5/677) x 100 = 0.7%.4 In addition to the Big 4 and national firms, a total of 128 regional and local accounting firms signed section 404 internal control opinions in Year 6.
AuditAnalytics.com ‐ 9 Main Street 2F, Sutton, MA 01590 ‐ (508) 476‐7007 ‐ [email protected] Page 26

Audit Analytics®October 2010
#4 %5 # % # % # % # % # % # % # % # % # % # %
Accounting Personnel Resources, Competency/Training 667 71.3% 621 72.8% 5 41.7% 10 58.8% 6 60.0% 11 68.8% 2 25.0% 1 50.0% 1 100.0% 1 100.0% 9 60.0%Segregations of Duties/ Design of Controls (Personnel) 524 56.0% 515 60.4% 1 8.3% 2 11.8% 1 10.0% 2 12.5% 0 0.0% 1 50.0% 0 0.0% 0 0.0% 2 13.3%Material and/or Numerous Auditor /YE Adjustments 227 24.3% 165 19.3% 8 66.7% 13 76.5% 10 100.0% 12 75.0% 5 62.5% 2 100.0% 1 100.0% 1 100.0% 10 66.7%Ineffective or Understaffed Audit Committee 211 22.6% 209 24.5% 0 0.0% 0 0.0% 1 10.0% 0 0.0% 0 0.0% 0 0.0% 0 0.0% 0 0.0% 1 6.7%Inadequate Disclosure Controls (Timely, Accuracy, Complete) 190 20.3% 169 19.8% 4 33.3% 6 35.3% 2 20.0% 5 31.3% 0 0.0% 1 50.0% 0 0.0% 0 0.0% 3 20.0%Non-Routine Transactions Control Issues 113 12.1% 95 11.1% 2 16.7% 5 29.4% 1 10.0% 6 37.5% 2 25.0% 0 0.0% 0 0.0% 0 0.0% 2 13.3%Information Technology, Software, Security & Access Issue 107 11.4% 84 9.8% 3 25.0% 7 41.2% 3 30.0% 6 37.5% 1 12.5% 0 0.0% 0 0.0% 0 0.0% 3 20.0%Untimely or Inadequate Account Reconciliations 62 6.6% 47 5.5% 1 8.3% 4 23.5% 1 10.0% 3 18.8% 0 0.0% 1 50.0% 0 0.0% 0 0.0% 5 33.3%Restatement or Nonreliance of Company Filings 60 6.4% 39 4.6% 4 33.3% 7 41.2% 1 10.0% 2 12.5% 4 50.0% 0 0.0% 0 0.0% 1 100.0% 2 13.3%Insufficient or Non-Existent Internal Audit Function 38 4.1% 32 3.8% 1 8.3% 3 17.6% 0 0.0% 0 0.0% 1 12.5% 0 0.0% 0 0.0% 0 0.0% 1 6.7%Senior Management Competency, Tone, Reliability Issues 32 3.4% 29 3.4% 0 0.0% 2 11.8% 0 0.0% 0 0.0% 0 0.0% 0 0.0% 0 0.0% 0 0.0% 1 6.7%Ineffective Regulatory Compliance Issues 24 2.6% 21 2.5% 1 8.3% 1 5.9% 0 0.0% 1 6.3% 0 0.0% 0 0.0% 0 0.0% 0 0.0% 0 0.0%Journal Entry Control Issues 20 2.1% 16 1.9% 0 0.0% 2 11.8% 0 0.0% 1 6.3% 0 0.0% 1 50.0% 0 0.0% 0 0.0% 0 0.0%Ethical or Compliance Issues with Personnel 10 1.1% 5 0.6% 1 8.3% 3 17.6% 1 10.0% 0 0.0% 0 0.0% 0 0.0% 0 0.0% 0 0.0% 0 0.0%Restatement of Previous 404 Disclosures 5 0.5% 0 0.0% 2 16.7% 0 0.0% 0 0.0% 1 6.3% 1 12.5% 0 0.0% 0 0.0% 0 0.0% 1 6.7%Scope (Disclaimer of Opinion) or Other Limitations 2 0.2% 2 0.2% 0 0.0% 0 0.0% 0 0.0% 0 0.0% 0 0.0% 0 0.0% 0 0.0% 0 0.0% 0 0.0%
Source: AuditAnalytics.com
SOX 404 Disclosures: Year 6 Issue Update1, 2
Internal Control Issues in Adverse DisclosuresYear 6Totals3
(935)
MgmtOnly6
(853)
Audit Firm Breakdown
GT(8)
AuditAnalytics.com is a premium on-line market intelligence service available from IVES Group Inc., a leading independent research provider focused on the accounting, insurance, regulatory, legal and investment communities. For information, call (508) 476-7007, email [email protected] or visit www.auditanalytics.com.
1 Research is based on a database download of June 7, 2010 and thus provides data for a partial Year 6.2 Year 6 is defined as annual reports for fiscal years ending Nov. 15, 2009 to Nov. 14, 2010, inclusive, to be consistent with the SEC requirement that accelerated filers comply with Section 404 in annual reports for fiscal years ending on or after Nov. 15, 2004. The count of Opinions Filed excludes (1) non-tickered funds and trusts within a group if the group of funds is represented in the population by the presence of at least one remaining entity (tickered or non-tickered) and (2) non-tickered subsidiaries if the parent company submitted a comparable filing; thus, this analysis excludes duplicate material weakness filings by non-tickered subsidiaries. 3 As of June 7, 2010, a total of 935 adverse SOX 404 opinions were filed with the SEC. A breakdown of the 935 adverse opinions, each shown in the parenthesis in the table's column titles, are as follows: 853 for management only opinions, 12 for Ernst & Young, 17 for PricewaterhouseCoopers, 10 for KPMG, 16 for Deloitte & Touche, 8 for Grant Thornton, 2 for BDO Seidman, 1 for Crowe Horwath LLP, 1 for McGladrey & Pullen, 15 for the remaining Regional & Local Firms. (See table SOX 404 Disclosures: Year 3 Status Update with Year 1 and Year 2 Adverse Opinion Comparison.)4 The # columns indicate the number of unique adverse 404 disclosures that identified the issue as causing or contributing to the determination that a material weakness exists. If a registrant filed more than one disclosure the amended disclosure is counted.
Regional(15)
Material Weakness Internal Control Issue
E&Y(12)
PwC(17)
6 The Mgmt Only column provides data for those registrants that only filed a management’s report without a corresponding auditor’s attestation. During SOX Year 6 non-accelerated filers were allowed to provide only a management assessment of the internal controls over financial reporting. Accelerated filers, U.S. and foreign, were required to provide both a management opinion and an auditor attestation their annual reports. Since the Management-Only Reports provided information that is not directly attributable to an auditor, this information is presented in the rows designated as Mgmt-Only. A total of 853 Management Only opinions were adverse.
5 The % column figures are calculated by dividing the figure in the # column by the amount shown the parenthesis in the column title, the total number of unique adverse 404 disclosure filings for the category. (See Footnote 3.)
BDO(2)
Crowe(1)
M&P(1)
KPMG(10)
D&T(16)
AuditAnalytics.com ‐ 9 Main Street 2F, Sutton, MA 01590 ‐ (508) 476‐7007 ‐ [email protected] Page 27

Audit Analytics®October 2010
Sixth-Year404
OpinionsFiled
Third Year 404Opinions with
Material Weaknesses
Cash FlowStatement
(FAS 95) Error
Debt, Warrants& Equity (BCF)Security Issues
Depreciation /Amortization
Inventory /Vendor Cost
of Sales
Leases orContingencies
Fixed /Intangible
Assets
Revenue Recognition
Tax AccrualsDeferrals etc.
ConsolidationFin (46) Issues
Ernst & Young 830 12 2 3 0 1 1 1 2 2 0% of Firm's Total2 1.4% 16.7% 25.0% 0.0% 8.3% 8.3% 8.3% 16.7% 16.7% 0.0%% of Category Total3 24.7% 14.6% 100.0% 30.0% 0.0% 11.1% 20.0% 9.1% 10.0% 9.1% 0.0%PricewaterhouseCoopers 684 17 0 1 2 2 3 3 7 3 3% of Firm's Total 2.5% 0.0% 5.9% 11.8% 11.8% 17.6% 17.6% 41.2% 17.6% 17.6%% of Category Total 20.4% 20.7% 0.0% 10.0% 100.0% 22.2% 60.0% 27.3% 35.0% 13.6% 75.0%KPMG 599 10 0 0 0 0 0 2 2 5 0% of Firm's Total 1.7% 0.0% 0.0% 0.0% 0.0% 0.0% 20.0% 20.0% 50.0% 0.0%% of Category Total 17.8% 12.2% 0.0% 0.0% 0.0% 0.0% 0.0% 18.2% 10.0% 22.7% 0.0%Deloitte & Touche 617 16 0 3 0 5 0 3 5 5 1% of Firm's Total 2.6% 0.0% 18.8% 0.0% 31.3% 0.0% 18.8% 31.3% 31.3% 6.3%% of Category Total 18.4% 19.5% 0.0% 30.0% 0.0% 55.6% 0.0% 27.3% 25.0% 22.7% 25.0%Grant Thornton 154 8 0 0 0 1 0 0 4 2 0% of Firm's Total 5.2% 0.0% 0.0% 0.0% 12.5% 0.0% 0.0% 50% 25% 0.0%% of Category Total 4.6% 9.8% 0.0% 0.0% 0.0% 11.1% 0.0% 0.0% 20% 9% 0.0%BDO Seidman 86 2 0 1 0 0 0 0 0 0 0% of Firm's Total 2.3% 0.0% 50.0% 0.0% 0.0% 0.0% 0.0% 0.0% 0.0% 0.0%% of Category Total 2.6% 2.4% 0.0% 10.0% 0.0% 0.0% 0.0% 0.0% 0.0% 0.0% 0.0%Crowe 49 1 0 0 0 0 0 0 0 0 0% of Firm's Total 2.0% 0.0% 0.0% 0.0% 0.0% 0.0% 0.0% 0.0% 0.0% 0.0%% of Category Total 1.5% 1.2% 0.0% 0.0% 0.0% 0.0% 0.0% 0.0% 0.0% 0.0% 0.0%McGladrey & Pullen LLP 27 1 0 0 0 0 0 0 0 1 0% of Firm's Total 3.7% 0.0% 0.0% 0.0% 0.0% 0.0% 0.0% 0.0% 100.0% 0.0%% of Category Total 0.8% 1.2% 0.0% 0.0% 0.0% 0.0% 0.0% 0.0% 0.0% 4.5% 0.0%Regional & Local Firms (128 firms) 310 15 0 2 0 0 1 2 0 4 0% of Firm's Total 4.8% 0.0% 13.3% 0.0% 0.0% 6.7% 13.3% 0.0% 26.7% 0.0%% of Category Total 9.2% 18.3% 0.0% 20.0% 0.0% 0.0% 20.0% 18.2% 0.0% 18.2% 0.0%Totals 3356 82 2 10 2 9 5 11 20 22 4% Total of 404 Opinions 2.4% 2.4% 12.2% 2.4% 11.0% 6.1% 13.4% 24.4% 26.8% 4.9%
Year 5 Comparison 4330 211 2 12 8 38 8 30 50 52 114.9% 0.9% 5.7% 3.8% 18.0% 3.8% 14.2% 23.7% 24.6% 5.2%
Year 4 Comparison 4496 347 11 15 17 77 31 58 90 104 337.7% 3.2% 4.3% 4.9% 22.2% 8.9% 16.7% 25.9% 30.0% 9.5%
Year 3 Comparison 4216 382 16 22 25 72 30 79 106 124 319.1% 4.2% 5.8% 6.5% 18.8% 7.9% 20.7% 27.7% 32.5% 8.1%
Year 2 Comparison 3791 390 28 19 26 102 45 70 119 133 3710.3% 7.2% 4.9% 6.7% 26.2% 11.5% 17.9% 30.5% 34.1% 9.5%
Year 1 Comparison 3700 624 44 45 78 172 106 120 198 198 5816.9% 7.1% 7.2% 12.5% 27.6% 17.0% 19.2% 31.7% 31.7% 9.3%
Source: AuditAnalytics.com AuditAnalytics.com is a premium on-line market intelligence service available from IVES Group Inc. a leading independent research provider focused on the accounting, insurance, regulatory, legal and investment communities. For information, call (508) 476-7007, email [email protected] or visit www.auditanalytics.com.
Year 6 SOX 404 Issue Prevalence by Firm and Issue CategoryGAAP / Accounting Areas of Failure (compared to the firm's total amount of MWs) 1
1 Research is based on a database download on June 7, 2010. Year 6 is defined as annual reports for fiscal years ending Nov. 15, 2009 to Nov. 14, 2010, inclusive, to be consistent with the SEC requirement that accelerated filers comply with Section 404 in annual reports for fiscal years ending on or after Nov. 15, 2004. The count of Opinions Filed excludes (1) non-tickered funds and trusts within a group if the group of funds is represented in the population by the presence of at least one remaining entity (tickered or non-tickered) and (2) non-tickered subsidiaries if the parent company submitted a comparable filing; thus, this analysis excludes duplicate material weakness filings by non-tickered subsidiaries. 2 The "% of Firms Total" calculation for the issues columns equals ([Firm's Total of Column's Category]/[Firm's Overall Total of 404 Opinions with MWs]) x 100; e.g., E&Y Cash Flow is (2/12) x 100 = 16.7%. Unlike the issue columns, the Material Weakness column's percentage is based on the auditor's total 404 opinions; e.g., 12/830 x 100 = 1.4%.3 The "% of Category Total" calculation for these columns equals ([Firm's Total of Column's Category]/[Column Total of Column's Category]) x 100; e.g., (2/2) x 100 = 100%.4 In addition to the Big 4 and national firms, a total of 128 regional and local accounting firms signed section 404 internal control opinions in Year 6.
AuditAnalytics.com ‐ 9 Main Street 2F, Sutton, MA 01590 ‐ (508) 476‐7007 ‐ [email protected] Page 28

Audit Analytics®October 2010
Sixth-Year404
OpinionsFiled
Third Year 404Opinions with
Material Weaknesses
Cash FlowStatement
(FAS 95) Error
Debt, Warrants& Equity (BCF)Security Issues
Depreciation /Amortization
Inventory /Vendor Cost
of Sales
Leases orContingencies
Fixed /Intangible
Assets
Revenue Recognition
Tax AccrualsDeferrals etc.
ConsolidationFin (46) Issues
Ernst & Young 830 12 2 3 0 1 1 1 2 2 0% of Firm's Total2 1.4% 16.7% 25.0% 0.0% 8.3% 8.3% 8.3% 16.7% 16.7% 0.0%% of Category Total3 27.1% 1.4% 50.0% 4.4% 0.0% 3.3% 6.3% 3.2% 3.4% 3.7% 0.0%PricewaterhouseCoopers 684 17 0 1 2 2 3 3 7 3 3% of Firm's Total 2.5% 0.0% 5.9% 11.8% 11.8% 17.6% 17.6% 41.2% 17.6% 17.6%% of Category Total 22.3% 2.0% 0.0% 1.5% 50.0% 6.7% 18.8% 9.7% 12.1% 5.6% 25.0%KPMG 599 10 0 0 0 0 0 2 2 5 0% of Firm's Total 1.7% 0.0% 0.0% 0.0% 0.0% 0.0% 20.0% 20.0% 50.0% 0.0%% of Category Total 19.5% 1.2% 0.0% 0.0% 0.0% 0.0% 0.0% 6.5% 3.4% 9.3% 0.0%Deloitte & Touche 617 16 0 3 0 5 0 3 5 5 1% of Firm's Total 2.6% 0.0% 18.8% 0.0% 31.3% 0.0% 18.8% 31.3% 31.3% 6.3%% of Category Total 20.1% 1.9% 0.0% 4.4% 0.0% 16.7% 0.0% 9.7% 8.6% 9.3% 8.3%Grant Thornton 154 8 0 0 0 1 0 0 4 2 0% of Firm's Total 5.2% 0.0% 0.0% 0.0% 12.5% 0.0% 0.0% 50% 25% 0.0%% of Category Total 5.0% 0.9% 0.0% 0.0% 0.0% 3.3% 0.0% 0.0% 7% 4% 0.0%BDO Seidman 86 2 0 1 0 0 0 0 0 0 0% of Firm's Total 2.3% 0.0% 50.0% 0.0% 0.0% 0.0% 0.0% 0.0% 0.0% 0.0%% of Category Total 2.8% 0.2% 0.0% 1.5% 0.0% 0.0% 0.0% 0.0% 0.0% 0.0% 0.0%Crowe 49 1 0 0 0 0 0 0 0 0 0% of Firm's Total 2.0% 0.0% 0.0% 0.0% 0.0% 0.0% 0.0% 0.0% 0.0% 0.0%% of Category Total 1.6% 0.1% 0.0% 0.0% 0.0% 0.0% 0.0% 0.0% 0.0% 0.0% 0.0%McGladrey & Pullen LLP 27 1 0 0 0 0 0 0 0 1 0% of Firm's Total 3.7% 0.0% 0.0% 0.0% 0.0% 0.0% 0.0% 0.0% 100.0% 0.0%% of Category Total 0.9% 0.1% 0.0% 0.0% 0.0% 0.0% 0.0% 0.0% 0.0% 1.9% 0.0%Regional & Local Firms (128 firms) 310 15 0 2 0 0 1 2 0 4 0% of Firm's Total 4.8% 0.0% 13.3% 0.0% 0.0% 6.7% 13.3% 0.0% 26.7% 0.0%% of Category Total 4.8% 1.6% 0.0% 2.9% 0.0% 0.0% 6.3% 6.5% 0.0% 7.4% 0.0%Management-Only Reports5 3066 853 2 58 2 21 11 20 38 32 8% of Mgmt. Only Total 27.8% 0.2% 6.8% 0.2% 2.5% 1.3% 2.3% 4.5% 4% 1%% of Category Total 47.7% 91.2% 50.0% 85.3% 50.0% 70.0% 68.8% 64.5% 65.5% 59% 67%Totals 6422 935 4 68 4 30 16 31 58 54 12
% Total of 404 Opinions 14.6% 0.4% 7.3% 0.4% 3.2% 1.7% 3.3% 6.2% 5.8% 1.3%
Year 5 Comparison 9207 1788 8 111 18 93 16 78 127 114 3219.4% 0.4% 6.2% 1.0% 5.2% 0.9% 4.4% 7.1% 6.4% 1.8%
Year 4 Comparison 9086 1816 19 93 34 172 49 116 193 179 5920.0% 1.0% 5.1% 1.9% 9.5% 2.7% 6.4% 10.6% 9.9% 3.2%
Year 3 Comparison 4533 486 16 29 28 83 33 85 117 132 4010.7% 3.3% 6.0% 5.8% 17.1% 6.8% 17.5% 24.1% 27.2% 8.2%
Source: AuditAnalytics.com
5 The rows designated as Management-Only Reports provide data for those registrants that only filed a management’s report without a corresponding auditor’s attestation. During SOX Year 6 non-accelerated filers were allowed to provide only a management assessment of the internal controls over financial reporting. Accelerated filers, U.S. and foreign, were required to provide both a management opinion and an auditor attestation their annual reports. Since the Management-Only Reports provided information that is not directly attributable to an auditor, this information is presented in the rows designated as Management-Only Reports.
AuditAnalytics.com is a premium on-line market intelligence service available from IVES Group Inc. a leading independent research provider focused on the accounting, insurance, regulatory, legal and investment communities. For information, call (508) 476-7007, email [email protected] or visit www.auditanalytics.com.
Year 6 SOX 404 Issue Prevalence by Firm and Issue CategoryGAAP / Accounting Areas of Failure (compared to the firm's total amount of MWs) 1
1 Research is based on a database download on June 7, 2010. Year 6 is defined as annual reports for fiscal years ending Nov. 15, 2009 to Nov. 14, 2010, inclusive, to be consistent with the SEC requirement that accelerated filers comply with Section 404 in annual reports for fiscal years ending on or after Nov. 15, 2004. The count of Opinions Filed excludes (1) non-tickered funds and trusts within a group if the group of funds is represented in the population by the presence of at least one remaining entity (tickered or non-tickered) and (2) non-tickered subsidiaries if the parent company submitted a comparable filing; thus, this analysis excludes duplicate material weakness filings by non-tickered subsidiaries. 2 The "% of Firms Total" calculation for the issues columns equals ([Firm's Total of Column's Category]/[Firm's Overall Total of 404 Opinions with MWs]) x 100; e.g., E&Y Cash Flow is (2/12) x 100 = 16.7%. Unlike the issue columns, the Material Weakness column's percentage is based on the auditor's total 404 opinions; e.g., 12/830 x 100 = 1.4%. 3 The "% of Category Total" calculation for these columns equals ([Firm's Total of Column's Category]/[Column Total of Column's Category]) x 100; e.g., (2/4) x 100 = 50%. 4 In addition to the Big 4 and national firms, a total of 128 regional and local accounting firms signed section 404 internal control opinions in Year 6.
AuditAnalytics.com ‐ 9 Main Street 2F, Sutton, MA 01590 ‐ (508) 476‐7007 ‐ [email protected] Page 29

Audit Analytics®October 2010
#4 %5 # % # % # % # % # % # % # % # % # % # %
Unspecified/Unidentified/Inapplicable FASB/GAAP Issues 585 62.6% 572 67.1% 2 16.7% 1 5.9% 2 20.0% 4 25.0% 0 0.0% 0 0.0% 0 0.0% 0 0.0% 4 26.7%Accounts/Loans Receivable, Investments & Cash Issues 85 9.1% 62 7.3% 3 25.0% 5 29.4% 4 40.0% 1 6.3% 1 12.5% 1 50.0% 1 100.0% 0 0.0% 7 46.7%Debt,Quasi-Debt, Warrants & Equity ( BCF) Security Issues 68 7.3% 58 6.8% 3 25.0% 1 5.9% 0 0.0% 3 18.8% 0 0.0% 1 50.0% 0 0.0% 0 0.0% 2 13.3%Revenue Recognition Issues 58 6.2% 38 4.5% 2 16.7% 7 41.2% 2 20.0% 5 31.3% 4 50.0% 0 0.0% 0 0.0% 0 0.0% 0 0.0%Tax Expense/Benefit/Deferral/Other (FAS 109) Issues 54 5.8% 32 3.8% 2 16.7% 3 17.6% 5 50.0% 5 31.3% 2 25.0% 0 0.0% 0 0.0% 1 100.0% 4 26.7%Liabilities, Payables, Reserves and Accrual Estimate Failures 51 5.5% 39 4.6% 2 16.7% 5 29.4% 0 0.0% 2 12.5% 1 12.5% 0 0.0% 0 0.0% 0 0.0% 2 13.3%Foreign, Related Party, Affiliated and/or Subsidiary Entity Issues 48 5.1% 36 4.2% 3 25.0% 2 11.8% 2 20.0% 3 18.8% 0 0.0% 0 0.0% 0 0.0% 0 0.0% 2 13.3%Expense Recording (Payroll, SG&A) Issues 36 3.9% 24 2.8% 2 16.7% 4 23.5% 0 0.0% 1 6.3% 2 25.0% 1 50.0% 0 0.0% 0 0.0% 2 13.3%Deferred, Stock-Based or Executive Compensation Issues 32 3.4% 25 2.9% 1 8.3% 3 17.6% 0 0.0% 3 18.8% 0 0.0% 0 0.0% 0 0.0% 0 0.0% 0 0.0%PPE, Intangible or Fixed Asset (Value/Diminution) Issues 31 3.3% 20 2.3% 1 8.3% 3 17.6% 2 20.0% 3 18.8% 0 0.0% 0 0.0% 0 0.0% 0 0.0% 2 13.3%Inventory, Vendor and Cost of Sales Issues 30 3.2% 21 2.5% 1 8.3% 2 11.8% 0 0.0% 5 31.3% 1 12.5% 0 0.0% 0 0.0% 0 0.0% 0 0.0%Lease, FAS 5, Legal, Contingency & Commitments Issues 16 1.7% 11 1.3% 1 8.3% 3 17.6% 0 0.0% 0 0.0% 0 0.0% 0 0.0% 0 0.0% 0 0.0% 1 6.7%Acquisition, Merger, Disposal or Reorganization Issues 14 1.5% 10 1.2% 1 8.3% 2 11.8% 0 0.0% 1 6.3% 0 0.0% 0 0.0% 0 0.0% 0 0.0% 0 0.0%Consolidation, (Fin46r/Off BS) & Foreign Currency Translation 12 1.3% 8 0.9% 0 0.0% 3 17.6% 0 0.0% 1 6.3% 0 0.0% 0 0.0% 0 0.0% 0 0.0% 0 0.0%Income Statement Classification, Margin and EPS Issues 7 0.7% 3 0.4% 1 8.3% 1 5.9% 0 0.0% 0 0.0% 2 25.0% 0 0.0% 0 0.0% 0 0.0% 0 0.0%Financial Derivatives/Hedging (FAS 133) Accounting Issues 5 0.5% 4 0.5% 0 0.0% 0 0.0% 0 0.0% 0 0.0% 0 0.0% 1 50.0% 0 0.0% 0 0.0% 0 0.0%Intercompany/Investment with Subsidiary/Affiliate Entity Issues 5 0.5% 2 0.2% 1 8.3% 1 5.9% 0 0.0% 0 0.0% 0 0.0% 0 0.0% 0 0.0% 0 0.0% 1 6.7%Depreciation, Depletion or Amortization Issues 4 0.4% 2 0.2% 0 0.0% 2 11.8% 0 0.0% 0 0.0% 0 0.0% 0 0.0% 0 0.0% 0 0.0% 0 0.0%Debt and/or Equity Classification Issues 4 0.4% 3 0.4% 0 0.0% 0 0.0% 0 0.0% 1 6.3% 0 0.0% 0 0.0% 0 0.0% 0 0.0% 0 0.0%Cash Flow Statement (FAS 95) Classification Errors 4 0.4% 2 0.2% 2 16.7% 0 0.0% 0 0.0% 0 0.0% 0 0.0% 0 0.0% 0 0.0% 0 0.0% 0 0.0%Gain or Loss Recognition Issues 4 0.4% 4 0.5% 0 0.0% 0 0.0% 0 0.0% 0 0.0% 0 0.0% 0 0.0% 0 0.0% 0 0.0% 0 0.0%Capitalization of Expenditures Issues 3 0.3% 0 0.0% 0 0.0% 0 0.0% 0 0.0% 2 12.5% 0 0.0% 0 0.0% 0 0.0% 0 0.0% 1 6.7%
Source: AuditAnalytics.com
SOX 404 Disclosures: Year 6 Issue Update1, 2
GAAP Financial Issues in Adverse DisclosuresYear 6Totals3
(935)
MgmtOnly6
(853)
Audit Firm Breakdown
Material Weakness GAAP Financial Issue
E&Y(12)
PwC(17)
KPMG(10)
D&T(16)
GT(8)
BDO(2)
Crowe(1)
M&P(1)
Regional(15)
AuditAnalytics.com is a premium on-line market intelligence service available from IVES Group Inc., a leading independent research provider focused on the accounting, insurance, regulatory, legal and investment communities. For information, call (508) 476-7007, email [email protected] or visit www.auditanalytics.com.
1 Research is based on a database download of June 7, 2010 and thus provides data for a partial Year 6.2 Year 6 is defined as annual reports for fiscal years ending Nov. 15, 2009 to Nov. 14, 2010, inclusive, to be consistent with the SEC requirement that accelerated filers comply with Section 404 in annual reports for fiscal years ending on or after Nov. 15, 2004. The count of Opinions Filed excludes (1) non-tickered funds and trusts within a group if the group of funds is represented in the population by the presence of at least one remaining entity (tickered or non-tickered) and (2) non-tickered subsidiaries if the parent company submitted a comparable filing; thus, this analysis excludes duplicate material weakness filings by non-tickered subsidiaries. 3 As of June 7, 2010, a total of 935 adverse SOX 404 opinions were filed with the SEC. A breakdown of the 935 adverse opinions, each shown in the parenthesis in the table's column titles, are as follows: 853 for management only opinions, 12 for Ernst & Young, 17 for PricewaterhouseCoopers, 10 for KPMG, 16 for Deloitte & Touche, 8 for Grant Thornton, 2 for BDO Seidman, 1 for Crowe Horwath LLP, 1 for McGladrey & Pullen, 15 for the remaining Regional & Local Firms. (See table SOX 404 Disclosures: Year 3 Status Update with Year 1 and Year 2 Adverse Opinion Comparison .) 4 The # columns indicate the number of unique adverse 404 disclosures that identified the issue as causing or contributing to the determination that a material weakness exists. If a registrants filed more than one disclosure the amended disclosure is counted.5 The % column figures are calculated by dividing the figure in the # column by the amount shown the parenthesis in the column title, the total number of unique adverse 404 disclosure filings for the category. (See Footnote 3.) 6 The Mgmt Only column provides data for those registrants that only filed a management’s report without a corresponding auditor’s attestation. During SOX Year 6 non-accelerated filers were allowed to provide only a management assessment of the internal controls over financial reporting. Accelerated filers, U.S. and foreign, were required to provide both a management opinion and an auditor attestation their annual reports. Since the Management-Only Reports provided information that is not directly attributable to an auditor, this information is presented in the rows designated as Mgmt-Only. A total of 853 Management Only opinions were adverse.
AuditAnalytics.com ‐ 9 Main Street 2F, Sutton, MA 01590 ‐ (508) 476‐7007 ‐ [email protected] Page 30
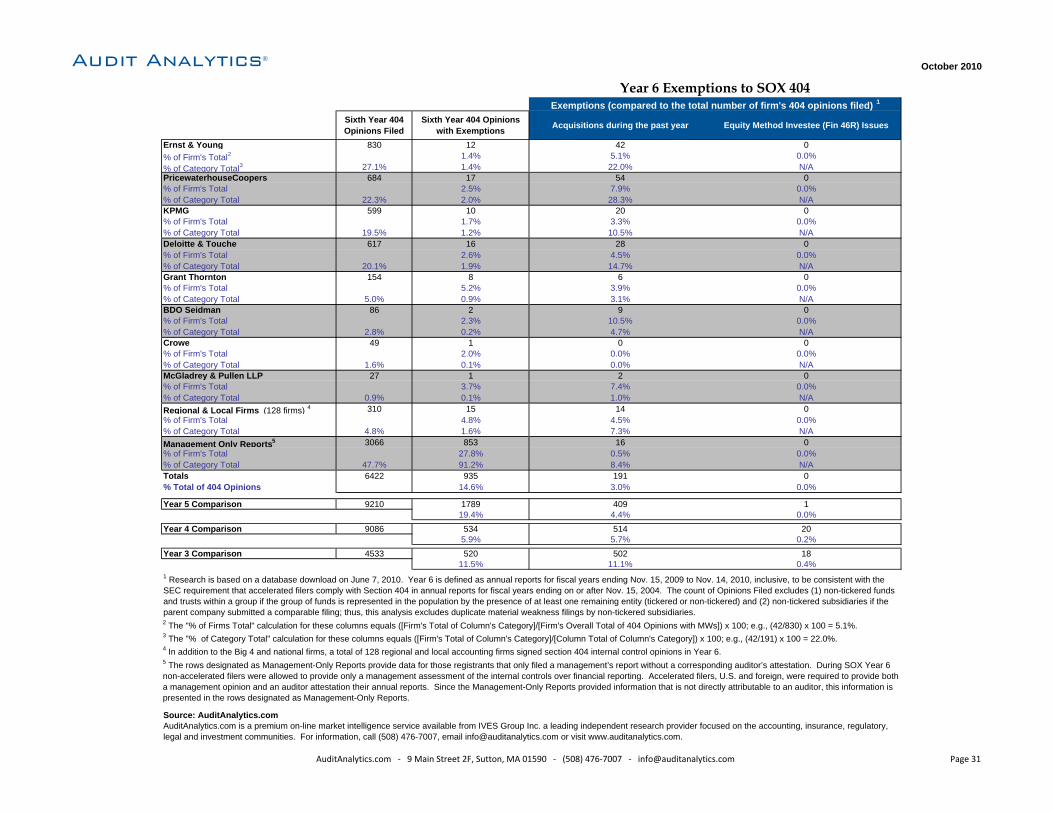
Audit Analytics®October 2010
Sixth Year 404 Opinions Filed
Sixth Year 404 Opinionswith Exemptions Acquisitions during the past year Equity Method Investee (Fin 46R) Issues
Ernst & Young 830 12 42 0% of Firm's Total2 1.4% 5.1% 0.0%% of Category Total3 27.1% 1.4% 22.0% N/APricewaterhouseCoopers 684 17 54 0% of Firm's Total 2.5% 7.9% 0.0%% of Category Total 22.3% 2.0% 28.3% N/AKPMG 599 10 20 0% of Firm's Total 1.7% 3.3% 0.0%% of Category Total 19.5% 1.2% 10.5% N/ADeloitte & Touche 617 16 28 0% of Firm's Total 2.6% 4.5% 0.0%% of Category Total 20.1% 1.9% 14.7% N/AGrant Thornton 154 8 6 0% of Firm's Total 5.2% 3.9% 0.0%% of Category Total 5.0% 0.9% 3.1% N/ABDO Seidman 86 2 9 0% of Firm's Total 2.3% 10.5% 0.0%% of Category Total 2.8% 0.2% 4.7% N/ACrowe 49 1 0 0% of Firm's Total 2.0% 0.0% 0.0%% of Category Total 1.6% 0.1% 0.0% N/AMcGladrey & Pullen LLP 27 1 2 0% of Firm's Total 3.7% 7.4% 0.0%% of Category Total 0.9% 0.1% 1.0% N/ARegional & Local Firms (128 firms) 4 310 15 14 0% of Firm's Total 4.8% 4.5% 0.0%% of Category Total 4.8% 1.6% 7.3% N/AManagement Only Reports5 3066 853 16 0% of Firm's Total 27.8% 0.5% 0.0%% of Category Total 47.7% 91.2% 8.4% N/ATotals 6422 935 191 0% Total of 404 Opinions 14.6% 3.0% 0.0%
Year 5 Comparison 9210 1789 409 119.4% 4.4% 0.0%
Year 4 Comparison 9086 534 514 205.9% 5.7% 0.2%
Year 3 Comparison 4533 520 502 1811.5% 11.1% 0.4%
Source: AuditAnalytics.com
5 The rows designated as Management-Only Reports provide data for those registrants that only filed a management’s report without a corresponding auditor’s attestation. During SOX Year 6 non-accelerated filers were allowed to provide only a management assessment of the internal controls over financial reporting. Accelerated filers, U.S. and foreign, were required to provide both a management opinion and an auditor attestation their annual reports. Since the Management-Only Reports provided information that is not directly attributable to an auditor, this information is presented in the rows designated as Management-Only Reports.
AuditAnalytics.com is a premium on-line market intelligence service available from IVES Group Inc. a leading independent research provider focused on the accounting, insurance, regulatory, legal and investment communities. For information, call (508) 476-7007, email [email protected] or visit www.auditanalytics.com.
Year 6 Exemptions to SOX 404Exemptions (compared to the total number of firm's 404 opinions filed) 1
1 Research is based on a database download on June 7, 2010. Year 6 is defined as annual reports for fiscal years ending Nov. 15, 2009 to Nov. 14, 2010, inclusive, to be consistent with the SEC requirement that accelerated filers comply with Section 404 in annual reports for fiscal years ending on or after Nov. 15, 2004. The count of Opinions Filed excludes (1) non-tickered funds and trusts within a group if the group of funds is represented in the population by the presence of at least one remaining entity (tickered or non-tickered) and (2) non-tickered subsidiaries if the parent company submitted a comparable filing; thus, this analysis excludes duplicate material weakness filings by non-tickered subsidiaries. 2 The "% of Firms Total" calculation for these columns equals ([Firm's Total of Column's Category]/[Firm's Overall Total of 404 Opinions with MWs]) x 100; e.g., (42/830) x 100 = 5.1%.3 The "% of Category Total" calculation for these columns equals ([Firm's Total of Column's Category]/[Column Total of Column's Category]) x 100; e.g., (42/191) x 100 = 22.0%.4 In addition to the Big 4 and national firms, a total of 128 regional and local accounting firms signed section 404 internal control opinions in Year 6.
AuditAnalytics.com ‐ 9 Main Street 2F, Sutton, MA 01590 ‐ (508) 476‐7007 ‐ [email protected] Page 31

Audit Analytics®October 2010
Company CIK Code Ticker Auditor Name Accelerated FilerFiscal YE2 Status Summary
Circuit City Stores Inc. 104599 KPMG LLP Large Accelerated Filer 2/28Filed last 10‐K on 4/28/08 for FYE 2/29/08. Filed NT 10‐Q on 1/9/09 but no period report since. Filed Ch. 11 Bankruptcy 11/10/08. Filed an 8‐K on 6/7/10.
Kv Pharmaceutical Co. /De/ 57055 KV.A BDO USA LLP Large Accelerated Filer 3/31 Filed last 10‐K on 3/25/10 for FYE 3/31/09.
Ebhi Holdings, Inc. 1345968 BDO Seidman LLP Accelerated Filer 1/2 Filed NT 10‐K on 3/19/09 and Ch. 11 Bankruptcy on 6/16/09.
Champion Enterprises Inc. 814068 Ernst & Young LLP Accelerated Filer 1/3 Filed last 10‐K on 2/19/09 for FYE 1/3/09. Filed Ch. 11 bankruptcy on 11/5/09.
Canal Corp. 19731 PricewaterhouseCoopers LLP Accelerated Filer 1/3Filed last 10‐K on 3/6/08 for FYE 12/30/07. Filed Ch. 11 bankruptcy on 12/29/08. Filedan 8‐K on 5/28/10.
Bombay Co Inc. 96287 PricewaterhouseCoopers LLP Accelerated Filer 1/28Filed last 10‐K/A on 6/4/07 for FYE 2/3/07. Filed Ch. 11 bankruptcy on 9/20/07. Filed an 8‐K on 9/22/08.
Gottschalks Inc. 790414 BDO Seidman LLP Accelerated Filer 1/31Filed last 10‐K on 4/10/08 for FYE 2/2/08. Filed Ch. 11 bankruptcy on 1/14/09. Filed an 8‐K on 9/17/10.
Tsic, Inc. 811696 Deloitte & Touche LLP Accelerated Filer 1/31Filed Ch. 11 bankruptcy on 2/20/08. Filed last 10‐K/A on 6/4/07 for FYE 2/3/07. Filed an 8‐K on 9/22/08.
Comverse Technology Inc./Ny 803014 Deloitte & Touche LLP Accelerated Filer 1/31 NT 10‐K filed 4/2/10 for FYE 1/31/10. Filed an 8‐K on 9/29/10.
Augme Technologies, Inc. 1137204 AUGT MaloneBailey, LLP Accelerated Filer 2/28On page 30 of 10‐K filed on 6/1/10 (for FYE 2/28/10), Augme claims an exemption due to acquisition of another business.
Fightersoft Multimedia Corp. 1343557 Moore & Associates Chartered Accelerated Filer 2/28Gone dark; no termination or notification of bankruptcy filed. Filed last NT 10‐K on 5/28/08 for FYE 2/28/08. Designated itself an accelerated filer in 10‐Q filed on 10/15/08 (for quarterly period ended 8/30/08). Filed an 8‐K on 3/31/10.
Source: AuditAnalytics.com
Registrants with Overdue 404 Auditor Attestations for Year 6(and thus Expected to File an Adverse 404 in the Future)1
AuditAnalytics.com is a premium on-line market intelligence service available from IVES Group Inc., a leading independent research provider focused on the accounting, insurance, regulatory, legal and investment communities. For information, call (508) 476-7007, email [email protected] or visit www.auditanalytics.com
1 Research is based on a database download of June 7, 2010. Year 6 is defined as annual reports for fiscal years ending Nov. 15, 2009 to Nov. 14, 2010, inclusive, to be consistent with the SEC requirement that accelerated filers comply with Section 404 in annual reports for fiscal years ending on or after Nov. 15, 2004. The count of Opinions Filed excludes (1) non-tickered funds and trusts within a group if the group of funds is represented in the population by the presence of at least one remaining entity (tickered or non-tickered) and (2) non-tickered subsidiaries if the parent company submitted a comparable filing; thus, this analysis excludes duplicate material weakness filings by non-tickered subsidiaries.2 Research is based on a database download of June 7, 2010. U.S. Large Accelerated filers have 60 days to file an annual report and U.S. Accelerated filers have 75 days. As a result, for this analysis the FYE Deadline for Large Accelerated filers (60 days) is on or before March 24th and the FYE deadline Accelerated Filers (75 days) is on or before April 8th. Foreign filers are not listed because that are given 6 months to file an annual report.
AuditAnalytics.com ‐ 9 Main Street 2F, Sutton, MA 01590 ‐ (508) 476‐7007 ‐ [email protected] Page 32
Audit Analytics® October 2010
AuditAnalytics.com - 9 Main Street 2F, Sutton, MA 01590 - (508)476-7007 - [email protected] 33
Internal Control Weaknesses (SOX 404) Definitions for the Internal Controls over Financial Reporting Issues Accounting documentation, policy and/or procedures
Represents material weaknesses deriving from internal control systems that do not contain adequate documentation, policies or other means of justifying account balances. These issues may also include failures to ensure that accounts are recorded based on GAAP, SAB, FASB and/or the appropriate accounting methodology are followed. They may also include failures in policies or procedures designed to gather the correct information on a timely basis or problems with the y/e close process. It also includes failures to employ proper procedures over journal entries, non-routine transactions and other common procedural failures.
Accounting personnel resources, competency/training
Consists of problems with accounting personnel resources, competency, training, experience and/or adequacy in any way. To meet these criteria, such an indication would have to be contained in the filing or in the remediation plan.
Ethical or compliance issues with personnel
Consists of problems with personnel in the areas of compliance with policies, maintenance of ethical standards, fraud and intentional acts that lead to (or could lead to) misstated account balances or financial reports.
Inadequate disclosure controls (timely, accuracy, complete)
Represents material weaknesses related to the adequacy of information flow that should result in a required disclosure. Ineffective or understaffed audit committee
Represents circumstances where an audit committee may not have the personnel, expert, experience and/or resources to perform their duties to the extent required by Sarbanes Oxley or their charter.
Ineffective regulatory compliance issues
Consists of internal control deficiencies associated with failures to meet regulatory requirements other than taxes. Information technology, software, security & access issue
Deficiencies in this category include deficient program controls, software programs/implementation, segregation of duties associated with personnel having access to computer accounting or financial reporting records and related problems with oversight/access to electronic data/programs.
Insufficient or non-existent internal audit function
Indicates circumstances where a company has stated that its internal audit function was insufficient in identifying and/or advising in the correction of internal control deficiencies. It cannot also identify circumstances where a registrant has identified a failure to have an internal audit department at all, as a ICFR failure.
Journal entry control issues
This category is checked whenever the description given by the audit firm or company refers to deficiencies or issues associated with the journal entry process. This category is not checked when there is a journal entry error that originates from control deficiencies in other areas.
Management/Board/Audit Committee investigation(s)
Consists of internal control reports indicating that an internal investigation is underway relative to accounting and/or financial reporting matters. This item is demographic in nature.
Material and/or numerous auditor /YE adjustments
Represents circumstances where one of the explanations for a material weakness opinion was the number and/or size of year end adjustments including those proposed by the auditor. These adjustments also consider footnote and related errors that need to be corrected by the auditor at year-end. Too many, or auditor initiated year-end adjustments are considered prima facie evidence of a potential material weakness in financial reporting.
Non-routine transaction control issues
This category is checked whenever a registrant specifically describes one of their control deficiencies as emanating from non-routine types of transactions. These could include acquisitions, asset sales, establishment of new systems and other.
Remediation of material weakness identified
Refers to disclosures that indicate that material weakness or internal control weaknesses have been remediated.

Audit Analytics® October 2010
AuditAnalytics.com - 9 Main Street 2F, Sutton, MA 01590 - (508)476-7007 - [email protected] 34
Internal Control Weaknesses (SOX 404) Definitions for the Internal Controls over Financial Reporting Issues (Continued) Restatement or nonreliance of company filings
Consists of material weakness opinions deriving from problems that led to restatements. Restatements are often evidentiary of primi-facie internal control deficiencies.
Restatement of previous 404 disclosures
Represents circumstances where a company has had to restate its 404 opinion because of some event (most likely a restatement of financials) that has occurred subsequently to filing.
SAB 108 adjustments noted
This item is checked when the ICFR disclosure identifies that a SAB 108, as opposed to a financial restatement, process is used to correct the beginning retained earnings balances associated with previous period accounting errors.
Scope (resource, time, inclination) limitations
A material weakness opinion may derive from assertions from the company or auditor that the company had not completed its own review of internal controls and therefore these controls could not be audited. These limitations could come about for any number of reasons.
SEC or other regulatory investigations and/or inquiries
An SEC or related investigation into the company affairs is often evidentiary of accounting or financial reporting issues that point to internal control deficiencies. This category seeks to identify circumstances where registrants have indicated in their 404 assertion that an SEC investigation or inquiry is underway.
Segregations of duties/ design of controls (personnel)
This category covers internal control deficiencies associated with the design and use of personnel within an organization. It primarily deals with segregation of duty issues, such as clerks having access to both the cash receipts and the bank reconciliation. It may also deal with more sophisticated design of control issues relating to executives having the ability to change customer records, etc.
Senior management competency, tone, reliability issues
This category has been established to identify circumstances where internal control weaknesses are attributed directly to potentially improper or negligent conduct of the current or former senior management of the company. This does not necessarily mean that the assertion is correct, just that such language exists in the filing.
Untimely or inadequate account reconciliations
In reviewing internal control assertions or opinions it is often the case that inadequate account reconciliations are identified as the reason for material or numerous adjustments. This category seeks to specifically identify such circumstances.
Audit Analytics® October 2010
AuditAnalytics.com - 9 Main Street 2F, Sutton, MA 01590 - (508)476-7007 - [email protected] 35
Internal Control Weaknesses (SOX 404) Definitions for the GAAP/Accounting Areas of Failure Accounts/loans receivable, investments & cash issues
Consists of internal control deficiencies in approach, theory or calculations with respect to cash, cash equivalents, accounts receivable, short term investments, certain long term investments, notes, loans collectible, allowance for uncollectables, notes receivables and/or related reserves.
Acquisition, merger, disposal or reorganization issues
Consists primarily of internal control deficiencies in approach, theory or calculation associated with the merger, acquisitions, reorganization or disposal issues for registrants. The internal control issues in this area can vary from incorrect application of GAAP to calculate the proper intangible assets levels associated with acquisitions to failure to record the proper reserves for disposal or reorganization. Accounting rules in this area are considered complex and non-routine. This category is often attributed to failures by personnel in understanding certain issues associated with acquisitions or disposals.
Balance sheet classification of asset issues
Consists of internal control deficiencies in approach, theory or calculation associated with how assets were classified on the balance sheet. Primarily this category is made up of misclassified assets as short term versus long term or whether certain assets were properly considered cash equivalents versus short-term investments.
Capitalization of expenditures issues
Consists of internal control deficiencies in approach, theory or calculation associated with the capitalization of expenditures. These can include expenditures capitalized for inventory, construction, intangible asset, R&D, software or product development and other purposes. Whether capitalizing expenditures in inventory, leaseholds, buildings or product/software development, the proper methodology can be difficult and demanding on an internal control system.
Cash flow statement classification errors
Consists of internal control deficiencies in approach, theory or calculation that manifested themselves in cash flow statements that are not consistent with GAAP. These misclassifications can affect cash flow from operations, financing, investment, non-cash and other areas. Difficulties with respect to internal control systems over proper disclosure associated with cash flow statements typically occur with non-routine transactions.
Consolidation, (Fin46r/Off BS) & foreign currency translation issues
Consists of internal control deficiencies in approach, theory or calculation with respect to the consolidation of subsidiaries including variable interest entities and off balance sheet arrangements. This can include mistakes in how joint ventures, off balance sheet entities were recorded or disclosed. This category also identifies issues associated with foreign currency translations, minority interests, eliminations or other issues associated with consolidations.
Debt and/or equity classification issues
Consists mainly of internal control deficiencies in approach, theory or calculation associated with the proper classification of debt instruments as short term or long term. This area can also refer to reclassifications between equity and debt accounts or within equity accounts.
Debt, quasi-debt securities or equity accting issues
Consists of internal control deficiencies in approach, theory or calculation associated with the recording of financing/bank/securities debt or equity section accounts. Control issues in this area often arise because of incorrect recording of beneficial conversion features in debt/quasi debt or equity securities. They can also occur with the calculation of premiums/discounts on debt securities or the proper valuation of certain non-traded equity securities.
Deferred, stock-based or executive comp issues
Consists of internal control deficiencies in approach, theory or calculation associated with the recording of deferred or executive compensation. The majority of these errors are associated with the valuation of options or similar derivative securities and their recording on the books. Sometimes this issue arises when personnel are paid with shares or options instead of cash. This category also includes other forms of internal control deficiencies associated with executive compensation arrangements.
Depreciation, depletion or amortization issues
Consists of internal control deficiencies in approach, theory or calculation associated with depreciation of assets, amortization of assets and/or amortization of debt premiums or discounts. This category can also include deficiencies associated with depletion of reserves or amortization of other fixed assets.

Audit Analytics® October 2010
AuditAnalytics.com - 9 Main Street 2F, Sutton, MA 01590 - (508)476-7007 - [email protected] 36
Internal Control Weaknesses (SOX 404) Definitions for the GAAP/Accounting Areas of Failure (Continued) Expense recording (payroll, SG&A) issues
Consists of internal control deficiencies in approach, theory or calculation associated with the expensing of assets or understatement of liabilities. These issues can arise from any number areas including failure to record certain expenses, write off certain assets or acknowledge certain liabilities. This category is used primarily for miscellaneous occurrences of expensible items including payroll and SG&A issues.
Fin Stmt/ footnote/ US GAAP, segment disclosure issues
This represents failures or inadequacies in internal controls related to review of preparation of financial statements, footnotes and/or related additions to financial statements. This can also include issues with conversion of foreign company financial statements to US SEC/FASB Standards. It also includes internal control deficiencies associated with segment recording and related annual report disclosures.
Financial derivatives/hedging (FAS 133) accounting issues
Consists of internal control deficiencies in approach, theory or calculation of derivative instruments. These can include the valuation of financial instruments such as hedges on currency swings, interest rate swaps, purchases of foreign goods, guarantees and other. Often this category is checked when registrants fail to follow the FAS 133 rules for proper documentation or application of its principles.
Foreign, related party, affiliated and/or subsid issues Consists primarily of internal control deficiencies associated with disclosures about related, alliance, affiliated and/or subsidiary entities. This can also refer to accounting issues detected at foreign subsidiaries. This box is checked mostly in conjunction with other categories to indicate that an issue has been raised in association with a failure at a subsidiary (often foreign sub) that has been deemed to be material to the overall financial condition of the company.
Gain or loss recognition issues
Consists of internal control deficiencies in approach, theory or calculation with respect to the recording of gains or losses from the sales of assets, interests, entities or liabilities. Mistakes in these areas often result from problems with calculating the proper basis for disposing of an asset or the proper amount to record as sales revenue. Generally, this category relates to issues associated with non-routine or significant transactions.
Income statement classification, margin and EPS issues
Consists primarily of internal control deficiencies associated with a registrants disclosure of financial/operational ratios or margins and earnings per share calculation issues. Also included are circumstances where income statement items are misclassified between say gross margin and selling general and administrative expenses. This may also deal with issues associated with exceptional items.
Intercompany/Investment w/ sub/affil issues
Consists primarily of internal control deficiencies in approach, theory or calculation related to intercompany or affiliate balances, investment valuations or transactions. It is often the case that problems arise when intercompany balances are not reconciled and accounted for on a timely basis.
Inventory, vendor and cost of sales issues Consists of internal control deficiencies in approach, theory or calculation associated with transactions affecting inventory, vendor relationships (including rebates) and/or cost of sales. The proper recording of inventory can be a complex area of accounting requiring many estimates. The issues can range from simple valuation calculations to estimates of completion on construction projects.
Lease, FAS 5, legal, contingency & commit issues
Consists primarily of internal control deficiencies associated with FAS 5 type contingencies and commitments. This description also deals with issues associated with the disclosure or accrual of legal exposures by registrants and issues associated leases and lease commitments. One significant area of impact has been internal control deficiencies associated with determining the proper accounting or determination of operating vs. capitalized leases.
Lease, leasehold & FAS 13 (98) (subcategory) issues
The category is checked when a lease, leasehold or related issue has been identified with internal or financial reporting controls. This represents a subcategory of the Lease, FAS 5 category.

Audit Analytics® October 2010
AuditAnalytics.com - 9 Main Street 2F, Sutton, MA 01590 - (508)476-7007 - [email protected] 37
Internal Control Weaknesses (SOX 404) Definitions for the GAAP/Accounting Areas of Failure (Continued) Liabilities, payables, reserves and accrual est failures
Consists of internal control deficiencies associated with the accrual or identification of liabilities on the balance sheet. These could range from failures to record pension obligations, to problems with establishing the correct amount of payables, accruals or other reserves. From an internal control perspective, issues in this area most often occur because of cut-off failures in recording liabilities and matching them to related revenue or inventory accounts.
PPE , intangible or fixed asset (value/diminution) issues
Consists of internal control deficiencies in calculation, approach or theory that have taken place in the recording of PPE, fixed, intangible, goodwill or long term assets. It also applies to contra liabilities that are required to be valued or assessed for diminution. Generally issues associated with long term development projects and goodwill associated with acquisitions are included in this category.
Revenue recognition issues
Consists of internal control deficiencies in approach, understanding or calculation associated with the recognition of revenue. Many of these restatements originate from a failure to properly interpret sales contracts for hidden rebates, returns, barter or resale arrangements. They can also occur because of misapplied credits or debits associated with customer accounts. This account is generally checked without regard to other accounts they impact, such as accounts receivable.
Tax expense/benefit/deferral/other (FAS 109) issues
Consists of internal control deficiencies in approach, understanding or calculation associated with various forms of tax obligations or benefits. Many of these restatements relate to foreign tax, local taxes or tax planning issues. Some deal with failures associated with sales taxes, etc. The accounts impacted can include expense, deferral or allowances. With the change in goodwill accounting, a number of issues have arisen with the failure of companies to change the level of permanent differences in their FAS 109 calculations.
Unspecified/unidentified/inapplicable FASB/GAAP issues
This flag is identified when the 404 or 302 disclosures are lacking in sufficient information to identify what accounts or areas of financial reporting are being impacted by disclosure controls or internal control deficiencies. It may also indicate that a GAAP/FASB effect is not applicable. This flag may not be checked in circumstances where a recent section 404 report or restatement can provide the missing information.
Other - Defective or unreliable acctg/reporting records
Consists of disclosures by a registrant that a scope limitation exists with respect to the company's ability to rely on accounting or internal control records. Typically no restatement is announced because the amount, if any, cannot be determined.
Internal Control Weaknesses (404) Definitions for Exemptions Acquisitions during the past year
One of the allowable exemptions for not issuing an opinion on internal controls is that a company has made a recent acquisition and they have not had sufficient time to review, update and/or integrate the new acquisition into their IC systems.
Equity Method investee (Fin 46R) issues
Because there have been significant rule changes in this area of FASB and issues exist with respect to control/influence over equity method investees, an exemption has been granted relative to certain circumstances associated with equity method investees.

Audit Analytics® October 2010
AuditAnalytics.com - 9 Main Street 2F, Sutton, MA 01590 - (508)476-7007 - [email protected] 38
Audit Analytics – Audit, Regulatory and Disclosure Intelligence _________________________________________________________________________________ Audit Analytics is the premier public company market intelligence service providing independent research to the investment, accounting, insurance, legal, regulatory and academic communities. Audit Analytics provides detailed intelligence research on over 20,000 public companies and 1,500 accounting firms. Our data includes detailed categorizations of issues and is considered by many professionals to be the best primary data source for tracking and analysis of the following public company disclosures:
Sarbanes-Oxley Disclosures - Track Section 404 internal control disclosures and Section 302 disclosure controls.
Auditor Information - Know who is auditing whom, their fees, auditor changes, auditor opinions and more.
Restatements - Identify company restatements by type, auditor and peer group. Analyze by date, period and specific issue.
Litigation & Legal Disclosures - Search all federal litigation by auditor, company and litigation type. Know who is representing whom.
Corporate Governance - Track director & officer changes, audit committee members, C-level executives and their biographies.
SEC Comment Letters - An extensive collection of SEC staff reviews and company responses expertly categorized according to a taxomony of 1,500 citations.
Detailed reports are easily created by issue, company, industry, auditor, fees and more and are downloadable into Excel. Daily notifications via email are available for auditor changes, restatements and director & officer changes. Access to Audit Analytics is available via on-line subscription, enterprise data-feeds, daily email notifications and custom research reports.
Contact For more information on subscriptions, data feeds, custom reports or to schedule an on-line demonstration, please contact:
Audit Analytics Sales (508) 476-7007