sovereign yields and the risk-taking channel of currency
TRANSCRIPT

Sovereign yields and the risk-taking channelof currency appreciation�
Boris HofmannBank for International Settlements
Ilhyock ShimBank for International Settlements
Hyun Song ShinBank for International Settlements
October 19, 2016
Abstract
Currency appreciation against the US dollar is associated with the compression ofemerging market economy (EME) sovereign yields. We �nd that this yield compressionis due to reduced risk premiums rather than the forward premium. We �nd no empiricalassociation between currency appreciation and sovereign spreads when we use the trade-weighted e¤ective exchange rate that is unrelated to the US dollar.
JEL codes: G12, G15, G23.
Keywords: bond spread, capital �ow, credit risk, emerging market, exchange rate.
�We thank Enrique Alberola, Yavuz Arslan, Fernando Avalos, Ryan Banerjee, Claudio Borio, ValentinaBruno, Stjin Claessens, Jon Clark, Erik Feyen, Andrew Filardo, Ben Friedman, Zhiguo He, Peter Hoer-dahl, Sebnem Kalemli-Ozcan, Jonathan Kearns, Enisse Kharroubi, Emanuel Kohlscheen, Aytek Malkhozov,Aaron Mehrotra, Madhusudan Mohanty, Robert McCauley, Patrick McGuire, Jonathan Ostry, Luiz Pereirada Silva, Lucrezia Reichlin, Phurichai Rungcharoenkitkul, Andreas Schrimpf, Chang Shu, Suresh Sundare-san, Vladyslav Sushko, Lars Svensson, Bruno Tissot, Philip Turner, Christian Upper, James Yetman andFeng Zhu for comments, and Jimmy Shek and Agne Subelyte for their excellent research assistance. Wethank participants at presentations at the Central Bank of the Republic of Turkey, the Bank of Japan andthe Bank for International Settlements, and at the Federal Reserve Board conference on �Monetary policyimplementation and transmission in the post-crisis period�. The views presented here are solely those of theauthors and do not necessarily represent those of the Bank for International Settlements.

1 Introduction
What is the macroeconomic impact of currency appreciation? Is it expansionary or con-
tractionary? The answer from traditional arguments in the spirit of the Mundell-Fleming
model (Mundell (1963), Fleming (1962)) is that currency appreciation is contractionary. An
appreciation is associated with a decline in net exports and a contraction in output, other
things being equal.
The other side of the argument appeals to the empirical regularity that currency appre-
ciation often goes hand in hand with rapid credit growth on the back of more permissive
�nancial conditions (Kaminsky and Reinhart (1999), Borio and Lowe (2002), Reinhart and
Reinhart (2009)). The boom may be accompanied by the build-up of �nancial vulnerabilities.
The combination of a rapid increase in leverage and a sharp appreciation of the currency
commonly emerges as the most reliable indicator of �nancial vulnerability and of subsequent
crises (see, for instance, Gourinchas and Obstfeld (2012)).
Our paper contributes to this debate by exploring the connection between exchange rates
and sovereign bond yields for emerging market economies (EMEs). Given the tight links
between sovereign yields and domestic lending rates to corporates and households, our ex-
ploration sheds light on the relationship between exchange rates and domestic �nancial con-
ditions more broadly.
In this paper we lay out the evidence on the relationship between currency appreciation
and EME bond market conditions, including both quantity based (bond fund �ows) and
price based (bond yield spreads). Currency appreciation, de�ned as appreciation of an EME
currency against the US dollar, is associated with higher portfolio in�ows into EME bond
funds and a compression of the EME�s sovereign spreads.
Delving deeper, we �nd that these �uctuations in spreads are due to shifts in the risk
premium, rather than in the forward currency premium. We examine the local currency risk
spread measure due to Du and Schreger (2015), de�ned as the spread of the yield on EME
local currency government bonds achievable by a dollar-based investor over the equivalent
US Treasury security. The de�nition takes account of hedging of currency risk through cross-
currency swaps. We �nd strong evidence that currency appreciation against the US dollar is
associated with a compression of the Du-Schreger spread. In contrast, the forward currency
premium is not signi�cantly a¤ected. These results suggest that the local currency sovereign
spread is driven primarily by shifts in the risk premium and point to the importance of risk
taking and portfolio adjustments in generating our �ndings.
Crucially, the relevant exchange rate for our �nding is the bilateral exchange rate against
the US dollar rather than the trade-weighted e¤ective exchange rate. Our results go away
1
when we consider the orthogonalised component of the e¤ective exchange rate that is un-
related to the US dollar; we �nd no evidence that a currency appreciation unrelated to the
bilateral US dollar exchange rate is associated with loosening of �nancial conditions. Indeed,
we actually �nd the opposite result for some measures of �nancial conditions. In contrast,
the results hold up when we consider the orthogonalised component of the bilateral US dol-
lar exchange rate (ie the movements of the US dollar exchange rate that is unrelated to
movements in the e¤ective exchange rate).
We posit that the importance of the bilateral exchange rate against the US dollar stems
from the role of the dollar as the international funding currency that denominates debt
contracts globally. McCauley, McGuire and Sushko (2015) estimate that the outstanding
US dollar-denominated debt of non-banks outside the United States stood at $9.8 trillion as
of June 2015. Of this total, $3.3 trillion was owed by non-banks in EMEs, which is more
than twice the pre-crisis total. For EME borrowers who have borrowed dollars but hold
local currency assets, the valuation mismatch comes from naked currency mismatches. For
EME commodity producers, the valuation mismatch comes from the empirical regularity
that commodity prices tend to be weak when the dollar is strong (see Akram (2009) and
Aastveit, Bjornland and Thorsrud (2015)).
We interpret our results as re�ecting the risk-taking channel of currency appreciation,
introduced by Bruno and Shin (2015a, 2015b) in the context of cross-border bank capital
�ows, which operates through the supply of dollar credit. In the working paper version of
this paper (Hofmann, Shim and Shin (2016)), we develop a simple model of the risk-taking
channel for cross-border bond �ows to EMEs. The core mechanism is the presence of currency
mismatch, which leads to a weaker dollar �attering the balance sheet of dollar borrowers
whose liabilities fall relative to assets. From the standpoint of creditors, the stronger credit
position of the borrowers creates spare capacity for credit extension even with a �xed exposure
limit. Credit supply to the economy in dollars expands as a consequence, expanding the set
of real projects that are �nanced and raising economic activity, and improving the �scal
position of the government.
In a period when the US dollar is weak, the risk-taking channel operates across the set
of EMEs, and a diversi�ed investor in EME bonds sees reductions in tail risks, allowing
greater portfolio positions for any given exposure limit stemming from an economic capital
constraint. As a consequence, a weaker dollar goes hand in hand with reduced tail risks
and increased portfolio �ows into EME bonds. Note that this mechanism holds whether the
bonds are denominated in domestic currency or in foreign currency.
However, when the dollar strengthens, these same relationships go into reverse and con-
2

spire to tighten �nancial conditions. Borrowers�balance sheets look weaker. Their credit-
worthiness declines. Creditors�capacity to extend credit declines for any exposure limit, and
credit supply tightens, serving to dampen economic activity and the government �scal posi-
tion. This increases tail risks for a diversi�ed bond investor, which is then met by reductions
in overall portfolio positions on EMEs. In this way, a stronger dollar coincides with portfolio
out�ows from EME sovereign bonds.
These considerations shed light on why it is the bilateral exchange rate against the US
dollar that drives our result on sovereign yields. This is because the risk-taking channel has to
do with leverage and risk taking, in contrast to the net exports channel which revolves around
trade and the e¤ective exchange rate. The wedge between the bilateral US dollar exchange
rate and the trade-weighted e¤ective exchange rate provides a window for a reconciliation of
the risk-taking channel with the net exports channel, and permits an empirical investigation
that disentangles the two channels.
Related literature
On the macroeconomic impact of currency depreciation, Krugman (2014) appeals to the net
exports channel in the Mundell-Fleming model to argue that a �sudden stop�is expansion-
ary under �oating exchange rates. In contrast, Blanchard et al. (2015) acknowledge that
the empirical evidence points to the contrary, and modify the Mundell-Fleming model by
introducing two classes of assets. In their extended model, currency appreciation may be
expansionary. Bussière, Lopez and Tille (2015) analyse the impact of currency appreciations
on growth for a large sample of advance economies and EMEs, using the propensity score
matching method to disentangle the direction of causality from appreciation to growth, and
�nd that currency appreciation associated with a capital surge is signi�cant in the case of
emerging countries.
Our paper is related to the literature on monetary spillovers. Rey (2013, 2014) argues that
monetary policy shocks from advanced economies (AEs) spill over into �nancial conditions
elsewhere even in a regime of �oating exchange rates. Plantin and Shin (2016) examine a
global game with �oating exchange rates where the unique equilibrium exhibits two regimes
in monetary conditions. In one, currency appreciation goes hand in hand with lower domestic
interest rates, capital in�ows and higher credit growth. However, when the economy crosses
the equilibrium threshold, currency depreciation goes hand in hand with higher domestic
interest rates, capital out�ows and a contraction in credit.
The feedback e¤ect of currency appreciation is strengthened if domestic monetary policy
responds to the appreciation pressure by lowering domestic short-term rates to track global
3
short-term interest rates. Hofmann and Takáts (2015) �nd evidence of such co-movement of
short-term rates. The term �risk-taking channel�was coined by Borio and Zhu (2012) in
the broader context of the transmission of monetary policy, and the lessons from our paper
bear on this larger issue.
Earlier papers on the risk-taking channel focused on banking sector �ows, as in Bruno
and Shin (2015a, 2015b) and Cerutti, Claessens and Ratnovski (2014). Recent studies have
extended the �ndings to bond markets (see Sobrun and Turner (2015) and Feyen et al.
(2015)). The aggregate cross-country evidence on credit supply is complemented by micro-
empirical studies based on �rm- and issuance-level data which suggest that credit supply
�uctuations are key to understanding �nancial conditions (Morais, Peydró and Ruiz (2015)).
Based on evidence from loan-level data in Turkey, Baskaya et al. (2015) show that domestic
loan growth and the cost of borrowing, are strongly in�uenced by global �nancing conditions
proxied by the VIX and banking in�ows. Mian, Su� and Verner (2015) provide additional
cross-country evidence, and Agénor, Alper and Pereira da Silva (2014) examine broader
implications for �nancial stability.
Currency mismatch on EME corporate balance sheets has been a recurring theme. Krug-
man (1999) and Céspedes, Chang and Velasco (2004) examine models with corporate cur-
rency mismatch where currency appreciation increases the value of collateral and hence
relaxes borrowing constraints on EME corporates.1 In contrast, our focus is on credit supply
�uctuations arising from constraints on the investors�portfolio due to shifts in tail risks. The
resulting portfolio shifts can be large, even if the probability of default undergoes only small
changes. In this respect, our approach di¤ers from Du and Schreger (2014), who tie spread
changes to shifts in default probability.
A number of papers have looked at the impact of changes in �nancial conditions on
exchange rates. Gabaix and Maggiori (2015) analyse the determination of exchange rates
based on capital �ows in imperfect �nancial markets. In their theoretical model, capital
�ows drive exchange rates by altering the risk-bearing capacity of �nanciers, which in turn
a¤ects their required compensation for holding currency risk, thus a¤ecting both the level and
volatility of exchange rates. In an empirical paper, Della Corte et al. (2015) present evidence
suggesting that a decrease in sovereign risk, captured by the CDS spread, is associated with
an appreciation of the bilateral exchange rate against the US dollar across EMEs and AEs.
The authors interpret their �nding as showing how an exogenous increase in sovereign default
probability leads to a depreciation of the exchange rate. In contrast, our narrative goes in
1Bacchetta and Banerjee (2000, 2004) also examine currency crisis models featuring currency mismatchon corporate balance sheets and the implied negative impact of currency depreciations on their balancesheets.
4

the opposite direction. For us, there is an economic impact of exchange rate changes on the
real economy, which in turn leads to portfolio shifts. Nevertheless, the two narratives are
complementary, and the interaction of the two e¤ects could potentially lead to ampli�cation
e¤ects that elicit sizeable moves in exchange rates and sovereign spreads. In the empirical
exercise, our focus will be on disentangling these two narratives.
The outline of our paper is as follows. In section 2, we begin by documenting some
stylised facts that motivate our empirical analysis. In section 3 we conduct a more systematic
empirical investigation of the determinants of �nancial conditions and portfolio �ows. In
section 4, we provide a case study in which an exogenous change in the exchange rate against
the US dollar was followed by changes in bond spread and bond fund �ows. We conclude in
section 5 by recapping the �ndings and by posing additional questions that are thrown up
by our analysis.
2 A �rst look at the evidence
By way of motivation, we begin by outlining a number of stylised facts on the link between the
bilateral exchange rate against the US dollar and �nancial conditions in EMEs. Speci�cally,
we will document some unconditional correlations between the bilateral US dollar exchange
rate and EME �nancial conditions. We will conduct a systematic empirical investigation in
section 3 where the preliminary evidence reported in this section is revisited.
Consider �rst the association between the bilateral US dollar exchange rate and bond
fund �ows and bond prices in EME local currency bond markets. We use data from EME
local currency bond funds available from the EPFR database and for which data on their
respective benchmarks are available from JP Morgan Chase every month from January 2011
to July 2015. In total, we use data on 36 funds consisting of 33 global EME local currency
bond funds and three regional EME local currency bond funds. Appendix 1 provides the list
of 36 funds and their respective benchmarks. These data develop the data on EME bond
�ows in Shek, Shim and Shin (2015). Here, we focus on (i) the relationship between the FX
return of a speci�c bond fund and investor �ows into the bond fund, and (ii) the relationship
between the FX return on a bond fund and the local currency-denominated return on bond
holdings by the bond fund. We estimate the FX return by using benchmark weights as a
proxy for actual asset allocation weights of each fund.
Figure 1 shows scatter plots of fund �ows relative to net asset value (NAV) against the
FX return for each of the 36 funds. We �nd that the slope is positive for 31 funds. This
means that investor �ows in EME local currency bond markets increase when EME currencies
appreciate against the US dollar.
5
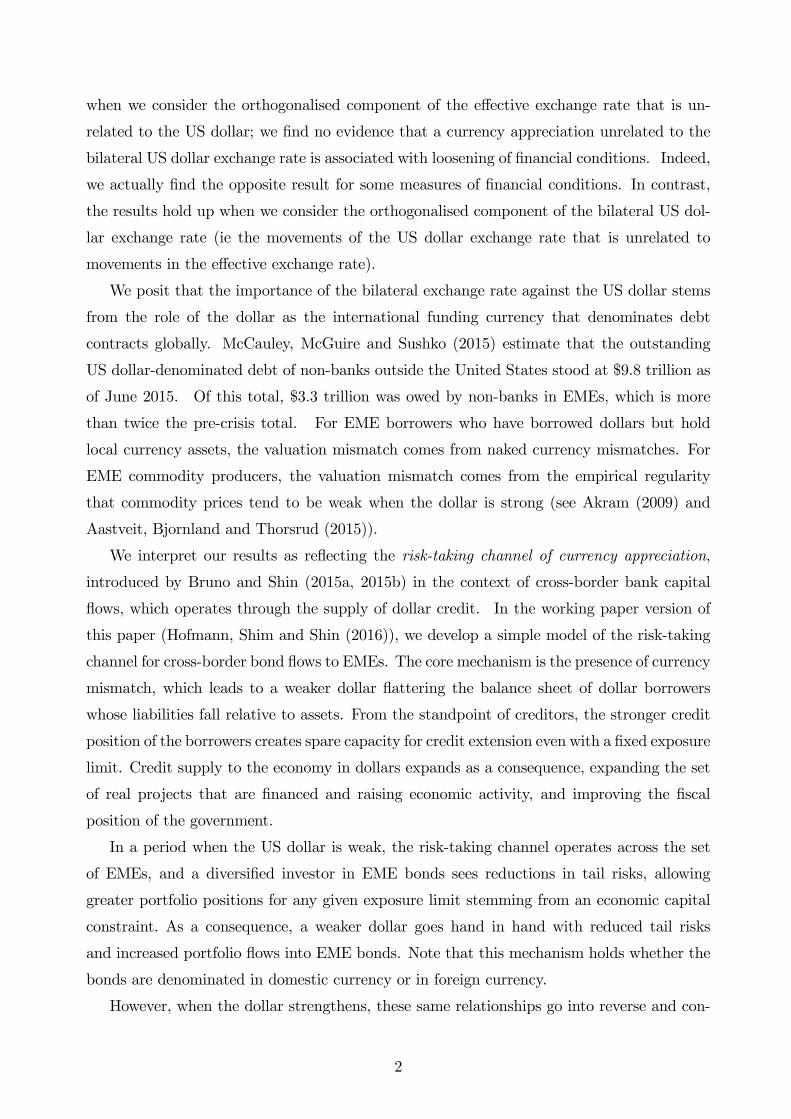
Next, we consider the relationship between the change in EME local currency yields and,
respectively, the US dollar and the local currency returns of the bond funds (Figure 2). The
left-hand panel shows the relationship for individual funds. The right-hand panel is a larger
version of the scatter chart for one of the funds � Fund 31. The blue scatter is the local
currency return (in per cent) against the domestic bond yield change (in percentage points),
while the red scatter is the US dollar-denominated return against the yield change.
The scatter plots reveal a negative relationship between EME currency appreciation
against the US dollar and domestic interest rates. In all the panels in Figure 2, the slope for
the red line for red dots is steeper than that for the blue line for blue dots. The right-hand
half of each of the scatter plots corresponds to the region where local currency sovereign
bond yields have risen � that is, where domestic �nancial conditions are tighter, associated
with higher interest rates. In these states of the world, the red line is below the blue line,
which is to say that dollar returns tend to be lower than local currency returns, implying
that the local currency is depreciating against the dollar. In short, when domestic interest
rates rise, the domestic currency tends to depreciate.2 Conversely, the left-hand half of each
of the scatter panels corresponds to the situation where domestic interest rates have fallen,
and so represent more permissive domestic �nancial conditions. There, we see that the blue
line lies below the red line, implying that the domestic currency tends to appreciate against
the dollar. In short, when domestic interest rates fall, the local currency tends to appreciate
against the dollar.
The relationship between exchange rates and EME bond market conditions in Figures 1
and 2 captures the essence of the �risk-taking channel�of currency appreciation, in which
the domestic �nancial conditions �uctuate in unison with the exchange rate. Among other
things, the scatter charts in Figure 2 show that the returns in dollars and local currency do
not coincide.3 Dollar returns are lower when EME �nancial conditions are tight, while local
currency returns are lower when EME �nancial conditions are loose. Currency appreciation
and looser �nancial conditions therefore go hand in hand.
Consider next the association between shifts in US dollar-denominated EME CDS spreads
and changes in the EME currency exchange rate vis-à-vis the US dollar. The focus here is
on the relationship between the risk premium embedded in the CDS spread for the US dollar
sovereign bonds and how the risk premium co-moves with the US dollar exchange rate.4
2The same relationship is found in papers investigating the impact of monetary policy on EME exchangerates. See, for example, Kohlscheen (2014) and Hnatkovska, Lahiri and Vegh (2016).
3See Bacchetta (2012) for a survey of papers on the related phenomenon of deviations from uncoveredinterest parity (UIP).
4For example, Amstad, Remolona and Shek (2016) do not include India and Singapore in their sam-ple of EMEs since they lack actively traded sovereign CDS contracts after August 2009 and March 2012,respectively.
6

Figure 1. Scatter plots of normalised �ows to EME local currency bond funds to FX returns.The vertical axis represents investor �ows into each fund during a month as a percentage of the beginning-of-the-period NAV, and the horizontal axis monthly FX returns of the benchmark index for each fund duringthe same month. Two outlier observations for Fund 18 and one outlier observation for Fund 31 are excludedfrom the sample. Source: EPFR Global.
7
Figure 2. Dollar and local currency returns on EME local currency sovereign bond funds. Theleft-hand panel shows monthly returns on 20 EME local currency sovereign bond funds over the period ofJanuary 2011 to July 2015. Blue scatter is local currency return (in per cent) against the domestic bondyield change (in percentage points). Red scatter is US dollar return against the yield change. The right-handpanel magni�es the scatter chart for Fund 31. Source: EPFR Global.
The bubble charts in Figure 3 are from Avdjiev, McCauley and Shin (2015) and show
how the sovereign CDS spreads have moved with shifts in the bilateral exchange rate against
the US dollar between the end of 2012 and September 2015, a period characterised by a
large depreciation of many EME currencies against the US dollar, including the US Federal
Reserve announcement of a tapering of its asset purchases. The horizontal axis in each panel
is the percentage change in the bilateral exchange rate of the EME against the US dollar from
the end of 2012. The vertical axis gives the change in the local currency 5-year sovereign CDS
spread minus the US Treasury CDS spread over the same period. The size of the bubbles
indicates the total dollar-denominated debt owed by nonbanks in the country.
We see from Figure 3 that there is both a time series and cross-section relationship
between the CDS spread and the bilateral dollar exchange rate. In the cross-section, the
bubbles line up along a downward-sloping line, indicating that those countries that have
depreciated more against the US dollar tend to have CDS spreads that are higher. Over
time, as the US dollar appreciates, the bubbles move in the north-west direction. In other
words, as the domestic currency weakens against the US dollar, EME sovereign CDS spreads
rise.
The bubble chart for September 2015 (lowest-right panel) shows that EME borrowers
faced challenges due to the stronger dollar. In particular, between end-2012 and September
2015, Brazil and Russia saw their currencies depreciate by more than 50% against the US
dollar and their sovereign CDS spreads rise by more than 250 basis points, even though the
8

Figure 3. Co-movement of the bilateral US dollar exchange rate and the �ve-year sovereign CDSspread in EMEs. The horizontal axis in each panel is the percentage change in the bilateral exchange rateof the EME against the US dollar from the end of 2012. The vertical axis gives the change in the US dollar-denominated 5-year sovereign CDS spread minus the US Treasury CDS spread over the same period. Thesize of the bubbles indicates the total dollar-denominated debt owed by nonbanks in the country.
9

domestic interest rates in Brazil and Russia increased signi�cantly during the period. Less
sizeable changes are evident for the other EMEs (Indonesia, Malaysia, Mexico, South Africa
and Turkey). But even for these countries, there have been currency depreciations of between
20% and 50% against the dollar, associated with CDS spread increases of between 70 and
180 basis points.
Of course, these unconditional correlations raise more questions than they answer. In
particular, the associations suggested by Figures 1, 2 and 3 are contemporaneous associa-
tions and may re�ect common factors driving both variables, or reverse causality as lower
risk spreads and higher bond in�ows may lead to appreciation of the currency. The question
is whether there is evidence that the unconditional association between exchange rate ap-
preciation and easier �nancial conditions re�ects at least in part a conditional causal e¤ect
running from the exchange rate to �nancial conditions, rather than conversely. This question
will be addressed in the next section.
3 Empirical investigation
In the existing literature, EME �nancial conditions are commonly modelled as a function of
business cycle indicators as well as of indicators of a country�s �scal and external position
and its indebtedness (see, eg, Bellas, Papaioannou and Petrova (2010) and Du and Schreger
(2015)). The exchange rate is usually not considered.5 Here we delve deeper into the risk-
taking channel and extend this literature by considering the role of the exchange rate for
EME �nancial conditions explicitly. The hypothesis is that the estimated impact of the
exchange rate on EME �nancial conditions indicates the existence of a risk-taking channel
that a¤ects credit supply to these economies. When the exchange rate of EMEs appreciates,
EME borrowers look more creditworthy and, at the same time, lenders� lending capacity
increases.
Against the background of the stylised facts established in the previous section, we pro-
ceed to a more systematic empirical investigation in this section. Speci�cally, consider the
association between the US dollar exchange rate and EME bond market conditions using
daily and monthly data for 20 EMEs over the period January 2005 to December 2015. We
consider both quantity and price-based indicators of bond market conditions. For the for-
mer, we use monthly data for investor �ows to individual EMEs via bond mutual funds and
exchange-traded funds (ETFs) collected by EPFR Global.6 For price-based measures we
5 An exception is the BIS study by Gadanecz, Miyajima and Shu (2014) who focus on exchange rate risk
measured by implied exchange rate volatility rather than on movements in the exchange rate itself.6 Since new EME bond funds are added to the EPFR database over the sample period, we need to
10

look at daily and monthly data on the spread of the 5-year local currency bond yield over
the 5-year Treasury yield. In order to shed light on the channel through which the exchange
rate a¤ects the bond spread, speci�cally whether the e¤ect works through risk spreads or the
forward premium, we dissect this indicator into a local currency risk premium component
and a forward premium following Du and Schreger (2015). If exchange rates a¤ect bond
market conditions through a risk taking channel, we would expect to see in particular a
signi�cant link between exchange rate changes and risk premium measures. Due to data
limitations, this part of the analysis covers only 14 EMEs. As a cross-check we also consider
the CDS spread as an alternative and widely used (dollar-demoniated) indicator of sovereign
risk. CDS spreads are available for all 20 EMEs initially covered by our analysis. Appendix
1 provides more details on the data.
Preliminary regressions suggest that the association between di¤erent measures of EME
�nancial conditions and the US dollar exchange rate suggested by Figures 1, 2 and 3 also holds
up when looking at unconditional contemporaneous correlations in our dataset. Speci�cally,
when regressing di¤erent measures of EME bond market conditions on the change in the
bilateral exchange rate against the US dollar (�BER), controlling only for country �xed
e¤ects, we �nd a highly signi�cant positive correlation between bond �ows and �BER, while
the correlation is signi�cantly negative for local currency bond spreads (Table 1, second and
third columns). The latter re�ects primarily a negative association between the change in
the exchange rate and the local currency risk spread (fourth column), while the negative
association is only marginally signi�cant in the case of the change in cross-currency swap
rates (�fth coulumn). Also for the change in the 5-year CDS spread and �BER we �nd a
strong negative association (sixth column).
These results con�rm the notion that an appreciation of the bilateral exchange against
the US dollar is associated with signi�cantly higher in�ows into EME sovereign bond markets
and signi�cantly lower EME bond spreads, re�ecting in particular lower credit risk spreads.
There are, however, several caveats that limit the indicativeness of these �ndings in Table 1
with respect to the empirical relevance of a risk-taking channel of currency appreciation.
First, as already discussed in section 2, endogeneity is a major issue. Exchange rate
appreciation may loosen �nancial conditions and lower risk spreads, but higher bond in�ows
and lower risk spreads may in turn drive up the value of the domestic currency (Della
Corte et al. (2015)). Second, the association between bond market conditions and the US
control for potential bias created by new funds�entering the database. We use �ows normalised by NAV,
and we consider investor �ows to a country by any fund that is covered by the EPFR database at a point in
time. An alternative approach is to �x a subset of bond funds for which complete monthly data are available
throughout the sample period. The scatter charts in Section 2 were generated in this way.
11
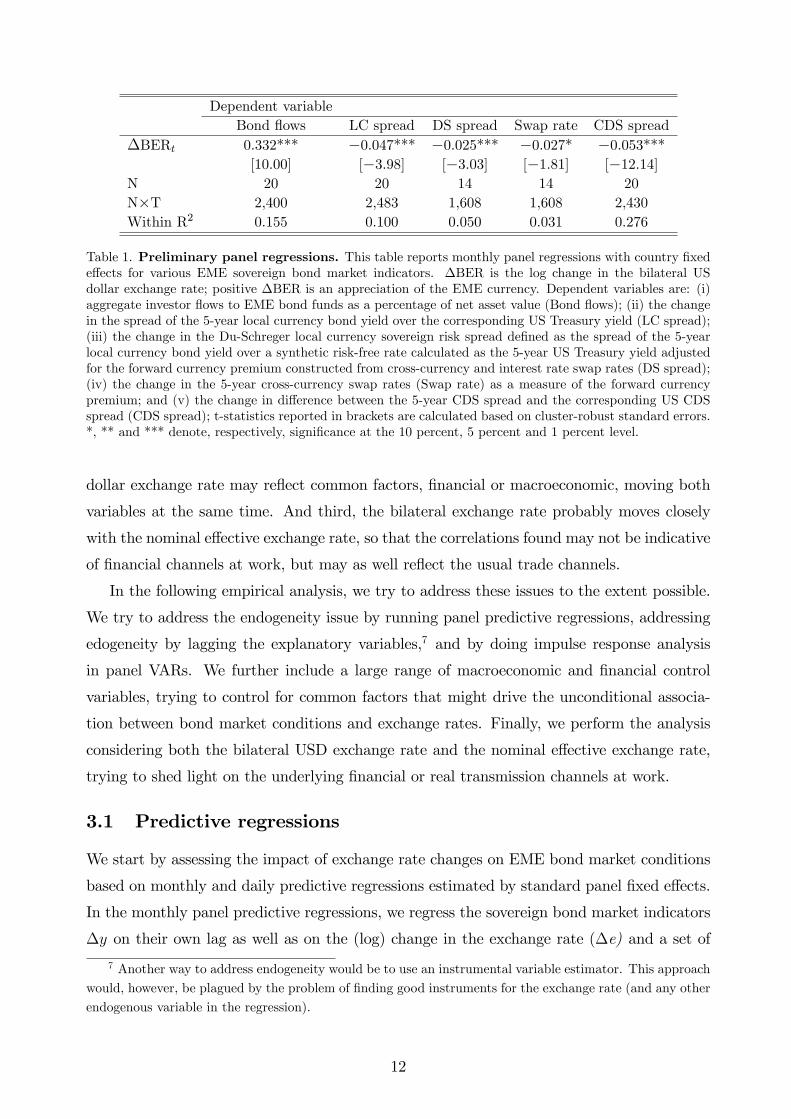
Dependent variableBond �ows LC spread DS spread Swap rate CDS spread
�BERt 0.332*** �0.047*** �0.025*** �0.027* �0.053***[10.00] [�3.98] [�3.03] [�1.81] [�12.14]
N 20 20 14 14 20N�T 2,400 2,483 1,608 1,608 2,430Within R2 0.155 0.100 0.050 0.031 0.276
Table 1. Preliminary panel regressions. This table reports monthly panel regressions with country �xede¤ects for various EME sovereign bond market indicators. �BER is the log change in the bilateral USdollar exchange rate; positive �BER is an appreciation of the EME currency. Dependent variables are: (i)aggregate investor �ows to EME bond funds as a percentage of net asset value (Bond �ows); (ii) the changein the spread of the 5-year local currency bond yield over the corresponding US Treasury yield (LC spread);(iii) the change in the Du-Schreger local currency sovereign risk spread de�ned as the spread of the 5-yearlocal currency bond yield over a synthetic risk-free rate calculated as the 5-year US Treasury yield adjustedfor the forward currency premium constructed from cross-currency and interest rate swap rates (DS spread);(iv) the change in the 5-year cross-currency swap rates (Swap rate) as a measure of the forward currencypremium; and (v) the change in di¤erence between the 5-year CDS spread and the corresponding US CDSspread (CDS spread); t-statistics reported in brackets are calculated based on cluster-robust standard errors.*, ** and *** denote, respectively, signi�cance at the 10 percent, 5 percent and 1 percent level.
dollar exchange rate may re�ect common factors, �nancial or macroeconomic, moving both
variables at the same time. And third, the bilateral exchange rate probably moves closely
with the nominal e¤ective exchange rate, so that the correlations found may not be indicative
of �nancial channels at work, but may as well re�ect the usual trade channels.
In the following empirical analysis, we try to address these issues to the extent possible.
We try to address the endogeneity issue by running panel predictive regressions, addressing
edogeneity by lagging the explanatory variables,7 and by doing impulse response analysis
in panel VARs. We further include a large range of macroeconomic and �nancial control
variables, trying to control for common factors that might drive the unconditional associa-
tion between bond market conditions and exchange rates. Finally, we perform the analysis
considering both the bilateral USD exchange rate and the nominal e¤ective exchange rate,
trying to shed light on the underlying �nancial or real transmission channels at work.
3.1 Predictive regressions
We start by assessing the impact of exchange rate changes on EME bond market conditions
based on monthly and daily predictive regressions estimated by standard panel �xed e¤ects.
In the monthly panel predictive regressions, we regress the sovereign bond market indicators
�y on their own lag as well as on the (log) change in the exchange rate (�e) and a set of
7 Another way to address endogeneity would be to use an instrumental variable estimator. This approach
would, however, be plagued by the problem of �nding good instruments for the exchange rate (and any other
endogenous variable in the regression).
12
control variables (Z):
�yi;t = �i + ��yi;t�1 + ��ei;t�1 + �Zi;t�1 + "i;t: (1)
For the exchange rate e we consider four di¤erent measures: (i) the bilateral US dol-
lar exchange rate (BER); (ii) the nominal e¤ective exchange rate (NEER); (iii) the wedge
between the BER and the NEER obtained by regressing for each country separately the
change in the BER on the change in the NEER, and retaining the residuals as the part of
the BER change that is unrelated to the change in the NEER (orth BER); and (iv) the
wedge between the NEER and the BER obtained by regressing for each country separately
the change in the NEER on the change in the BER, and retaining the residuals as the part
of the NEER change that is unrelated to the change in the BER (orth NEER). The wedge
measures serve the purpose of �ltering out the correlation between BER and NEER in order
to isolate speci�c changes in the respective exchange rate measures. The exchange rates are
de�ned such that an increase is an appreciation of the domestic currency.
The set of control variables Z includes the log change in the VIX, the change in year-
on-year domestic and US consumer price index (CPI) in�ation, the change in year-on-year
domestic and US industrial production growth and the change in the domestic and the US
short-term interest rate (3-month money market rate). The control variables should capture
factors that a¤ect EME �nancial conditions and possibly also exchange rates at the same
time. The interactions between exchange rates and EME sovereign spreads that we uncover
through our regressions are conditional on these control variables and should therefore not
just re�ect common factors driving both exchange rates and spreads, such as a shift in
investor risk appetite or changes in global or domestic monetary conditions.8
For the price-based bond market conditions indicators where daily data are available, we
complement the monthly regressions with daily panel predictive regressions of the form:
�yi;t+h = �i + ��yi;t�1 + ��ei;t�1 + �Zi;t�1 + �i;t+h (2)
where we link the change in the bond market indicator to the lagged change in the exchange
rate over horizons (h) of up to 30 trading days. The vector of control variables here includes
only the change in the domestic and the US short-term interest rates, the log change in the
VIX as the macroeconomic controls are not available in daily frequency.
In order to assess which exchange rate matters for EME �nancial conditions, we run the
regressions in �ve di¤erent speci�cations: (i) including only the bilateral US dollar exchange
8We do not include control variables capturing a country�s �scal and external position or its indebtedness
as such variables are mostly available only at a lower frequency (quarterly or even annual) than the monthly
one adopted in the analysis here.
13

rate (BER); (ii) including only the nominal e¤ective exchange rate (NEER); (iii) including
the BER and the wedge between the NEER and the BER (orth NEER); (iv) including the
NEER and the wedge between the BER and the NEER (orth BER); and (v) including both
the BER and the NEER.
The inclusion of the lagged dependent variable in the regression controls for endogeneity
that may arise from persistence in the dynamics of the dependent variable. If the dependent
variable is autocorrelated, then omission of the lagged dependent variable could give rise
to endogeneity bias as the e¤ect of the lagged regressors might just re�ect the correlation
between the lagged regressor and the omitted lagged dependent variable.
However, while controlling for this potential source of endogeneity, the inclusion of the
lagged dependent variable gives rise to other potential econometric issues. Fixed-e¤ects
estimators of dynamic panels can be biased in panels with small time dimensions (Nickell
(1981)) and if there is heterogeneity in the slope coe¢ cients across countries (Pesaran and
Smith (1995)). With more than 100 monthly observations, the time dimension of our panel
is relatively large so that the Nickell bias is less of concern. This notion is con�rmed by
the fact that the results are very similar when re-running the regressions with the lagged
dependent variable excluded, at least as far as the impact of the exchange rate is concerned.
In order to assess the caveat of a potential bias stemming from coe¢ cient heterogeneity, we
have also re-run all the regressions using the mean group estimator proposed by Pesaran and
Smith (1995). This involves estimating the equation country by country and constructing a
panel estimate of the slope coe¢ cients by averaging across the country coe¢ cients. While
this addresses the slope heterogeneity issue, it comes at the cost of reduced e¢ ciency. The
results of this exercise, which we do not report because of space constraint but are available
upon request, are very similar to the standard �xed-e¤ect panel regression results.
Bond �ows and bond spreads
We start out by assessing the impact of exchange rate changes on bond fund �ows and the
change in the local currency bond spread The results suggest that an appreciation of the BER
is followed by a signi�cant increase in bond in�ows and a signi�cant drop in bond spreads,
ie. a loosening of EME �nancial conditions. This results obtains even when controlling for
or �ltering out movements in the NEER. For appreciations of the NEER, in contrast, we do
�nd that it is followed by a loosening of �nancial conditions once the movements of the BER
are controlled for.
Speci�cally, for the regressions with the bond fund �ows (Table 2) we �nd that the
impact of the bilateral US dollar exchange rate is both economically and statistically highly
signi�cant. An increase in the BER (ie an appreciation of the local currency of an EME
14
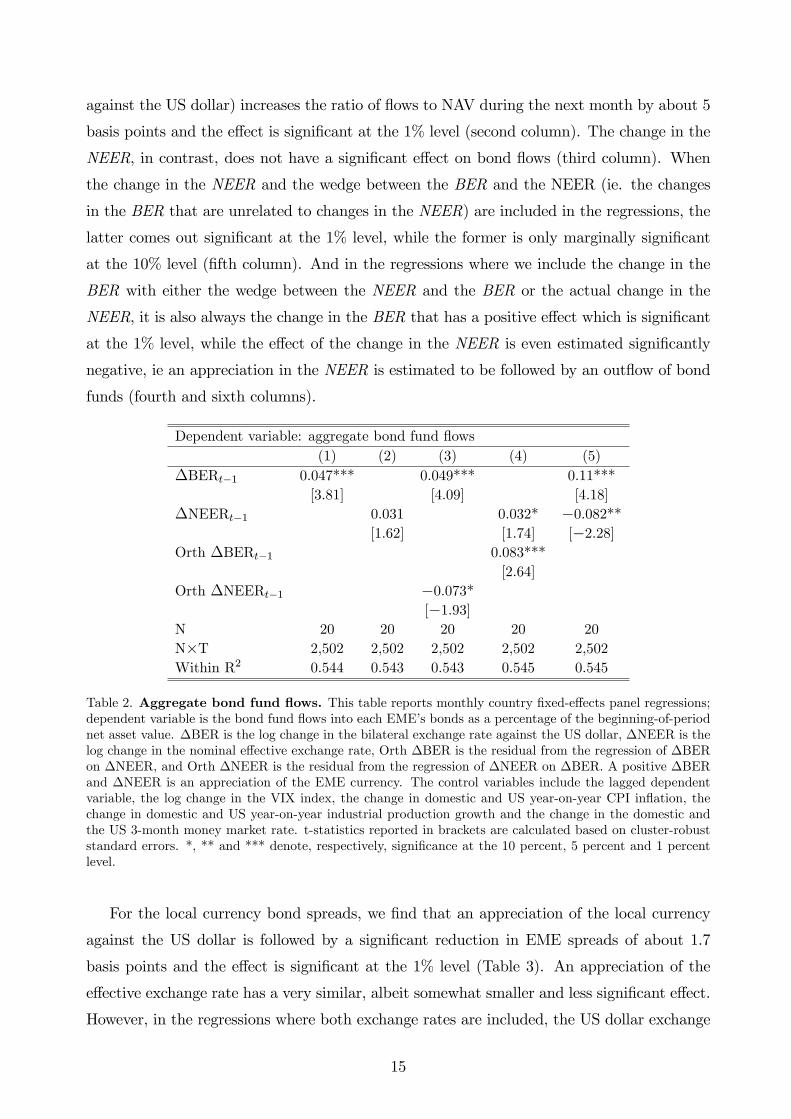
against the US dollar) increases the ratio of �ows to NAV during the next month by about 5
basis points and the e¤ect is signi�cant at the 1% level (second column). The change in the
NEER, in contrast, does not have a signi�cant e¤ect on bond �ows (third column). When
the change in the NEER and the wedge between the BER and the NEER (ie. the changes
in the BER that are unrelated to changes in the NEER) are included in the regressions, the
latter comes out signi�cant at the 1% level, while the former is only marginally signi�cant
at the 10% level (�fth column). And in the regressions where we include the change in the
BER with either the wedge between the NEER and the BER or the actual change in the
NEER, it is also always the change in the BER that has a positive e¤ect which is signi�cant
at the 1% level, while the e¤ect of the change in the NEER is even estimated signi�cantly
negative, ie an appreciation in the NEER is estimated to be followed by an out�ow of bond
funds (fourth and sixth columns).
Dependent variable: aggregate bond fund �ows(1) (2) (3) (4) (5)
�BERt�1 0.047*** 0.049*** 0.11***[3.81] [4.09] [4.18]
�NEERt�1 0.031 0.032* �0.082**[1.62] [1.74] [�2.28]
Orth �BERt�1 0.083***[2.64]
Orth �NEERt�1 �0.073*[�1.93]
N 20 20 20 20 20N�T 2,502 2,502 2,502 2,502 2,502Within R2 0.544 0.543 0.543 0.545 0.545
Table 2. Aggregate bond fund �ows. This table reports monthly country �xed-e¤ects panel regressions;dependent variable is the bond fund �ows into each EME�s bonds as a percentage of the beginning-of-periodnet asset value. �BER is the log change in the bilateral exchange rate against the US dollar, �NEER is thelog change in the nominal e¤ective exchange rate, Orth �BER is the residual from the regression of �BERon �NEER, and Orth �NEER is the residual from the regression of �NEER on �BER. A positive �BERand �NEER is an appreciation of the EME currency. The control variables include the lagged dependentvariable, the log change in the VIX index, the change in domestic and US year-on-year CPI in�ation, thechange in domestic and US year-on-year industrial production growth and the change in the domestic andthe US 3-month money market rate. t-statistics reported in brackets are calculated based on cluster-robuststandard errors. *, ** and *** denote, respectively, signi�cance at the 10 percent, 5 percent and 1 percentlevel.
For the local currency bond spreads, we �nd that an appreciation of the local currency
against the US dollar is followed by a signi�cant reduction in EME spreads of about 1.7
basis points and the e¤ect is signi�cant at the 1% level (Table 3). An appreciation of the
e¤ective exchange rate has a very similar, albeit somewhat smaller and less signi�cant e¤ect.
However, in the regressions where both exchange rates are included, the US dollar exchange
15
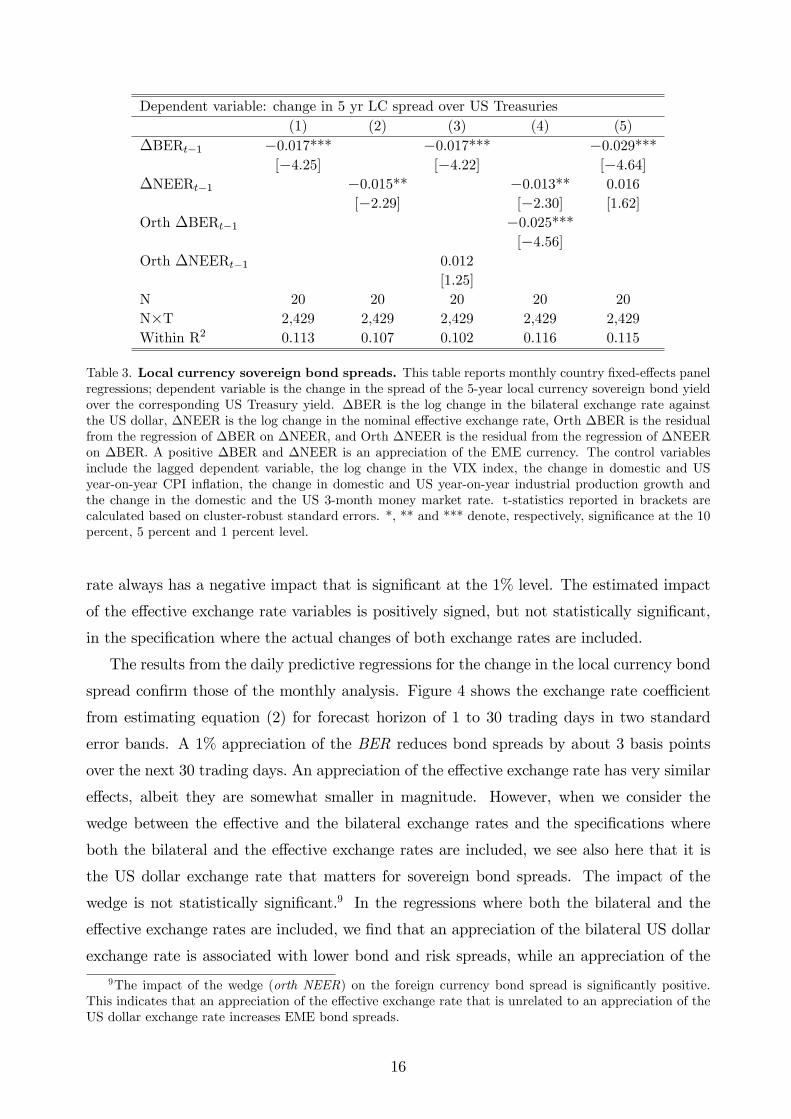
Dependent variable: change in 5 yr LC spread over US Treasuries(1) (2) (3) (4) (5)
�BERt�1 �0.017*** �0.017*** �0.029***[�4.25] [�4.22] [�4.64]
�NEERt�1 �0.015** �0.013** 0.016[�2.29] [�2.30] [1.62]
Orth �BERt�1 �0.025***[�4.56]
Orth �NEERt�1 0.012[1.25]
N 20 20 20 20 20N�T 2,429 2,429 2,429 2,429 2,429Within R2 0.113 0.107 0.102 0.116 0.115
Table 3. Local currency sovereign bond spreads. This table reports monthly country �xed-e¤ects panelregressions; dependent variable is the change in the spread of the 5-year local currency sovereign bond yieldover the corresponding US Treasury yield. �BER is the log change in the bilateral exchange rate againstthe US dollar, �NEER is the log change in the nominal e¤ective exchange rate, Orth �BER is the residualfrom the regression of �BER on �NEER, and Orth �NEER is the residual from the regression of �NEERon �BER. A positive �BER and �NEER is an appreciation of the EME currency. The control variablesinclude the lagged dependent variable, the log change in the VIX index, the change in domestic and USyear-on-year CPI in�ation, the change in domestic and US year-on-year industrial production growth andthe change in the domestic and the US 3-month money market rate. t-statistics reported in brackets arecalculated based on cluster-robust standard errors. *, ** and *** denote, respectively, signi�cance at the 10percent, 5 percent and 1 percent level.
rate always has a negative impact that is signi�cant at the 1% level. The estimated impact
of the e¤ective exchange rate variables is positively signed, but not statistically signi�cant,
in the speci�cation where the actual changes of both exchange rates are included.
The results from the daily predictive regressions for the change in the local currency bond
spread con�rm those of the monthly analysis. Figure 4 shows the exchange rate coe¢ cient
from estimating equation (2) for forecast horizon of 1 to 30 trading days in two standard
error bands. A 1% appreciation of the BER reduces bond spreads by about 3 basis points
over the next 30 trading days. An appreciation of the e¤ective exchange rate has very similar
e¤ects, albeit they are somewhat smaller in magnitude. However, when we consider the
wedge between the e¤ective and the bilateral exchange rates and the speci�cations where
both the bilateral and the e¤ective exchange rates are included, we see also here that it is
the US dollar exchange rate that matters for sovereign bond spreads. The impact of the
wedge is not statistically signi�cant.9 In the regressions where both the bilateral and the
e¤ective exchange rates are included, we �nd that an appreciation of the bilateral US dollar
exchange rate is associated with lower bond and risk spreads, while an appreciation of the
9The impact of the wedge (orth NEER) on the foreign currency bond spread is signi�cantly positive.This indicates that an appreciation of the e¤ective exchange rate that is unrelated to an appreciation of theUS dollar exchange rate increases EME bond spreads.
16

e¤ective exchange rate leads to higher spreads.
Overall, these results suggest that it is the US dollar exchange rate that matters for
bond �ows and for local currency sovereign bond spreads. An appreciation of the BER is
followed by a loosening of EME �nancial conditions. The change in the NEER is always
smaller and less signi�cant, and in some speci�cations even comes out with a sign suggesting
that an appreciation is followed by a tightening of EME �nancial conditions. This result
probably re�ects the standard textbook trade channel-type e¤ects where an appreciation of
the e¤ective exchange rate has a negative e¤ect on trade and, through this channel, also on
the wider economy, which may in turn adversely a¤ect perceptions of sovereign credit risk
and hence credit supply.
Decomposing bond spreads
Du and Schreger (2015) have shown that the local currency bond spread can be de-
composed into a local currency credit risk premium and a forward premium which can be
approximated through cross-currency swap rates. Based on this decomposition we assess in
this subsection whether the link between the bilateral exchange rate against the US dollar
and the local currency bond spread established above runs through the credit risk compo-
nent as a consequence of a risk-taking channel, or through the forward premium by a¤ecting
expectations of future exchange rates. To this end, we run the monthly and daily predictive
regressions using the Du-Schreger (2015) measure of local currency sovereign credit risk and
the change in the cross-currency swap rate which serves as a proxy for the forward currency
premium, the other component of the local currency bond spread. As a cross-check, we also
run the regressions using the (dollar denominated) 5-year CDS spread. The results support
the notion of a risk-taking channel of currency appreciation being at work in EME bond
markets. Speci�cally, we �nd that an appreciation of the domestic currency against the US
dollar is followed by signi�cant reduction in credit risk measures. Appreciations of the nom-
inal e¤ective exchange rate generally do not signi�cantly lower risk spreads. For the swap
rates, exchange rate e¤ects are generally insigni�cant.
The results of the monthly regressions show that an appreciation of the BER lowers the
credit risk spread in a statistically signi�cant way across all speci�cations (Table 4). The
estimated magnitude of the e¤ects ranges from 1.3 to 2.5 basis points. The impact of a
change in the NEER is never statistically signi�cant. For the change in the swap rates, the
impact of exchange rates are generally insigni�cant (Table 5). Only in two speci�cations we
obtain a marginally signi�cant negative e¤ect of the change in the BER on the swap rates.
These results suggest that it is the US dollar exchange rate that in�uences EME sovereign
spreads primarily through the risk spread that is embedded in them.
17
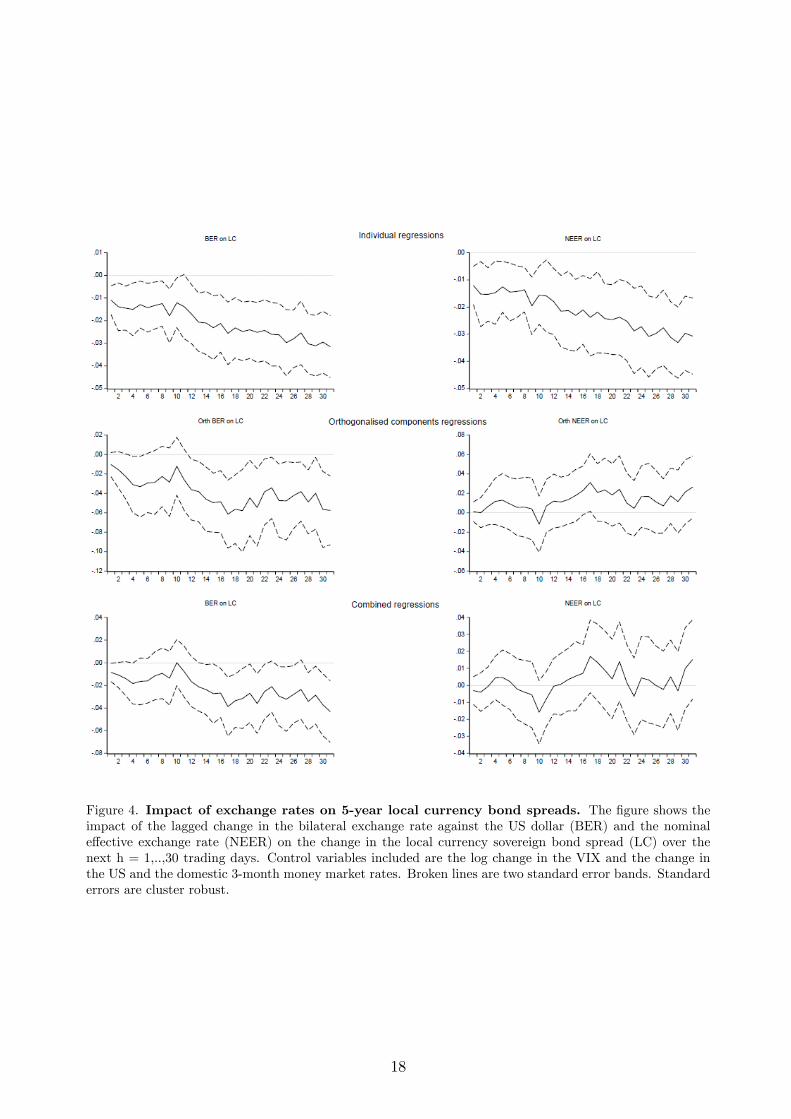
Figure 4. Impact of exchange rates on 5-year local currency bond spreads. The �gure shows theimpact of the lagged change in the bilateral exchange rate against the US dollar (BER) and the nominale¤ective exchange rate (NEER) on the change in the local currency sovereign bond spread (LC) over thenext h = 1,..,30 trading days. Control variables included are the log change in the VIX and the change inthe US and the domestic 3-month money market rates. Broken lines are two standard error bands. Standarderrors are cluster robust.
18

Dependent variable: change in Du-Schreger risk spread(1) (2) (3) (4) (5)
�BERt�1 �0.013** �0.012** �0.025**[�2.39] [�2.37] [�2.18]
�NEERt�1 �0.010 �0.010 0.018[�1.46] [�1.42] [1.10]
Orth �BERt�1 �0.020**[�2.00]
Orth �NEERt�1 0.005[0.25]
N 14 14 14 14 14N�T 1,548 1,548 1,548 1,548 1,548Within R2 0.058 0.051 0.044 0.061 0.058
Table 4. Du-Schreger local currency sovereign risk spreads. This table reports monthly country�xed-e¤ects panel regressions; dependent variable is the change in the spread of the 5-year local currencybond yield over a synthetic risk-free rate calculated as the 5-year US Treasury yield adjusted for the forwardcurrency premium constructed from cross-currency and interest rate swap rates. �BER is the log changein the bilateral exchange rate against the US dollar, �NEER is the log change in the nominal e¤ectiveexchange rate, Orth �BER is the residual from the regression of �BER on �NEER, and Orth �NEER isthe residual from the regression of �NEER on �BER. A positive �BER and �NEER is an appreciation ofthe EME currency. The control variables include the lagged dependent variable, the log change in the VIXindex, the change in domestic and US year-on-year CPI in�ation, the change in domestic and US year-on-year industrial production growth and the change in the domestic and the US 3-month money market rate.t-statistics reported in brackets are calculated based on cluster-robust standard errors. *, ** and *** denote,respectively, signi�cance at the 10 percent, 5 percent and 1 percent level.
Dependent variable: change in cross-currency swap rate(1) (2) (3) (4) (5)
�BERt�1 �0.006 �0.006 �0.021*[�0.98] [�1.09] [�1.87]
�NEERt�1 �0.001 �0.002 0.020[�0.14] [�0.28] [1.10]
Orth �BERt�1 �0.021*[�1.82]
Orth �NEERt�1 0.022[1.32]
N 14 14 14 14 14N�T 1,587 1,587 1,587 1,587 1,587Within R2 0.033 0.032 0.035 0.036 0.037
Table 5. Cross-currency swap rates. This table reports monthly country �xed-e¤ects panel regressions;dependent variable is the change in the 5-year cross-currency swap rate, which is equivalent to the 5-yearforward premium. �BER is the log change in the bilateral exchange rate against the US dollar, �NEER is thelog change in the nominal e¤ective exchange rate, Orth �BER is the residual from the regression of �BERon �NEER, and Orth �NEER is the residual from the regression of �NEER on �BER. A positive �BERand �NEER is an appreciation of the EME currency. The control variables include the lagged dependentvariable, the log change in the VIX index, the change in domestic and US year-on-year CPI in�ation, thechange in domestic and US year-on-year industrial production growth and the change in the domestic andthe US 3-month money market rate. t-statistics reported in brackets are calculated based on cluster-robuststandard errors. *, ** and *** denote, respectively, signi�cance at the 10 percent, 5 percent and 1 percentlevel.
19
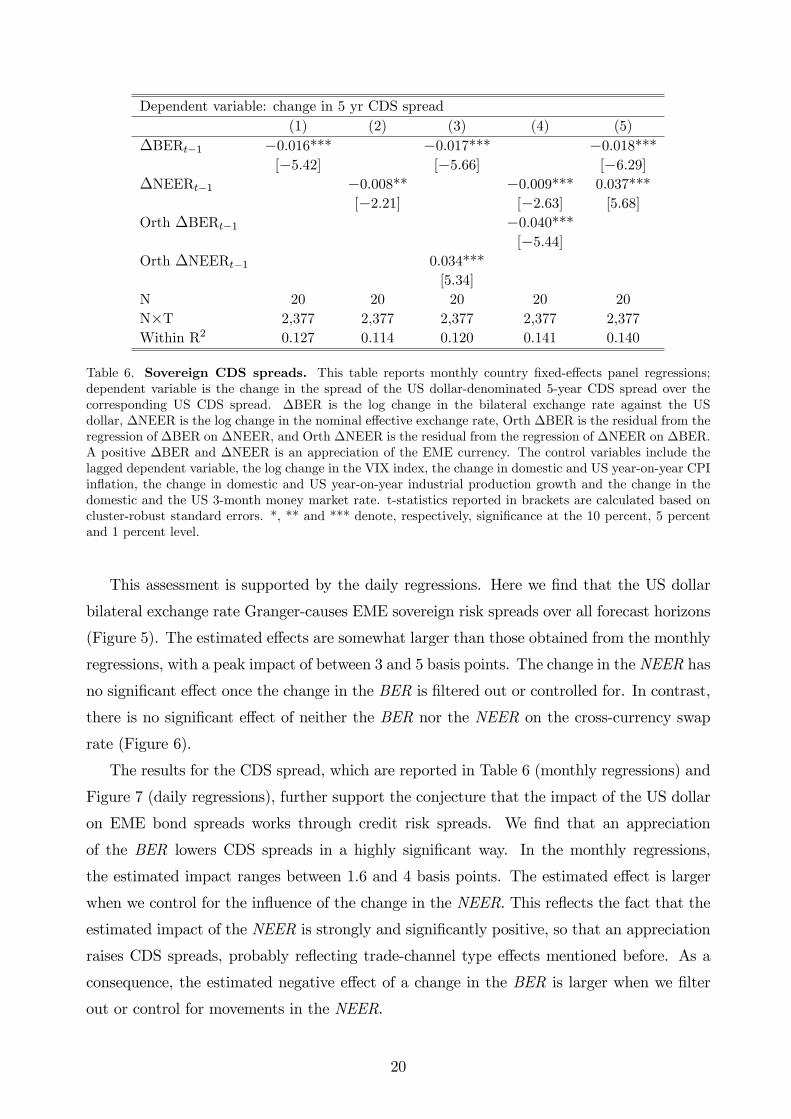
Dependent variable: change in 5 yr CDS spread(1) (2) (3) (4) (5)
�BERt�1 �0.016*** �0.017*** �0.018***[�5.42] [�5.66] [�6.29]
�NEERt�1 �0.008** �0.009*** 0.037***[�2.21] [�2.63] [5.68]
Orth �BERt�1 �0.040***[�5.44]
Orth �NEERt�1 0.034***[5.34]
N 20 20 20 20 20N�T 2,377 2,377 2,377 2,377 2,377Within R2 0.127 0.114 0.120 0.141 0.140
Table 6. Sovereign CDS spreads. This table reports monthly country �xed-e¤ects panel regressions;dependent variable is the change in the spread of the US dollar-denominated 5-year CDS spread over thecorresponding US CDS spread. �BER is the log change in the bilateral exchange rate against the USdollar, �NEER is the log change in the nominal e¤ective exchange rate, Orth �BER is the residual from theregression of �BER on �NEER, and Orth �NEER is the residual from the regression of �NEER on �BER.A positive �BER and �NEER is an appreciation of the EME currency. The control variables include thelagged dependent variable, the log change in the VIX index, the change in domestic and US year-on-year CPIin�ation, the change in domestic and US year-on-year industrial production growth and the change in thedomestic and the US 3-month money market rate. t-statistics reported in brackets are calculated based oncluster-robust standard errors. *, ** and *** denote, respectively, signi�cance at the 10 percent, 5 percentand 1 percent level.
This assessment is supported by the daily regressions. Here we �nd that the US dollar
bilateral exchange rate Granger-causes EME sovereign risk spreads over all forecast horizons
(Figure 5). The estimated e¤ects are somewhat larger than those obtained from the monthly
regressions, with a peak impact of between 3 and 5 basis points. The change in the NEER has
no signi�cant e¤ect once the change in the BER is �ltered out or controlled for. In contrast,
there is no signi�cant e¤ect of neither the BER nor the NEER on the cross-currency swap
rate (Figure 6).
The results for the CDS spread, which are reported in Table 6 (monthly regressions) and
Figure 7 (daily regressions), further support the conjecture that the impact of the US dollar
on EME bond spreads works through credit risk spreads. We �nd that an appreciation
of the BER lowers CDS spreads in a highly signi�cant way. In the monthly regressions,
the estimated impact ranges between 1.6 and 4 basis points. The estimated e¤ect is larger
when we control for the in�uence of the change in the NEER. This re�ects the fact that the
estimated impact of the NEER is strongly and signi�cantly positive, so that an appreciation
raises CDS spreads, probably re�ecting trade-channel type e¤ects mentioned before. As a
consequence, the estimated negative e¤ect of a change in the BER is larger when we �lter
out or control for movements in the NEER.
20

Figure 5. Impact of exchange rates on 5-year local currency sovereign risk spreads. The �gureshows the impact of the lagged change in the bilateral exchange rate against the US dollar (BER) and thenominal e¤ective exchange rate (NEER) on the change in the local currency sovereign risk spread (DC) overthe next h = 1,..,30 trading days. Control variables included are the log change in the VIX and the change inthe US and the domestic 3-month money market rates. Broken lines are two standard error bands. Standarderrors are cluster robust.
21
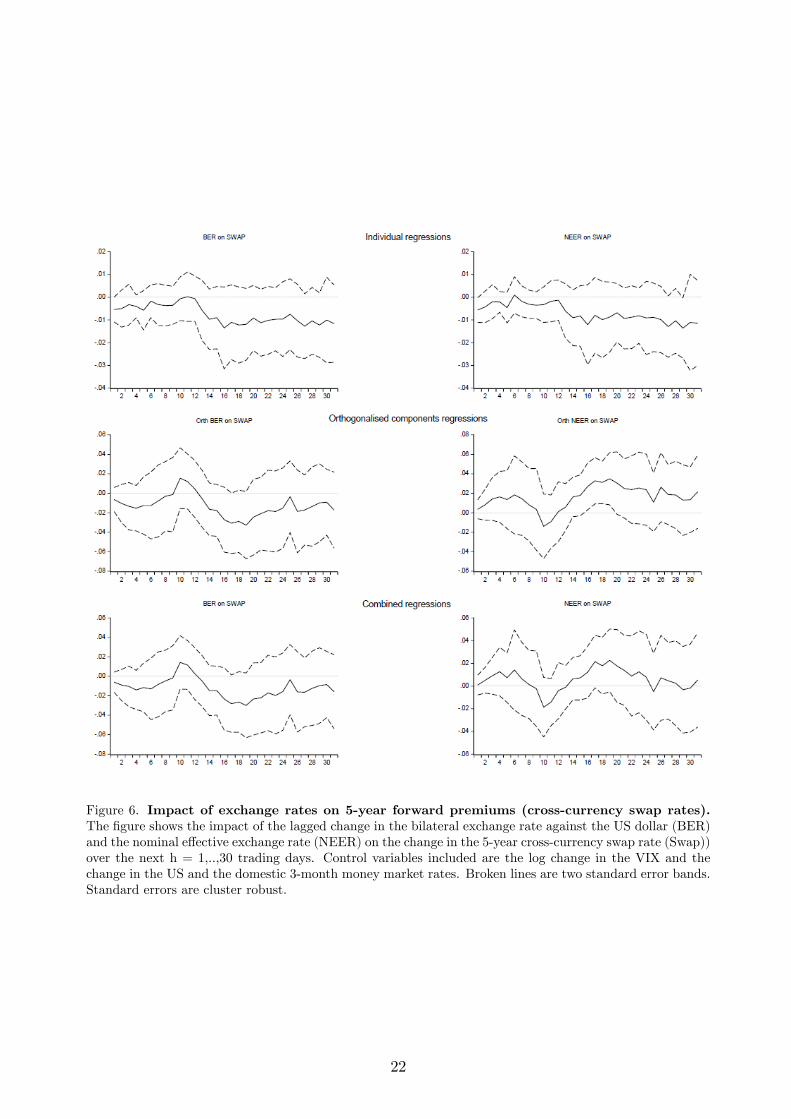
Figure 6. Impact of exchange rates on 5-year forward premiums (cross-currency swap rates).The �gure shows the impact of the lagged change in the bilateral exchange rate against the US dollar (BER)and the nominal e¤ective exchange rate (NEER) on the change in the 5-year cross-currency swap rate (Swap))over the next h = 1,..,30 trading days. Control variables included are the log change in the VIX and thechange in the US and the domestic 3-month money market rates. Broken lines are two standard error bands.Standard errors are cluster robust.
22

Figure 7. Impact of exchange rates on 5-year CDS spreads. The �gure shows the impact of the laggedchange in the bilateral exchange rate against the US dollar (BER) and the nominal e¤ective exchange rate(NEER) on the change in the CDS spread (DC) over the next h = 1,..,30 trading days. Control variablesincluded are the log change in the VIX and the change in the US and the domestic 3-month money marketrates. Broken lines are two standard error bands. Standard errors are cluster robust.
23

Overall, the results con�rm the notion that an appreciation of the bilateral exchange rate
against the US dollar loosens �nancial conditions in EMEs through a risk-taking channel, ie
by lowering credit risk spreads. The results further suggest that it is the US dollar exchange
rate that works through these �nancial channels, and not the e¤ective exchange rate. An
appreciation of the latter is instead often followed by higher bond and risks spreads. This
suggests that the NEER seems to work instead through the classical trade channels whereby
an appreciation leads to higher bond and risk spreads due to the adverse economic e¤ects of
the associated loss in trade competitiveness.
It is worthwhile highlighting that the signi�cant impact of the US dollar exchange rate
on EME sovereign bond market conditions obtains despite controlling for a large number of
variables that signi�cantly a¤ect those conditions and presumably also the exchange rate.
The signi�cant association between the exchange rate and bond market conditions thus
does not seem to merely capture common factors but appears to represent an independent
amplifying channel of transmission.
But how important is the impact of the US dollar exchange rate on EME bond and credit
risk spreads economically? According to the monthly regressions, which yield smaller and
hence more conservative estimates, a 1% appreciation of the domestic currency against the
US dollar lowers local currency bond and risk spreads by between 1.5 to 3 basis points, de-
pending on the speci�cation. Taken at face value, the economic impact therefore seems small.
However, we need to put these estimated e¤ects into perspective against the background of
observed exchange rate �uctuations. Across the 20 economies covered by our analysis, the
average standard deviation of the change in the US dollar exchange rate over the sample
period is about 2.5 percentage points. This means that a standard change in the exchange
rate moves EME spreads by roughly 3.7�7.5 basis points. It is also instructive to do a back-
of-the-envelope calculation to assess the cumulative e¤ect of the considerable exchange rate
movements that we have observed since 2013. Over this period, the EME currencies covered
in our analysis depreciated against the US dollar by on average about 30%. Our estimations
suggest that this might have added some 45 to 90 basis points to EME bond and credit risk
spreads through the risk-taking channel of exchange rate appreciation.
3.2 Panel VAR analysis
As a robustness check for the results of the daily and monthly predictive regressions, we
assess in this subsection the impact of exchange rate �uctuations on sovereign yields and
bond �ows based on a panel vector autoregression (VAR) analysis. The panel VARs take
24
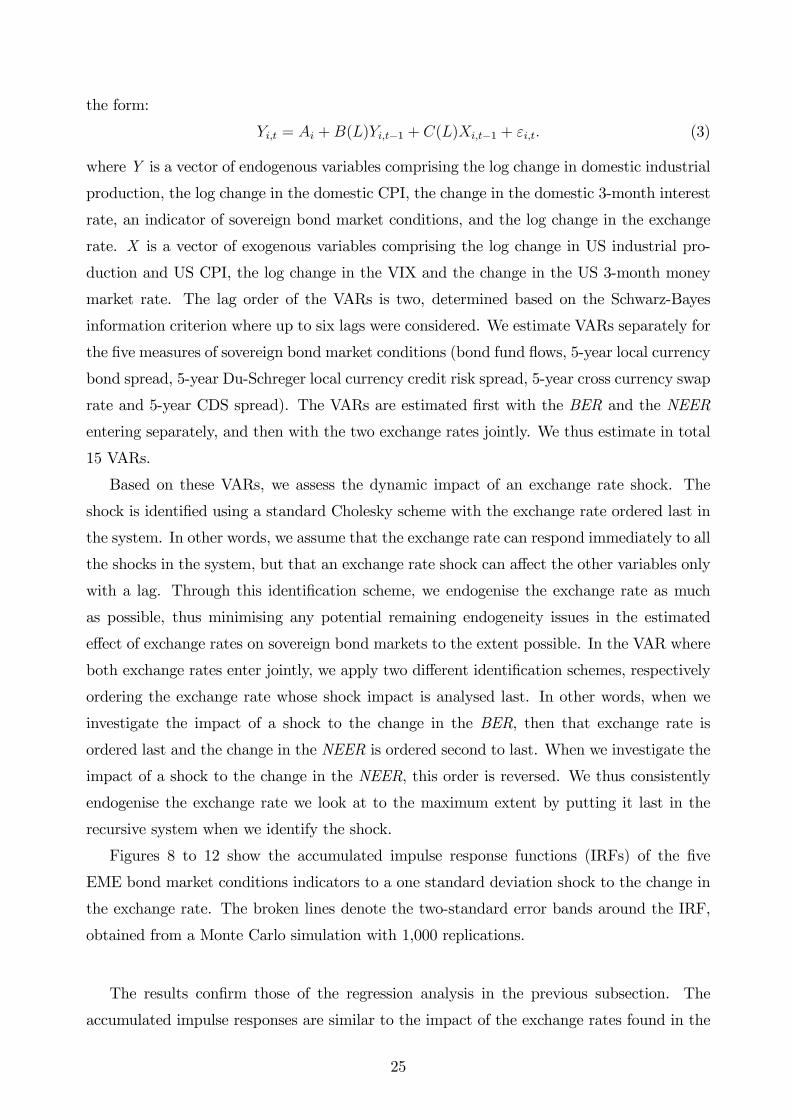
the form:
Yi;t = Ai +B(L)Yi;t�1 + C(L)Xi;t�1 + "i;t: (3)
where Y is a vector of endogenous variables comprising the log change in domestic industrial
production, the log change in the domestic CPI, the change in the domestic 3-month interest
rate, an indicator of sovereign bond market conditions, and the log change in the exchange
rate. X is a vector of exogenous variables comprising the log change in US industrial pro-
duction and US CPI, the log change in the VIX and the change in the US 3-month money
market rate. The lag order of the VARs is two, determined based on the Schwarz-Bayes
information criterion where up to six lags were considered. We estimate VARs separately for
the �ve measures of sovereign bond market conditions (bond fund �ows, 5-year local currency
bond spread, 5-year Du-Schreger local currency credit risk spread, 5-year cross currency swap
rate and 5-year CDS spread). The VARs are estimated �rst with the BER and the NEER
entering separately, and then with the two exchange rates jointly. We thus estimate in total
15 VARs.
Based on these VARs, we assess the dynamic impact of an exchange rate shock. The
shock is identi�ed using a standard Cholesky scheme with the exchange rate ordered last in
the system. In other words, we assume that the exchange rate can respond immediately to all
the shocks in the system, but that an exchange rate shock can a¤ect the other variables only
with a lag. Through this identi�cation scheme, we endogenise the exchange rate as much
as possible, thus minimising any potential remaining endogeneity issues in the estimated
e¤ect of exchange rates on sovereign bond markets to the extent possible. In the VAR where
both exchange rates enter jointly, we apply two di¤erent identi�cation schemes, respectively
ordering the exchange rate whose shock impact is analysed last. In other words, when we
investigate the impact of a shock to the change in the BER, then that exchange rate is
ordered last and the change in the NEER is ordered second to last. When we investigate the
impact of a shock to the change in the NEER, this order is reversed. We thus consistently
endogenise the exchange rate we look at to the maximum extent by putting it last in the
recursive system when we identify the shock.
Figures 8 to 12 show the accumulated impulse response functions (IRFs) of the �ve
EME bond market conditions indicators to a one standard deviation shock to the change in
the exchange rate. The broken lines denote the two-standard error bands around the IRF,
obtained from a Monte Carlo simulation with 1,000 replications.
The results con�rm those of the regression analysis in the previous subsection. The
accumulated impulse responses are similar to the impact of the exchange rates found in the
25
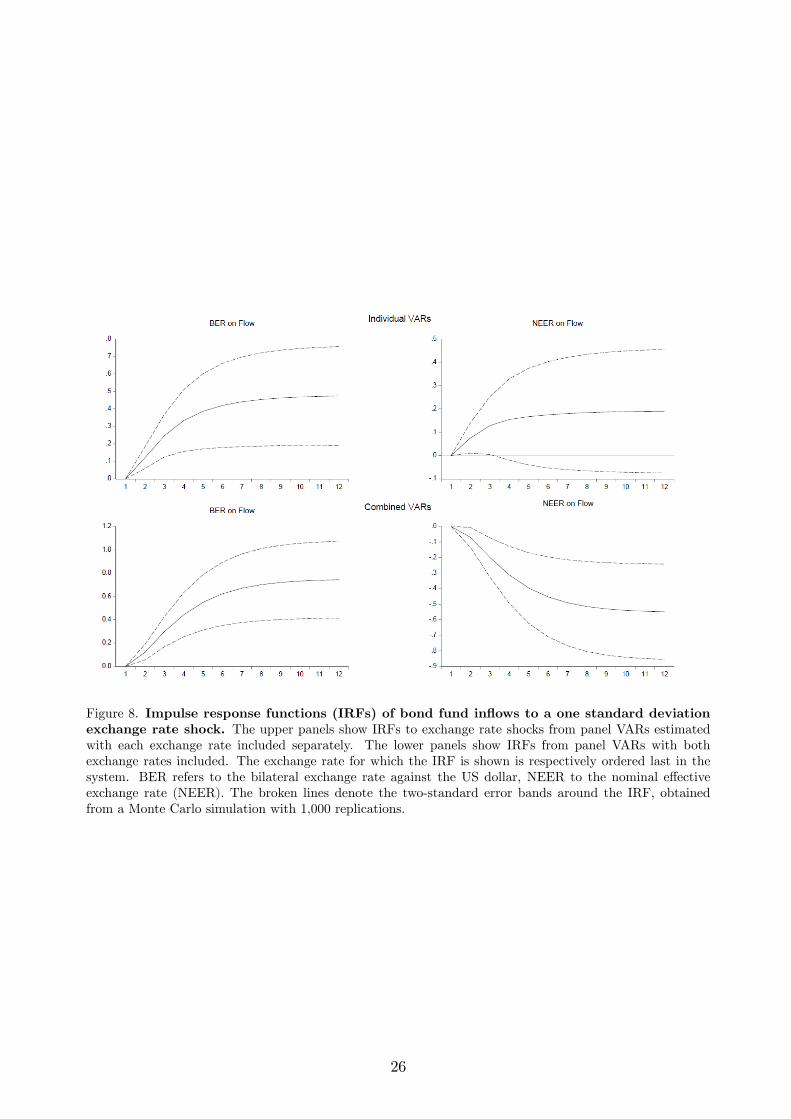
Figure 8. Impulse response functions (IRFs) of bond fund in�ows to a one standard deviationexchange rate shock. The upper panels show IRFs to exchange rate shocks from panel VARs estimatedwith each exchange rate included separately. The lower panels show IRFs from panel VARs with bothexchange rates included. The exchange rate for which the IRF is shown is respectively ordered last in thesystem. BER refers to the bilateral exchange rate against the US dollar, NEER to the nominal e¤ectiveexchange rate (NEER). The broken lines denote the two-standard error bands around the IRF, obtainedfrom a Monte Carlo simulation with 1,000 replications.
26

Figure 9. Impulse response functions (IRFs) of 5-year local currency bond spreads to a onestandard deviation exchange rate shock. The upper panels show IRFs to exchange rate shocks frompanel VARs estimated with each exchange rate included separately. The lower panels show IRFs from panelVARs with both exchange rates included. The exchange rate for which the IRF is shown is respectivelyordered last in the system. BER refers to the bilateral exchange rate against the US dollar, NEER to thenominal e¤ective exchange rate (NEER). The broken lines denote the two-standard error bands around theIRF, obtained from a Monte Carlo simulation with 1,000 replications.
27

Figure 10. Impulse response functions (IRFs) of 5-year local-currency sovereign risk spreads(Du and Schreger (2015)) to a one standard deviation exchange rate shock. The upper panelsshow IRFs to exchange rate shocks from panel VARs estimated with each exchange rate included separately.The lower panels show IRFs from panel VARs with both exchange rates included. The exchange rate forwhich the IRF is shown is respectively ordered last in the system. BER refers to the bilateral exchange rateagainst the US dollar, NEER to the nominal e¤ective exchange rate (NEER). The broken lines denote thetwo-standard error bands around the IRF, obtained from a Monte Carlo simulation with 1,000 replications.
28
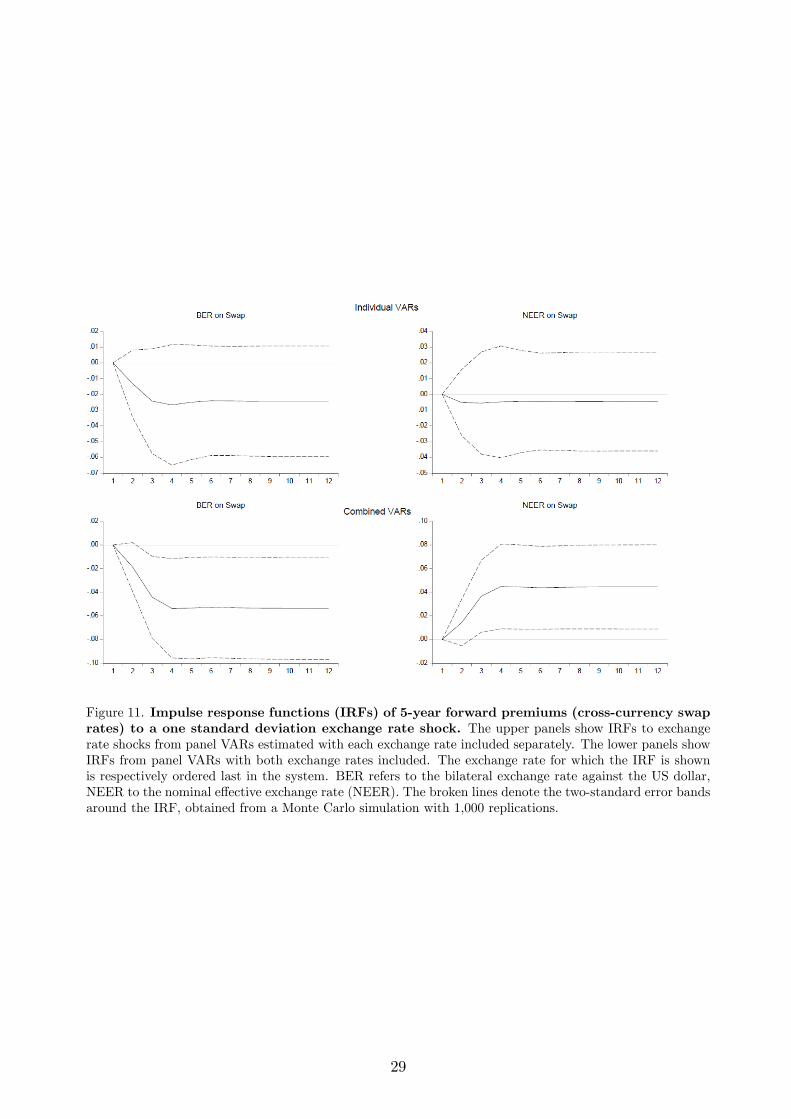
Figure 11. Impulse response functions (IRFs) of 5-year forward premiums (cross-currency swaprates) to a one standard deviation exchange rate shock. The upper panels show IRFs to exchangerate shocks from panel VARs estimated with each exchange rate included separately. The lower panels showIRFs from panel VARs with both exchange rates included. The exchange rate for which the IRF is shownis respectively ordered last in the system. BER refers to the bilateral exchange rate against the US dollar,NEER to the nominal e¤ective exchange rate (NEER). The broken lines denote the two-standard error bandsaround the IRF, obtained from a Monte Carlo simulation with 1,000 replications.
29
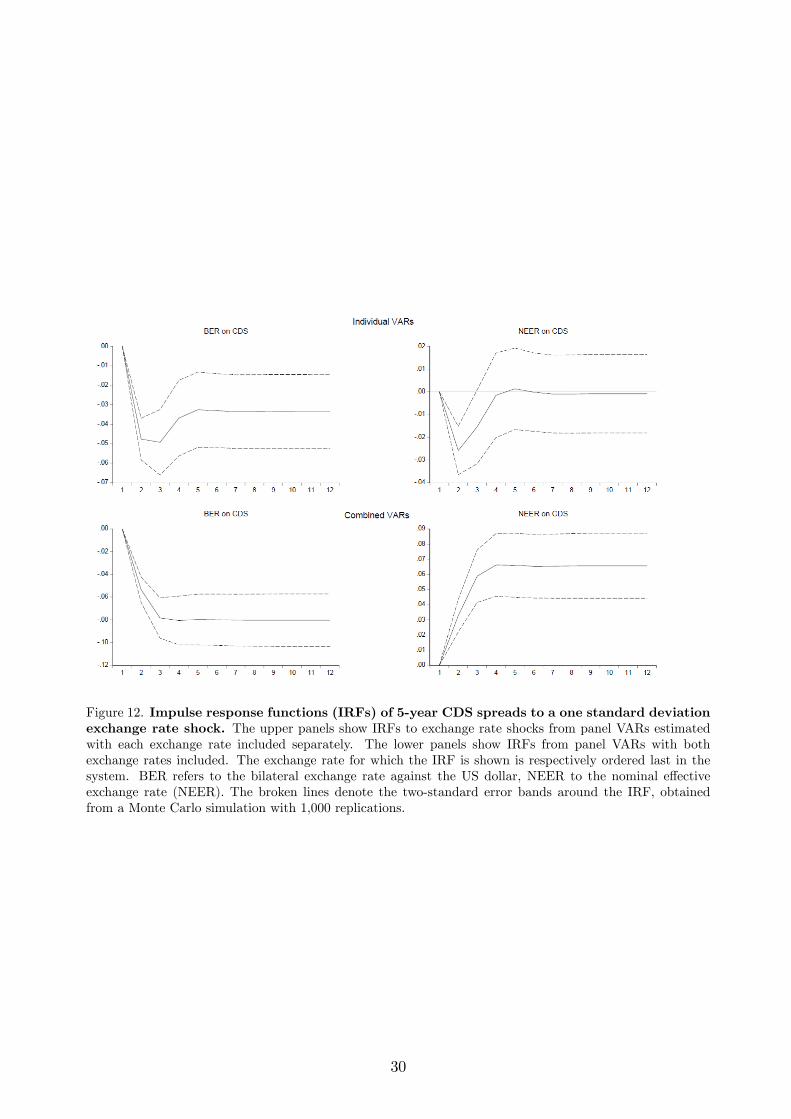
Figure 12. Impulse response functions (IRFs) of 5-year CDS spreads to a one standard deviationexchange rate shock. The upper panels show IRFs to exchange rate shocks from panel VARs estimatedwith each exchange rate included separately. The lower panels show IRFs from panel VARs with bothexchange rates included. The exchange rate for which the IRF is shown is respectively ordered last in thesystem. BER refers to the bilateral exchange rate against the US dollar, NEER to the nominal e¤ectiveexchange rate (NEER). The broken lines denote the two-standard error bands around the IRF, obtainedfrom a Monte Carlo simulation with 1,000 replications.
30

panel regressions. The accumulated e¤ect of a one standard deviation shock to the BER
consistently increases bond �ows and lowers bond and credit risk spreads in a statistically
signi�cant way. Speci�cally, in both the VARs where the two exchange rates enter separately
and in those where both are included, a shock to the BER signi�cantly increases bond �ows
(Figure 8) and signi�cantly lower local currency bond spreads (Figure 9). The magnitudes
of the shock e¤ects are similar to those estimated in the predictive regressions.
The results further show that a shock to the BER consistently lowers credit risk spreads,
both the local currency variant (Figure 10) and the CDS spread (Figure 12). The impact
on the swap rate is not clear cut, with a signi�cant negative impact obtaining only from the
VAR where both exchange rates are included (Figure 11).
The e¤ects of a shock to the NEER goes in the same direction as those of a shock to the
BER when the NEER enters the VAR alone (top right panels in Figures 8�12). However,
when both exchange rates are include in the VAR and innovations to the BER are �ltered
out of the NEER shock, then the impact goes in the opposite direction (bottom right panels
in Figures 8�12). This con�rms the conjecture made above that movements in the NEER
that are unrelated to changes in the BER a¤ect �nancial conditions through standard trade
channels so that an appreciation yields a tightening of �nancial conditions. This contrasts
with the loosening of �nancial conditions that is brought about by an appreciation against
the US dollar as a result of �nancial risk-taking channels.
4 A case study
An alternative way of looking for evidence for a risk-taking channel of currency appreciation
are case studies. This requires �nding an event where the exchange rate changed for exoge-
nous reasons, eg. as a result of a deliberate policy decision. The trajectory of bond �ows
and bond spreads around this date would then be indicative of the presence of a risk-taking
channel. The di¢ culty lies of course in �nding truly exogenous changes in the exchange rate.
One event in our sample that ful�ls this requirement is the People�s Bank of China�s
(PBC) announcement of major changes to its foreign exchange policy on 11 August 2015. In
particular, although the renminbi would continue to trade against the US dollar in a +/�2% daily band, the PBC decided that the central parity around which the band is set would
be determined by the previous day�s closing market rate rather than a preset target rate.
This change led to volatility in the foreign exchange markets. The renminbi slipped by 2.8%
against the US dollar in the two days after the surprise announcement.
This sharp depreciation is an example of a sudden, unexpected and exogenous change in
the bilateral exchange rate of a local currency against the US dollar. The left-hand panel
31

Figure 13. Impact of a depreciation of Chinese yuan on bond spreads and bond fund �ows.
of Figure 13 shows the magnitude of the sudden depreciation of Chinese yuan against the
US dollar. The centre panel shows that bond fund �ows to China has signi�cantly dropped
immediately after the deprecation. Finally, the right-hand panel shows that China�s local
currency government bond spread has also spiked up on 11 August and remained at elevated
levels afterwards.
Overall, therefore, the case study of the PBC�s announcement on 11 August 2015 yields
evidence that is indicative of a risk-taking channel being at work in EME bond markets. Here,
a depreciation of the domestic currency against the US dollar was followed by a signi�cant
drop in bond in�ows and rising sovereign bond spreads.
5 Conclusions
We have explored the risk-taking channel of currency appreciation which stands in contrast
to the traditional Mundell-Fleming analysis of currency appreciation operating through net
exports. Unlike the traditional model, the risk-taking channel can render a currency appre-
ciation expansionary through loosening of monetary conditions. Speci�cally, the risk-taking
channel operates through the balance sheets of both borrowers and lenders. For borrowers
who have net liabilities in dollars, an appreciation of the domestic currency makes borrowers
more creditworthy. In turn, when borrowers become more creditworthy, the lenders �nd
themselves with greater lending capacity.
We have shown that the main predictions of the risk-taking channel are borne out in the
empirical investigation for our spread-based measures of domestic monetary conditions as
32

well as for bond portfolio �ows.
A key implication of the paper is that currency appreciation against the US dollar is
associated with greater bond fund �ows and lower bond spreads as a consequence of lower
credit risk spreads. These e¤ects reverse when the currency depreciates. Together with the
evidence that lower sovereign risk pushes up the exchange rate as reported in earlier studies
(see, eg, Della Corte et al. (2015)), this implies that self-reinforcing feedback loops between
exchange rate appreciation (depreciation) and �nancial easing (tightening) can develop.
Our analysis addresses the procyclicality stemming from portfolio �ows that depend sen-
sitively on tail risk, hence transmit �nancial conditions through global markets. In this
respect, our paper adds to the debate on the cross-border transmission of �nancial con-
ditions, recently galvanised by the �ndings in Rey (2013, 2014) that monetary policy has
cross-border spillover e¤ects on �nancial conditions even in a world of freely �oating curren-
cies. Similarly, Obstfeld (2015) has shown that �nancial globalisation worsens the trade-o¤s
monetary policy faces in navigating among multiple domestic objectives, which makes ad-
ditional tools of macroeconomic and �nancial policy more valuable. The potential spillover
e¤ects may be ampli�ed if EME central banks attempt to insulate domestic �nancial condi-
tions from spillovers by shadowing global policy rates through direct interest rate spillover
e¤ects (Hofmann and Takáts (2015)).
We have not addressed the detailed policy implications of our �ndings here. Broadly,
however, our analysis suggests that attention may be paid to three areas: (i) policy actions
to restrict the degree of valuation mismatch on the balance sheet of corporates, which is
the source of the problem; (ii) ex ante prudential measures on FX exposures to discourage
excessive risk taking during boom periods accompanied by EME local currency appreciation,
such as price-based measures (taxes or capital requirements on FX borrowing) or quantity-
based measures (aiming to slow down the speed of foreign borrowing by corporates and
sovereigns, ie capital �ow management measures targeting banking and bond in�ows); and
(iii) ex post measures during bust periods accompanied by EME local currency depreciation,
such as loosening quantity constraints on foreign borrowing or relaxing price-based measures
to lower borrowing costs.
33
References
Aastveit, Knut Are, Hilde C. Bjornland and Leif Anders Thorsrud (2015): �What drives oilprices? Emerging versus developed economies�, Journal of Applied Econometrics, vol 30(7),pp 1013-1028.
Agénor, Pierre-Richard, Koray Alper and Luiz Pereira da Silva (2014): �Sudden �oods,macroprudential regulation and stability in an open economy�, Journal of InternationalMoney and Finance, vol 48, pp 68�100.
Aghion, Philippe, Philippe Bacchetta and Abhijit Banerjee (2000): �A simple model ofmonetary policy and currency crises�, European Economic Review, vol 44, pp 728�738.
Aghion, Philippe, Philippe Bacchetta and Abhijit Banerjee (2004): �A corporate balance-sheet approach to currency crises�, Journal of Economic Theory, vol 119, pp 6�30.
Akram, Qaiser Farooq (2009): �Commodity prices, interest rates and the dollar�, EnergyEconomics, vol 31, pp 838�851.
Amstad, Marlene, Eli Remolona and Jimmy Shek (2016): �How do global investors di¤er-entiate between sovereign risks? The new normal versus the old�, Journal of InternationalMoney and Finance, forthcoming.
Avdjiev, Stefan, Robert McCauley and Hyun Song Shin (2015): �Breaking free of the triplecoincidence in international �nance�, BIS Working Papers no 526, October.
Bacchetta, Philippe (2012): �Explaining deviations from uncovered interest rate parity�,Chapter 23 in G. Caprio (ed.), Handbook of Safeguarding Global Financial Stability: Political,Social, Cultural, and Economic Theories and Models, Academic Press.
Baskaya, Yusuf Soner, Julian di Giovanni, Sebnem Kalemli-Ozcan, José-Luis Peydró andMehmet Fatih Ulu (2015): �Capital �ows, credit cycle and investment: the role of macro-prudential policy�, paper presented at the CBRT-BIS-IMF conference on MacroprudentialPolicy: E¤ectiveness and Implementation Challenges, Istanbul, 26�27 October 2015.
Bekaert, Geert, Marie Hoerova and Marco Lo Duca (2013): �Risk, uncertainty and monetarypolicy�, Journal of Monetary Economics, vol 60, pp 771�788.
Bellas, Dimitri, Michael Papaioannou and Iva Petrova (2010): �Determinants of emergingmarket sovereign bond spreads: fundamentals vs �nancial stress�, IMF Working PapersWP/10/281, December.
Blanchard, Olivier, Jonathan Ostry, Atish Ghosh and Marcos Chamon (2015): �Are capitalin�ows expansionary or contractionary? Theory, policy implications and some evidence�,NBER Working Paper no 21619.
Borio, Claudio and Philip Lowe (2002): �Assessing the risk of banking crises�, BIS QuarterlyReview, December, pp 43�54.
34

Borio, Claudio and Haibin Zhu (2012): �Capital regulation, risk-taking and monetary policy:a missing link in the transmission mechanism?�Journal of Financial Stability, vol 8(4), pp236�251.
Bruno, Valentina and Hyun Song Shin (2015a): �Cross-border banking and global liquidity�,Review of Economic Studies, vol 82(2), pp 535�564.
Bruno, Valentina and Hyun Song Shin (2015b): �Capital �ows and the risk-taking channelof monetary policy�, Journal of Monetary Economics, vol 71, pp 119�132.
Bussière, Matthieu, Claude Lopez and Cédric Tille (2015): �Do real exchange rate appreci-ations matter for growth?�Economic Policy, January, pp 5�45.
Cerutti, Eugenio, Stijn Claessens and Lev Ratnovski (2014): �Global liquidity and driversof cross-border bank �ows�, IMF Working Papers WP/14/69.
Céspedes, Luis Felipe, Roberto Chang and Andrés Velasco (2004): �Balance sheets andexchange rate policy�, American Economic Review, vol 94(4), pp 1183�1193.
Della Corte, Pasquale, Lucio Sarno, Maik Schmeling and Christian Wagner (2015): �Ex-change rates and sovereign risk�, unpublished manuscript.
Du, Wenxin and Jesse Schreger (2014): �Sovereign risk, currency risk and corporate balancesheets�, unpublished manuscript.
Du, Wenxin and Jesse Schreger (2015): �Local currency sovereign risk�, Journal of Finance,forthcoming.
Feyen, Erik H.B., Swati R. Ghosh, Katie Kibuuka and Suika Farazi (2015): �Global liquidityand external bond issuance in emerging markets and developing economies�, World BankPolicy Research Working Paper WPS7363.
Fleming, J. Marcus (1962): �Domestic �nancial policies under �xed and �oating exchangerates�, IMF Sta¤ Papers, vol 9, pp 369�379.
Gabaix, Xavier and Matteo Maggiori (2015): "International liquidity and exchange ratedynamics", The Quarterly Journal of Economics, vol. 130(3), pp. 1369-1420.
Gadanecz, Blaise, Ken Miyajima and Chang Shu (2014): �Exchange rate risk and localcurrency sovereign bond yields in emerging markets�, BIS Working Papers no 474, December.
Gourinchas, Pierre-Olivier and Maurice Obstfeld (2012): �Stories of the twentieth centuryfor the twenty-�rst�, American Economic Journal: Macroeconomics, vol 4(1), pp 226�265.
Hnatkovska, Viktoria, Amartya Lahiri and Carlos A. Vegh (2016): �The exchange rateresponse to monetary policy innovations�, American Economic Journal: Macroeconomics,forthcoming.
Hofmann, Boris and El½od Takáts (2015): �International monetary spillovers�, BIS QuarterlyReview, September, pp 105�118.
35
Hofmann, Boris, Ilhyock Shim and Hyun Song Shin (2015): �Sovereign yields and the risk-taking channel of currency appreciation�, BIS Working Papers no 538, January.
Kaminsky, Graciela L. and Carmen M. Reinhart (1999): �The twin crises: the causes ofbanking and balance-of-payments problems�, American Economic Review, vol 89, pp 473�500.
Kohlscheen, Emanuel (2014): �The impact of monetary policy on the exchange rate: a highfrequency exchange rate puzzle in emerging economies�, Journal of International Money andFinance, vol 44, pp 69�96.
Krugman, Paul (1999): �Balance sheets, the transfer problem and �nancial crises,� in P.Isard, A. Razin, and A.K. Rose (eds.), International �nance and �nancial crises: essays inhonor of Robert P Flood, Jr. Boston: Kluwer Academic, pp 31�44.
Krugman, Paul (2014): �Currency regimes, capital �ows and crises�, IMF Economic Review,vol 62(4), pp 470�493, Mundell-Fleming Lecture, November 2013.
McCauley, Robert N., Patrick McGuire and Vladyslav Sushko (2015): �Global dollar credit:links to US monetary policy and leverage�, Economic Policy, vol 30(82), pp 187�229, April.
Merton, Robert C. (1974): �On the pricing of corporate debt: the risk structure of interestrates�, Journal of Finance, vol 29, pp 449�470.
Mian, Atif, Amir Su� and Emil Verner (2015): �Household debt and business cycles world-wide�, NBER Working Paper no 21581, September.
Mundell, Robert A. (1963): �Capital mobility and stabilisation policy under �xed and �exibleexchange rates�, Canadian Journal of Economic and Political Science, vol 29(4), pp 475�485.
Morais, Bernardo, José-Luis Peydró and Claudia Ruiz (2015): �The international bank lend-ing channel of monetary policy rates and quantitative easing�, World Bank Policy ResearchWorking Paper WPS7216.
Nickell, Stephen (1981): �Biases in dynamic models with �xed e¤ects�, Econometrica, vol49(6), pp 1417�26.
Obstfeld, Maurice (2015): �Trilemmas and trade-o¤s: living with �nancial globalisation�,BIS Working Papers no 480, January.
Plantin, Guillaume and Hyun Song Shin (2016): �Exchange rates and monetary spillovers�,BIS Working Papers no 537, January.
Pesaran, M. Hashem and Ronald P. Smith (1995): �Estimating long-run relationships fromdynamic heterogeneous panels�, Journal of Econometrics, vol 68(1), pp 79�113.
Reinhart, Carmen M. and Vincent Reinhart (2009): �Capital �ow bonanzas: an encompass-ing view of the past and present�, NBER Macroeconomics Annual, University of ChicagoPress.
36

Rey, Hélène (2013): �Dilemma not trilemma: the global �nancial cycle and monetary policyindependence�, proceedings of the Federal Reserve Bank of Kansas City Economic Sympo-sium at Jackson Hole.
Rey, Hélène (2014): �International channels of transmission of monetary policy and theMundellian trilemma�, Mundell-Fleming Lecture at the �fteenth Jacques Polak Annual Re-search Conference on Cross-Border Spillovers, November 2014.
Shek, Jimmy, Ilhyock Shim and Hyun Song Shin (2015): �Investor redemptions and fundmanager sales of emerging market bonds: how are they related?�BIS Working Papers no509, August.
Sobrun, Jhuvesh and Philip Turner (2015): �Bond markets and monetary policy dilemmasfor the emerging markets�, BIS Working Papers no 508, August.
Vasicek, Oldrich (2002): �The Distribution of Loan Portfolio Value�Risk, December,http://www.moodyskmv.com/conf04/pdf/papers/dist_loan_port_val.pdf
37
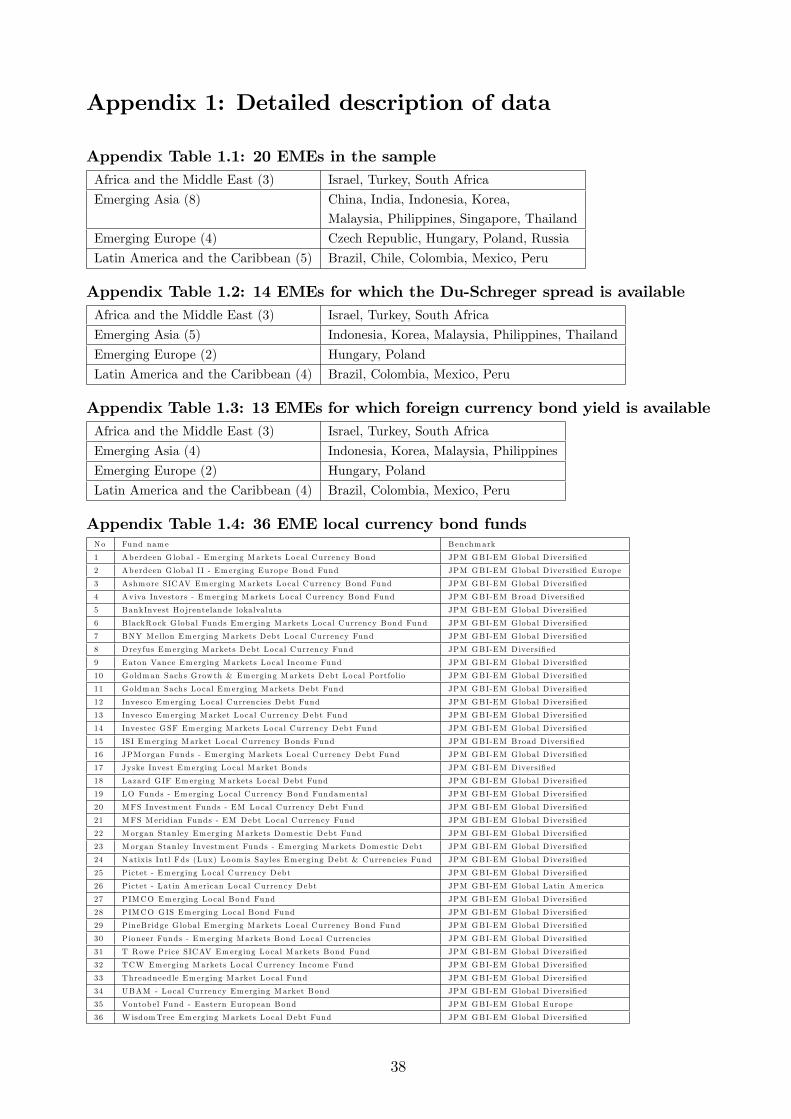
Appendix 1: Detailed description of data
Appendix Table 1.1: 20 EMEs in the sampleAfrica and the Middle East (3) Israel, Turkey, South Africa
Emerging Asia (8) China, India, Indonesia, Korea,
Malaysia, Philippines, Singapore, Thailand
Emerging Europe (4) Czech Republic, Hungary, Poland, Russia
Latin America and the Caribbean (5) Brazil, Chile, Colombia, Mexico, Peru
Appendix Table 1.2: 14 EMEs for which the Du-Schreger spread is availableAfrica and the Middle East (3) Israel, Turkey, South Africa
Emerging Asia (5) Indonesia, Korea, Malaysia, Philippines, Thailand
Emerging Europe (2) Hungary, Poland
Latin America and the Caribbean (4) Brazil, Colombia, Mexico, Peru
Appendix Table 1.3: 13 EMEs for which foreign currency bond yield is availableAfrica and the Middle East (3) Israel, Turkey, South Africa
Emerging Asia (4) Indonesia, Korea, Malaysia, Philippines
Emerging Europe (2) Hungary, Poland
Latin America and the Caribbean (4) Brazil, Colombia, Mexico, Peru
Appendix Table 1.4: 36 EME local currency bond fundsNo Fund name Benchmark
1 Aberdeen G lobal - Emerging Markets Local Currency Bond JPM GBI-EM G lobal D iversi�ed
2 Aberdeen G lobal I I - Emerging Europ e Bond Fund JPM GBI-EM G lobal D iversi�ed Europ e
3 Ashmore SICAV Emerging Markets Lo cal Currency Bond Fund JPM GBI-EM G lobal D iversi�ed
4 Aviva Investors - Emerging Markets Local Currency Bond Fund JPM GBI-EM Broad D iversi�ed
5 BankInvest Ho jrentelande lokalvaluta JPM GBI-EM G lobal D iversi�ed
6 B lackRock G lobal Funds Emerging Markets Lo cal Currency Bond Fund JPM GBI-EM G lobal D iversi�ed
7 BNY Mellon Emerging Markets Debt Local Currency Fund JPM GBI-EM G lobal D iversi�ed
8 Dreyfus Emerging Markets Debt Local Currency Fund JPM GBI-EM Diversi�ed
9 Eaton Vance Emerging Markets Local Incom e Fund JPM GBI-EM G lobal D iversi�ed
10 Goldman Sachs G rowth & Emerging Markets Debt Local Portfo lio JPM GBI-EM G lobal D iversi�ed
11 Goldman Sachs Local Emerging Markets Debt Fund JPM GBI-EM G lobal D iversi�ed
12 Invesco Emerging Local Currencies Debt Fund JPM GBI-EM G lobal D iversi�ed
13 Invesco Emerging Market Lo cal Currency Debt Fund JPM GBI-EM G lobal D iversi�ed
14 Investec GSF Emerging Markets Lo cal Currency Debt Fund JPM GBI-EM G lobal D iversi�ed
15 ISI Emerging Market Lo cal Currency Bonds Fund JPM GBI-EM Broad D iversi�ed
16 JPMorgan Funds - Emerging Markets Local Currency Debt Fund JPM GBI-EM G lobal D iversi�ed
17 Jyske Invest Emerging Local M arket Bonds JPM GBI-EM Diversi�ed
18 Lazard G IF Emerging Markets Lo cal Debt Fund JPM GBI-EM G lobal D iversi�ed
19 LO Funds - Emerging Local Currency Bond Fundamental JPM GBI-EM G lobal D iversi�ed
20 MFS Investm ent Funds - EM Local Currency Debt Fund JPM GBI-EM G lobal D iversi�ed
21 MFS Merid ian Funds - EM Debt Local Currency Fund JPM GBI-EM G lobal D iversi�ed
22 Morgan Stan ley Emerging Markets Domestic Debt Fund JPM GBI-EM G lobal D iversi�ed
23 Morgan Stan ley Investm ent Funds - Emerging Markets Domestic Debt JPM GBI-EM G lobal D iversi�ed
24 Natix is Intl Fds (Lux) Loom is Sayles Emerging Debt & Currencies Fund JPM GBI-EM G lobal D iversi�ed
25 P ictet - Emerging Local Currency Debt JPM GBI-EM G lobal D iversi�ed
26 P ictet - Latin American Local Currency Debt JPM GBI-EM G lobal Latin America
27 PIMCO Emerging Local Bond Fund JPM GBI-EM G lobal D iversi�ed
28 PIMCO GIS Emerging Local Bond Fund JPM GBI-EM G lobal D iversi�ed
29 P ineBridge G lobal Emerging Markets Local Currency Bond Fund JPM GBI-EM G lobal D iversi�ed
30 P ioneer Funds - Emerging Markets Bond Local Currencies JPM GBI-EM G lobal D iversi�ed
31 T Rowe Price SICAV Emerging Local M arkets Bond Fund JPM GBI-EM G lobal D iversi�ed
32 TCW Emerging Markets Local Currency Incom e Fund JPM GBI-EM G lobal D iversi�ed
33 Threadneed le Emerging Market Lo cal Fund JPM GBI-EM G lobal D iversi�ed
34 UBAM - Local Currency Emerging Market Bond JPM GBI-EM G lobal D iversi�ed
35 Vontob el Fund - Eastern Europ ean Bond JPM GBI-EM G lobal Europ e
36 W isdomTree Emerging Markets Local Debt Fund JPM GBI-EM G lobal D iversi�ed
38

Appendix Table 1.5: Description of variables used in regression analysesVariab le Description Unit Sources
Lo cal currency 5-year lo cal currency sovereign Percentage p oints B lo omberg, Datastream ,
b ond spread bond yields over 5-year US G lobal F inancia l Data,
Treasury yield national data
CDS spread 5-year US dollar sovereign CDS spread Percentage p oints Markit
Foreign currency EMBI country-level y ield over Percentage p oints Datastream ,
b ond spread 5-year US Treasury yield JP Morgan Chase
Du-Schreger 5-year lo cal currency bond yield Percentage p oints Du and Schreger (2015):
spread over a synthetic risk-free rate calcu lated �Local currency sovereign
as the US Treasury yield adjusted for risk�
the forward currency prem ium
constructed from cross-currency and
interest rate swap rates
V IX CBOE volatility index Percentage p oints B lo omberg
CPI CPI in�ation (seas. ad justed) 2000 Q1 = 100 National data
IP Industria l production (seas. ad justed) 2000 Q1 = 100 National data
IR 3-month money market rate Per cent B loomberg, Datastream ,
IMF International F inancia l
Statistics, national data
BER Exchange rate against the US dollars p er un it National data
US dollar of lo cal currency
NEER Nom inal e¤ective exchange rate, broad 2000 Q1 = 100 National data
index
39