sovereign default risk and relative · pdf...
TRANSCRIPT
See Appendix A-1 for Analyst Certification, Important Disclosures and non-US research analyst disclosures. Citi Research is a division of Citigroup Global Markets Inc. (the "Firm"), which does and seeks to do business with companies covered in its research reports. As a result, investors should be aware that the Firm may have a conflict of interest that could affect the objectivity of this report. Investors should consider this report as only a single factor in making their investment decision.
24 December 2013 34 pages Global
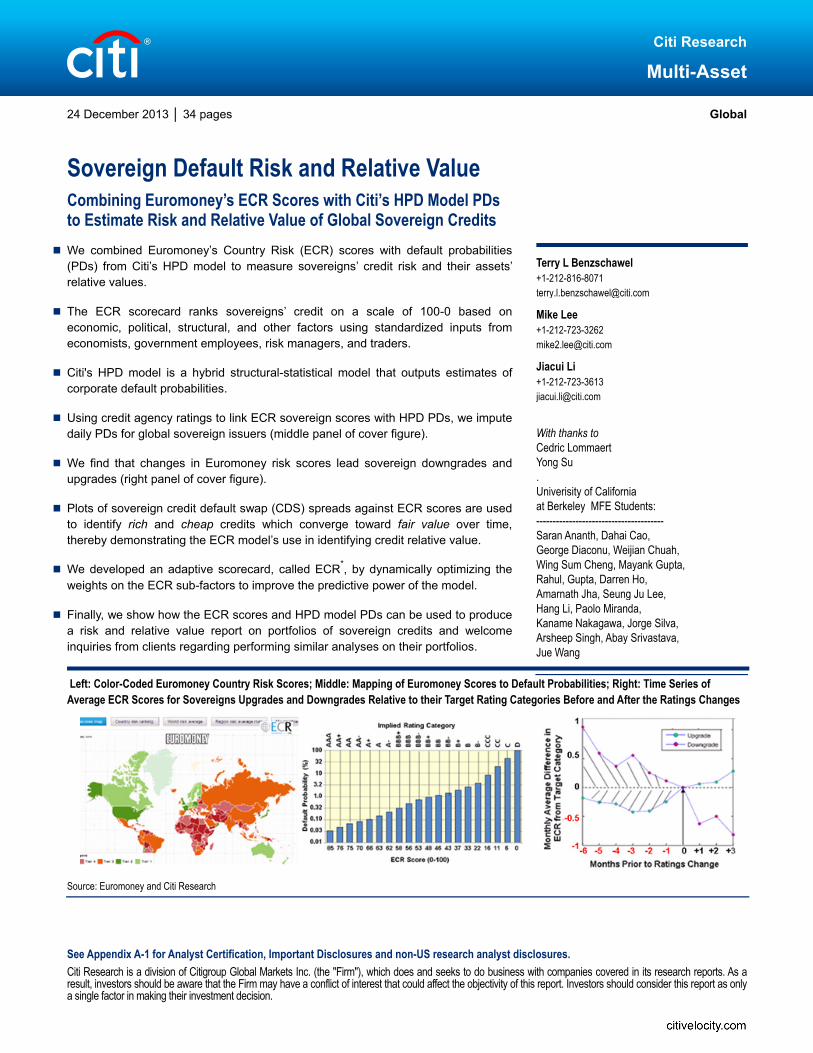
Sovereign Default Risk and Relative Value Combining Euromoney’s ECR Scores with Citi’s HPD Model PDs to Estimate Risk and Relative Value of Global Sovereign Credits We combined Euromoney’s Country Risk (ECR) scores with default probabilities (PDs) from Citi’s HPD model to measure sovereigns’ credit risk and their assets’ relative values.
The ECR scorecard ranks sovereigns’ credit on a scale of 100-0 based on economic, political, structural, and other factors using standardized inputs from economists, government employees, risk managers, and traders.
Citi's HPD model is a hybrid structural-statistical model that outputs estimates of corporate default probabilities.
Using credit agency ratings to link ECR sovereign scores with HPD PDs, we impute daily PDs for global sovereign issuers (middle panel of cover figure).
We find that changes in Euromoney risk scores lead sovereign downgrades and upgrades (right panel of cover figure).
Plots of sovereign credit default swap (CDS) spreads against ECR scores are used to identify rich and cheap credits which converge toward fair value over time, thereby demonstrating the ECR model’s use in identifying credit relative value.
We developed an adaptive scorecard, called ECR*, by dynamically optimizing the weights on the ECR sub-factors to improve the predictive power of the model.
Finally, we show how the ECR scores and HPD model PDs can be used to produce a risk and relative value report on portfolios of sovereign credits and welcome inquiries from clients regarding performing similar analyses on their portfolios.
Left: Color-Coded Euromoney Country Risk Scores;; Middle: Mapping of Euromoney Scores to Default Probabilities;; Right: Time Series of Average ECR Scores for Sovereigns Upgrades and Downgrades Relative to their Target Rating Categories Before and After the Ratings Changes
Source: Euromoney and Citi Research
Citi Research
Multi-Asset
Terry L Benzschawel +1-212-816-8071 [email protected]
Mike Lee +1-212-723-3262 [email protected]
Jiacui Li +1-212-723-3613 [email protected]
With thanks to Cedric Lommaert Yong Su . Univerisity of California at Berkeley MFE Students: --------------------------------------- Saran Ananth, Dahai Cao, George Diaconu, Weijian Chuah, Wing Sum Cheng, Mayank Gupta, Rahul, Gupta, Darren Ho, Amarnath Jha, Seung Ju Lee, Hang Li, Paolo Miranda, Kaname Nakagawa, Jorge Silva, Arsheep Singh, Abay Srivastava, Jue Wang

Sovereign Default Risk and Relative Value 24 December 2013 Citi Research
2
Executive Summary 3 Sovereign Default Risk and Relative Value 4 The Problem of Estimating PDs for Sovereign Debt Issuers 4 The Euromoney Country Risk Score (ECR) 7
The ECR Scorecard 8 How the ECR System Works 8 The Ultimate Output: ECR Country and Factor Scores 10
Converting ECR Scores to Probabilities of Default (PDs) 10 ECR Scores and Agency Rating Changes 13 ECR Scores and CDS Relative Value 16
Investment-Grade and High Yield CDS Trades 20 Long/Short CDS Trades on WGBI Sovereigns 21
Toward An Adaptive ECR Model, ECR* 22 Analyzing Risk and Relative Value of Sovereign Portfolios 24 Summary 26 References 27 Appendix I: The ROC Curve 29 Appendix A-1 30
Contents

Sovereign Default Risk and Relative Value 24 December 2013 Citi Research
3
We combined the Euromoney Country Risk (ECR) model with default probabilities (PDs) from Citi’s Hybrid Probability of Default model (HPD) to construct a model for estimating default risk, credit momentum, and relative value for global sovereign debt issuers. The ECR scorecard employs crowd sourcing technology, taking inputs in a standardized format from a combination of over 400 economists, government officials, risk managers, and traders worldwide. These “experts” provide ratings on sovereigns’ economic, political, and structural factors to generate a composite ECR score, ranging from 100 (best) to 0 (default). We took sovereigns’ ECR scores, and using common agency credit ratings as a type of “Rosetta Stone,” constructed a method for mapping ECR scores to estimated physical default probabilities from Citi’s HPD model.1 This mapping allows us to estimate expected losses on portfolios of sovereign credits and evaluate countries' credit momentum. In addition, by regressing credit default swap (CDS) spreads on HPD model PDs derived from Euromoney scores, we identify potential “rich” and “cheap” assets.
The report begins by describing difficulties in estimating physical default probabilities for sovereigns within previously published frameworks. Then we describe in detail our methods for converting ECR scores to default probabilities and how to use those PDs for estimating risk and relative value of sovereign credits. In addition, we report validation studies regarding the ability of the ECR scores to (1) anticipate agency credit rating upgrades and downgrades, and (2) predict CDS spread widening and tightening. That is, we demonstrate that changes in ECR scores precede changes in sovereign credit ratings and that, on average, sovereign CDS identified as “rich” tend to “cheapen” and “cheap” CDS typically “richen." We also show that, based on our results, the inputs to the ECR scorecard can be optimized to perform even better by adjusting the weights on the various country risk factors with respect to model predictions of changes in agency credit ratings.
Finally, we present an example of a risk and relative value analysis on a subset of global sovereign debt issuers. More generally, we can embed the combined ECR scores and HPD PDs into a comprehensive reporting system to assess credit risk, relative value, credit momentum, and value-at-risk on sovereign credit portfolios. Citi Research has entered into a licensing agreement with Euromoney which enables us to provide our risk and relative value analyses on clients’ sovereign portfolios.
1 The term “Rosetta Stone” The term is used idiomatically to describe a key to the process of deciphering encoded information (Oxford English Dictionary, 2011). The actual Rosetta stone is an Egyptian text issued in 196 BC on behalf of King Ptolemy V. Since the same decree appears on the stone in three scripts (e.g., Ancient Egyptian hieroglyphs, Demotic script, and Ancient Greek), it provided the key to the modern understanding of Egyptian hieroglyphs.
Executive Summary

Sovereign Default Risk and Relative Value 24 December 2013 Citi Research
4
The Problem of Estimating PDs for Sovereign Debt Issuers Although models for estimating physical default probabilities (PDs) for corporate borrowers abound,2 estimating PDs for sovereign issuers has proven problematic. Although agency ratings for sovereign debt issues are useful for some applications, their use has several shortcomings. First, as shown in the top panel of Figure 1, agency ratings tend to lag market perceptions of credit quality as embodied in credit spreads. That is, bonds’ yield spreads over US Treasuries of corporations being upgraded and downgraded move toward averages of their target rating categories months before the changes, with spreads already at their target averages at the time of the ratings change. Second, even if ratings are correct, the fact that default rates vary with the credit cycle (see middle panel of Figure 1) limit the usefulness of rating category historical average default rates for estimating PDs.
Figure 1. Problems with Agency Ratings and Risk-Neutral Methods for Estimating PDs. Left: Relative Spreads of Credits Prior to a Ratings Change;; Middle: Annual High Yield Default Rates, 1970-2012;; and Right: Five-Year Physical (Historical) and Risk-Neutral Default Probabilities by Rating Category, 27-Apr-09
Source: Citi Research
The aforementioned problems with agency ratings have caused many to favor the use of risk-neutral default probabilities calculated from credit spreads using variants of the formula:
= , (1)
where is the cumulative default probability of a bond of duration , is the yield spread over the risk-free rate, and is the recovery rate in default. The risk-neutral method has gained popularity since, except for the necessity of assuming a value for the recovery value, , one only requires information from credit spreads and bond indicative data to derive obligors’ PDs. In particular, the risk-neutral model has proven useful for hedging credit portfolios, especially CDS and structured credit products. Nevertheless, as shown in the right panel of Figure 1, risk-neutral probabilities are consistently higher than historical default rates, as they include the credit risk premium (Elton, Gruber, Agrawal, and Mann, 2001).3 Furthermore, risk-neutral PDs, being a logarithmic transformation of market-based credit spreads, provide little information as to whether the assets are trading rich or cheap given their risk-reward profiles.
2 See Benzschawel (2012) for a detailed treatment of many of those models (and even that list is not exhaustive). 3 The “credit risk premium” is the excess yield over that required to compensate investors for expected losses from default (i.e., the spread necessary for an expected break-even return with a US Treasury of similar maturity). For example, that is the difference between the two curves in the right panel of Figure 1. See Benzschawel and Lee (2011) for a description of the calculation of the risk premium and Lee and Benzschawel (2013) for its historical time series.
Sovereign Default Risk and Relative Value
Many models exist for estimating physical PDs for corporate borrowers, but estimating PDs for sovereign credits has proven difficult.
Figure 2. The Merton Structural Model
Source: Citi Research
Sovereign Default Risk and Relative Value 24 December 2013 Citi Research
5
Merton’s (1974) structural model (see Figure 2) has proved useful for assessing credit risk and relative value for corporate credits (Benzschawel, 2012). Within this view, the equity holders are long a call option on the assets of the firm with the strike at the level of the debt. Conversely, the debt holders have invested in a risk-free bond equal to the face value of the debt, but have sold a put option to the equity holders at the par value of the debt, thereby accounting for the spread premium to U.S. Treasuries.4
Despite some successes, particularly in signaling credit relative value,5 the structural model has been criticized as (1) being too simplistic to describe firms experiencing deteriorating credit quality;; (2) requiring ad hoc calibration of model outputs to historical default rates, and (3) each aspect of the Merton model (e.g., estimating the default boundary, asset diffusion process, option pricing, asset volatility, to name a few) has been challenged and modified. Also, despite its influence in academic circles, the Merton framework has not found wide usage in broker/dealer applications, which overwhelmingly favor the risk-neutral approach. Criticisms and lack of general acceptance aside, structural models are limited in assessing sovereign risk since they require that obligors have public financials and tradable equity. Since sovereigns do not have tradable equity, it is not possible to generate PDs from structural credit models. Gray, Merton, and Bodie (2007) have attempted to extend the structural framework to estimate sovereign PDs. Despite its attractiveness from a theoretical perspective, the assumptions required are numerous, somewhat arbitrary, and complex. Thus far, that model has met with little acceptance by credit practitioners.
Figure 3. Market-implied PD Model Showing: Left: Separation of Default and Non-Default Related Spread;; Middle: Estimation of the Daily Risk Premium;; and Right: Determining Market-Implied PD from Bonds Spreads and Volatilities
Source: Citi Research
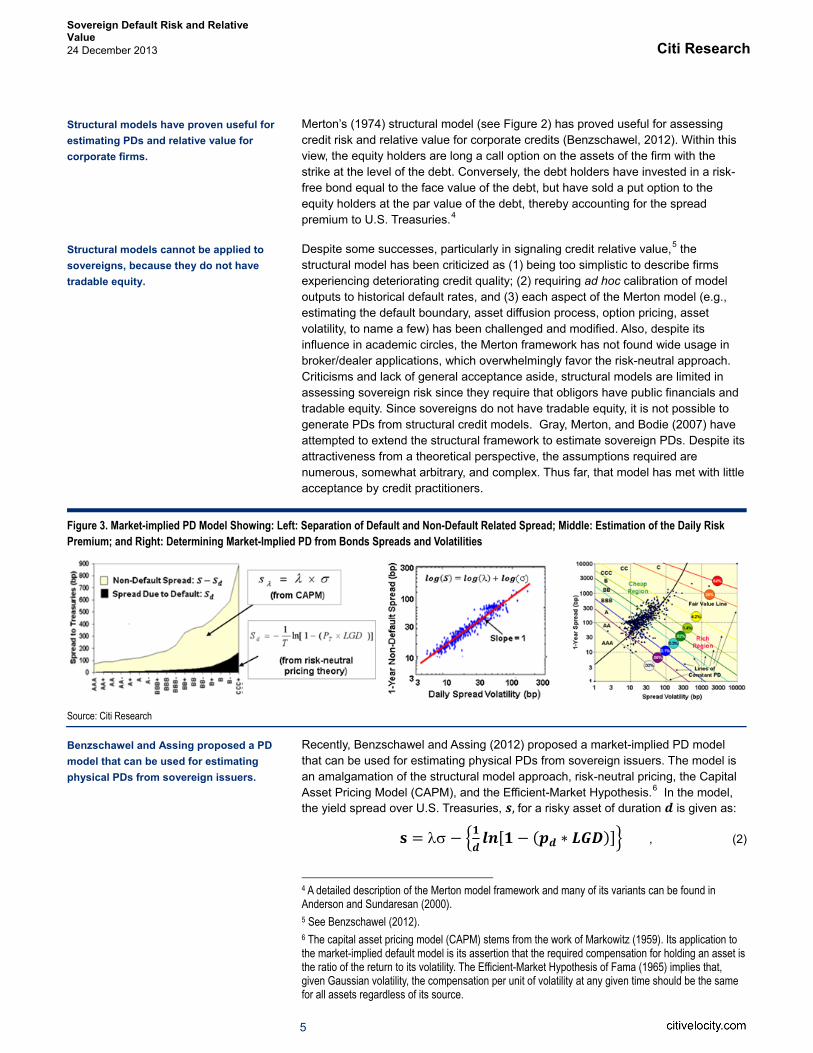
Recently, Benzschawel and Assing (2012) proposed a market-implied PD model that can be used for estimating physical PDs from sovereign issuers. The model is an amalgamation of the structural model approach, risk-neutral pricing, the Capital Asset Pricing Model (CAPM), and the Efficient-Market Hypothesis.6 In the model, the yield spread over U.S. Treasuries, , for a risky asset of duration is given as:
= [ ( )] , (2)
4 A detailed description of the Merton model framework and many of its variants can be found in Anderson and Sundaresan (2000). 5 See Benzschawel (2012). 6 The capital asset pricing model (CAPM) stems from the work of Markowitz (1959). Its application to the market-implied default model is its assertion that the required compensation for holding an asset is the ratio of the return to its volatility. The Efficient-Market Hypothesis of Fama (1965) implies that, given Gaussian volatility, the compensation per unit of volatility at any given time should be the same for all assets regardless of its source.
Structural models have proven useful for estimating PDs and relative value for corporate firms.
Structural models cannot be applied to sovereigns, because they do not have tradable equity.
Benzschawel and Assing proposed a PD model that can be used for estimating physical PDs from sovereign issuers.

Sovereign Default Risk and Relative Value 24 December 2013 Citi Research
6
where is the daily spread volatility of the asset, is the cumulative default probability to time , is the loss given default, and is the daily risk premium (i.e., the average amount of spread charged by the market per unit of volatility). That is, as shown in the right panel of Figure 3, the yields spread over Treasuries is composed of two parts: the compensation for taking on spread volatility, in Equation 2, and the compensation for not receiving the cash flows owing to default (i.e., given by the remainder of the expression on the right-hand side of Equation 2). As described in Benzschawel and Lee (2011), the value of is estimated daily by subtracting the spread due to default using values of from Citi’s HPD model (Sobehart and Keenan, 2002, 2003), and fitting a line of slope 1.0 to the log of the non-default spread as a function of the log volatility as shown in the middle panel of Figure 3.7 Given the daily value of and a bond’s current spread and a three-to-five month series of daily spreads, we can determine the market-implied PD by assuming a value for and solving for in Equation 2.
The main advantage of the market-implied model is that one can estimate physical default probabilities for sovereign and municipal issuers, as well as private firms, from short histories of their bond spreads. There are other attractive features as well. First, as shown Figure 4, the model can be used to track daily levels and changes in the credit risk premium (i.e., the average number of basis points of spread per unit of daily spread volatility), thereby providing information on the current compensation for taking on uncertainty of returns. In addition, by plotting countries’ CDS spreads against their market-implied PDs (see Figure 5), CDS with premiums above the best-fit line are suggested as trading wide or cheap, and those trading below are rich or tight. Finally, we have used the market-implied PD model to construct a PD-weighted version of Citi’s World Government Bond Index (Benzschawel and Hawker, 2012).
Figure 5. Credit Default Swap Spreads versus Market-Implied PDs for Major Global Sovereign Debt Issuers, 1-Nov-13
Source: Citi Research and Markit Partners Ltd.
7 Although slopes of best fit lines to (log s , log s) are close, but not always, 1.0, we impose the 1.0 slope constraint to ensure a constant risk premium per unit of volatility regardless of spread magnitude.
Figure 4. The Credit Risk Premium, Jan-94 to Nov-13
Source: Citi Research

Sovereign Default Risk and Relative Value 24 December 2013 Citi Research
7
Despite these successes, the market-implied PD framework has not been tested in a relative value context and, nor is it optimized for that purpose in its current implementation. Furthermore, since the model takes data from the bond market only, it may not provide the spread-leading signals that are provided by structural models, which incorporate information from the equity market. For these reasons, we were anxious to explore alternative methods for estimating sovereign PDs, particularly ones that might provide information not already contained in credit spreads.
The Euromoney Country Risk Score (ECR) Our search for a model of sovereign credit risk that can also be used for estimating asset relative value has led us to a new class of credit model, called crowd sourcing, as embodied in the Euromoney’s Country Risk Score (ECR).8 The ECR score was launched in March of 2011, being the result of the evolution of Euromoney’s Country Risk Rankings, which were introduced in 1994. The ECR score represents the consensus of a network of over 400 economic, political, and country risk experts covering 186 countries. Inputs from those experts along with credit ratings, debt indicators, and access to capital, determine the overall ECR score. Examples of experts and their institutions for the Asia-Pacific region along with their locations appear in Figure 6.
Figure 7. The ECR Scorecard for Sovereign Issuers
Source: Euromoney
8 An overview of the ECR model can be found at www.euromoneycontryrisk.com.
Despite some successes, the market-implied PDs framework has not been tested as a relative value framework.
Figure 6. ECR Asia-Pacific Experts: Economists and Country Risk Managers
Source: Euromoney

Sovereign Default Risk and Relative Value 24 December 2013 Citi Research
8
The ECR Scorecard The ECR scorecard is presented in Figure 7. The ECR score seeks opinions of over 400 experts worldwide on two main dimensions: country risks and qualitative factors, with each contributing 70% and 30%, respectively, to the total score. The top three sections of Figure 7 show country score categories, which consist of expert scores on 15 variables relating to economic, political, and structural factors. The country scores contribute 70% to the total ECR score, with 30% contributions from economic factors and political factors, and a 10% contribution from structural factors. The items in each factor are as follows:
Economic Assessments: Participants rate each country for which they have knowledge from 0-10 across 5 sub factors, each weighed 6%, for a maximum score of 30%. The categories of economic risk scored are as follows: bank stability/ risk;; GNP outlook;; unemployment rate;; government finances;; monetary policy/ currency stability;;
Political Risk: Participants rate each country on which they have knowledge from 0-10 across 6 sub factors, each weighted 5%, for a maximum score 30%. The categories of political risk scored are as follows: corruption;; government non-payments/ non-repatriation;; government stability;; information access/ transparency;; institutional risk;; regulatory and policy environment;;
Structural Risk: Participants rate each country for which they have knowledge from 0-10 across 4 sub factors, each weighted 2.5%, for a maximum score of 10%. The categories of structural risk scored are as follows: demographics;; hard infrastructure;; labor market/ industrial relations;; soft infrastructure.
The remaining 30% contribution is from three qualitative factors (labeled “Other Inputs” in Figure 7): overall credit ratings,9 debt indicators, and access to capital, with each contributing 10% to the ECR score. Unlike the country factors on which all experts opine, only star experts have their scores submitted to the qualitative average. The scores on all of these factors are then added to produce a composite ECR score, which can have a value between 100 and 0, with 100 being nearly devoid of any risk, and 0 being completely exposed to every risk (at or near default).
How the ECR System Works A diagram of the ECR rating system appears in Figure 8. The first stage, the assembling of “experts” appears in the top left panel of the figure. As illustrated in the pie charts at the right in Figure 6, the experts are domiciled all over the globe, not just in major financial centers and their occupations span the financial industry (not just investment banks), government, and academia. This diversification of expert backgrounds is intentional, as Euromoney does not wish to capture sentiment within only one sector of interest, such as financial investors. Rather, the objective of the ECR score is to embody as broad a consensus view of countries prospects as is possible. In addition, the backgrounds of the experts and the countries to which they contribute their views are also available.
The experts input their views into the ECR system using a scorecard rating system. An example of the economic portion of the scorecard appears at the top right in Figure 8. The experts input their views on each sub-factor in a major category using sliders (see figure) to set their ratings on scales of 10 (best) to 0 (worst). A similar
9 The credit rating is a composite of the average of ratings from Fitch, Moody’s, and Standard and Poor’s converted to numerical scales and normalized to the range between 10 (highest) and 0 (default).
The ECR score consists of 70% scores on country risk factors and 30% on qualitative values.
The ECR score is a 100 point scale, with 100 being nearly devoid of any risk, and 0 being completely exposed to every risk.
ECR experts are domiciled worldwide, and their institutional affiliations span the financial industry, government, and academia.
Experts input their views on sub-factors of each of the factor scorecards on scales of 10 (best) to 0 (worst).

Sovereign Default Risk and Relative Value 24 December 2013 Citi Research
9
procedure is used to input ratings for the other factors. Then, for a given country, scores from all the experts assigned to that country are aggregated to produce a country report. An example of that report for Russia in December of 2013 appears in the lower right portion of Figure 8. That report contains the overall county rating, in this example an ECR score of 51.96, along with changes in ECR score, country rank, and information on the number of expert opinions. In addition, the summary provides information on ratings for each of the factors (economic, political, and structural) and their momentum as well as their rating, access to capital, and debt indicators.
Figure 8. How the ECR System Works: A Panel of Experts (Top Left) Inputs Views Via Scorecards (Top Right) That are Aggregated into Country Scores and Summaries (Bottom Right) to Create a Set of Country Scores and Risk Rankings (Bottom Left)
Source: Euromoney and Citi Research
Sovereign Default Risk and Relative Value 24 December 2013 Citi Research
10
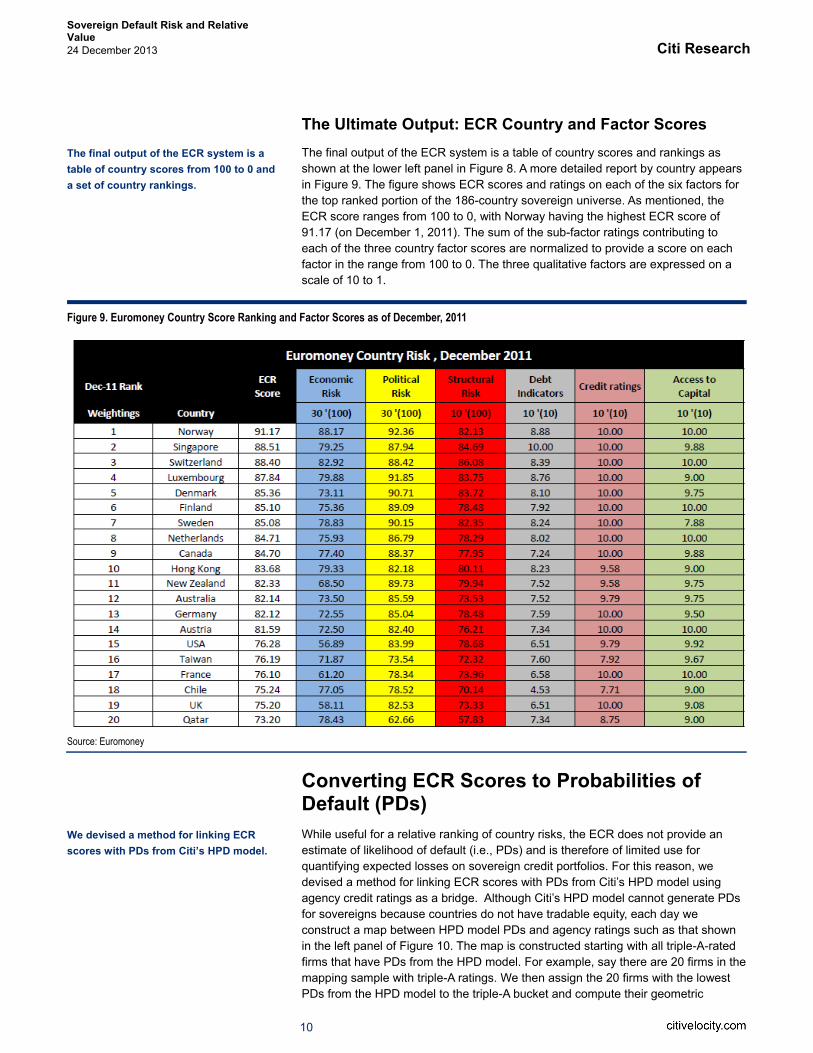
The Ultimate Output: ECR Country and Factor Scores The final output of the ECR system is a table of country scores and rankings as shown at the lower left panel in Figure 8. A more detailed report by country appears in Figure 9. The figure shows ECR scores and ratings on each of the six factors for the top ranked portion of the 186-country sovereign universe. As mentioned, the ECR score ranges from 100 to 0, with Norway having the highest ECR score of 91.17 (on December 1, 2011). The sum of the sub-factor ratings contributing to each of the three country factor scores are normalized to provide a score on each factor in the range from 100 to 0. The three qualitative factors are expressed on a scale of 10 to 1.
Figure 9. Euromoney Country Score Ranking and Factor Scores as of December, 2011
Source: Euromoney
Converting ECR Scores to Probabilities of Default (PDs) While useful for a relative ranking of country risks, the ECR does not provide an estimate of likelihood of default (i.e., PDs) and is therefore of limited use for quantifying expected losses on sovereign credit portfolios. For this reason, we devised a method for linking ECR scores with PDs from Citi’s HPD model using agency credit ratings as a bridge. Although Citi’s HPD model cannot generate PDs for sovereigns because countries do not have tradable equity, each day we construct a map between HPD model PDs and agency ratings such as that shown in the left panel of Figure 10. The map is constructed starting with all triple-A-rated firms that have PDs from the HPD model. For example, say there are 20 firms in the mapping sample with triple-A ratings. We then assign the 20 firms with the lowest PDs from the HPD model to the triple-A bucket and compute their geometric
The final output of the ECR system is a table of country scores from 100 to 0 and a set of country rankings.
We devised a method for linking ECR scores with PDs from Citi’s HPD model.

Sovereign Default Risk and Relative Value 24 December 2013 Citi Research
11
average PD. In the example in Figure 10, that value for the triple-A-rated category is 0.01. Then we proceed to do the same for double-A-plus-rated bonds and so forth, all the way down to single-C. Of course, default is assigned a PD of 100%. Using this method, we can impute a letter rating for all firms scored by the HPD model and those ratings for a given obligor may or may not correspond to those assigned by the rating agencies.10
Figure 10. Left: HPD Model PDs and Imputed Ratings;; Right: Time Series of Average Default Rates from the HPD Model by Rating Category
Source: Citi Research and Standard & Poor’s
One might ask, “Why not just make a map directly between average ECR scores for firms of a given rating category and their average historical default rates?” The answer, illustrated in the right portion of Figure 10 is that average PDs by rating category vary greatly over the credit cycle.11 Thus, we decided to use default rates from the HPD model to assign expected default rates to scores from the ECR system.
The first step in the process of mapping ECR scores to default probabilities is to build a map between the ECR scores on a given day and rating categories. For example, the left panel of Figure 11 shows the mapping derived between credit ratings and ECR scores for August 1, 2013. These values are computed using a method similar to that used to construct the HPD PD versus agency ratings map in Figure 10. That is, we determine the number of triple-A-rated sovereigns in the sample and then assemble the same number of sovereigns with the highest ECR scores;; assume that number is 10 countries. Given the upper bound on the ECR scores is 100, we need only establish the lower bound. This is given by the average ECR score of the 10th and 11th ranked countries, which, in this example is a score of 81. We proceed similarly down the rating categories scale until we get to single-C rated credits. We set the boundary between single-C and default at the average of the ECR score of the lowest single-C sovereign and 0. The right portion of Figure 11 shows how the mapping between ECR scores and ratings evolves over the period of our test from December of 2011 through August of 2013. That relationship has remained very stable over the period despite the fact that the rating agencies have made dozens of rating upgrades and downgrades of sovereign issuers over that period.
10 We have tried other mapping schemes prior to arriving at that mentioned above, including assigning the median PD of all the firms of a given rating class. Over time, we found that the method above not only preserves the distribution of ratings over the calibration universe of thousands of corporate firms, but also gives rise to the most intuitive set of ratings of all prospective methods. 11 Note that, for clarity and consistency, the default rates in Figure 10 are plotted on a logarithmic scale. Although the values shown in the figure are average PDs from the HPD model, they mimic closely average annual default rates provided by the rating agencies.
Historical average default rates do not capture the effects of the credit cycle on expected losses.
We first map ECR scores on a given day to agency rating categories.

Sovereign Default Risk and Relative Value 24 December 2013 Citi Research
12
Figure 11. Map of ECR Score Ranges to Implied Credit Risk Categories, 1-Aug-13;; Right: Monthly ECR Scores Mapped to Implied Credit Risk Categories, Dec-11 to Aug-13
Source: Citi Research, Euromoney, and Standard & Poor’s
At this point, we have a mapping between ECR scores and implied ratings, but we wish to map ECR scores to PDs. The process of inferring PDs for ECS scores proceeds similarly to the ratings mapping. That is, we determine the implied ratings from Figure 11 from our assumed 10 sovereigns with highest ECR scores. Then, we assign each sovereign’s a PD based on its imputed rating from the HPD PD agency ratings map. Next, we take the geometric average of the 10 PDs and assign that PD to the average ECR score of the ten sovereigns. Hence, we associate a PD of 0.03% with the ECR value of 85, and an implied credit rating of triple-A. We call this the ECR-HPD PD. Of course, the fact that the average rating for triple-A is not identical to the 0.016% value of HPD’s triple-As is due to the fact that some non-triple-A sovereigns are ranked in the top 10 of the ECR score universe.
Figure 12. Mapping ECR Scores to Default Probabilities: Left Panels Show Mapping Between HPD and Agency Ratings (Top) and ECR Scores and Agency Ratings (Bottom);; Right: A Three-Way Plot between ECR Scores, HPD PDs and Implied Rating Categories, 1-Aug-11
Source: Citi Research, Euromoney, and Standard & Poor’s
Using the maps between HPD PDs and agency ratings, and between ECR scores and ratings, map between ECR to PDs.

Sovereign Default Risk and Relative Value 24 December 2013 Citi Research
13
ECR Scores and Agency Rating Changes Given that the ECR scores are meant to capture experts’ forward-looking views on the credit prospects of the various sovereigns, we were interested in examining if changes in ECR scores would anticipate sovereigns’ upgrades and downgrades by credit rating agencies. To that end, we acquired monthly agency credit ratings for the143 sovereigns in the ECR scoring system over the sample period from December 2011 through August 2013.12 The sample contained 44 upgrades and 69 downgrades. For each month preceding the upgrade/downgrade for each sovereign, we computed the difference between each sovereign's ECR score and the average ECR score of their target rating category (i.e., the average ECR of the category to which they were being upgraded or downgraded).
Figure 13. Time Series of Average ECR Scores for Sovereigns That Were Upgraded (N=44) and Downgraded (N=69) Relative to Averages of their Target Rating Categories Before and After the Ratings Changes
Source: Citi Research and Euromoney
Figure 13 displays the differences in ECR scores for the upgrades (green circles) and downgrades (red circles) in months relative to that of the upgrade and downgrade (0 on the x-axis).13 The ECR model scores lead agency ratings changes: average ECR scores for upgrades increase prior to the upgrade and scores for downgrades decrease. (Note that the method used to derive the relation between credit spreads and agency ratings Figure 13 is analogous to that the left panel of Figure 1.) Furthermore, as for corporates in Figure 1, in the month of the ratings change, the average sovereign ECR scores for both upgrades and downgrades are at the averages of their target rating categories. Clearly, the ECR scores begin to reflect changes in sovereign credit quality as early as ten months prior to agency rating changes. Notice also that the predictive power of ECR scores
12 A rating change could be triggered by any of the major rating agencies: S&P, Moody’s or Fitch. To avoid double counting, for sovereigns having similar ratings changes in subsequent months, we kept only the scores related to the first ratings change. 13 Note that because the various upgrades and downgrades took place over different periods in the 19-month ECR score sample, their histories do not overlap completely on the graph in Figure 13.
We examined if changes in ECR scores could anticipate rating agency upgrades and downgrades.
Average ECR scores lead agency ratings changes.

Sovereign Default Risk and Relative Value 24 December 2013 Citi Research
14
tends to be asymmetric;; ECR scores appear to predict rating downgrades more effectively that upgrades.
There are several plausible reasons for the asymmetry between upgrades and downgrades. First, since ECR scores and PDs are logarithmically related, the absolute ECR score difference between a given rating category and its neighbors will be greater for the lower rating than for the higher one. Thus, upgrades should have smaller changes in ECR scores than downgrades. Also, note that for corporate upgrades and downgrades in the left panel of Figure 1, ratings upgrades are evident in market spreads 12-24 months before downgrades become evident. Given the small interval (average of nine months) around the upgrades of the sample in Figure 13, it is possible that much of the ECR score improvement for the upgrades has already occurred prior to our sampling period. Finally, note that there is a tendency for some persistence of improving and deteriorating credit quality (persistence of changing ECRs after the upgrade or downgrade), but our sample is too small to test this reliably.
Another way to assess the ability of ECR scores to anticipate ratings changes is to track differential changes in ECR scores for upgrades and downgrades prior to the month of the upgrade. For example, Figure 14 shows averages of three-month changes in ECR scores for upgrades (blue bars) and downgrades (red bars). The average of the three month changes for upgrades is 0.6 and for downgrades is 0.0. The fact the average of three-month ECR changes prior downgrades is zero, yet for upgrades is 0.6, implies that the average ECR scores for global sovereigns improved slightly over the sample period. This is also reflected in the trend in narrowing credit spreads (see below).
We also tracked the dispersion of ECR scores over time for upgraded and downgraded sovereigns relative to their target categories. Those results are displayed in Figure 15 as time series of distributions relative to target category averages as they approach the date of their ratings changes. For both upgrades (left panel) and downgrades (right panel) the distributions of scores are very widely dispersed months prior to the ratings change, but they converge upon the target rating category average (i.e., 0 in the figure) as they near the date of the ratings change.
Figure 15. Pattern of Difference in ECR Scores and Target Rating Categories Relative to Months of Agency Rating Upgrades (Left) and Downgrades (Right)
Source: Citi Research and Euromoney
ECR scores appear to predict rating downgrades more effectively than upgrades.
Figure 14. Densities of 3-Month Changes in ECR Scores Prior to Ratings Upgrades and Downgrades
Source: Citi Research and Euromoney

Sovereign Default Risk and Relative Value 24 December 2013 Citi Research
15
Receiver operating characteristic (ROC) analysis is a powerful tool for assessing the discriminatory power of a system. An ROC is a two-dimensional plot where the proportion of the correct detections or “hits” is plotted on the y-axis as a function of the rate of errors, called “false positives” on the x-axis. As such, a ROC depicts relative trade-offs that a classifier makes between detecting an event, and errors of incorrectly identifying events when none occurs. (A description of the important features of ROC analysis is provided in Appendix I.) In this case, we applied ROC analysis to measure the ability of three-month changes in ECR scores to predict a ratings change within the subsequent three months. Thus, we define the independent variable, the three month change in ECR score, as:
_ = , (3) with the dependent variable being whether or not a ratings change occurred between and + 3. If a rating change occurred, we associate a value of 1 with that _ ;; otherwise, the dependent variable is assigned a value of 0.
Figure 16. ROC Analysis of Ranked _ Predictions of Subsequent Ratings Downgrades and Upgrades in the Following Three Months for Fitch, Moody’s and Standard & Poor’s
Source: Citi Research and Euromoney
To generate the ROCs for upgrades, we first rank the _ values from largest positive to largest negative. For the ROCs for downgrades, we rank values of _ from most negative to largest positive. Then, say for upgrades, we go through the ranked population of _ scores starting from the largest and, for each population criterion, calculate the fraction of “hits.” The hit rate is calculated as the fraction of sovereigns having a value of 1 (an upgrade) associated with values of _ below the criterion to the total upgrades in the sample. Percentages of "hits" are plotted as a function of the rate of "false positives." The false positive rate for upgrades is calculated as the fraction of all sovereigns having
We use ROC analysis to examine if three-month changes in ECR scores anticipate agency rating changes.
The ROCs plot the percentage of “hits” (i.e. downgrades or upgrades) as a function of “false positives” (ratings unchanged) given a ranked ordering of 3-month ECR score changes.

Sovereign Default Risk and Relative Value 24 December 2013 Citi Research
16
values of 0 (i.e., no ratings change) associated with _ values for a given criterion in the ranked population with respect to the total of _ values for sovereigns that are not upgraded.14
The ROC analysis of changes in ranked _ values to predict ratings changes within the following three months appears in Figure 16. ROCs are shown for downgrades (top panels) and upgrades (lower panels) and by rating agency (Fitch, Moody’s, and Standard & Poor’s, respectively), from left to right. The areas under the curves (AOCs) are also shown, with areas above 0.50 indicating discriminatory power of the ECR score. Both visual inspection and areas under the ROC curves indicate that changes in ECR scores better anticipate ratings downgrades than upgrades. While AOCs for downgrades range from 80% for Fitch to 63% for both Moody’s and S&P, AOCs for upgrades are just above chance for Fitch and Moody’s at 54% and 51%, respectively, and 49% for S&P. That AOCs for upgrades are close to chance does not necessarily indicate that ECR scores do not lead upgrades. In fact, inspection of Figure 13 indicates that most of the ECR score changes for upgrades are already completed prior to three months prior to the rating change.
Finally, we evaluate the predictive power the ECR scores with respect to each of the major credit rating agencies. Figure 17 shows AOCs for downgrades (top) and upgrades (bottom) for Fitch, Moody’s and Standard & Poor’s ratings. For downgrades, changes in ECR scores better predict changes in ratings by Fitch at 80%, with anticipation of Moody’s and S&P changes at 63%. Although the pattern is roughly similar for upgrades, difference between AOCs for agencies are small, ranging from 51% for Fitch and Moody’s to 49% for S&P. In fact, the ability to better predict Fitch ratings suggests that Fitch ratings actually lag those of S&P and Moody’s, particularly for credit downgrades.
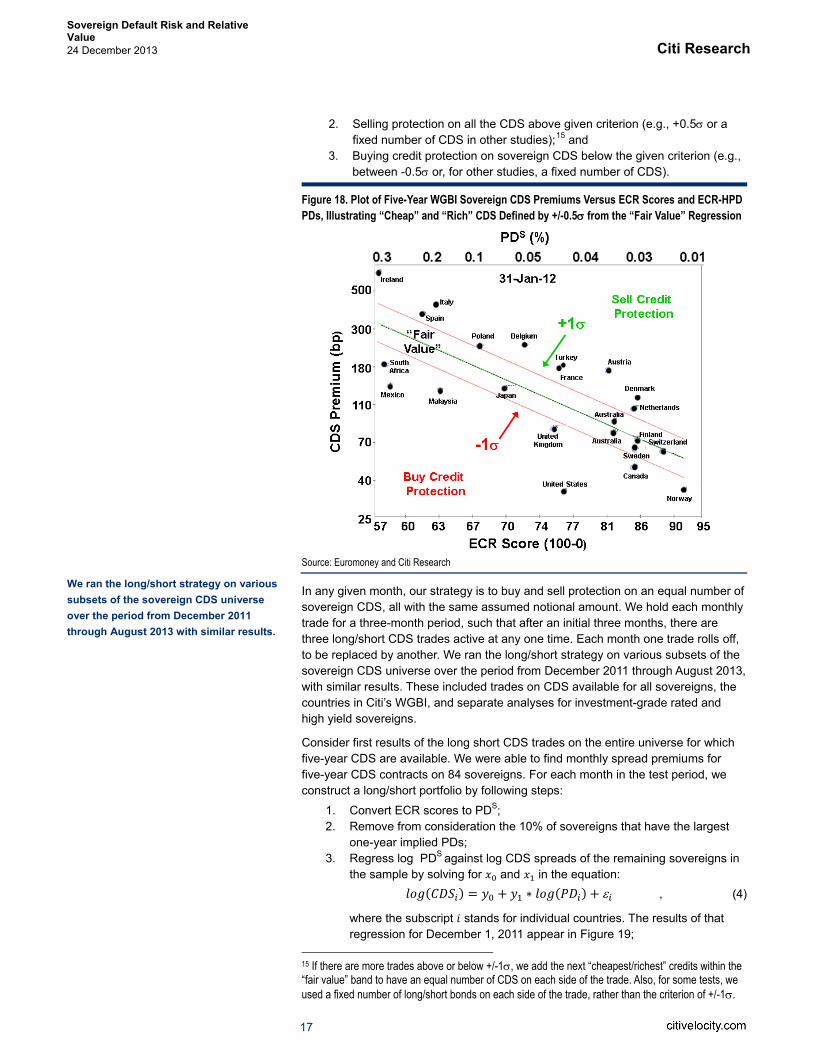
ECR Scores and CDS Relative Value In this section, we present returns from simulated long/short sovereign CDS trades constructed from ECR score-based measures of relative value. The procedure for these trades is similar to that we devised for long/short investment-grade corporate CDS trades based on the HPD model (Benzschawel and Lee, 2012). For example, consider Figure 18 which plots CDS spreads versus ECR scores for sovereigns in Citi’s World Government Bond Index (Citigroup Index, 2012) on January 31, 2012. Corresponding ECR-based inferred PDs from the HPD, denoted PDS for imputed sovereign PD, are plotted on the top axis. Each month, we fit a regression line to five-year CDS spreads versus ECR scores (and/or) PDS, which we define as the “fair value” line. Although points deviate from the line, a linear function provides a good functional form for the relationship between ECR scores or PDS and CDS premiums.
Having defined fair value, CDS spreads that plot above fair value in Figure 18 are inferred to be cheap;; offering investors above average compensation for their credit risk. Conversely, sovereign CDS spreads below the line are rich. Lines of +/-0.5 are chosen to define sell/buy boundaries for short/long CDS trades. In each month, we simulate a long/short CDS trade by:
1. Eliminating from the trade the 10% of the eligible credits with the largest PDS;;
14 Note that for these ROCs, the dependent variable is binary: for sovereigns with ratings changes in the subsequent three months the dependent variable associated with each _ is a “1” and for cases of no ratings change, the variable is a “0”.
ROC analysis indicates that ECR scores are better at identifying potential downgrades than upgrades.
Figure 17. Comparison of Areas Under the ROCs by Rating Agency
Source: Citi Research, Euromoney, Fitch Ratings, Moody’s Investors Service, and Standard and Poor’s
Each month, we simulate a long/short sovereign CDS trade by selling protection on the CDS above +1 and buying protection on CDS below -1 .
Sovereign Default Risk and Relative Value 24 December 2013 Citi Research
17
2. Selling protection on all the CDS above given criterion (e.g., +0.5 or a fixed number of CDS in other studies);;15 and
3. Buying credit protection on sovereign CDS below the given criterion (e.g., between -0.5 or, for other studies, a fixed number of CDS).
Figure 18. Plot of Five-Year WGBI Sovereign CDS Premiums Versus ECR Scores and ECR-HPD PDs, Illustrating “Cheap” and “Rich” CDS Defined by +/-0.5 from the “Fair Value” Regression
Source: Euromoney and Citi Research
In any given month, our strategy is to buy and sell protection on an equal number of sovereign CDS, all with the same assumed notional amount. We hold each monthly trade for a three-month period, such that after an initial three months, there are three long/short CDS trades active at any one time. Each month one trade rolls off, to be replaced by another. We ran the long/short strategy on various subsets of the sovereign CDS universe over the period from December 2011 through August 2013, with similar results. These included trades on CDS available for all sovereigns, the countries in Citi’s WGBI, and separate analyses for investment-grade rated and high yield sovereigns.
Consider first results of the long short CDS trades on the entire universe for which five-year CDS are available. We were able to find monthly spread premiums for five-year CDS contracts on 84 sovereigns. For each month in the test period, we construct a long/short portfolio by following steps:
1. Convert ECR scores to PDS;; 2. Remove from consideration the 10% of sovereigns that have the largest
one-year implied PDs;; 3. Regress log PDS against log CDS spreads of the remaining sovereigns in
the sample by solving for and in the equation: ( ) = + ( ) + , (4)
where the subscript stands for individual countries. The results of that regression for December 1, 2011 appear in Figure 19;;
15 If there are more trades above or below +/-1 , we add the next “cheapest/richest” credits within the “fair value” band to have an equal number of CDS on each side of the trade. Also, for some tests, we used a fixed number of long/short bonds on each side of the trade, rather than the criterion of +/-1 .
We ran the long/short strategy on various subsets of the sovereign CDS universe over the period from December 2011 through August 2013 with similar results.

Sovereign Default Risk and Relative Value 24 December 2013 Citi Research
18
4. Calculate the relative value for each CDS as a z-score using the following:
= ( ) ( ) , (5)
which describes the deviation of each country’s CDS from fair value. The higher a country’s z-score, the cheaper is its CDS, and vice versa;;
5. Construct a long/short portfolio of CDS by selling protection the cheapest 30% of CDS (green points in Figure 19) and buy protection on the richest 30% (the red points);;
6. Finally, for comparison, construct a benchmark portfolio on which we sell protection on the middle 30% names (blue points), equivalent to being long those sovereigns.
After eliminating from consideration the CDS from the 10% riskiest sovereigns, we formed a portfolio of long 23 CDS and short 23 CDS with equal weights. Here we designate $1 million (MM) notional for each CDS. So the total notional for the long/short strategy is $23MM on each side, with the benchmark portfolio having sold $23MM of protection.
There are two sources of profit-and-loss (P/L) from the long/short CDS trades. First, the trades have positive carry that results from buying protection on credits with narrow premiums (i.e., the rich CDS) and selling protection on CDS with higher average premiums (i.e., the cheap CDS). The carry from each long/short trade is:
/ = 0.25 , (6) where is the notional, which is the same for each CDS, is the number of CDS, and are the annual premiums buying and selling protection, respectively.
Premiums on the CDS are paid quarterly (hence the coefficient of 0.25). The other source of P/L is from spread convergence, which is the amount that market premiums increase for CDS on which protection is bought and amount of spread tightening for CDS on which protection is sold. That is, convergence P/L for a single long/short CDS trade on which we buy protection on one CDS and sell protection on one other is calculated as:
/ , . = 01 , , . + 01 , . , , (7)
where 01 is the price value of a 1 basis point (bp) change in CDS spread for a given contract over the three-month period of the trade.16 Of course, for a long/short trade of contracts, the total convergence is:
/ = / , . . (8)
As mentioned, each month we construct a new long/short portfolio and hold that position for three months. Thus, after three months there will be three overlapping trades and we calculate the total performance of the ensemble of three-month long/short rolling trades from December 2011 to August 2013.
A summary of the results of the simulated long/short trades on the universe of sovereign CDS and the benchmark long-only strategy is presented in Figure 20. The left panel shows averages of total cumulative P/L over all trades since December 2011 normalized to the start of each trade at 0. That figure also shows average P/L broken out by carry and convergence. Although, our actual strategy is to unwind each trade after a three-month holding period (the vertical dashes in Figure 20), the plot tracks P/L for the trades beyond their termination date.17 First, it 16 Since all the CDS in the simulation are on-the-run five-year contracts, they will have similar, but not identical values of 01. 17 Since the maximum length of each subsequent monthly trade will decrease, each point on the graph at successively later months is the average of one less trade.
Figure 19. CDS Premiums versus ECR-HPD Default Probabilities, 1-Dec-11
Source: Euromoney, Citi Research and Markit Partners
There are two sources of P/L from the long/short CDS trades: positive carry and convergence to fair value.
The majority of the P/L from the three-month long/short trades comes from convergence of CDS spreads to fair value.

Sovereign Default Risk and Relative Value 24 December 2013 Citi Research
19
is clear that the long/short CDS trades are profitable: the average terminal value at three months is positive. In addition, the plot at the left shows that, although the trades continue to be profitable beyond the three-month holding period, most of the P/L from convergence occurs within the first couple months. This pattern of P/L over time is similar to what we find for long/short CDS trades on corporate issuers and supports our choice of a three-month holding period for each trade.
Figure 20. P/L Analysis from Long/Short ESBI Trades: Left: Average P/L of All Trades Over Time;; Middle: Cumulative P/L for Long/Short Trades and Long-Only Benchmark with 3-Month Holding Periods;; Right: Distribution of Convergence P/L for Long/Short Trades and Spread Tightening for the Long Only Benchmark Trades
Source: Euromoney and Citi Research
The middle panel of Figure 20 displays the cumulative P/L from the series of three-month long/short CDS trades initiated monthly (solid lines). Cumulative P/L from the analogous set of long-only (i.e., just sell protection) on CDS in middle 30% of the relative value diagram is shown using dashed lines. P/L for both long/short and long-only strategies is broken out by total P/L (blue lines), carry (green) and convergence (red), where convergence for the long-only strategy is from spread tightening only. Consider first, the total P/L. Given improvement in the global economy over our test period, the long-only benchmark portfolio is highly profitable, generating roughly 6.5% from December 2011 to August 2013.18 However, total P/L from the long/short CDS trades is almost double the long only, topping 10% over the period.
Both long/short and long-only CDS trades produce consistent positive carry as indicated by the green line and green dashes, respectively, in the middle panel of Figure 20. For the long only strategy, the 2.2% return from carry comes from premiums on the 30% of CDS nearest to fair value. In comparison, positive carry from the three-month long/short CDS trades is 4.0% over the period, reflecting the difference between premiums received from selling protection on cheap CDS over those paid for protection on rich CDS.
The middle panel of Figure 20 also shows P/L from convergence for long/short and long-only strategies. As mentioned, convergence on the long-only trades (the red dashes) corresponds to overall spread tightening of CDS. For a long-only portfolio, over the long run, one would expect little P/L from spread tightening as CDS premiums should fluctuate around their average value. The fact cumulative P/L from spread tightening on the long only trades is 2% (roughly equal to the carry) is indicative of the rally in sovereign CDS spreads over the relatively small sample
18 Recall that at any given time after an initial two months period, there will be three overlapping monthly CDS trades from each strategy. This accounts for the relatively large returns. If the contracts were non-overlapping three month trades the long-only trades would have returned roughly 1.5% per annum and the long/short CDS trades would have returned 2.3% per annum.
The long/short sovereign CDS portfolios outperformed a long-only benchmark by over 3% since late 2011.
P/L from carry on long/short ESBI CDS trades is greater than that from that of the long-only strategy.
Cumulative P/L from convergence for the long/short CDS trades is just over 6%, topping the total P/L for the long only strategy.

Sovereign Default Risk and Relative Value 24 December 2013 Citi Research
20
period available for testing. Cumulative P/L from convergence for the long/short CDS trades (the red line) is just over 6%, topping the total P/L for the long only strategy. Notice that, during the late May selloff in emerging markets, that both the long-only and long/short strategies were unprofitable, but both rebounded rapidly, catching up to trend P/L growth shortly thereafter.
The right panel of Figure 20 presents frequency distributions of convergence P/L for the long/short (dark bars) and long-only (white bars) CDS trades. First, note that the distribution of convergence P/L is centered on the interval between 0% and 1% for both long/short and long-only strategies. However, the long-only trades have negative skew to their convergence P/L, whereas the long/short trades have positive P/L skew. Also, the largest returns from convergence for the long-only strategy is less than 1%, whereas three of the 16 long/short CDS trades returned more than 2% from convergence over their three month tenors.
Investment-Grade and High Yield CDS Trades In related simulations, we split our sample of sovereign CDS into investment-grade-rated (IG) sovereigns and high yield (HY) sovereigns. We examined the performance of the long/short CDS trading paradigm on each subset of the sample. As before, portfolios were constructed each month and each trade was unwound after three months. For these strategies, we used the paradigm for going long and short CDS shown in Figure 18. That is, for IG and HY sovereigns, we divided the population of CDS into four groups based on their -scores in Equation 5:
1. CDS with -scores >= +0.5 (sell protection);; 2. CDS with -scores < -0.5 (buy protection) ;; 3. CDS with 0 < -scores < +0.5 ;; (sell protection) and 4. CDS with -0.5 < -scores < 0 (buy protection).
Then, for both IG and HY sovereigns, we simulated monthly long and short CDS trades between groups 1 and 2, respectively, and similarly between groups 3 and 4. Although, by design, the positive carry from the long/short trade on groups 1 and 2 will be greater than carry for 3 and 4, we can compare the differential convergence P/L between those trades. Presumably, if PDS predict CDS spread moves, then convergence between CDS farther away from fair value (i.e., groups 1 and 2) ought to be greater than those inside the +/-0.5 band.
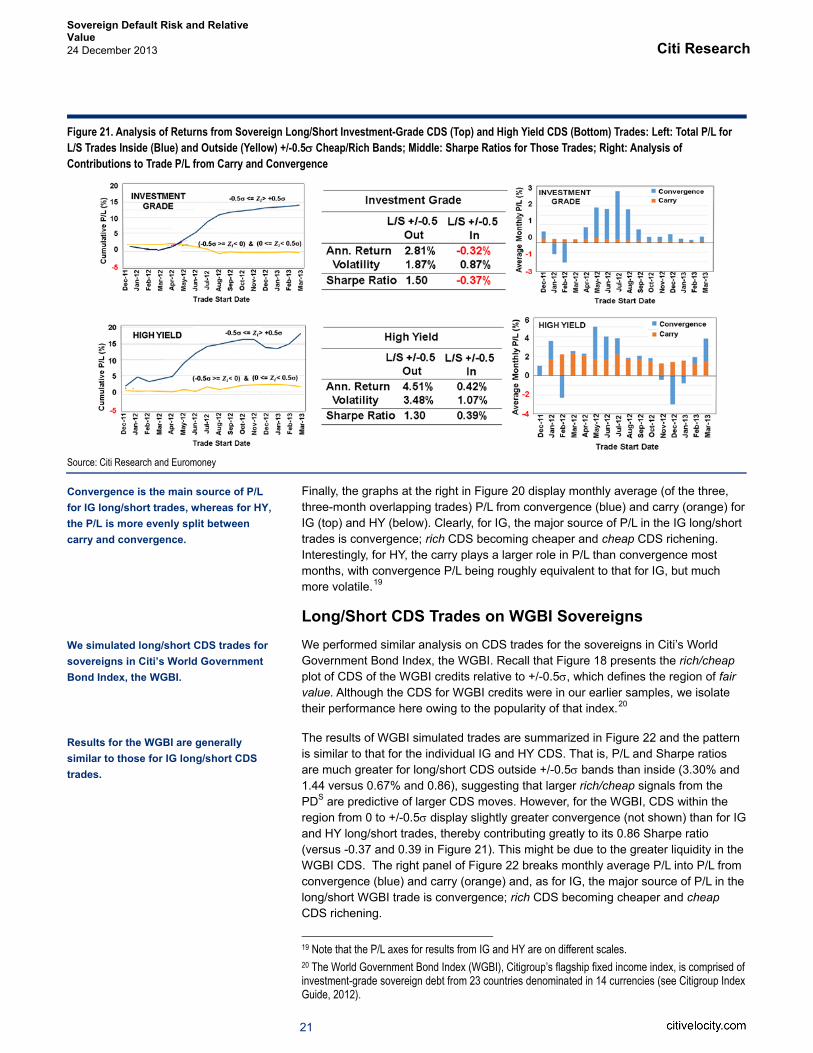
The results of our simulated trades are summarized in Figure 21, which presents returns from the long/short CDS trades on IG sovereigns on the top and the analogous results for HY below. The left graphs in Figure 21 present cumulative returns for long/short trades, where we sell protection on CDS with -scores above and below the +/-0.5 band (case 1 versus 2) or within the +/-0.5 band on both sides of -scores = 0 (cases 3 versus 4). For both IG (top) and HY (bottom) P/L is much greater for long/short trades on CDS outside +/-0.5 bands, suggesting that larger rich/cheap signals based on PDS are predictive of larger CDS moves. The middle panels display those results as average annual returns and Sharpe ratios, demonstrating that there is virtually no convergence for CDS within +/-0.5 of fair value;; annual P/L is actually negative for IG (and this is a positive carry trade), whereas annual P/L for HY long/short trades is just barely positive at 42bp, a factor of ten below the CDS trades outside the+/-0.5 band.
Convergence for individual long/short CDS trades display positive P/L tail risk, whereas long-only trades have negative tail risk.
We analyzed the long/short CDS strategy separately for investment-grade and high yield sovereigns.
Convergence for rich and cheap CDS is related to distance from fair value as measured from the ECR-HPD model
Sovereign Default Risk and Relative Value 24 December 2013 Citi Research
21
Figure 21. Analysis of Returns from Sovereign Long/Short Investment-Grade CDS (Top) and High Yield CDS (Bottom) Trades: Left: Total P/L for L/S Trades Inside (Blue) and Outside (Yellow) +/-0.5 Cheap/Rich Bands;; Middle: Sharpe Ratios for Those Trades;; Right: Analysis of Contributions to Trade P/L from Carry and Convergence
Source: Citi Research and Euromoney
Finally, the graphs at the right in Figure 20 display monthly average (of the three, three-month overlapping trades) P/L from convergence (blue) and carry (orange) for IG (top) and HY (below). Clearly, for IG, the major source of P/L in the IG long/short trades is convergence;; rich CDS becoming cheaper and cheap CDS richening. Interestingly, for HY, the carry plays a larger role in P/L than convergence most months, with convergence P/L being roughly equivalent to that for IG, but much more volatile.19
Long/Short CDS Trades on WGBI Sovereigns We performed similar analysis on CDS trades for the sovereigns in Citi’s World Government Bond Index, the WGBI. Recall that Figure 18 presents the rich/cheap plot of CDS of the WGBI credits relative to +/-0.5 , which defines the region of fair value. Although the CDS for WGBI credits were in our earlier samples, we isolate their performance here owing to the popularity of that index.20
The results of WGBI simulated trades are summarized in Figure 22 and the pattern is similar to that for the individual IG and HY CDS. That is, P/L and Sharpe ratios are much greater for long/short CDS outside +/-0.5 bands than inside (3.30% and 1.44 versus 0.67% and 0.86), suggesting that larger rich/cheap signals from the PDS are predictive of larger CDS moves. However, for the WGBI, CDS within the region from 0 to +/-0.5 display slightly greater convergence (not shown) than for IG and HY long/short trades, thereby contributing greatly to its 0.86 Sharpe ratio (versus -0.37 and 0.39 in Figure 21). This might be due to the greater liquidity in the WGBI CDS. The right panel of Figure 22 breaks monthly average P/L into P/L from convergence (blue) and carry (orange) and, as for IG, the major source of P/L in the long/short WGBI trade is convergence;; rich CDS becoming cheaper and cheap CDS richening.
19 Note that the P/L axes for results from IG and HY are on different scales. 20 The World Government Bond Index (WGBI), Citigroup’s flagship fixed income index, is comprised of investment-grade sovereign debt from 23 countries denominated in 14 currencies (see Citigroup Index Guide, 2012).
Convergence is the main source of P/L for IG long/short trades, whereas for HY, the P/L is more evenly split between carry and convergence.
We simulated long/short CDS trades for sovereigns in Citi’s World Government Bond Index, the WGBI.
Results for the WGBI are generally similar to those for IG long/short CDS trades.

Sovereign Default Risk and Relative Value 24 December 2013 Citi Research
22
Figure 22. Analysis of Returns from WGBI Sovereign Long/Short Trades: Left: Total P/L for L/S Trades Inside (Blue) and Outside (Yellow) +/-0.5 Cheap/Rich Bands;; Middle: Sharpe Ratios for Those Trades;; Right: Analysis of Contributions to Trade P/L from Carry and Convergence
Source: Citi Research and Euromoney
Toward An Adaptive ECR Score, ECR* The weights applied by Euromoney to the major factors and sub-factors that comprise the ECR score have evolved over several decades. Nevertheless, they were assigned using subjective criteria. That is, Euromoney factor weightings are not based on quantitative studies of their ability to predict defaults or market prices. We decided to examine if, by changing the weights on the sub-factors in the model, we could improve the predictive power of ECR scores. Since there are very few sovereign defaults since the model was introduced in December 2011, adjusting model weights by optimizing on defaults is not practical. Although one might choose to optimize model weights using results of the long/short CDS trades, it seemed more expeditious, at least for this proof-of-concept, to calibrate the weights in the model to best predict ratings changes. Recall that the ECR score is a weighted average of 18 sub-factors that contribute to aggregate scores arranged into 6 main factors. A list of the current weights of the sub-factors appears in Figure 23. We define our objective function for the optimization as the discriminatory power of the Euromoney score measured as the sum of the areas under the ROC curves for upgrades and downgrades. That is, we chose the weights of the sub-factors to maximize the function ( ), where
( ) = max, ,.., + ,
: = 1; 0, … , 0 . (6) Initial attempts to apply algorithmic optimization methods resulted in problems with local minima affecting our solutions. This caused us to adopt a “brute force” optimization, whereby we sampled a large portion of the solution space at random. As shown in the pseudo code in Figure 24, we ran 100,000 simulations with weights chosen at random, computing the sum of areas under the ROCs for upgrades and downgrades for each. We then selected the 10 simulations that produced ROCs with the largest areas, and took the average of their weights as our best estimate of the new ECR weights. We designate the adaptive score as ECR* to distinguish it from the original ECR score.
We examined if changing the weights on the sub-factors in the ECR score could improve model performance.
Figure 23. ECR Sub-Factor Weights
Source: Citi Research
Sub Factor WeightBank stability/risk 2.90%Economic-GNP outlook 9.50%Monetary policy/ currency stability 9.58%Employment/unemployment 8.26%Government finances 7.64%Government non-payments / non-repatriation 8.19%Corruption 4.03%Information access/transparency 3.15%Institutional risk 8.81%Regulatory and policy environment 2.94%Government stability 5.71%Soft infrastructure 3.06%Demographics 3.71%Hard infrastructure 4.59%Labour market/industrial relations 4.33%Debt indicators 2.12%Credit ratings 10.98%Access to capital 0.50%

Sovereign Default Risk and Relative Value 24 December 2013 Citi Research
23
Figure 24. Pseudo Code for Optimizing ECR Sub-Factor Weights
Source: Citi Research
The results of the optimization are presented in Figure 25. The left panels show the weights of the major factors before and after the optimization. (Note that the factor weights are sums of sub-factors on which the optimizations are performed.) In general, the ordering of the major factors in not affected much;; the “optimal” economic and political factor weights are only slightly larger than their original 30% values, at 37.9% and 32.8%, respectively. Slight increases in weights also occur for structural factors (15.7% versus 10%) and agency credit ratings (11.0% versus 10%). Finally, weights in debt indicators and access to capital have large decreases from to their original ECR weights of 10%, with optimized weights of 2.1% and 0.5%, respectively
Figure 25. Effect of Optimization on ECR Weights and Predictions: Left: Changes in ECR Factors;; Middle: ROC Curves and Areas under Curves for Original ECR Model and ECR*;; Right: Factor and Sub-Factor Weights Before and After Optimization
Source: Citi Research and Euromoney
The middle panel of Figure 25 shows the amount of improvement in predicting ratings upgrades and downgrades that result from the brute force optimization. That is, optimization improves ROCs for both upgrades and downgrades, with areas under the ROCs increasing by 10% and 15% on the full sample.
The right panel of Figure 25 shows the results of the optimization at the sub-factor level, whereas the factors of credit rating, debt indicators and access to capital
Optimization increases weights on economic and political factors, while underweighting debt indicators and access to capital.
Optimization improves ROCs for both upgrades and downgrades in the full sample.

Sovereign Default Risk and Relative Value 24 December 2013 Citi Research
24
(which have no sub-factors) are also included. Agency credit ratings are the most important single variable, contributing 11% to the ECR* scores, but similar to their contribution in the original ECR score. The greatest overweights relative to ECR resulting from the optimization are for monetary policy/currency stability, economic outlook, employment, and various aspects of government policy. Greatest underweights of ECR* scores relative to ECR occur for regulatory and policy environment, bank stability, and the aforementioned debt indicators and access to capital. These latter underweights are somewhat surprising, but may be the result of their co-linearity with other variables
To examine the stability and robustness of the optimized weights, we performed the optimization on an early portion of the sample, from December 2011 until August 2012, and tested the improvement on the remaining twelve months. Results of the out-of-sample testing appear in Figure 26, indicating a much reduced improvement in predictability over in-sample optimization and testing. That is, as opposed to a 10% and 15% improvement in the areas under the ROCs for downgrades and upgrades, respectively, the out-of-sample optimization improved performance by only 4% for downgrades and was actually slightly worse for upgrades. It is worth noting that the sample size of ECR* scores and ratings changes are now much smaller (roughly 20 upgrades and 30 downgrades in optimization and test samples). Despite the loss of predictability of upgrades in the out-of-sample testing we find that the optimized weights are stable across in-sample and out-of-sample optimizations.
It is important to remember that this brute-force optimization is only intended as a proof of concept. As we go forward, we will re-optimize the weights with the objective of not only maximizing ROC areas for upgrades and downgrades, but also maximizing returns on long/short CDS trades. In addition, as we have demonstrated for our bank model (Benzschawel, Li and Lee, 2013), we would optimize using adaptive methods based on a Bayesian Information Criterion as applied to selection of scores both within and among major factor groups.
Analyzing Risk and Relative Value of Sovereign Portfolios In this final section, we present an example of how ECR scores and PDS can be applied for analyzing the risk and relative value of a portfolio of sovereign CDS. Figure 27 displays for a subset of sovereigns in the ECR scoring universe a sample of a risk and relative value report patterned after reports that we have developed over the past decade for use in analyzing client portfolios. We present herein only a small portion of our typical portfolio report, with the analysis focusing on individual credits. A more detailed description of our portfolio analysis methods can be found in Benzschawel (2012).
Figure 27 shows five-year CDS premiums and ECR scores for each sovereign in the table. In addition, sovereigns’ ECR scores are first converted to HPD implied PDs (i.e., PDS) based each sovereign’s agency rating, and then back to an implied rating using a map corresponding to that in the right portion of Figure 12. The implied PDS are also shown. From plots of CDS premiums versus PDS such as that presented in Figure 18, we infer relative value for each CDS (rightmost columns in Figure 27). For this example, CDS premiums that plot above the fair value regression line are labeled as cheap and those falling below the line as rich. The last column provides a quantitative measure of relative value in units of standard deviation (i.e., -scores from Equation 5) from the best-fit regression line. The other columns in the table show sovereign credit ratings from Standard & Poor’s, Moody’s
Figure 26. Results of Out-of-Sample Testing on Optimized ECR Score
Source: Citi Research
This brute-force optimization is only intended as a proof of concept;; we intend to use other adaptive methods for adjusting ECR score weights.
The ECR-CITI model can be embedded in a comprehensive risk and relative value reporting system.

Sovereign Default Risk and Relative Value 24 December 2013 Citi Research
25
and Fitch and their imputed PDs from the map between Citi’s HPD model scores and credit ratings as illustrated in the upper left panel of Figure 12.
Figure 27. Sample of Risk and Relative Value for Selected Sovereigns from ECR-CITI Model and Comparison of Risk with Rating Agency Ratings and Implied PDs
Source: Citi Research, Euromoney, Fitch Ratings, Moody’s Investors Service and Standard & Poor’s
As mentioned, the analysis in Figure 27 is patterned after our standard portfolio analysis, but illustrates only a small portion of our analysis package. Our reports provide an overall summary of portfolio risk both from agency ratings and our PD models (i.e., HPD and market-implied) along with measures of average spread in the portfolio relative to fair value. That is, average market spreads in the portfolio are compared with what the market is paying on average for the overall default risk, duration, and recovery value. In addition, our reports provide measures of one- and three-month credit momentum, highlighting those obligors whose credit quality is improving most and those deteriorating most. The reports also highlight bonds or CDS offering the best and worst relative value, and we highlight credits with the largest discrepancies between PD models and agency ratings as reflect default risk. Finally, our reports provide estimates of expected losses from default over one-, three-, and five-year horizons using our copula model of default correlation and use that method to compute distributions of expected losses and portfolio value-at-risk (VaR). Citi Research has licensed the ECR scores from Euromoney and can evaluate client portfolios of sovereign credits using the methods described in this report along with those of our standard portfolio analysis tools.
The analysis in Figure 27 is only a partial example of our risk and relative value report.
Citi Research has licensed ECR scores from Euromoney and can evaluate client portfolios of sovereign credits using the methods described herein.
Sovereign Default Risk and Relative Value 24 December 2013 Citi Research
26
Summary We combined Euromoney’s Country Risk (ECR) scores with default probabilities (PDs) from Citi’s corporate HPD model to measure sovereigns’ credit risk and the relative values of their credit default swaps. The ECR scorecard ranks sovereigns’ credit on a scale of 100-0 (best-to-worst) based on economic, political, structural, and other factors using standardized inputs from economists, government employees, risk managers, and traders. Using credit agency ratings to link ECR sovereign scores with HPD PDs, we impute daily values of PDS for global sovereign issuers. The daily values of PDS allow us to track sovereigns’ credit momentum over time. In examining the predictive power of the ECR scores, we find that changes in Euromoney country risk scores lead sovereign downgrades and upgrades. Our tests suggest that ECR scores better predict ratings downgrades than upgrades, but the small size of our test sample, the mostly positive performance of global sovereigns over the period, and the typically earlier market recognition of improving credits limits our confidence in that result.
Regressions of sovereigns’ credit default swap (CDS) spreads against their implied PDS are used to identify rich and cheap credits by their deviations above and below the line, respectively. Based on that measure, we constructed long/short CDS trades on various sets of sovereign CDS. For investment-grade, high yield, and WGBI sovereigns, we find that rich and cheap credits converge toward fair value, with most of that convergence taking place within the first three months after inception. To improve the predictive power of the ECR scores, we developed an adaptive model, called ECR*, by dynamically optimizing the weights on the ECR sub-factors. Although our current optimization is little more than a proof-of-concept, but, with some limitations, are at least suggestive that adjusting ECR scores to better predict market data may improve predictive power of ECR measures. Finally, we show how the PDS based on ECR scores and HPD PDs can be used to produce a risk and relative value report on portfolios of sovereign credits. Citi Research has licensed Euromoney ECR scores to make our analysis available for use with Citi clients from whom we welcome inquiries regarding performing similar analyses on their portfolios.
We combined ECR scores with PD) from Citi’s corporate HPD model to measure sovereigns’ credit risk and the relative values of their credit default swaps.
Our current optimization is a proof-of-concept, but suggests that optimizing ECR sub-factors with respect to market data may improve predictive power.
Sovereign Default Risk and Relative Value 24 December 2013 Citi Research
27
Anderson, R. and Sundaresan, S. A Comparative Study of Structural Models of Corporate Bond Yields: An Exploratory Investigation, Journal of Banking and Finance 24, pp. 255-269, 2000 Benzschawel, T. Credit Risk Modeling: Fact, Theory and Applications, Incisive Media, London, U.K., 2012 Benzschawel, T. and Hawker, B. PD-Weighted WGBI Performance, Citi, March 12, 2013 Benzschawel, T., Li, J. and Lee, M. Predicting Bank Failure: An Adaptive Statistical Model for Estimating Banks’ Default Risk, Citi, September 11, 2013 Benzschawel, T. and Assing, A. Inferring Default Probabilities from Credit Spreads, Journal of Fixed Income 21 (4), pp. 13-24, Spring 2012 Benzschawel, T. and Lee, M. Market-Implied Default Probabilities: Update, Citi, September 8, 2011 Benzschawel, T. and Lee, M. A Rule-Based Long/Short CDS Strategy, Citi, April 30, 2012 Citigroup Index, Citigroup Global Fixed-Income Index Catalog – 2012 Edition, Citi, January 17, 2012
Citi Fixed Income Indices, Index Guide – 2013 Edition, Citi, January 2013
Elton, J., Gruber, M., Agrawal, D. and Mann, D. Explaining the Rate Spread on Corporate Bonds, Journal of Finance 56, pp. 449-470, 2001 Fama, E., The Behavior of Stock Market Prices, Journal of Business 38, pp. 34-105, 1965 Gray, D., Merton, R., and Bodie, Z. Contingent Claims Approach to Measuring and Managing Sovereign Credit Risk, Journal of Investment Management 5 (4), pp. 5-28, 2007 Lee, M. and Benzschawel, T., Corporate Markets Quantitative Review, Citi, November 7, 2013 Lintner, J., The Valuation of Risk Assets and the Selection of Risky Investments in Stock Portfolios and Capital Budgets, Review of Economics and Statistics 47 (1), 13–37, 1965 Markowitz, H.M., Portfolio Selection: Efficient Diversification of Investments. New York: John Wiley & Sons, 1959 Merton, R. A. On the Pricing of Corporate Debt: The Risk Structures of Interest Rates. Journal of Finance 29, pp. 449-470, 1974
Mossin, J. Equilibrium in a Capital Asset Market, Econometrica 34 (4), pp. 768–783, 1966
Oxford English Dictionary, J.A.H. Murray (Editor), Oxford University Press, 1971
References

Sovereign Default Risk and Relative Value 24 December 2013 Citi Research
28
Sobehart, J. and Keenan, S. Hybrid contingent claims models: a practical approach to modeling default risk, Credit Ratings: Methodology, Rationale and Default Risk, M. Ong (ed.), Risk Books, 2002
Sobehart, J. and Keenan, S. Hybrid probability of default models: a practical approach to modeling default risk, Quantitative Credit Analyst 3, Citigroup Global Markets Inc., pp. 5-29, October 2003
Treynor, J. Toward a Theory of Market Value of Risky Assets, in Asset Pricing and Portfolio Performance: Models, Strategy and Performance Metrics. Robert A. Korajczyk (Editor) London: Risk Books, pp. 15–22, 1962

Sovereign Default Risk and Relative Value 24 December 2013 Citi Research
29
An ROC is a two-dimensional plot where the variable of interest, say the likelihood that the sovereign was downgraded in the following three months, is plotted against the predictive variable, the ranked magnitude of the previous three-month change in ECR score. The ROC at the top of Figure 28 illustrates some important features:
The negative diagonal shown by dashes is the “chance line” where the likelihood of detecting a subsequent ratings change is unrelated to the previous change in ECR score;; the “hit” and “false positive” rates are the same;;
The ROC “curve”, the solid curved line in Figure 28, the plot of “hits” versus “false positives” as one goes through the entire set of ranked predictors (in this case, three month changes in ECR scores from largest to smallest);; and
The dashed area under the ROC curve is an important measure of performance, whose value is the percentage of area above the negative diagonal.
The bottom portion of Figure 28 provides descriptions of the points labeled in the ROC. For example, the “star” in the plot at (hit, false alarm) = (0.0, 1.0) is indicative of a perfect predictor;; all target cases are ranked above the first “false positive” in the sample. That is all sovereigns with ratings changes in the following three months have larger previous three-month changes in ECR scores than those without ratings changes. A point along the chance line, “E”, is also shown. The point “A” is said to plot at a “conservative” criterion, as the false positive rate is very low. Points “B” and “C” illustrate more permissive criteria than “A”. Finally, the point “D” is on the ROC curve for a given level of discrimination. Note that points A, B and C could intersect the same ROC, which would indicate superior predictability to that shown through point “D”.
Appendix I: The ROC Curve Figure 28. Top: ROC Plot with Points to Illustrate Various Features;; Bottom: Descriptions of Points on the ROC
Source: Citi Research

Sovereign Default Risk and Relative Value 24 December 2013 Citi Research
30
Appendix A-1 Analyst Certification The research analyst(s) primarily responsible for the preparation and content of this research report are named in bold text in the author block at the front of the product except for those sections where an analyst's name appears in bold alongside content which is attributable to that analyst. Each of these analyst(s) certify, with respect to the section(s) of the report for which they are responsible, that the views expressed therein accurately reflect their personal views about each issuer and security referenced and were prepared in an independent manner, including with respect to Citigroup Global Markets Inc and its affiliates. No part of the research analyst's compensation was, is, or will be, directly or indirectly, related to the specific recommendation(s) or view(s) expressed by that research analyst in this report.
IMPORTANT DISCLOSURES Citigroup Global Markets Inc. owns a position of 1 million USD or more in the debt securities of Argentina Citigroup Global Markets Inc. owns a position of 1 million USD or more in the debt securities of Brazil Citigroup Global Markets Inc. owns a position of 1 million USD or more in the debt securities of CANADA (GOVERNMENT) Citigroup Global Markets Inc. owns a position of 1 million USD or more in the debt securities of Chile Citigroup Global Markets Inc. owns a position of 1 million USD or more in the debt securities of Costa Rica Citigroup Global Markets Inc. owns a position of 1 million USD or more in the debt securities of Dominican Republic Citigroup Global Markets Inc. owns a position of 1 million USD or more in the debt securities of South Korea Citigroup Global Markets Inc. owns a position of 1 million USD or more in the debt securities of Morocco Citigroup Global Markets Inc. owns a position of 1 million USD or more in the debt securities of Mexico Citigroup Global Markets Inc. owns a position of 1 million USD or more in the debt securities of Panama Citigroup Global Markets Inc. owns a position of 1 million USD or more in the debt securities of PERU, REPUBLIC OF (GOVERNMENT) Citigroup Global Markets Inc. owns a position of 1 million USD or more in the debt securities of Philippines Citigroup Global Markets Inc. owns a position of 1 million USD or more in the debt securities of URUGUAY, ORIENTAL REPUBLIC OF (GOVERNMENT) Citigroup Global Markets Inc. owns a position of 1 million USD or more in the debt securities of Venezuela Within the past 12 months, Citigroup Global Markets Inc. or its affiliates has acted as manager or co-manager of an offering of securities of Australia, Belgium, Bahrain, Canada, Costa Rica, Spain, France, Italy, South Korea, Morocco, Mexico, Netherlands, Panama, Philippines, Poland, Romania, Sweden, Turkey, United States, China, Austria, United Kingdom, Norway, Japan. Citigroup Global Markets Inc. or its affiliates has received compensation for investment banking services provided within the past 12 months from Australia, Belgium, Bulgaria, Republic of (Government), Bahrain, Brazil, Chile, Costa Rica, Czech Republic, Germany, Denmark, Dominican Republic, Spain, France, Ghana, Greece, Ireland, Iceland, Italy, Lebanon, Sri Lanka, Lithuania, Morocco, Mexico, Netherlands, Panama, Peru, Philippines, Pakistan, Poland, Portugal, Qatar, Romania, Russian Federation, Sweden, Slovenia, Slovakia, El Salvador, Turkey, United States, Uruguay, Venezuela, Vietnam, South Africa, China, Austria, United Kingdom, Norway, Taiwan, Singapore, Japan, Malaysia. Citigroup Global Markets Inc. or its affiliates expects to receive or intends to seek, within the next three months, compensation for investment banking services from Brazil, Czech Republic, Germany, Denmark, Spain, France, Greece, Ireland, Italy, Mexico, Netherlands, Panama, Peru, Philippines, Poland, Portugal, Qatar, Romania, Russian Federation, Sweden, Turkey, Vietnam, China, Austria, United Kingdom, Norway, Singapore, Japan, Malaysia. Citigroup Global Markets Inc. or an affiliate received compensation for products and services other than investment banking services from Australia, Belgium, Bulgaria, Republic of (Government), Bahrain, Brazil, Chile, Costa Rica, Czech Republic, Germany, Denmark, Dominican Republic, Egypt, Spain, France, Ghana, Greece, Guatemala, Ireland, Iceland, Italy, Lebanon, Sri Lanka, Lithuania, Morocco, Mexico, Netherlands, Panama, Peru, Philippines, Pakistan, Poland, Portugal, Qatar, Romania, Russian Federation, Sweden, Slovenia, Slovakia, El Salvador, Turkey, United States, Uruguay, Venezuela, Vietnam, South Africa, China, Austria, United Kingdom, Norway, Taiwan, Singapore, Japan, Malaysia in the past 12 months. Citigroup Global Markets Inc. currently has, or had within the past 12 months, the following as investment banking client(s): Australia, Belgium, Bulgaria, Republic of (Government), Bahrain, Brazil, Chile, Costa Rica, Czech Republic, Germany, Denmark, Dominican Republic, Spain, France, Ghana, Greece, Ireland, Iceland, Italy, Lebanon, Sri Lanka, Lithuania, Morocco, Mexico, Netherlands, Panama, Peru, Philippines, Pakistan, Poland, Portugal, Qatar, Romania, Russian Federation, Sweden, Slovenia, Slovakia, El Salvador, Turkey, United States, Uruguay, Venezuela, Vietnam, South Africa, China, Austria, United Kingdom, Norway, Taiwan, Singapore, Japan, Malaysia. Citigroup Global Markets Inc. currently has, or had within the past 12 months, the following as clients, and the services provided were non-investment-banking, securities-related: Australia, Belgium, Bulgaria, Republic of (Government), Bahrain, Brazil, Chile, Costa Rica, Czech Republic, Germany, Denmark, Dominican Republic, Egypt, Spain, France, Ghana, Greece, Guatemala, Ireland, Iceland, Italy, Lebanon, Sri Lanka, Lithuania, Morocco, Mexico, Netherlands, Panama, Peru, Philippines, Pakistan, Poland, Portugal, Qatar, Romania, Russian Federation, Sweden, Slovenia, Slovakia, El Salvador, Turkey, United States, Uruguay, Venezuela, Vietnam, South Africa, China, Austria, United Kingdom, Norway, Taiwan, Singapore, Japan, Malaysia. Citigroup Global Markets Inc. currently has, or had within the past 12 months, the following as clients, and the services provided were non-investment-banking, non-securities-related: Australia, Belgium, Bulgaria, Republic of (Government), Bahrain, Brazil, Chile, Costa Rica, Czech Republic, Germany, Denmark, Dominican Republic, Egypt, Spain, France, Ghana, Greece, Guatemala, Ireland, Iceland, Italy, Lebanon, Sri Lanka, Lithuania, Morocco, Mexico,

Sovereign Default Risk and Relative Value 24 December 2013 Citi Research
31
Netherlands, Panama, Peru, Philippines, Pakistan, Poland, Portugal, Qatar, Romania, Russian Federation, Sweden, Slovenia, Slovakia, El Salvador, Turkey, United States, Uruguay, Venezuela, Vietnam, South Africa, China, Austria, United Kingdom, Norway, Taiwan, Singapore, Japan, Malaysia. Singapore or its affiliates beneficially owns 2% or more of any class of common equity securities of Citigroup Inc. United States or its affiliates beneficially owns 5% or more of any class of common equity securities of Citigroup Inc. Analysts' compensation is determined based upon activities and services intended to benefit the investor clients of Citigroup Global Markets Inc. and its affiliates ("the Firm"). Like all Firm employees, analysts receive compensation that is impacted by overall firm profitability which includes investment banking revenues. For important disclosures (including copies of historical disclosures) regarding the companies that are the subject of this Citi Research product ("the Product"), please contact Citi Research, 388 Greenwich Street, 28th Floor, New York, NY, 10013, Attention: Legal/Compliance [E6WYB6412478]. In addition, the same important disclosures, with the exception of the Valuation and Risk assessments and historical disclosures, are contained on the Firm's disclosure website at https://www.citivelocity.com/cvr/eppublic/citi_research_disclosures. Valuation and Risk assessments can be found in the text of the most recent research note/report regarding the subject company. Historical disclosures (for up to the past three years) will be provided upon request. NON-US RESEARCH ANALYST DISCLOSURES Non-US research analysts who have prepared this report (i.e., all research analysts listed below other than those identified as employed by Citigroup Global Markets Inc.) are not registered/qualified as research analysts with FINRA. Such research analysts may not be associated persons of the member organization and therefore may not be subject to the NYSE Rule 472 and NASD Rule 2711 restrictions on communications with a subject company, public appearances and trading securities held by a research analyst account. The legal entities employing the authors of this report are listed below: Citigroup Global Markets Inc Terry L Benzschawel;; Mike Lee;; Jiacui Li;; Yong Su
OTHER DISCLOSURES Citigroup Global Markets Inc. and/or its affiliates has a significant financial interest in relation to Argentina, Belgium, Bulgaria, Republic of (Government), Bahrain, Brazil, Canada, Chile, Costa Rica, Czech Republic, Dominican Republic, Egypt, Spain, Ghana, Guatemala, Ireland, Italy, South Korea, Sri Lanka, Morocco, Mexico, Panama, Peru, Philippines, Pakistan, Poland, Qatar, Romania, Russian Federation, Sweden, El Salvador, Turkey, Uruguay, Venezuela, Vietnam, South Africa, Austria, United Kingdom, New Zealand, Schweizerische Nationalbank, Taiwan, Singapore, Japan, Malaysia. (For an explanation of the determination of significant financial interest, please refer to the policy for managing conflicts of interest which can be found at www.citiVelocity.com.) For securities recommended in the Product in which the Firm is not a market maker, the Firm is a liquidity provider in the issuers' financial instruments and may act as principal in connection with such transactions. The Firm is a regular issuer of traded financial instruments linked to securities that may have been recommended in the Product. The Firm regularly trades in the securities of the issuer(s) discussed in the Product. The Firm may engage in securities transactions in a manner inconsistent with the Product and, with respect to securities covered by the Product, will buy or sell from customers on a principal basis. Securities recommended, offered, or sold by the Firm: (i) are not insured by the Federal Deposit Insurance Corporation;; (ii) are not deposits or other obligations of any insured depository institution (including Citibank);; and (iii) are subject to investment risks, including the possible loss of the principal amount invested. Although information has been obtained from and is based upon sources that the Firm believes to be reliable, we do not guarantee its accuracy and it may be incomplete and condensed. Note, however, that the Firm has taken all reasonable steps to determine the accuracy and completeness of the disclosures made in the Important Disclosures section of the Product. The Firm's research department has received assistance from the subject company(ies) referred to in this Product including, but not limited to, discussions with management of the subject company(ies). Firm policy prohibits research analysts from sending draft research to subject companies. However, it should be presumed that the author of the Product has had discussions with the subject company to ensure factual accuracy prior to publication. All opinions, projections and estimates constitute the judgment of the author as of the date of the Product and these, plus any other information contained in the Product, are subject to change without notice. Prices and availability of financial instruments also are subject to change without notice. Notwithstanding other departments within the Firm advising the companies discussed in this Product, information obtained in such role is not used in the preparation of the Product. Although Citi Research does not set a predetermined frequency for publication, if the Product is a fundamental research report, it is the intention of Citi Research to provide research coverage of the/those issuer(s) mentioned therein, including in response to news affecting this issuer, subject to applicable quiet periods and capacity constraints. The Product is for informational purposes only and is not intended as an offer or solicitation for the purchase or sale of a security. Any decision to purchase securities mentioned in the Product must take into account existing public information on such security or any registered prospectus. Investing in non-U.S. securities, including ADRs, may entail certain risks. The securities of non-U.S. issuers may not be registered with, nor be subject to the reporting requirements of the U.S. Securities and Exchange Commission. There may be limited information available on foreign securities. Foreign companies are generally not subject to uniform audit and reporting standards, practices and requirements comparable to those in the U.S. Securities of some foreign companies may be less liquid and their prices more volatile than securities of comparable U.S. companies. In addition, exchange rate movements may have an adverse effect on the value of an investment in a foreign stock and its corresponding dividend payment for U.S. investors. Net dividends to ADR investors are estimated, using withholding tax rates conventions, deemed accurate, but investors are urged to consult their tax advisor for exact dividend computations. Investors who have received the Product from the Firm may be prohibited in certain states or other jurisdictions from purchasing securities mentioned in the Product from the Firm. Please ask your Financial Consultant for additional details. Citigroup Global Markets Inc. takes responsibility for the Product in the United States. Any orders by US investors resulting from the information contained in the Product may be placed only through Citigroup Global Markets Inc. The Citigroup legal entity that takes responsibility for the production of the Product is the legal entity which the first named author is employed by. The Product is made available in Australia through Citi Global Markets Australia Pty Ltd. (ABN 64 003 114 832 and AFSL No. 240992), participant of the ASX Group and regulated by the Australian Securities & Investments Commission. Citigroup Centre, 2 Park Street, Sydney, NSW 2000. The Product is made available in Australia to Private Banking wholesale clients through Citigroup Pty Limited (ABN 88 004 325 080 and AFSL 238098). Citigroup Pty Limited provides all financial product advice to Australian Private Banking wholesale clients through bankers and relationship managers. If there is any

Sovereign Default Risk and Relative Value 24 December 2013 Citi Research
32
doubt about the suitability of investments held in Citigroup Private Bank accounts, investors should contact the Citigroup Private Bank in Australia. Citigroup companies may compensate affiliates and their representatives for providing products and services to clients. The Product is made available in Brazil by Citigroup Global Markets Brasil - CCTVM SA, which is regulated by CVM - Comissão de Valores Mobiliários, BACEN - Brazilian Central Bank, APIMEC - Associação dos Analistas e Profissionais de Investimento do Mercado de Capitais and ANBID - Associação Nacional dos Bancos de Investimento. Av. Paulista, 1111 - 11º andar - CEP. 01311920 - São Paulo - SP. If the Product is being made available in certain provinces of Canada by Citigroup Global Markets (Canada) Inc. ("CGM Canada"), CGM Canada has approved the Product. Citigroup Place, 123 Front Street West, Suite 1100, Toronto, Ontario M5J 2M3. This product is available in Chile through Banchile Corredores de Bolsa S.A., an indirect subsidiary of Citigroup Inc., which is regulated by the Superintendencia de Valores y Seguros. Agustinas 975, piso 2, Santiago, Chile. The Product is made available in France by Citigroup Global Markets Limited, which is authorised and regulated by Financial Services Authority. 1-5 Rue Paul Cézanne, 8ème, Paris, France. The Product is distributed in Germany by Citigroup Global Markets Deutschland AG ("CGMD"), which is regulated by Bundesanstalt fuer Finanzdienstleistungsaufsicht (BaFin). CGMD, Reuterweg 16, 60323 Frankfurt am Main. Research which relates to "securities" (as defined in the Securities and Futures Ordinance (Cap. 571 of the Laws of Hong Kong)) is issued in Hong Kong by, or on behalf of, Citigroup Global Markets Asia Limited which takes full responsibility for its content. Citigroup Global Markets Asia Ltd. is regulated by Hong Kong Securities and Futures Commission. If the Research is made available through Citibank, N.A., Hong Kong Branch, for its clients in Citi Private Bank, it is made available by Citibank N.A., Citibank Tower, Citibank Plaza, 3 Garden Road, Hong Kong. Citibank N.A. is regulated by the Hong Kong Monetary Authority. Please contact your Private Banker in Citibank N.A., Hong Kong, Branch if you have any queries on or any matters arising from or in connection with this document. The Product is made available in India by Citigroup Global Markets India Private Limited, which is regulated by Securities and Exchange Board of India. Bakhtawar, Nariman Point, Mumbai 400-021. The Product is made available in Indonesia through PT Citigroup Securities Indonesia. 5/F, Citibank Tower, Bapindo Plaza, Jl. Jend. Sudirman Kav. 54-55, Jakarta 12190. Neither this Product nor any copy hereof may be distributed in Indonesia or to any Indonesian citizens wherever they are domiciled or to Indonesian residents except in compliance with applicable capital market laws and regulations. This Product is not an offer of securities in Indonesia. The securities referred to in this Product have not been registered with the Capital Market and Financial Institutions Supervisory Agency (BAPEPAM-LK) pursuant to relevant capital market laws and regulations, and may not be offered or sold within the territory of the Republic of Indonesia or to Indonesian citizens through a public offering or in circumstances which constitute an offer within the meaning of the Indonesian capital market laws and regulations. The Product is made available in Israel through Citibank NA, regulated by the Bank of Israel and the Israeli Securities Authority. Citibank, N.A, Platinum Building, 21 Ha'arba'ah St, Tel Aviv, Israel. The Product is made available in Italy by Citigroup Global Markets Limited, which is authorised and regulated by Financial Services Authority. Via dei Mercanti, 12, Milan, 20121, Italy. The Product is made available in Japan by Citigroup Global Markets Japan Inc. ("CGMJ"), which is regulated by Financial Services Agency, Securities and Exchange Surveillance Commission, Japan Securities Dealers Association, Tokyo Stock Exchange and Osaka Securities Exchange. Shin-Marunouchi Building, 1-5-1 Marunouchi, Chiyoda-ku, Tokyo 100-6520 Japan. If the Product was distributed by SMBC Nikko Securities Inc. it is being so distributed under license. In the event that an error is found in an CGMJ research report, a revised version will be posted on the Firm's Citi Velocity website. If you have questions regarding Citi Velocity, please call (81 3) 6270-3019 for help. The Product is made available in Korea by Citigroup Global Markets Korea Securities Ltd., which is regulated by the Financial Services Commission, the Financial Supervisory Service and the Korea Financial Investment Association (KOFIA). Citibank Building, 39 Da-dong, Jung-gu, Seoul 100-180, Korea. KOFIA makes available registration information of research analysts on its website. Please visit the following website if you wish to find KOFIA registration information on research analysts of Citigroup Global Markets Korea Securities Ltd. http://dis.kofia.or.kr/fs/dis2/fundMgr/DISFundMgrAnalystPop.jsp?companyCd2=A03030&pageDiv=02. The Product is made available in Korea by Citibank Korea Inc., which is regulated by the Financial Services Commission and the Financial Supervisory Service. Address is Citibank Building, 39 Da-dong, Jung-gu, Seoul 100-180, Korea. The Product is made available in Malaysia by Citigroup Global Markets Malaysia Sdn Bhd (Company No. 460819-D) (“CGMM”) to its clients and CGMM takes responsibility for its contents. CGMM is regulated by the Securities Commission of Malaysia. Please contact CGMM at Level 43 Menara Citibank, 165 Jalan Ampang, 50450 Kuala Lumpur, Malaysia in respect of any matters arising from, or in connection with, the Product. The Product is made available in Mexico by Acciones y Valores Banamex, S.A. De C. V., Casa de Bolsa, Integrante del Grupo Financiero Banamex ("Accival") which is a wholly owned subsidiary of Citigroup Inc. and is regulated by Comision Nacional Bancaria y de Valores. Reforma 398, Col. Juarez, 06600 Mexico, D.F. In New Zealand the Product is made available to ‘wholesale clients’ only as defined by s5C(1) of the Financial Advisers Act 2008 (‘FAA’) through Citigroup Global Markets Australia Pty Ltd (ABN 64 003 114 832 and AFSL No. 240992), an overseas financial adviser as defined by the FAA, participant of the ASX Group and regulated by the Australian Securities & Investments Commission. Citigroup Centre, 2 Park Street, Sydney, NSW 2000. The Product is made available in Pakistan by Citibank N.A. Pakistan branch, which is regulated by the State Bank of Pakistan and Securities Exchange Commission, Pakistan. AWT Plaza, 1.1. Chundrigar Road, P.O. Box 4889, Karachi-74200. The Product is made available in the Philippines through Citicorp Financial Services and Insurance Brokerage Philippines, Inc., which is regulated by the Philippines Securities and Exchange Commission. 20th Floor Citibank Square Bldg. The Product is made available in the Philippines through Citibank NA Philippines branch, Citibank Tower, 8741 Paseo De Roxas, Makati City, Manila. Citibank NA Philippines NA is regulated by The Bangko Sentral ng Pilipinas. The Product is made available in Poland by Dom Maklerski Banku Handlowego SA an indirect subsidiary of Citigroup Inc., which is regulated by Komisja Nadzoru Finansowego. Dom Maklerski Banku Handlowego S.A. ul.Senatorska 16, 00-923 Warszawa. The Product is made available in the Russian Federation through ZAO Citibank, which is licensed to carry out banking activities in the Russian Federation in accordance with the general banking license issued by the Central Bank of the Russian Federation and brokerage activities in accordance with the license issued by the Federal Service for Financial Markets. Neither the Product nor any information contained in the Product shall be considered as advertising the securities mentioned in this report within the territory of the Russian Federation or outside the Russian Federation. The Product does not constitute an appraisal within the meaning of the Federal Law of the Russian Federation of 29 July 1998 No. 135-FZ (as amended) On Appraisal Activities in the Russian Federation. 8-10 Gasheka Street, 125047 Moscow. The Product is made available in Singapore through Citigroup Global Markets Singapore Pte. Ltd. (“CGMSPL”), a capital markets services license holder, and regulated by Monetary Authority of Singapore. Please contact CGMSPL at 8 Marina View, 21st Floor Asia Square Tower 1, Singapore 018960, in respect of any matters arising from, or in connection with, the analysis of this document. This report is intended for recipients who are accredited, expert and institutional investors as defined under the Securities and Futures Act (Cap. 289). The Product is made available by The Citigroup Private Bank in Singapore through Citibank, N.A., Singapore Branch, a licensed bank in Singapore that is regulated by Monetary Authority of Singapore. Please contact your Private Banker in Citibank N.A., Singapore Branch if you have any queries on or any matters arising from or in connection with this document. This report is intended for recipients who are accredited, expert and institutional investors as defined under the Securities and Futures Act (Cap. 289). This report is distributed in Singapore by Citibank Singapore Ltd ("CSL") to selected Citigold/Citigold Private Clients. CSL provides no independent research or analysis of the substance or in preparation of this report. Please contact your Citigold//Citigold Private Client Relationship Manager in CSL if you have any queries on or any matters arising from or in
Sovereign Default Risk and Relative Value 24 December 2013 Citi Research
33
connection with this report. This report is intended for recipients who are accredited investors as defined under the Securities and Futures Act (Cap. 289). Citigroup Global Markets (Pty) Ltd. is incorporated in the Republic of South Africa (company registration number 2000/025866/07) and its registered office is at 145 West Street, Sandton, 2196, Saxonwold. Citigroup Global Markets (Pty) Ltd. is regulated by JSE Securities Exchange South Africa, South African Reserve Bank and the Financial Services Board. The investments and services contained herein are not available to private customers in South Africa. The Product is made available in Spain by Citigroup Global Markets Limited, which is authorised and regulated by Financial Services Authority. 29 Jose Ortega Y Gasset, 4th Floor, Madrid, 28006, Spain. The Product is made available in the Republic of China through Citigroup Global Markets Taiwan Securities Company Ltd. ("CGMTS"), 14 and 15F, No. 1, Songzhi Road, Taipei 110, Taiwan and/or through Citibank Securities (Taiwan) Company Limited ("CSTL"), 14 and 15F, No. 1, Songzhi Road, Taipei 110, Taiwan, subject to the respective license scope of each entity and the applicable laws and regulations in the Republic of China. CGMTS and CSTL are both regulated by the Securities and Futures Bureau of the Financial Supervisory Commission of Taiwan, the Republic of China. No portion of the Product may be reproduced or quoted in the Republic of China by the press or any third parties [without the written authorization of CGMTS and CSTL]. If the Product covers securities which are not allowed to be offered or traded in the Republic of China, neither the Product nor any information contained in the Product shall be considered as advertising the securities or making recommendation of the securities in the Republic of China. The Product is for informational purposes only and is not intended as an offer or solicitation for the purchase or sale of a security or financial products. Any decision to purchase securities or financial products mentioned in the Product must take into account existing public information on such security or the financial products or any registered prospectus. The Product is made available in Thailand through Citicorp Securities (Thailand) Ltd., which is regulated by the Securities and Exchange Commission of Thailand. 18/F, 22/F and 29/F, 82 North Sathorn Road, Silom, Bangrak, Bangkok 10500, Thailand. The Product is made available in Turkey through Citibank AS which is regulated by Capital Markets Board. Tekfen Tower, Eski Buyukdere Caddesi # 209 Kat 2B, 23294 Levent, Istanbul, Turkey. In the U.A.E, these materials (the "Materials") are communicated by Citigroup Global Markets Limited, DIFC branch ("CGML"), an entity registered in the Dubai International Financial Center ("DIFC") and licensed and regulated by the Dubai Financial Services Authority ("DFSA") to Professional Clients and Market Counterparties only and should not be relied upon or distributed to Retail Clients. A distribution of the different Citi Research ratings distribution, in percentage terms for Investments in each sector covered is made available on request. Financial products and/or services to which the Materials relate will only be made available to Professional Clients and Market Counterparties. The Product is made available in United Kingdom by Citigroup Global Markets Limited, which is authorised and regulated by Financial Services Authority. This material may relate to investments or services of a person outside of the UK or to other matters which are not regulated by the FSA and further details as to where this may be the case are available upon request in respect of this material. Citigroup Centre, Canada Square, Canary Wharf, London, E14 5LB. The Product is made available in United States by Citigroup Global Markets Inc, which is a member of FINRA and registered with the US Securities and Exchange Commission. 388 Greenwich Street, New York, NY 10013. Unless specified to the contrary, within EU Member States, the Product is made available by Citigroup Global Markets Limited, which is regulated by Financial Services Authority. Pursuant to Comissão de Valores Mobiliários Rule 483, Citi is required to disclose whether a Citi related company or business has a commercial relationship with the subject company. Considering that Citi operates multiple businesses in more than 100 countries around the world, it is likely that Citi has a commercial relationship with the subject company. Many European regulators require that a firm must establish, implement and make available a policy for managing conflicts of interest arising as a result of publication or distribution of investment research. The policy applicable to Citi Research's Products can be found at https://www.citivelocity.com/cvr/eppublic/citi_research_disclosures. Compensation of equity research analysts is determined by equity research management and Citigroup's senior management and is not linked to specific transactions or recommendations. The Product is not to be construed as providing investment services in any jurisdiction where the provision of such services would not be permitted. Subject to the nature and contents of the Product, the investments described therein are subject to fluctuations in price and/or value and investors may get back less than originally invested. Certain high-volatility investments can be subject to sudden and large falls in value that could equal or exceed the amount invested. Certain investments contained in the Product may have tax implications for private customers whereby levels and basis of taxation may be subject to change. If in doubt, investors should seek advice from a tax adviser. The Product does not purport to identify the nature of the specific market or other risks associated with a particular transaction. Advice in the Product is general and should not be construed as personal advice given it has been prepared without taking account of the objectives, financial situation or needs of any particular investor. Accordingly, investors should, before acting on the advice, consider the appropriateness of the advice, having regard to their objectives, financial situation and needs. Prior to acquiring any financial product, it is the client's responsibility to obtain the relevant offer document for the product and consider it before making a decision as to whether to purchase the product. Citi Research generally disseminates its research to the Firm’s global institutional and retail clients via both proprietary (e.g., Citi Velocity and Citi Personal Wealth Management) and non-proprietary electronic distribution platforms. Certain research may be disseminated only via Citi’s proprietary distribution platforms;; however such research will not contain changes to earnings forecasts, target price, investment or risk rating or investment thesis or be otherwise inconsistent with the author’s previously published research. Certain research is made available only to institutional investors to satisfy regulatory requirements. Individual Citi Research analysts may also opt to circulate published research to one or more clients by email;; such email distribution is discretionary and is done only after the research has been disseminated. The level and types of services provided by Citi Research analysts to clients may vary depending on various factors such as the client’s individual preferences as to the frequency and manner of receiving communications from analysts, the client’s risk profile and investment focus and perspective (e.g. market-wide, sector specific, long term, short-term etc.), the size and scope of the overall client relationship with Citi and legal and regulatory constraints. Citi Research product may source data from dataCentral. dataCentral is a Citi Research proprietary database, which includes Citi estimates, data from company reports and feeds from Thomson Reuters. © 2013 Citigroup Global Markets Inc. Citi Research is a division of Citigroup Global Markets Inc. Citi and Citi with Arc Design are trademarks and service marks of Citigroup Inc. and its affiliates and are used and registered throughout the world. All rights reserved. Any unauthorized use, duplication, redistribution or disclosure of this report (the “Product”), including, but not limited to, redistribution of the Product by electronic mail, posting of the Product on a website or page, and/or providing to a third party a link to the Product, is prohibited by law and will result in prosecution. The information contained in the Product is intended solely for the recipient and may not be further distributed by the recipient to any third party. Where included in this report, MSCI sourced information is the exclusive property of Morgan Stanley Capital International Inc. (MSCI). Without prior written permission of MSCI, this information and any other MSCI intellectual property may not be reproduced, redisseminated or used to create any financial products, including any indices. This information is provided on an "as is" basis. The user assumes the entire risk of any use made of this information. MSCI, its affiliates and any third party involved in, or

Sovereign Default Risk and Relative Value 24 December 2013 Citi Research
34
related to, computing or compiling the information hereby expressly disclaim all warranties of originality, accuracy, completeness, merchantability or fitness for a particular purpose with respect to any of this information. Without limiting any of the foregoing, in no event shall MSCI, any of its affiliates or any third party involved in, or related to, computing or compiling the information have any liability for any damages of any kind. MSCI, Morgan Stanley Capital International and the MSCI indexes are services marks of MSCI and its affiliates. The Firm accepts no liability whatsoever for the actions of third parties. The Product may provide the addresses of, or contain hyperlinks to, websites. Except to the extent to which the Product refers to website material of the Firm, the Firm has not reviewed the linked site. Equally, except to the extent to which the Product refers to website material of the Firm, the Firm takes no responsibility for, and makes no representations or warranties whatsoever as to, the data and information contained therein. Such address or hyperlink (including addresses or hyperlinks to website material of the Firm) is provided solely for your convenience and information and the content of the linked site does not in anyway form part of this document. Accessing such website or following such link through the Product or the website of the Firm shall be at your own risk and the Firm shall have no liability arising out of, or in connection with, any such referenced website. ADDITIONAL INFORMATION IS AVAILABLE UPON REQUEST