southwark retail study final report southwark... · southwark retail study final report 19 june...
TRANSCRIPT

Southwark Retail Study FINAL REPORT
19 June 2015
14115/PW/PW
Nathaniel Lichfield & Partners 14 Regent's Wharf All Saints Street London N1 9RL nlpplanning.com

This document is formatted for double sided printing. © Nathaniel Lichfield & Partners Ltd 2015. Trading as Nathaniel Lichfield & Partners. All Rights Reserved. Registered Office: 14 Regent's Wharf All Saints Street London N1 9RL All plans within this document produced by NLP are based upon Ordnance Survey mapping with the permission of Her Majesty’s Stationery Office. © Crown Copyright reserved. Licence number AL50684A
Southwark Retail Study : FINAL REPORT
9190961v2
Contents
1.0 Introduction 1
Study Objectives .............................................................................................. 1
2.0 The Town Centre Hierarchy 2
Introduction ...................................................................................................... 2
The Designation of Town Centres .................................................................... 2
Town Centre Hierarchy Analysis ...................................................................... 4
3.0 Recent Changes and Retail Trends 11
Introduction .................................................................................................... 11
National Policy Context .................................................................................. 11
The London Plan March 2015 (consolidated with alterations since 2011) ...... 12
Retail Trends ................................................................................................. 12
4.0 Retail Need Assessment 20
Introduction .................................................................................................... 20
Study Area ..................................................................................................... 20
Population and Expenditure ........................................................................... 21
Existing Retail Floorspace 2014 ..................................................................... 22
Existing Spending Patterns 2014 ................................................................... 22
Quantitative Capacity for Convenience Floorspace ........................................ 25
Quantitative Capacity for Comparison Floorspace ......................................... 26
5.0 Qualitative Need for Retail Floorspace 29
Introduction .................................................................................................... 29
Diversity of Town Centre Uses ....................................................................... 29
Convenience Goods Shopping ....................................................................... 30
High Street Comparison Goods Shopping ...................................................... 31
Retail Warehouses ......................................................................................... 32
6.0 Food/Beverage and Other Town Centre Uses 33
Introduction .................................................................................................... 33
Food and Beverage (Class A3 to A5) ............................................................. 33
Class A2 Uses ............................................................................................... 36
7.0 Commercial Leisure Uses 38
Introduction .................................................................................................... 38
Cinemas......................................................................................................... 38
Theatres......................................................................................................... 39
Health and Fitness Clubs ............................................................................... 39
Tenpin Bowling .............................................................................................. 41
Nightclubs/Live Music Venues ....................................................................... 41
Southwark Retail Study : FINAL REPORT
9190961v2
Bingo .............................................................................................................. 41
Conclusions ................................................................................................... 42
8.0 Accommodating Growth 43
Introduction .................................................................................................... 43
Floorspace Projections ................................................................................... 43
Vacant Floorspace ......................................................................................... 45
Growth in North West Southwark (Zone 1) ..................................................... 45
Growth in North East Southwark (Zone 2) ...................................................... 46
Growth in Central Southwark (Zone 3) ........................................................... 47
Growth in South Southwark (Zone 4) ............................................................. 48
Development at Canada Water and Elephant & Castle .................................. 48
9.0 Policy Review and Delivery Implications 53
Introduction .................................................................................................... 53
The Network of Centres ................................................................................. 53
Impact and Sequential Tests .......................................................................... 54
Protected Shopping Frontages ....................................................................... 57
10.0 Conclusions 65
Introduction .................................................................................................... 65
Meeting Needs in LB Southwark .................................................................... 65
Development Plan Strategy Recommendations ............................................. 66
Southwark Retail Study : FINAL REPORT
9190961v2 P1
1.0 Introduction
1.1 Southwark Council commissioned a Retail Study in 2009, prepared by GVA
Grimley. Nathaniel Lichfield & Partners (NLP) has been commissioned by
Southwark Council to prepare a comprehensive Retail Study Update, which
assesses changes since the 2009 Study.
Study Objectives
1.2 The key objective of the Retail Study is to provide a robust and credible
evidence base to inform the Council’s work on the New Southwark Plan, based
on changes since the 2009 Retail Study. The key objectives of the study are to:
• assess changes in circumstances and shopping patterns since the
previous study was undertaken, not least the effects of the recession and
the availability of 2011 Census data;
• assess the future need and (residual) capacity for retail floorspace
distributed by the main centres/shopping destinations for the proposed
plan period;
• assess the potential implications of emerging developments both within
and outside the borough e.g. Croydon, Westfield London, in terms of
impact on town centres and potential changes to shopping patterns;
• review the existing retail hierarchy and network of centres and advise
whether any changes are required;
• identify appropriate shopping frontages and policy approaches; and
• provide advice on future development plan policies and
recommendations on how each centre can develop its role.
1.3 Section 2 of this report describes the shopping hierarchy. Section 3 outlines
recent changes and retail trends. Sections 4 and 5 provide the updated retail
capacity and a quantitative and qualitative need assessment. Section 6
assesses the capacity for Class A3 to A5 food and beverage floorspace.
Section 7 assesses the need for commercial leisure uses. Section 8 explores
opportunities for accommodating growth and Section 9 provides a review of
policy and delivery implications. The recommendations and conclusions are
contained in Section 10.

Southwark Retail Study : FINAL REPORT
P2 9190961v2
2.0 The Town Centre Hierarchy
Introduction
2.1 The National Planning Policy Framework (NPPF) indicates (paragraph 23) that
planning policies should be positive, promote competitive town centre
environments and set out policies for the management and growth of centres
over the plan period. Development plans are expected to define a network and
hierarchy of centres that is resilient to anticipated future economic changes.
2.2 The National Planning Practice Guidance (NPPG) replaced the PPS4 guidance
on town centres in 2012. In terms of plan-making the NPPG’s emphasis is on
developing strategies for town centres that are appropriate and realistic to the
role of centres in the hierarchy. Town centre strategies should be based on the
current state of a centre and opportunities to meet development needs. These
town centre strategies should seek to support the town centre vitality and
viability, and should assess if changes to the role and hierarchy of centres are
appropriate. This section provides an overview of the shopping hierarchy in
Southwark and the surrounding sub-region.
The Designation of Town Centres
2.3 The NPPF indicates that local planning authorities should adopt a positive and
proactive approach to planning for growth and the future of the centres within
their areas. Local planning authorities are expected to identify the hierarchy of
centres and how the role of different centres will contribute to the overall vision
for their area. The town centre hierarchy is clearly set out in the Southwark
Core Strategy and the London Plan.
2.4 The London Borough of Southwark is located to the south of central London,
south of the river Thames and is bounded by six boroughs: The City of London
and Tower Hamlets to the north, Lewisham to the east, Bromley and Croydon
to the south, and Lambeth to the west. In terms of the London Plan hierarchy
the London Borough of Southwark contains one Major Centre and five District
Centres, as follows:
Major Centres
• Peckham
District Centres
• Lordship Lane
• Elephant and Castle
• Canada Water
• Walworth Road
• Camberwell

Southwark Retail Study : FINAL REPORT
9190961v2 P3
2.5 These centres within the London Borough of Southwark compete with major
shopping destinations outside the borough including:
• London West End;
• The City of London
• Croydon;
• Canary Wharf;
• Bluewater;
• Brixton;
• Lewisham and
• Bromley.
2.6 The London Plan 2015 sets out the London wide shopping hierarchy, as shown
below. International Centres are located in Central London. Inner London is
served by a series of Major Centres. Inner south London, including the London
Borough of Southwark, is served by Peckham, Brixton, Lewisham, Catford,
Streatham and Canary Wharf. Outer South London is served by the
Metropolitan Centres of Croydon, Bromley, Sutton and Kingston.
Figure 2.1: Extract from London Plan
Source: GLA London Plan
2.7 The Southwark Core Strategy incorporates some recommendations from the
London Plan and sets out a slightly different hierarchy by reclassifying two of
the centres as Major Town Centres due to the potential increase in floorspace
expected over the next 20 years. The Core Strategy Strategic Policy 3
identifies three Major Town Centres, four District Town Centres and three
Local Centres as set out below.

Southwark Retail Study : FINAL REPORT
P4 9190961v2
2.8 The London Plan identifies Elephant & Castle and Canada Water as District
Centres rather than Major Centres as suggested by the Core Strategy. The
London Plan indicates these two centres have the potential to evolve and
become Major Centres. The Core Strategy designations are consistent with
this approach. The London Plan hierarchy is set out below.
Major Centres
• Peckham
• Elephant & Castle / Walworth Road
• Canada Water
District Centres
• London Bridge
• Bankside and Borough
• Camberwell
• Lordship Lane
• Herne Hill
Local Centres
• The Blue
• Dulwich Village
• Nunhead
2.9 Below District Centres, the London Plan refers to Neighbourhood and Local
Centres, but these centres are not individually identified. The London Plan
designates London Bridge and Borough High Street as CAZ frontages.
2.10 As indicated above, the Southwark Core Strategy combines Elephant & Castle
and Walworth Road to form a Major Centre and Canada Water is also
designated. Herne Hill, London Bridge and Bankside and Borough are
additionally designated as District Centres.
Town Centre Hierarchy Analysis
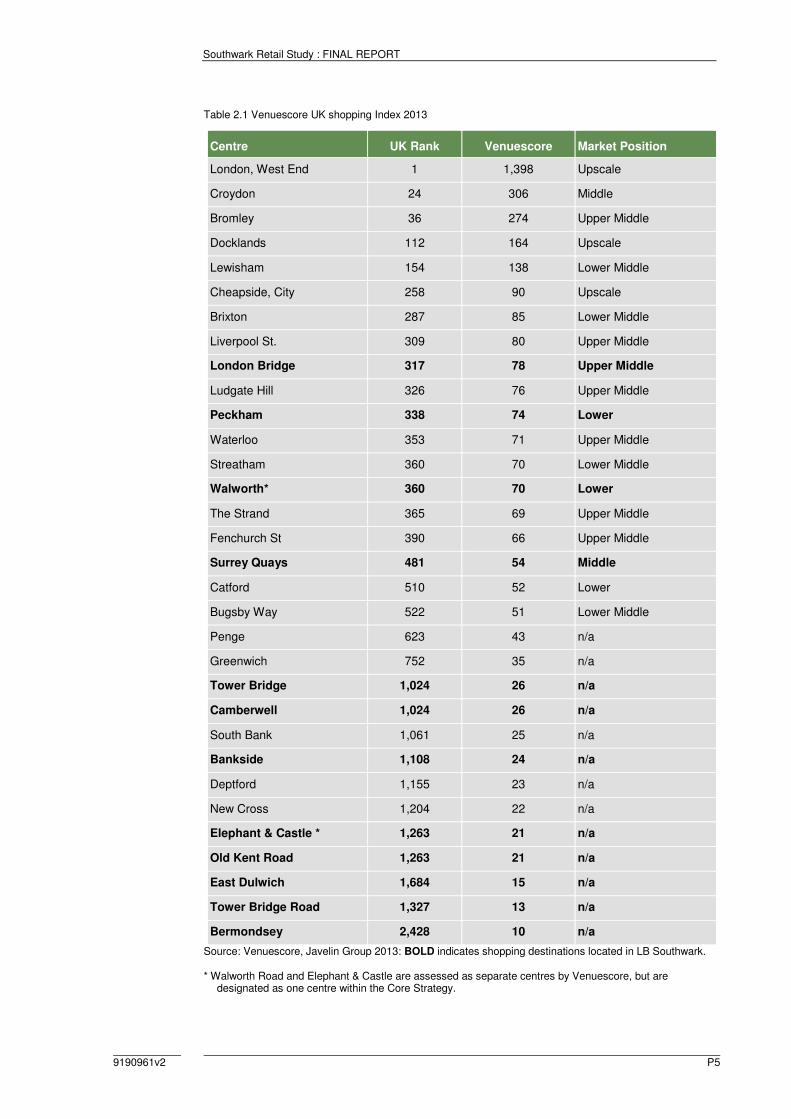
2.11 Venuescore ranks the UK’s top 2,000 retail destinations including town
centres, malls, retail warehouse parks and factory outlet centres. The results
for the borough and other relevant centres are shown in Table 2.1. Each
destination is given a weighted score for the number of multiple retailers
present; the score attached to each retailer is weighted depending on their
overall impact on shopping patterns.
Southwark Retail Study : FINAL REPORT
9190961v2 P5
Table 2.1 Venuescore UK shopping Index 2013
Centre UK Rank Venuescore Market Position
London, West End 1 1,398 Upscale
Croydon 24 306 Middle
Bromley 36 274 Upper Middle
Docklands 112 164 Upscale
Lewisham 154 138 Lower Middle
Cheapside, City 258 90 Upscale
Brixton 287 85 Lower Middle
Liverpool St. 309 80 Upper Middle
London Bridge 317 78 Upper Middle
Ludgate Hill 326 76 Upper Middle
Peckham 338 74 Lower
Waterloo 353 71 Upper Middle
Streatham 360 70 Lower Middle
Walworth* 360 70 Lower
The Strand 365 69 Upper Middle
Fenchurch St 390 66 Upper Middle
Surrey Quays 481 54 Middle
Catford 510 52 Lower
Bugsby Way 522 51 Lower Middle
Penge 623 43 n/a
Greenwich 752 35 n/a
Tower Bridge 1,024 26 n/a
Camberwell 1,024 26 n/a
South Bank 1,061 25 n/a
Bankside 1,108 24 n/a
Deptford 1,155 23 n/a
New Cross 1,204 22 n/a
Elephant & Castle * 1,263 21 n/a
Old Kent Road 1,263 21 n/a
East Dulwich 1,684 15 n/a
Tower Bridge Road 1,327 13 n/a
Bermondsey 2,428 10 n/a
Source: Venuescore, Javelin Group 2013: BOLD indicates shopping destinations located in LB Southwark. * Walworth Road and Elephant & Castle are assessed as separate centres by Venuescore, but are
designated as one centre within the Core Strategy.

Southwark Retail Study : FINAL REPORT
P6 9190961v2
2.12 The Venuescore data is also shown on Figure 2.2. Contrary to the London
Plan, the Venuescore index ranks London Bridge as the main centre within the
borough, ranked 78th out of all centres in the UK. Central London is ranked at
the top end of the hierarchy.
Figure 2.2 Venuescore Centres in Central/South London
Source: Javelin Venuescore 2013
Southwark Retail Study : FINAL REPORT
9190961v2 P7
2.13 The Venuescore usually closely correlates to the actual market size of the
shopping destination in terms of consumer expenditure, however some larger
shopping centres such as Westfield with fewer but larger stores and town
centres with a high proportion of independent stores can generate spending
levels in excess of their relative Venuescore.
2.14 Venuescore also assess the market position of the larger town centres based
on the retailers present and the centre’s relative position along a spectrum
running from discount to luxury (i.e. lower, middle to upscale).
2.15 London Bridge, Peckham, Surrey Quays and Walworth Road are third tier
centres, on a par with centres such as Brixton, Waterloo and Streatham,
suggesting they have a limited comparison retail offer compared with Central
London, Croydon and Bromley. Tower Bridge, Camberwell, Elephant & Castle,
Old Kent Road, East Dulwich and Bermondsey feature in the Venuescore
rankings but achieve relatively low scores, suggesting they are fourth tier
centres in the Venuescore hierarchy. They compete with other small centres,
meeting day to day needs and providing local services.
Existing Retail Provision in LB Southwark
2.16 A summary of existing retail provision is provided in Table 2.2 overleaf.
2.17 A more detailed assessment of the existing retail provision in the main centres
is provided in the centre audits included at Appendix 7. For the 13 main
centres of Peckham, Elephant & Castle, Walworth Road, Camberwell, Canada
Water, London Bridge, Bankside and Borough, The Blue, Dulwich Lordship
Lane, Nunhead, Herne Hill, Dulwich Village and Tower Bridge Road, the audit
reviews the centre against indicators of vitality and viability, using the national
average for all centres within the UK (all town centre Goad across the UK).
2.18 In total, Southwark Borough has 208,666 sq.m gross of retail sales floorspace,
of which about 44% is accommodated within food stores and convenience
goods shops. Comparison shops/stores account for 56%.
2.19 Peckham is the main centre in the borough in terms of number of outlets and
the amount of retail floorspace. However the household survey results suggest
the Old Kent Road is the dominant destination for comparison shopping within
the borough. It is important for the Major Centres to maintain and strengthen
their comparison shopping role in the retail hierarchy. The smaller District and
Local Centres should continue to perform a more local function.

Southwark Retail Study : FINAL REPORT
P8 9190961v2
Table 2.2 Existing Retail Provision in LB Southwark
Centre
Number
Shop
Units
Convenience
Floorspace
(sq.m gross)
Comparison
Floorspace
(sq.m gross)
Food and
Beverage
(sq.m gross)
Peckham Major Centre 384 22,280 27,270 7,080
Canada Water Major Centre 135 9,500 19,928 7,240
Elephant & Castle Major Centre 93 2,540 4,710 3,170
Walworth Road Major Centre 273 9,080 17,980 6,980
London Bridge District Centre 94 2,080 1,520 6,590
Bankside/Borough District Centre 147 3,838 1,450 9,790
Lordship Lane District Centre 156 3,630 6,680 5,020
Camberwell District Centre 192 5,690 5,680 6,410
Herne Hill District Centre 107 1,100 3,000 2,900
The Blue Local Centre 80 2,740 1,715 1,500
Dulwich Village Local Centre 32 500 1,600 886
Nunhead Local Centre 62 1,100 2,100 867
Tower Bridge (undesignated) 63 1,080 640 1,360
Old Kent Road (undesignated) 35 11,800 19,800 2,000
Food stores outside centres 15 16,000 n/a n/a
Total 1,867 92,958 115,708 61,793
Sources: Tables 6A and 6B in Appendix 2, Table 6 in Appendix 3 and Table 7 in Appendix 4.
2.20 The sequential approach indicates that town, district and local centres are the
preferred location for the main town centre uses including retail and leisure
development. Some forms of development may be more appropriate in smaller
centres, if there are localised areas of deficiency. The key issues are the
nature and scale of retail/leisure development proposed and the catchment
area the development seeks to serve. Development should normally be
consistent in terms of scale and nature with the character and role of the
nearest centre. The sequential approach indicates that the first preference for
new developments should be within centres followed by edge-of-centre sites in
town and district centre locations. Out-of-centre sites are last in the order of
preference.
2.21 The distinction between town, district and local centres is important when
applying the sequential approach. The nature, role and location of proposed
retail/leisure schemes need to be considered when applying the sequential
approach. Development plan policies in LB Southwark should continue to
clearly define which centres are town, district or local centres within the context

Southwark Retail Study : FINAL REPORT
9190961v2 P9
of the London Plan, in order to avoid confusion when applying the sequential
approach.
2.22 The London Plan suggests Major Centres should have borough wide
catchment areas, and are typically smaller than Metropolitan Centres. Their
attractiveness is derived both from comparison and convenience shopping and
in some cases leisure and entertainment functions. These centres may have
developed sizeable catchment areas and normally have over 50,000 sq.m of
retail floorspace. Peckham is the only centre in the borough with this scale of
retail floorspace (56,630 sq.m of retail floorspace) and so is rightly designated
as a Major Centre.
2.23 Elephant & Castle and Walworth Road have a joint retail floorspace total of
44,460 sq.m and Canada Water has 36,668 sq.m, meaning they are both
relatively large centres and similar to Peckham. The redevelopment of the
Heygate Estate will help to consolidate Elephant and Castle and Walworth
Road, creating a centre large enough to be classified as a ‘Major Centre’.
Similarly, the redevelopment of Surrey Quays shopping centre and the creation
of a new town centre environment at Canada Water will also consolidate the
centre to provide a “Major Centre”.
2.24 As indicated earlier London Bridge and Bankside/Borough are designated as
separate District Centres, but are located within close proximity to each other.
These commercial areas have a combined retail floorspace total of 25,268
sq.m, but this is predominantly food and beverage use. The retail and leisure
facilities are also dispersed, with a series of separate clusters. The area does
not function as a town centre. Collectively, the different areas serve local
residents (particularly Borough High Street), employees, tourists/entertainment
visitors and commuters passing through the transport hub (London Bridge
Station).
2.25 The Core Strategy town centre boundaries at Bankside/Borough and London
Bridge are cast widely. The areas contain a diverse range of uses including
retail, office, law, cultural, tourism, education, health, transport and residential
which help reinforce the central activities zone. One option available to the
Council would be to designate CAZ frontages on existing retail parades.
However this would not fully reflect the dynamism of the area or change which
is occurring in places such as Blackfriars Road, Southwark Street and St
Thomas Street, where retail uses are becoming a more established part of the
existing mix. The second option available to the Council would be to maintain
the existing approach which provides greater flexibility to enable change and
the establishment of new retail uses in appropriate locations.
2.26 Camberwell and Lordship Lane are the largest District Centres with 17,780
sq.m and 15,330 sq.m of gross retail floorspace respectively. These
designations are consistent with the London Plan.
2.27 Herne Hill is described as a small district centre within the Lambeth Core
Strategy, with retail floorspace provision of around 7,000 sq.m. Herne Hill is
predominantly located within LB Lambeth. The appropriate future designation

Southwark Retail Study : FINAL REPORT
P10 9190961v2
of Herne Hill should be considered by Lambeth Council. Southwark Council
should continue to identify and maintain the retail frontages that form part of
this centre within their authority area, and should continue to classify the centre
consistently within Lambeth Council.
2.28 Below District Centres, the Southwark Core Strategy designates local centres.
Local centres will generally include a range of small shops of a local nature,
serving a small catchment. Typically, local centres include, amongst other
shops, a small supermarket/convenience store, a newsagent, a post office and
a pharmacy. Other facilities usually include hot-food takeaways and dry
cleaners/launderette.
2.29 The Blue, Nunhead and Dulwich Village serve their local catchment and should
remain designated as Local Centres. Tower Bridge Road is of similar size to
the three local centres and serves the local population of Bermondsey and
Borough and so should be upgraded to ‘Local Centre’ designation.
2.30 The Old Kent Road is not a designated centre, but there is potential to create a
local centre at the north end. This area already has parades of shops on either
side of Old Kent Road, which largely serve a local catchment. These local
facilities include a post office, library, doctor’s surgery, faith premises and
supermarket. There may also be potential to create a local or town centre
towards the southern end of Old Kent Road e.g. around junction of St James’
Road, Old Kent Road and Peckham Park Road, depending on scale of growth
envisaged within the Old Kent Road area.

Southwark Retail Study : FINAL REPORT
9190961v2 P11
3.0 Recent Changes and Retail Trends
Introduction
3.1 The retail capacity projections set out in the 2009 Retail Study need to be
updated in line with the latest population data from the 2011 Census and the
ONS’s latest projections. Local expenditure data and growth projections also
need to be updated, along with company average benchmark turnover figures.
These changes need to be reviewed in the context of recent retail trends.
National Policy Context
3.2 National policy relating to retail and town centres was set out in PPS4 at the
time the 2009 study was prepared. PPS4 was superseded by the National
Planning Policy Framework (NPPF) in March 2012.
3.3 The main policy objective of ensuring the vitality of town centres has remained
broadly unchanged during this period. The NPPF indicates planning policies
should be positive, promote competitive town centre environments and set out
policies for the management and growth of centres over the plan period. Town
centres are expected to be the heart of the community and policies should
support their vitality and viability.
3.4 In drawing up Local Plans, the NPPF continues to require local planning
authorities to define a network and hierarchy of centres and define the extent
of town centres and primary shopping areas.
3.5 The NPPF provides limited guidance on how to define the network of centres.
The glossary in Annex 2 of the NPPF defines town centres as:
“Town centre: Area defined on the local authority’s proposal map, including the
primary shopping area and areas predominantly occupied by main town centre
uses within or adjacent to the primary shopping area. References to town
centres or centres apply to city centres, town centres, district centres and local
centres but exclude small parades of shops of purely neighbourhood
significance. Unless they are identified as centres in Local Plans, existing out-
of-centre developments, comprising or including main town centre uses, do not
constitute town centres.”
3.6 The NPPF requires local authorities to allocate a range of suitable sites to
meet the scale and type of retail and other main town centre uses. The NPPF
indicates that the need for development should be met in full. The allocation of
sites should adopt the sequential approach to site selection, i.e. town centre
first, followed by edge of centre sites and then out of centre that are well
connected to the town centre.
3.7 Sections 4, 5 and 6 of this report re-assesses the need for new retail (Class
A1, A3 to A5) development in the borough.
Southwark Retail Study : FINAL REPORT
P12 9190961v2
3.8 The NPPF indicates (paragraph 14) that local planning authorities should
positively seek opportunities to meet the development needs of their area, and
Local Plans should meet objectively assessed needs.
3.9 The National Planning Policy Guidance (NPPG) indicates that development
plans should develop (and keep under review) town centre strategies that plan
for a 3-5 year period, whilst also giving a Local Plan lifetime view. Plans should
identify the scale of need for main town centre uses.
3.10 The NPPG also introduces the requirement to consider a range of plausible
scenarios, including a ‘no development’ scenario, which should not assume
that all centres are likely to benefit from expenditure growth.
The London Plan March 2015 (consolidated with alterations since 2011)
3.11 Policy 2.15 “Town Centres” within the London Plan 2015 provides guidance on
the preparation of development plans. Borough councils are expected to:
1 ensure that local retail capacity requirements take realistic account of
changes in consumer expenditure and behaviour including the impact of
internet and multi-channel shopping;
2 identify town centre boundaries, primary shopping areas, primary and
secondary frontages in LDF proposals maps and set out policies for each
type of area;
3 relate the existing and planned role of centres to the network as a whole;
4 proactively manage the changing role of centres, by promoting
diversification, particularly through residential led mixed use
redevelopment in a high quality environment;
5 support and encourage town centre management, partnerships and
strategies including business improvement districts to promote safety,
security and environmental quality;
6 promote the provision of Shopmobility schemes and other measures to
improve access to goods and services for older and disabled Londoners.
Retail Trends
3.12 This section considers the changes in the retail sector nationally and the
implications for Southwark Borough.
3.13 The economic downturn had a significant impact on the retail sector. A number
of national operators have failed (e.g. Phones 4 U, Blockbuster, Comet, HMV,
JJB Sports, Jessops, Clinton Cards, Woolworths, MFI, Land of Leather,
Borders, Game, Firetrap, Peacocks, La Senza, Past Times, Barratts and
Habitat), leaving major voids within town centres and on retail parks.

Southwark Retail Study : FINAL REPORT
9190961v2 P13
3.14 Many town centre development schemes have been delayed and the demand
for traditional retail warehouse operators has also been affected. Even some of
the main food store operators have seen a reduction in growth.
3.15 Assessing future expenditure levels within this study needs to take into account
the likely speed of the economic recovery, particularly in the short term. Careful
consideration is needed to establish the appropriate level of expenditure
growth to be adopted over the plan period. This study takes a long term view
for the plan period recognising the cyclical nature of expenditure growth.
Trends in population growth, home shopping/internet sales and growth in
turnover efficiency also need to be carefully considered and a balanced
approach taken.
3.16 An overview of national trends within the retail sector is set out below.
Expenditure Growth
3.17 Historic retail trends indicate that expenditure has consistently grown in real
terms in the past, generally following a cyclical growth trend. The underlying
trend shows consistent growth and this trend is expected to continue in the
future. However the recovery from the economic downturn is expected to result
in slower growth in the short term.
3.18 In the past, expenditure growth has fuelled growth in retail floorspace, including
major out-of-centre development, particularly in the 1980s and 1990s. The
speed of recovery from the economic downturn suggests that high past rates of
growth are unlikely to be achieved in the short term, but the underlying trend
over the medium and long terms is expected to lead to a need for further
modern retail floorspace, even allowing for continued growth in home
shopping. These national trends are anticipated to be mirrored in Southwark.
3.19 For convenience goods, Experian anticipates limited growth up to 2016 in the
UK, but stronger growth thereafter (0.6% per annum). For comparison goods,
higher levels of growth are expected in the future (3.3% per annum after 2016),
still at a lower rate than previous pre-recession trends. Historically comparison
goods expenditure has growth significantly more than convenience goods
expenditure, and Experian’s latest national growth rate recommendations are
consistent with these past trends.
3.20 By way of comparison, Experian’s Consumer Expenditure and Comparison
goods Floorspace Need in London Summary report - October 2013 (prepared
for the GLA), suggests average growth rates of 2.1% per annum for
convenience goods and 3% for comparison goods in London. However
Experian’s London projections are based on average household spending
rather than their national growth rates that relate to expenditure per capita, and
therefore the figures are not directly comparable. Furthermore, Experian’s
recommended national growth rate for convenience goods reduced from 0.8%
in October 2013 to 0.6% in October 2014. It is unclear how this reduction in
national rates will affect Experian’s London based projections.

Southwark Retail Study : FINAL REPORT
P14 9190961v2
3.21 Low expenditure growth and deflationary pressures (i.e. price cutting) in the
non-food sector have had an impact on the high street in the last few years. As
a result of these trends, the national average shop vacancy rate (based on
Goad Plan data) has increased from around 10% in 2005 to over 12% in 2014.
There are 152 vacant shop units within the borough, which equates to an
overall vacancy rate of 8.4%, which is lower than the Goad national average
(12.1%). These figures suggest that during and since the recession Southwark
has performed better than other centres across the country in terms of shop
vacancies.
New Forms of Retailing
3.22 New forms of retailing (multi-channel shopping) have continued to grow, as an
alternative to more traditional shopping. Home/electronic shopping has
increased with the growth in the use of personal computers, smart phones and
the internet. Click and collect shopping has become more popular. The future
growth of multi-channel retailing including home computing, internet
connections and interactive TV will continue to have an effect on retailing in the
high street and from traditional stores. Trends within this sector may well have
implications for retailing within Southwark.
3.23 On-line shopping has experienced rapid growth since the late 1990s but in
proportional terms the latest available data suggests it remains a relatively low
percentage of total retail expenditure. The household survey results suggest
6.0% of households in study area did their last main food and grocery shopping
via the internet/delivery and 8.1% of households do most of their non-food
shopping at home via the internet, TV or catalogue. These figures represent a
lower proportion than the internet’s national share of retail expenditure (12% in
2013 – Experian, October 2014). The comparable figures within the combined
Lambeth and Wandsworth study area were similar at 7.5% for main food and
grocery shopping and 7.3% for non-food shopping.
3.24 More details on internet shopping habits in the study area are set out in the
results of the household survey, summarised in Appendix 8. The internet
shopping figures for Southwark do not indicate higher levels of home shopping
than the national average, however internet sales in Southwark should
increase in the future and this assumption is reflected in the allowance made
for a growth in the proportion of non-store spending, as set out in the retail
capacity methodology in Appendix 1.
3.25 Recent trends suggest continued strong growth in this sector. Experian’s Retail
Planner Briefing Note 12.1 (October 2014) states:
“The strong increase in online shopping in the past decade has lifted the share
of special forms of trading (SFT) to a level where it now accounts for over a
tenth of total retail sales…
The rising share of internet sales in total retail transactions dominates the
picture of SFT. Internet sales’ share of total retail sales stood at 10.6% in mid-
2014 against 4.7% in June 2008...

Southwark Retail Study : FINAL REPORT
9190961v2 P15
Non-store retailing continues to grow rapidly, outpacing traditional forms of
spending. We retain our assumption that non-store retailing will increase at a
faster pace than total retail sales well into the long term. There were 52.7
million internet users in the UK (representing 84.1% of the population) in mid-
year 2012 according to Internet World Stats. So growth of the internet user
base will be less of a driver than in the past decade. But growth momentum will
be sustained as new technology such as browsing and purchasing through
mobile phones and the development of interactive TV shopping boost internet
retailing. We expect that the SFT market share will continue to increase over
the forecast period, although the pace of e-commerce growth will moderate
markedly after about 2020. Our forecast has the SFT share of total retail sales
reaching 18.5% by 2020 rising to 20.3% by the mid-2030s.”
3.26 This Study makes an allowance for future growth in e-tailing based on
Experian projections. It will be necessary to monitor the amount of sales
attributed to home shopping in the future in order to review future policies and
development allocations.
3.27 The implications on the demand for retail space need to be carefully
considered. For example, some retailers operate on-line sales from their
traditional retail premises e.g. food store operators and click and collect
operations, therefore growth in on-line sales may not always mean there is a
reduction in the need for retail floorspace.
3.28 Given the likelihood that multi-channel shopping is likely to grow at a faster
pace than total retail expenditure, the retail study assessment has adopted
relatively cautious growth projections for retail expenditure (as set out in the
retail capacity methodology, Appendix 1), and allowance has been made for
retailers to increase their turnover density, due to growth in home shopping
and click and collect.
3.29 In addition to new forms of retailing, retail operators have responded to
changes in customers’ requirements. Retailers have also changed their trading
formats to include smaller store formats capable of being accommodated
within town centres (such as the Tesco Express/Metro, Sainsbury’s Central/
Local store and Marks and Spencer’s Simply Foods formats). The number of
Tesco Express and Sainsbury’s Local stores has increased significantly during
the last decade, due to the operator’s national expansion in this sector, and
perhaps also due to the absence of available sites for larger food stores. This
trend has been particularly evident in Southwark, with numerous local
convenience stores operated by the main food store retailers e.g. Sainsbury’s
and Tesco.
3.30 Food store operators have also implemented a programme of store extensions,
particularly Tesco, Sainsbury and Asda. These operators, faced with limited
growth in food expenditure, have often increased the sale of non-food products
within their food stores, including clothing and electrical goods. The recent
recession halted this trend for extensions nationally.
Southwark Retail Study : FINAL REPORT
P16 9190961v2
3.31 The expansion of European discount food operators Aldi and Lidl has been
rapid during the last decade. This is evident in Southwark, which currently has
an Aldi store and three Lidl stores.
3.32 A plan showing the location of the existing main food stores within Southwark
is included at Appendix 1.
3.33 Comparison retailers have also responded to market conditions. The bulky
goods warehouse sector has rationalised, including a number of mergers and
failures, and scaled down store sizes. Other traditional high street retailers
often seek large out-of-centre stores, for example Boots, Next, TK Maxx and
Poundstretcher. Matalan has also opened numerous discount clothing stores
across the UK. Sports clothing retail warehouses including Decathlon have
also expanded out-of-centre.
3.34 The charity shop sector has grown steadily over the past 20 years and there is
no sign this trend will halt. In many centres, charity shops have occupied
vacated shop premises during the recession. In many cases charity shops can
afford higher rents than small independent occupiers because of business rate
discounts, therefore it does not follow that these charity shops will be replaced
by traditional shops when the market recovers, particularly in secondary
frontages.
3.35 The discount comparison sector has also grown significantly in recent years
e.g. pound shops. Charity shops account for only 4% of all comparison shops
within designated centres within LB Southwark, compared with the national
average of 8.4%.
3.36 Within town centres, many high street multiple comparison retailers have
changed their format. High street national multiples have increasingly sought
larger modern shop units (over 200 sq.m) with an increasing polarisation of
activity into the larger national, regional and sub-regional centres, e.g. Central
London, Westfield and Bluewater. Operator demand for space has decreased
during the recession and, of those national multiples looking for space, many
prefer to locate in larger centres.
3.37 The demand for premises within the bulky goods sector, i.e. furniture, carpets,
electrical and DIY goods, was particularly weak during the recession. This has
led to voids on retail warehouse parks and proposals to extend the range of
goods sold to non-bulky goods.
3.38 The continuation of these trends will influence future operator requirements in
Southwark’s centres with smaller vacant units becoming less attractive for new
multiple occupiers, and retailers increasingly looking to relocate into larger
units in higher order centres. However, smaller vacant units could still be
attractive to independent traders and non-retail services.
3.39 Recent and proposed changes to the General Permitted Development Order
(GPDO) may also have an impact on town centres. These measures allow for
greater flexibility for changes of use from retail to non-retail uses e.g. Class A
uses to C3 residential use and Class A1 to A2 use. These measures could

Southwark Retail Study : FINAL REPORT
9190961v2 P17
change the composition of town centres across the country, in particular the
amount of Class A1 space could reduce. The measures may lead to a
reduction in vacant shop premises, particularly in peripheral shop frontages.
This could have an impact on the ability of operators to find space, in areas
where demand is high.
3.40 Operator demand for space has decreased during the recession, and of those
retailers looking for space, many are likely to prefer to locate in larger centres,
particularly multiple retailers. Demand from multiple retailers within Southwark
is likely to be weaker particularly in the smaller, district centres, which will
affect the appropriate strategies for these centres.
High Street Retail Trends
3.41 The number of shop units within town centres has declined consistently since
the early 1970s. The Centre for Retail Research’s “Retail In 2018” (CRR)
figures show a decline from over 300,000 units in 2001 to 282,000 in 2012.
The CRR “Retail In 2018” report predicts nearly 62,000 high street stores
across Great Britain (22% in total) will close between 2012 and 2018.
3.42 Online/multi-channel shopping and increasing retail operating costs are cited
as the main culprits. Similar predictions of the High Street’s decline were made
during previous recessions in the early 1980s and 1990s, which subsequently
proved to be exaggerated. On this basis, it is important to examine these
predictions within the context of longer term structural trends.
3.43 These trends hide underlying structural changes in the retail sector. These
changes are not new and have been affecting the High Street for many years.
In response to these trends, town centres have changed and diversified. The
food and beverage, leisure and non-retail service sectors have been
successful in occupying space no longer suitable for shopping. There have
been cyclical trends in vacancy rates reflecting the macro economic trends, but
in most cases town centres recovered during periods of stronger growth. The
High Street is more resilient than many commentators give it credit.
3.44 There is an underlying trend towards fewer but larger retail stores. Valuation
Office data indicates the amount of retail floorspace in England and Wales has
grown by over 3% during the economic downturn (2008 to 2012), despite a
period of poor expenditure growth and an increase in on-line shopping.
3.45 Shopping behaviour will continue to change and the High Street will need to
continue to respond. All town centres will need to focus on the advantages they
have over other forms of multi-channel shopping, for example using the
internet as an extended shop window, click and collect facilities and providing a
combined retail and leisure experience. There will always be demand for a day
out and customers cannot eat or drink on-line.
3.46 Experian data indicates that retail expenditure reduced by 1.3% during 2009 to
2012, with the food/grocery and bulky comparison goods sectors hardest hit.
These expenditure trends explain why the High Street has performed better
Southwark Retail Study : FINAL REPORT
P18 9190961v2
than out-of-centre retail parks. During this period the proportion of expenditure
attributed to non-store trading (including home shopping) increased from 7.1%
to 11.5%. These figure help to explain why High Streets and retail parks have
struggled.
3.47 Experian’s most recent forecasts suggest comparison goods expenditure per
person will increase on average by 3.3% per annum, in real terms over and
above inflation. Taking into account ONS population projections, comparison
goods expenditure in England will double over the next 20 years.
3.48 Not all projected expenditure growth will be available to support new retail
floorspace. Non-store expenditure (special forms of trading) is expected to
grow at a faster rate than expenditure and in proportional terms will absorb
more growth. Continuing trends towards more modern and higher density
stores, and the replacement of inefficient space will result in growth in turnover
efficiency – Experian suggests a growth rate of 2.5% per annum for
comparison floorspace. This growth in turnover efficiency has been taken
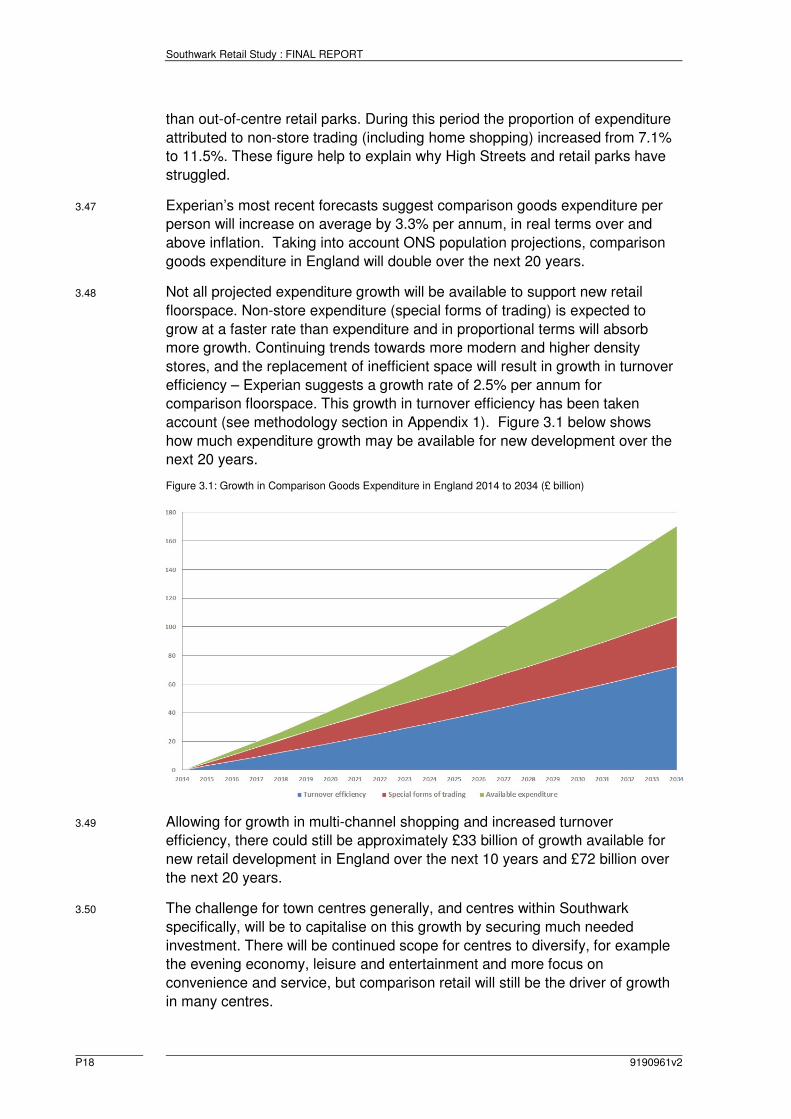
account (see methodology section in Appendix 1). Figure 3.1 below shows
how much expenditure growth may be available for new development over the
next 20 years.
Figure 3.1: Growth in Comparison Goods Expenditure in England 2014 to 2034 (£ billion)
3.49 Allowing for growth in multi-channel shopping and increased turnover
efficiency, there could still be approximately £33 billion of growth available for
new retail development in England over the next 10 years and £72 billion over
the next 20 years.
3.50 The challenge for town centres generally, and centres within Southwark
specifically, will be to capitalise on this growth by securing much needed
investment. There will be continued scope for centres to diversify, for example
the evening economy, leisure and entertainment and more focus on
convenience and service, but comparison retail will still be the driver of growth
in many centres.

Southwark Retail Study : FINAL REPORT
9190961v2 P19
3.51 The delivery of town centre redevelopment opportunities will be the priority.
There will be a requirement to build more retail floorspace within Southwark’s
centres, not only to boost its retail offer and compete effectively with other
centres, but also to secure investment in the centre.

Southwark Retail Study : FINAL REPORT
P20 9190961v2
4.0 Retail Need Assessment
Introduction
4.1 This section objectively assesses the quantitative scope for new retail
floorspace in Southwark in the period from 2014 to 2031. It sets out the
methodology adopted for this analysis and provides a quantitative capacity
analysis in terms of levels of spending for convenience and comparison
shopping. The methodology is summarised in Figure 4.1 below and set out in
more detail in Appendix 1.
Figure 4.1: Methodology for Estimating Future Requirements for Retail Floorspace
Study Area
4.2 The quantitative analysis is based on a defined study area that covers the
catchment areas of the main shopping destinations in Southwark. The study
area is sub-divided into eight zones based on ward boundaries, as shown in
Appendix 1 and Figure 4.2 overleaf.
4.3 There will be retail expenditure leakage from the study area to centres outside,
but conversely expenditure will inflow from surrounding areas.

Southwark Retail Study : FINAL REPORT
9190961v2 P21
Figure 4.2: Southwark Study Area
Population and Expenditure
4.4 The study area population for 2011 to 2031 is set out in Table 1 in Appendix 2.
The 2011 base year population for each zone has been obtained and projected
to 2031 using the GLA 2013 Round of Demographic Projections trend-based
ward (central) projections, produced in March 2014.
4.5 Table 2 in Appendix 2 sets out the forecast growth in spending per head for
convenience goods within each zone in the study area up to 2031. Forecasts
of comparison goods spending per capita are shown in Table 2 in Appendix 3.
4.6 Based on the GLA population projections, as a consequence of growth in
population and per capita spending, convenience goods spending within the
study area is forecast to increase by 21.8% from £1,185 million in 2014 to
£1,443 million in 2031, as shown in Table 3 (Appendix 2).
4.7 Comparison goods spending is forecast to increase by 90.7% between 2014
and 2031, increasing from £1,962 million in 2014 to £3,741 million in 2031, as
shown in Table 3 (Appendix 3).
4.8 It should be noted that comparison goods spending is forecast to increase
more than convenience spending as the amount spent on food and beverage
does not increase proportionately with disposable income, whereas spending
on non-food goods is more closely linked to income.

Southwark Retail Study : FINAL REPORT
P22 9190961v2
4.9 These figures relate to real growth and exclude inflation.
Existing Retail Floorspace 2014
4.10 Existing convenience goods retail sales floorspace within Southwark is around
59,400 sq.m net, as set out in Tables 6A and 6B in Appendix 2. This floorspace
figure excludes comparison sales floorspace within food stores. This
floorspace is relatively evenly spread throughout the borough. These figures
exclude small local shops located outside the designated main centres.
4.11 Comparison goods retail floorspace within Southwark is estimated to be about
93,100 sq.m net, as shown in Table 6 in Appendix 3. Comparison floorspace is
reasonably spread across the borough. Peckham is the main concentration of
floorspace with around 21% of comparison goods sales floorspace in the
borough, compared with 18% in Walworth Road/Elephant & Castle and 15% in
Surrey Quays/Canada Water. Retail units along the Old Kent Road account for
just under 19% of the comparison sales floorspace. Old Kent Road is the
dominant destination for comparison shopping in terms of respondents to the
household survey.
Existing Spending Patterns 2014
4.12 The results of the household shopper questionnaire survey undertaken by
NEMS in August 2014 have been used to estimate existing shopping patterns
within the study area zones. A summary of the methodology and results is
shown in Appendix 8.
Convenience Shopping
4.13 The results of the household shopper survey relating to main and top-up food
and grocery shopping have been used to estimate existing convenience goods
shopping patterns. The estimates of market share or penetration within each
study area zone are shown in Table 4, Appendix 2.
4.14 Table 4 (Appendix 2) indicates the proportion of convenience goods
expenditure retained within Southwark is relatively high. For the borough
(Zones 1-4), retention is above 80% in each of the four zones. For the outer
zones (Zones 5-8), the proportion of convenience goods expenditure within
each zone that is spent within Southwark ranges from 37% in Zone 5 to just
9% in Zone 6.
4.15 Based on NLP’s experience from other recent studies across London, the level
of convenience goods expenditure retention within the borough (Zones 1-4) is
a relatively high figure. Convenience goods expenditure leakage from the
borough is estimated to be around £70 million in 2014. The retention of
convenience goods expenditure within Southwark is particularly high, bearing
in mind the location of large food stores just beyond the borough boundary i.e.
in Lewisham and Lambeth. There appears to be limited scope to increase the
borough’s retention of convenience goods expenditure.

Southwark Retail Study : FINAL REPORT
9190961v2 P23
4.16 The level of convenience goods expenditure attracted to shops/stores in
Southwark in 2014 is estimated to be £633.34 million as shown in Table 5,
Appendix 2. This includes estimates of inflow from beyond the study area,
applying the market shares set out in Table 4.
4.17 The total benchmark turnover of identified existing convenience sales
floorspace within Southwark based on company average sales densities is
£522.72 million (Tables 6A and 6B 10, Appendix 2), compared with the actual
turnover of £633.34 million. The benchmark turnover figure excludes
convenience retail floorspace within small local shops located outside the main
designated centres. Nevertheless these figures still suggest that convenience
retail sales floorspace in the borough is trading healthily.
4.18 Based on NLP’s recent experience, food stores within London tend to trade
above national average sales densities, particularly in relatively affluent areas
such as parts of Southwark. Affluent areas have much higher than average
expenditure per capita, because households are likely to buy higher value/
luxury products rather than just purchasing a higher volume of products. This is
likely to be the case for many households in Southwark Borough and therefore
the sales density of food stores is likely to be higher because of the increased
quantity of higher value goods. Furthermore food stores in London tend to be
smaller with less circulation space and therefore the sales density per unit of
floorspace is likely to be higher.
4.19 In addition, there will be a high number of small convenience stores located
outside of the defined centres that would not be captured by the household
survey results. The estimated benchmark turnover of existing facilities in the
borough does not include these stores, and therefore underestimates the total
benchmark turnover for Southwark.
Comparison Shopping
4.20 The estimated comparison goods expenditure currently attracted by shopping
facilities within Southwark is £638.20 million in 2014, as shown in Table 5,
Appendix 3. The retention of comparison goods expenditure within the borough
is lower than for convenience goods shopping because residents will generally
shop around more for comparison goods and travel further to visit large
shopping destinations e.g. Central London, Bromley and Croydon. Within the
borough, the retention rate also varies more from zone to zone, ranging from
38% in Southwark South (Zone 4) to 61% in Southwark Central (Zone 3).
Overall the comparison expenditure retention rates across the borough are
reasonable, based on NLP’s recent experience across London, and reflect the
influence of higher order centres outside the borough, in particular Central
London. The implementation of planned commitments will provide scope to
increase the retention of comparison goods expenditure within the borough.
4.21 Based on the estimate of comparison goods expenditure attracted to facilities
within the borough, the average sales density for existing comparison sales
floorspace (93,085 sq.m net) is £6,856 per sq.m net. The analysis of existing
comparison shopping patterns in 2014 suggests the following average sales

Southwark Retail Study : FINAL REPORT
P24 9190961v2
density figures for the different parts of the borough as shown in Table 4.1
below.
4.22 Table 4.1 indicates that comparison trading levels in the borough vary across
Southwark, with facilities in the north east and south of the borough trading at
higher densities than other destinations. It should be noted that household
survey results tend to over-estimate the importance of the main centres and
conversely under-estimate the importance of local centres. Overall comparison
retail floorspace within the borough is trading healthily.
Table 4.1: Comparison Average Sales Densities in 2014
Location Average Sales Density
(£ per sq.m net)
Southwark North West £5,572
Southwark North East £8,725
Southwark Central £4,560
Southwark South £7,845
Borough Average £6,856
4.23 The borough’s market share within the core zones (Zones 1-4) is 50.4%. Other
recent NLP studies suggest the following boroughs’ retention: Wandsworth
38%, Lambeth 27%, Richmond 42%, Haringey 38%, Harrow 45%, Merton 45%
and Waltham Forest 40%. These figures suggest the outflow of comparison
expenditure from Southwark (just under 50%) is not unusually high, bearing in
mind the proximity of shopping facilities in surrounding boroughs and access to
the West End.
4.24 The GVA 2009 study suggested that only 29% of expenditure was retained in
the Southwark Borough, which is much lower than the current estimate
(50.4%). However the 2009 study was based on postcode zones rather than
wards. The postcode zones within LB Southwark (1 to 6) extended beyond the
Southwark borough boundary, and therefore the 29% retention figure relates to
a larger area. In addition GVA’s capacity analysis only focused on the main
town and district centres plus Old Kent Road. The 29% retention figure does
not appear to include other facilities outside these main locations. There are
other retail facilities within the borough that should be included e.g. London
Bridge, Bankside, Borough High Street and the Blue. NLP’s retention figure
(50.4%) includes all retail floorspace in the borough.
4.25 GVA’s household survey only asked where households did “most” of their
shopping for various goods. This question tends to overstate the importance of
main centres i.e. central London, Bromley and Croydon and understates
smaller centres. NLP’s 2014 survey asks where households last shopped for
goods and also other secondary destinations, therefore the 2014 survey results
are more detailed and robust than the 2009 study.

Southwark Retail Study : FINAL REPORT
9190961v2 P25
Quantitative Capacity for Convenience Floorspace
4.26 The future levels of available convenience goods expenditure in 2016, 2021,
2026 and 2031 are shown at Tables 10 to 13 in Appendix 2. These projections
are based on adjusted market shares to take into account proposed planning
commitments listed at the foot of Table 8 in Appendix 2, including the Heygate
Estate redevelopment. The expected convenience goods turnover of the listed
commitments is £97.33 million.
4.27 The total level of convenience goods expenditure available for shops in
Southwark between 2014 and 2031 based on the adjusted market shares is
summarised in Table 14 in Appendix 2. Allowing for population and
expenditure per capita growth and increased market shares, convenience
goods expenditure available to shopping facilities in the borough is expected to
increase from £633.34 million in 2014 to £717.47 million in 2021, an additional
£84.13 million. Available expenditure will increase by a further £81.85 million
by 2031, to £799.31 million.
4.28 Table 14 in Appendix 2 also assesses surplus/deficit convenience goods
expenditure within Southwark. As noted above, household surveys tend not to
capture all of the smaller convenience facilities within an area, and the
summary of the benchmark turnover of existing convenience goods floorspace
(Tables 6A and 6B, Appendix 2) consequently does not include all floorspace.
Given the presence of a high number of convenience facilities within the
borough and outside of the defined centres, and to ensure a robust
assessment, we have assumed that the existing facilities in Southwark are
trading at equilibrium in 2014, i.e. the turnover of the existing facilities is the
same as the actual spending attracted to these facilities.
4.29 By 2016 there is a projected expenditure deficit of -£57.22 million, due to the
implementation of the commitments with a turnover of £97.33 million. This
deficit is projected to reduce to -£13.19 million in 2021. Longer term growth will
create an expenditure surplus of £28.20 million by 2026 and £68.65 million by
2031.
4.30 The expenditure projections are converted into potential new floorspace
estimates in Table 15 in Appendix 2. Expenditure growth is converted into
floorspace estimates based on an assumed average sales density figure for
the main food supermarket operators (for all store formats). An average sales
density of £13,000 per sq.m net has been adopted. This is the optimum
average achieved by the main food store operators. No increase in sales
density has been assumed for convenience goods, in line with Experian
forecasts.
4.31 The short to medium term capacity figures up to 2021 suggest commitments
will absorb projected growth up to 2021. Longer term surplus expenditure could
support an additional 2,169 sq.m net (3,099 sq.m gross), in Southwark
Borough. In the very long term, surplus expenditure at 2031 could support
5,280 sq.m net of sales floorspace (7,543 sq.m gross) in Southwark as a
whole, as shown in Table 15 in Appendix 2. The 2031 floorspace projection

Southwark Retail Study : FINAL REPORT
P26 9190961v2
(5,280 sq.m net) represents two large superstores or three to five medium
sized high street stores.
4.32 The breakdown of floorspace requirements is shown in Table 4.2 below.
Table 4.2: Convenience Goods Floorspace Projections (over and above commitments)
Area By 2021
sq.m
By 2026
sq.m
By 2031
sq.m
Southwark North West -1,640
(-2,343)
-719
(-1,027)
9
(13)
Southwark North East 61
(88)
1,292
(1,846)
2,542
(3,631)
Southwark Central 306
(438)
882
(1,260)
1,452
(2,074)
Southwark South 257
(368)
714
(1,021)
1,278
(1,826)
Total -1,015
(- 1,450)
2,169
(3,099)
5,280
(7,543)
Source: Table 15 in Appendix 2
4.33 The 2009 Southwark Retail Study suggested 14,857 sq.m net would be
required within the borough as a whole between 2008 and 2023, over and
above commitments (at 2008). This equated to around 990 sq.m net per
annum. The update projection is only 310 sq.m net per annum. The 2009
floorspace projections were higher primarily because:
1 the amount of base year convenience goods sales floorspace is now
higher i.e. 59,400 sq.m net compared with only 47,588 sq.m net in 2008
(due to the implementation of commitments between 2008 and 2014);
and
2 convenience goods commitments taken into account in 2008 totalled
3,209 sq.m net, whilst current 2014 commitments total 7,487 sq.m net.
Quantitative Capacity for Comparison Floorspace
4.34 The household survey suggests that the borough’s retention of comparison
goods expenditure within the core zones (50.4%) is lower than for convenience
goods. The lower level of comparison expenditure retention is due to the
strength of competing comparison goods facilities in neighbouring authorities
and Central London. The projections assume any potential increase (which is
estimated to be small in proportional terms) in expenditure outflow drawn to
retail commitments outside the borough e.g. at Battersea Power Station,
Canary Wharf, Croydon, Lewisham, the West End and the City, will be counter-

Southwark Retail Study : FINAL REPORT
9190961v2 P27
balanced by the implementation of significant commitments within Southwark
Borough. From a sustainability perspective, the long term objective should be
for LB Southwark to maintain and improve expenditure retention.
4.35 Floorspace capacity projections are based on adjusted market shares to take
into account proposed planning commitments listed at the foot of Table 8 in
Appendix 3. The expected comparison goods turnover of the listed
commitments is £127.83 million in 2016.
4.36 Available comparison goods expenditure has been projected forward to 2016,
2021, 2026 and 2031 in Tables 10 to 13 in Appendix 3, based on the adjusted
market shares and summarised in Table 14. Available comparison expenditure
to facilities within Southwark is expected to increase from £638.20 million in
2014 to £1,349.79 million in 2031.
4.37 For the purposes of this assessment, the existing comparison goods
floorspace is estimated to be trading at equilibrium in 2014 (i.e. satisfactory
levels), as shown in Table 14 (Appendix 3). Table 14 assumes that the
turnover of comparison floorspace will increase in real terms in the future. A
growth rate of 2.5% per annum is adopted, as recommended by Experian. This
growth will help to maintain the health and viability of town centres. Trends
indicate that comparison retailers historically will achieve some growth in
trading efficiency. This is a function of spending growing at faster rates than
new floorspace provision and retailers’ ability to absorb real increases in their
costs by increasing their turnover to floorspace ratio.
4.38 Within Southwark as a whole, commitments are expected to create an
expenditure deficit of -£34.84 million by 2016. This will convert to a surplus of
£10.13 million by 2021. This surplus increases to £87.98 million in 2026. By
2031, future expenditure growth generates an expenditure surplus of £193.56
million.
4.39 Surplus comparison expenditure has been converted into net comparison sales
floorspace projections at Table 15 in Appendix 3, adopting average sales
densities in 2014 of £5,000 per sq.m, which is projected to grow by 2.5% in the
future due to improved turnover efficiency. The surplus expenditure at 2031
could support 25,442 sq.m net of sales floorspace (33,922 sq.m gross).
4.40 The comparison goods floorspace projections are broken down in Figure 4.3
below.
4.41 The 2009 Southwark Retail Study suggested 24,086 sq.m net would be
required within the borough as a whole between 2008 and 2023, over and
above commitments (at 2008). This equated to 1,600 sq.m net per annum. The
updated projection is 1,500 sq.m net per annum. These projections are similar,
although the updated figures take into account more committed comparison
goods floorspace i.e. 24,334 sq.m net (Table 8 in Appendix 3) compared with
16,286 sq.m net assumed in 2009.

Southwark Retail Study : FINAL REPORT
P28 9190961v2
Table 4.3: Comparison Goods Floorspace Projections (over and above commitments)
Area By 2021
sq.m (gross)
By 2026
sq.m (gross)
By 2031
sq.m (gross)
Southwark North West 743
(990)
3,302
(4,402)
5,841
(7,788)
Southwark North East -385
(-513)
5,620
(7,494)
12,209
(16,279)
Southwark Central 687
(917)
2,520
(3,360)
4,500
(6,000)
Southwark South 659
(878)
1,642
(2,189)
2,892
(3,856)
Total 1,704
(2,272)
13,084
(17,445)
25,442
(33,922)
Source: Table 15 in Appendix 3

Southwark Retail Study : FINAL REPORT
9190961v2 P29
5.0 Qualitative Need for Retail Floorspace
Introduction
5.1 Section 4 quantifies the theoretical capacity to support new retail floorspace
within Southwark, based on the population projections and growth in
expenditure. The qualitative need for retail facilities also needs to be
considered. A qualitative audit of the main town and local centres within the
borough is set out in Appendix 7.
5.2 Qualitative need can be assessed through consideration of the following
factors:
• deficiencies or ‘gaps’ in existing provision;
• consumer choice and competition;
• overtrading, congestion and overcrowding of existing stores;
• location specific needs such as underserved markets; and
• the quality of existing provision.
Diversity of Town Centre Uses
5.3 Figure 5.1 below shows the composition of the major centres within Southwark
in terms of the mix and proportion of different uses, i.e. the proportion of shop
units within each use class. This is compared to the Goad average mix for all
centres across the country.
Figure 5.1 Town and Local Centres Mix of Uses by Unit (%)

Southwark Retail Study : FINAL REPORT
P30 9190961v2
5.4 Peckham, Elephant & Castle, Walworth Road and Canada Water all have a
similar proportion of comparison goods shops when compared to the national
average, while London Bridge and Borough & Bankside both have less than
half of the national average. Lordship Lane and Herne Hill both provide a
reasonable proportion of comparison units, while the proportion in Camberwell
is noticeably lower. The average figure for the local centres is also lower than
the national average.
5.5 Vacancy rates are higher on average (around 13%) for the local centres within
LB Southwark when compared to the national average (12.1%). In the larger
centres, the vacancy rate varies from 4.3% to 9.7%. For the centres where
information is available from the 2009 Study, we note that the number of
vacant units has increased in Peckham (+ 3 units) and Walworth Road (+ 4
units) but decreased in Elephant & Castle (- 5 units) and Lordship Lane (- 4
units).
5.6 In addition, centres within the north of LB Southwark have a good evening
economy, providing a reasonable proportion of restaurants/cafés and pubs/
bars. This is particularly evident in London Bridge and Bankside & Borough.
These uses could be improved in centres in the south of the borough e.g.
Peckham.
5.7 Household surveys undertaken during the study provide information about
customers likes and dislikes about the main centres in the borough. The
results of this survey are analysed in Appendix 8.
Convenience Goods Shopping
5.8 The household survey results indicate that most residents in the study area
undertake both a main shopping trip and top-up shopping trips. Main shopping
trips are generally made once a week or less often, and the household survey
identified that 48% of respondents travel to do their main food shopping by car
(both driver and passenger), compared with 32% for non-food shopping.
Based on NLP’s experience, these figures are low compared to other parts of
London. The availability of a wide range of products and car parking are
important requirements for main/bulk food shopping trips. Large supermarkets
or superstores (over 1,000 sq.m net) are the usual destination for these types
of shopping trip.
5.9 The location and distribution of existing food stores within Southwark is shown
on Plan 2, Appendix 1.
5.10 Southwark is reasonably well served by superstores (over 2,500 sq.m net),
particularly serving the north east of the borough, as summarised below.
Southwark North East:
• Tesco, Redriffe Road, Surrey Quays 5,189 sq.m net;
• Asda, Old Kent Road 3,885 sq.m net;
• Tesco, Dunton Road/Old Kent Road 2,982 sq.m net;

Southwark Retail Study : FINAL REPORT
9190961v2 P31
Southwark Central:
• Morrison’s, Rye Lane, Peckham 2,517 sq.m net;
Southwark South:
• Sainsbury’s, Dog Kennel Hill 4,734 sq.m net.
5.11 The food superstores are supported by a good range of large and small
supermarkets and convenience stores. There are three large supermarkets
(over 1,000 sq.m net) in Southwark and ten smaller supermarkets (between
500 and 1,000 sq.m net).
5.12 These food superstores and supermarkets are supported by smaller stores
including numerous Tesco Express stores, Sainsbury’s Local stores, Co-op
stores and other small convenience stores. The discount food sector is
represented by three Aldi stores and three Lidl stores.
5.13 The audit of main centres in Appendix 7 indicates all centres have a choice of
convenience goods shops, ranging from three units in Dulwich Village to 81
units in Peckham.
5.14 All residents in Southwark have good access to food stores both within and
outside the main centres. There are no obvious areas of deficiency in food
store provision, although there are limited large superstores located to the
south of the borough.
High Street Comparison Goods Shopping
5.15 An assessment of the shopping hierarchy is shown in Section 2 and an audit of
shopping facilities within the main centres is shown in Appendix 7. Peckham is
the main comparison goods shopping destination in terms of number of outlets
and sales floorspace. It has a reasonable range of comparison shops
including national multiples and independent specialists. Surrey Quays
shopping centre has the highest proportion of national multiple retailers.
5.16 Generally, larger centres have a higher proportion of comparison shop units
than smaller centres. Larger centres tend to have a stronger focus on fashion
shopping and therefore have a higher proportion of comparison shops.
Smaller centres tend to have a higher proportion of convenience goods units
and service uses, serving the local/day to day needs of their catchment area.
5.17 The main centres within Southwark offer a good mix and choice of comparison
goods retailers, with a reasonable proportion of clothing and footwear shops
and presence of national multiple retailers. The smaller centres generally have
higher proportions of lower order comparison shops, i.e. selling items bought
on a regular basis, and more independent retailers.
5.18 This suggests that the main centres in LB Southwark are performing at the
level that would normally be expected for centres of their size in terms of the
comparison goods retail offer.

Southwark Retail Study : FINAL REPORT
P32 9190961v2
5.19 Figure 5.2 below provides a breakdown of the range of comparison goods
retailers within the main centres.
Figure 5.2 Breakdown of Comparison Goods Categories
5.20 The audit of centres in Appendix 7 provides a more detailed breakdown of the
uses present in each centre.
Retail Warehouses
5.21 Old Kent Road is also a major comparison goods shopping destination in the
borough, including B&Q, Argos, Toys R Us and a range of predominantly bulky
goods retail units.
5.22 The bulky goods retail warehouse sector has suffered during the recession and
growth has been limited in recent years. Many London boroughs continue to
have a limited number of retail warehouses, due to high land values and the
poor availability of large sites.

Southwark Retail Study : FINAL REPORT
9190961v2 P33
6.0 Food/Beverage and Other Town Centre Uses
Introduction
6.1 Service uses perform an important role in the overall offer of a centre, and
encourage customers to shop locally. The service uses are categorised as
follows:
• Class A1 services cover a range of uses, including hairdressers, dry
cleaners, travel agents, some sandwich shops (those not categorised as
Class A3), funeral parlours and post offices.
• Class A2 services include banks, building societies, financial services,
pawnbrokers, estate agents and employment agencies.
• Class A3/A5 includes restaurants, cafés (A3) and takeaways (A5).
• Class A4 pubs/bars (Class A4).
• Sui Generis unclassified uses such as launderettes, taxi cab hire, betting
shops, pay day loan shops and amusement arcades.
6.2 The potential for Class D2 commercial leisure uses is set out in Section 7.
Food and Beverage (Class A3 to A5)
6.3 Food and beverages is a fast moving and creative sector, with a steady flow of
new concepts emerging. Within this sector there has been a significant
increase in the number of national multiple chains. These national chains have
sought to increase their geographical coverage. These types of food and
beverage operators (Class A3 and A4) i.e. restaurants, bars and pubs have
supported other major leisure uses, in particular cinema developments. Within
town centres the demand has increased, including a significant expansion in
the number of coffee shops, such as Starbucks, Costa Coffee and Coffee
Republic.
6.4 National branded pub/restaurant chains have invested heavily and not
exclusively in larger centres. Themed restaurants have also expanded rapidly.
The key categories for food and beverage offers are:
1 impulse: characterised by their produce range that is typically highly
visual and hand-held so that it can be eaten “on the go”;
2 speed eating fast food: food that can be purchased and consumed
quickly, therefore price is low and ambience is less important. This sector
is dominated by traditional high volume fast food offers such as burgers
and fried chicken;
3 refuel and relax: a drink and snacks and a short break in a pleasant
environment rather than focusing on eating a main meal; and
4 casual dining/leisure dining: incorporating a number of food styles,
types and ethnic origins. The ambience and environment of casual dining

Southwark Retail Study : FINAL REPORT
P34 9190961v2
is as important as the food, drink and service provided. The style is
informal but is normally table service.
6.5 Food and beverage establishments (Class A3, A4 and A5) including
restaurants, bars and pubs have supported other major leisure uses on leisure
and retail parks and are important services within town and local centres.
National information available from Experian Goad indicates that the proportion
of non-retail uses within town centres across the country has increased
significantly. The current UK average for Goad town centres indicates that
14.7% of units are in Class A3/A5 (restaurants, café and takeaway) and 2.9%
of units are Class A4 (public houses/bars). A balance between Class A1 and
Class A3 to A5 uses needs to be maintained. The mix of uses in the main
centres in Southwark is shown in Table 6.1. A full audit of centres is shown in
Appendix 7.
Table 6.1 LB Southwark Centres Use Class Mix
Type of Unit Proportion of Total Number of Units (%)
Peckham Elephant &
Castle/ Walworth Rd.
Canada Water
District Centres
Local
Centres
Class A1 (Retail) 55.2 51.6 41.5 34.9 40.9
Class A1 (Services) 15.6 14.7 15.6 12.7 15.7
Class A2 * 7.3 7.9 11.9 10.9 8.6
Class A3/A5 10.9 15.6 22.2 26.2 18.5
Class A4 (Pubs/Bars) 1.3 3.6 3.7 8.2 4.6
Vacant/ under const. 9.7 6.6 5.1 7.1 11.7
Total 100.0 100.0 100.0 100.0 100.0
Source: Goad Plan data 2012
* Class A2 includes betting shops and pay day loan shops – but reclassified as Sui Generis from April 2015.
6.6 The latest land use surveys and centre audits (see Appendix 7) indicate the
proportions of Class A3/A5/A4 within Peckham are lower than the national
averages despite the lower than average vacancy rate in Peckham. Peckham
has a particularly low proportion of restaurants (Class A3) and public houses/
bars (Class A4).
6.7 The town centre surveys indicate the proportions of Class A3/A5 within
Canada Water (including Lower Road and the leisure park) and the District
Centres are much higher than the national average. The District Centres tend
to have higher proportions of Class A5 takeaways and lower proportions of
restaurants. The north of LB Southwark has a good provision of restaurant
and bars.
Food and Beverage Expenditure
6.8 Experian’s latest 2012 local expenditure figures have been adopted. Food and
beverage expenditure per capita projections are shown in Table 2 in Appendix

Southwark Retail Study : FINAL REPORT
9190961v2 P35
4. These figures indicate that the average expenditure in the study area for
food and beverage consumed away from the home plus takeaways eaten at
home is £1,280 per capita in 2014. The total food and beverage expenditure in
the study area is £867.69 million.
6.9 Food and beverage expenditure per capita is expected to increase in real
terms (excluding inflation) by 26% between 2014 and 2031. Taking into
account population growth, total food and beverage expenditure within the
study area is expected to increase from £867.69 million in 2014 to £1,251.67
million in 2031, an increase of about 44% (Table 3 in Appendix 4).
Food and Beverage Expenditure Patterns
6.10 Existing food and beverage expenditure patterns have been modelled based
on the household survey results within the study area zones. Base year (2014)
penetration rates are shown in Table 4 in Appendix 4 and expenditure patterns
are shown in Table 4. The estimated expenditure currently attracted to facilities
within LB Southwark is £322.88 million in 2014. The retention rate is
reasonably high across the borough (Zones 1-4), ranging from 52.4% to
59.8%. Southwark Borough attracts much lower proportions from the outer
zones. The influence of Central London is apparent in all zones. The
implementation of planned commitments will provide some scope to increase
the retention of food and beverage expenditure within the borough.
6.11 Based on the estimate of food and beverage expenditure attracted to facilities
within the borough, the average annual turnover for the borough’s 454
restaurants, café, bars and takeaways is over £700,000 per outlet, with an
average turnover density of about £5,200 per sq.m gross.
Future Food and Beverage Capacity
6.12 Projected food and beverage expenditure patterns in 2016 based on constant
market shares are shown in Table 7, Appendix 4. However, floorspace
capacity projections are based on adjusted market shares, which take into
account proposed planning commitments listed at the foot of Table 8 in
Appendix 4. The expected comparison goods turnover of the listed
commitments is £58.09 million in 2016. The trade draw of these proposed
commitments is shown in Table 9.
6.13 Available food and beverage expenditure has been projected forward to 2031
based on adjusted market shares in Tables 10 to 13. Existing facilities are
expected to increase their turnover by 1% per annum. Future available
expenditure is compared with the projected turnover of existing facilities in
Table 14 in Appendix 4.
6.14 Surplus expenditure has been converted into floorspace projections in Table
15 in Appendix 4, using an average sales density of £5,000 per sq.m, inflated
by 1% per annum. The floorspace projections are broken down in Table 6.2
overleaf.
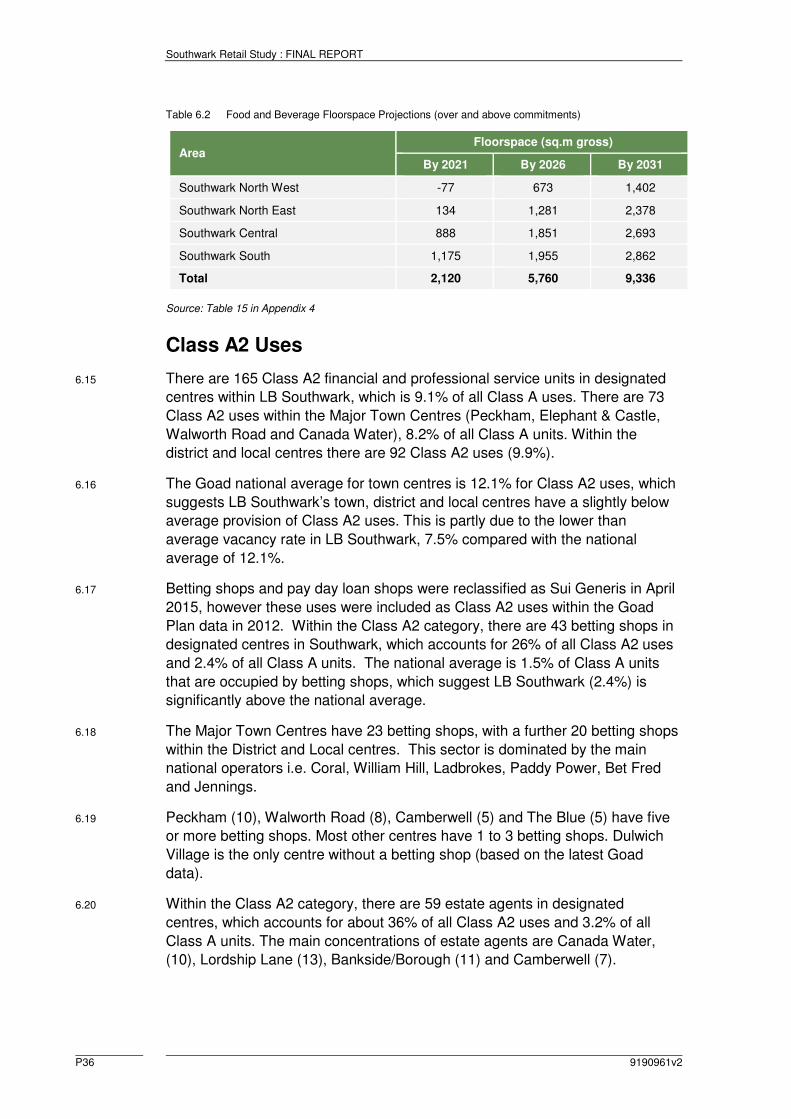
Southwark Retail Study : FINAL REPORT
P36 9190961v2
Table 6.2 Food and Beverage Floorspace Projections (over and above commitments)
Area Floorspace (sq.m gross)
By 2021 By 2026 By 2031
Southwark North West -77 673 1,402
Southwark North East 134 1,281 2,378
Southwark Central 888 1,851 2,693
Southwark South 1,175 1,955 2,862
Total 2,120 5,760 9,336
Source: Table 15 in Appendix 4
Class A2 Uses
6.15 There are 165 Class A2 financial and professional service units in designated
centres within LB Southwark, which is 9.1% of all Class A uses. There are 73
Class A2 uses within the Major Town Centres (Peckham, Elephant & Castle,
Walworth Road and Canada Water), 8.2% of all Class A units. Within the
district and local centres there are 92 Class A2 uses (9.9%).
6.16 The Goad national average for town centres is 12.1% for Class A2 uses, which
suggests LB Southwark’s town, district and local centres have a slightly below
average provision of Class A2 uses. This is partly due to the lower than
average vacancy rate in LB Southwark, 7.5% compared with the national
average of 12.1%.
6.17 Betting shops and pay day loan shops were reclassified as Sui Generis in April
2015, however these uses were included as Class A2 uses within the Goad
Plan data in 2012. Within the Class A2 category, there are 43 betting shops in
designated centres in Southwark, which accounts for 26% of all Class A2 uses
and 2.4% of all Class A units. The national average is 1.5% of Class A units
that are occupied by betting shops, which suggest LB Southwark (2.4%) is
significantly above the national average.
6.18 The Major Town Centres have 23 betting shops, with a further 20 betting shops
within the District and Local centres. This sector is dominated by the main
national operators i.e. Coral, William Hill, Ladbrokes, Paddy Power, Bet Fred
and Jennings.
6.19 Peckham (10), Walworth Road (8), Camberwell (5) and The Blue (5) have five
or more betting shops. Most other centres have 1 to 3 betting shops. Dulwich
Village is the only centre without a betting shop (based on the latest Goad
data).
6.20 Within the Class A2 category, there are 59 estate agents in designated
centres, which accounts for about 36% of all Class A2 uses and 3.2% of all
Class A units. The main concentrations of estate agents are Canada Water,
(10), Lordship Lane (13), Bankside/Borough (11) and Camberwell (7).
Southwark Retail Study : FINAL REPORT
9190961v2 P37
6.21 There are 37 banks/building societies, with the main concentrations in
Peckham (7), Bankside/Borough (6) and Camberwell (5).
6.22 There are 15 pay day loan outlets within the borough. These are concentrated
in three main centres, i.e. Peckham (6), Walworth Road (5) and Camberwell.
Other Class A2 uses include solicitor, accountancy and recruitment offices.
6.23 The ROI Team’s Understanding Perceptions of Southwark Town Centres
February 2014 report explored visitor perceptions and the use of betting shops
and pay-day loan outlets in Borough, Canada Water, Camberwell, Peckham
and Walworth. Most visitors never use these types of facilities i.e. between
79% and 87% of visitors never use betting shops and 94% to 98% never use
pay-day loan outlets. In general most visitors had a poor perception of these
uses.
6.24 The council confirmed two Article 4 Directions in 2013 which withdraw the
permitted development rights for changes of use in Southwark’s Protected
Shopping Frontages, which include:
• A3 (restaurants and cafes), A4 (drinking establishments) and A5 (hot
food takeaways) to A2 (financial and professional services).
• A1 (shops), A2 (financial and professional services), A3 (restaurants and
cafes), A4 (drinking establishments), A5 (hot food takeaways), B1
(business), D1 (non-residential institutions) and D2 (assembly and
leisure) to a flexible use falling within either class A1 (shops), class A2
(financial and professional services), class A3 (restaurants and cafes) or
class B1 (business).
6.25 These Article 4 Directions were introduced in order to protect local amenity and
ensure proper planning of protected shopping frontages.

Southwark Retail Study : FINAL REPORT
P38 9190961v2
7.0 Commercial Leisure Uses
Introduction
7.1 This section assesses the potential for commercial leisure uses in LB
Southwark, including cinema/multiplex, tenpin bowling, bingo, nightclubs and
private health and fitness clubs.
7.2 Residents in LB Southwark have good access to a range of commercial leisure
and entertainment, including facilities in neighbouring boroughs and Central
London. Most of the key sectors are represented.
7.3 Based on NLP’s experience and household surveys from across the country,
commercial leisure facilities usually draw the main part of their trade from
residents up to a 20 minutes travel time. Major leisure facilities such as
multiplex cinemas, ten-pin bowling centres, ice rinks and family entertainment
centres require a large catchment population, and often benefit from locating
together or on large out of centre leisure parks. The main concentration of
commercial leisure facilities within the borough is at the Surrey Quays Leisure
Park.
Cinemas
7.4 There are three cinemas within the borough – Odeon at Surrey Quays Leisure
Park, Peckham Multiplex and Shortwave in Bermondsey Square. These
cinemas provide 16 screens and 3,735 seats. In qualitative terms, cinema
provision is concentrated within the north of the borough.
7.5 In total around 60% of respondents to the household survey results visit the
cinema, and of these 38.3% visited cinemas within LB Southwark. The market
share of trips within the borough (Zone 1 to 4) varies between 33.3% (Zone 4)
to 59.1% (Zone 2). This indicates that a significant proportion of cinema trips
from residents in the borough leak to other destinations. These trips primarily
go to the Odeon at North Greenwich, Cineworld at the O2, Cineworld at West
India Quay and cinemas in Central London.
7.6 The capacity for cinema seats within LB Southwark is calculated in Appendix 6.
The study area population in 2014 (678,704 people) will generate 1.95 million
cinema trips per annum, based on the national average visitation rate (2.8 trips
per annum). The market shares estimated from the household survey
suggests about 731,151 of these cinema trips will be attracted to the cinemas
in LB Southwark, or 812,390 trips allowing for 10% inflow (see Tables 2 to 4 in
Appendix 4).
7.7 Based on the national average population per cinema screen (47,000 trips per
screen), 812,390 million trips generates demand for 17 cinema screens. The
existing cinemas in LB Southwark have 16 screens.
Southwark Retail Study : FINAL REPORT
9190961v2 P39
7.8 Planning permission has been granted for a new cinema within the
redevelopment of the former Castle Industrial Estate, New Kent Road (ref. 08-
AP-2403), which proposes four screens. The new East Dulwich Picturehouse
on Lordship Lane will also provide a new three screen cinema, which will serve
the south of the borough and address the qualitative need. Future market
shares from 2016 have been adjusted to take these new cinemas into account,
and the number of trips generated by the study area population at 2016, 2021,
2026 and 2031 is shown in Tables 6 to 9 in Appendix 4. The number of trips
attracted to LB Southwark is expected to increase from 812,390 in 2014 to
1.03 million in 2031.
7.9 Based on national average visitation rates, the study area population at 2031
could generate demand for 22 cinema screens within LB Southwark.
Theatres
7.10 The household survey indicated that 43% of respondents in the study area visit
theatres. The vast majority of trips to the theatre are to the West End (74%),
Waterloo/South Bank (13%) and other parts of London. The main theatres in
LB Southwark – Shakespeare’s Globe Theatre, The Rose Playhouse, Unicorn
Theatre, Union Theatre, Coronet Theatre, Southwark Playhouse, Theatre
Peckham, Menier Chocolate Factory – attract a very small proportion of theatre
trips within the study area.
7.11 Accessibility to theatres within Central London could have an impact on the
likely demand for theatre facilities in the borough. If proposals emerge for new
theatres then these proposals could help to claw back theatre trips currently
attracted to Central London, or alternatively attract tourist visitors to Southwark.
Proposals would help reinforce the cultural offer, especially in the central
activities zone and can help enliven town centres. Bankside and Borough fall
within the London Plan strategic cultural area and facilities in this area draw
people from outside LB Southwark.
Health and Fitness Clubs
7.12 The UK health club market has expanded rapidly as public awareness about
personal fitness has increased. The value of the UK fitness market is now
around £4 billion. Private health clubs in the UK range from small independent
clubs to large operators such as Cannons, David Lloyd, Esporta, Fitness First,
Virgin Active, Bannatyne and LA Fitness. Public sector sports centres are also
important, and the market has increased significantly over the last 10 years.
Over 12% of the adult population within the UK are members of health clubs.
7.13 The household survey indicates that 34.3% of respondents or their families
visit a health/fitness club. Of these, 36.5% visit health and fitness facilities
within LB Southwark. For the population within LB Southwark (Zones 1-4),
around 67% use facilities within LB Southwark.
7.14 There are a number of gyms and health clubs within LB Southwark, as
highlighted by the household survey results. The main facilities are listed in
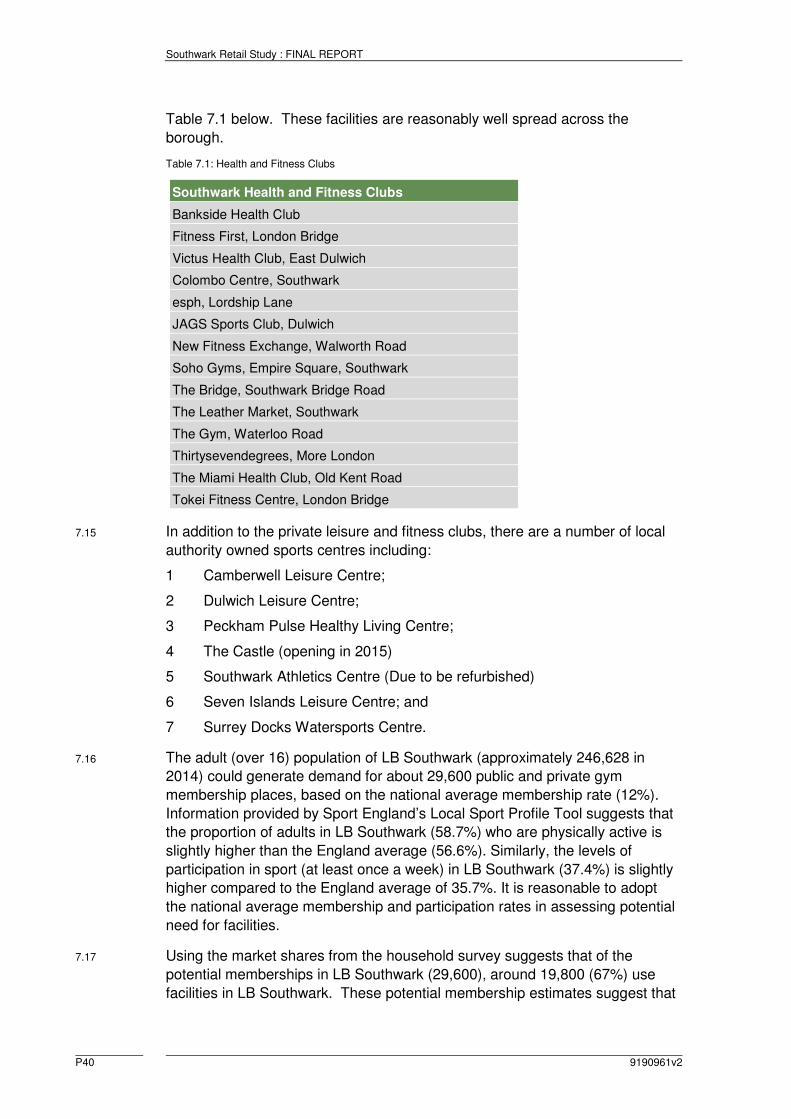
Southwark Retail Study : FINAL REPORT
P40 9190961v2
Table 7.1 below. These facilities are reasonably well spread across the
borough.
Table 7.1: Health and Fitness Clubs
Southwark Health and Fitness Clubs
Bankside Health Club
Fitness First, London Bridge
Victus Health Club, East Dulwich
Colombo Centre, Southwark
esph, Lordship Lane
JAGS Sports Club, Dulwich
New Fitness Exchange, Walworth Road
Soho Gyms, Empire Square, Southwark
The Bridge, Southwark Bridge Road
The Leather Market, Southwark
The Gym, Waterloo Road
Thirtysevendegrees, More London
The Miami Health Club, Old Kent Road
Tokei Fitness Centre, London Bridge
7.15 In addition to the private leisure and fitness clubs, there are a number of local
authority owned sports centres including:
1 Camberwell Leisure Centre;
2 Dulwich Leisure Centre;
3 Peckham Pulse Healthy Living Centre;
4 The Castle (opening in 2015)
5 Southwark Athletics Centre (Due to be refurbished)
6 Seven Islands Leisure Centre; and
7 Surrey Docks Watersports Centre.
7.16 The adult (over 16) population of LB Southwark (approximately 246,628 in
2014) could generate demand for about 29,600 public and private gym
membership places, based on the national average membership rate (12%).
Information provided by Sport England’s Local Sport Profile Tool suggests that
the proportion of adults in LB Southwark (58.7%) who are physically active is
slightly higher than the England average (56.6%). Similarly, the levels of
participation in sport (at least once a week) in LB Southwark (37.4%) is slightly
higher compared to the England average of 35.7%. It is reasonable to adopt
the national average membership and participation rates in assessing potential
need for facilities.
7.17 Using the market shares from the household survey suggests that of the
potential memberships in LB Southwark (29,600), around 19,800 (67%) use
facilities in LB Southwark. These potential membership estimates suggest that

Southwark Retail Study : FINAL REPORT
9190961v2 P41
the 14 facilities in LB Southwark (Table 7.1 above) have an average
membership of around 1,400 per club. These figures indicate that there is a
reasonable supply of gyms and health clubs within LB Southwark.
7.18 The adult population within the LB Southwark is expected to increase by about
32,300 between 2014 and 2031, which would generate around 3,900 new
health club members, of which 2,600 (67%) should be attracted to LB
Southwark, based on existing market shares. These figures suggest that there
could be demand for 4-5 new health and fitness clubs in the borough to meet
the existing need and future growth in demand up to 2031.
Tenpin Bowling
7.19 There are two tenpin bowling facilities in LB Southwark – Hollywood Bowl,
Surrey Quays (28 lanes) and Palace Superbowl, Elephant and Castle (26
lanes). The household survey results suggest that 16.9% of households in the
study area visit tenpin bowling facilities. 65% of these respondents visit the
facilities in LB Southwark. Surrey Quays was the most popular tenpin bowling
destination in the study area as a whole.
7.20 The population of LB Southwark (Zones 1-4) is 302,685 in 2014. This
population as a whole could theoretically support 25 lanes, based on one lane
per 12,000 people (national average). Population growth within LB Southwark
(39,644 between 2014 and 2032), could support a further 3-4 lanes by 2031.
Given the provision of existing bowling facilities in Surrey Quays and Elephant
and Castle, these figures suggest that the existing tenpin bowling facilities are
more than adequate to meets the needs of LB Southwark for the foreseeable
future.
Nightclubs/Live Music Venues
7.21 The value of the nightclub market is around £2 billion in 2014 with around
7,000 businesses (source: IBIS World), about one per 8,500 people.
Legislation that has extended licensing hours for other drinking establishments
and banned smoking indoors in public buildings has removed the industry's
main competitive advantage over pubs or bars. Nightclubs have also come
under pressure from the economic downturn.
7.22 The household survey results indicated that 15.3% of households in the study
area visit nightclubs, and just 4% of these households visited a nightclub in LB
Southwark. London West End was the most popular response (43.1%). The
provision of nightclubs in Central London will limit the potential for major new
nightclubs in the borough but small or medium nightclub facilities may be
viable.
Bingo
7.23 Mecca and Gala are the main bingo operators, controlling over half of the UK
market. Marketing of the bingo sector has been more proactive in recent years

Southwark Retail Study : FINAL REPORT
P42 9190961v2
and Gala and Mecca have invested in premises, moving out of dated premises
(i.e. converted cinemas) into purpose built units. Bingo clubs have become
increasingly sophisticated, and have actively sought to attract all age groups.
The bingo sector usually prefers central locations that are accessible by public
transport and by foot. Major bingo operators require buildings of between 2,000
- 3,000 sq.m, capable of seating up to 2,000 people, with a catchment
population of 50,000 to 70,000 within freestanding towns (source: BISL).
7.24 Within LB Southwark there is a Gala Bingo at Surrey Quays Leisure Park and
Palace Bingo in Elephant and Castle. The household survey results indicated
that only 2.3% of households in the study area visit bingo facilities, and of
these, 29.6% visited Palace Bingo and 27.5% visited the Gala Bingo at Surrey
Quay in LB Southwark. The national average bingo participation rate is around
5%, more than twice the participation levels identified in the study area.
7.25 The adult (over 18) population of LB Southwark (approximately 240,700 in
2014) could generate about 327,400 admissions based on the national
participation rate (1.36 trips per adult). Based on national average figures
(133,000 admissions per club), the population of LB Southwark could support
two or three bingo facilities. This suggests the existing provision meets the
current and likely future demand.
Conclusions
7.26 The commercial leisure assessment in this section suggests:
1 current and proposed cinema provision within LB Southwark should
accommodate future growth;
2 there could be scope for four or five additional health and fitness clubs in
LB Southwark over the study period to meet existing and future demand;
3 there is no theoretical need for additional tenpin bowling or bingo facilities
or nightclubs in LB Southwark over the study period; and.
4 the demand for additional theatre facilities and nightclubs in LB
Southwark may be constrained by provision in central London. However
if proposals emerge for new facilities then these proposals could help
reinforce the cultural offer, especially in the central activities zone and
can help enliven town centres.

Southwark Retail Study : FINAL REPORT
9190961v2 P43
8.0 Accommodating Growth
Introduction
8.1 The National Planning Policy Framework (NPPF) indicates (paragraph 23) that
local plans should allocate a range of suitable sites to meet the scale and type
of retail, leisure and other development needed in town centres. The need for
development should be met in full and should not be compromised by limited
site supply. In order to accommodate growth, local planning authorities should
assess the need to expand town centres to ensure a sufficient supply of
suitable sites. The NPPF (paragraphs 23 and 24) indicates local planning
authorities should apply a sequential approach to development.
8.2 The National Planning Policy Guidance (NPPG) indicates that development
plans should develop (and keep under review) town centre strategies that plan
for a 3-5 year period, whilst also giving a development plan lifetime view. Plans
should identify the scale of need for main town centre uses and assess
whether the need can be met on town centre sites or through expanding
centres, with the sequential test to be followed.
8.3 The NPPG acknowledges that not all successful town centre regeneration
projects are retail-led, or will involve significant new developments. Public
realm, transport and accessibility improvements can play important roles. Town
centre car parking strategies, in a move away from resisting parking in town
centres, are to encourage improvements to both the quality and quantity of car
parking provision, where required to enhance the performance of town
centres.
Floorspace Projections
8.4 There are a number of issues that may influence the scope for new floorspace
and the appropriate location for this development, as follows:
• major retail developments in competing centres;
• the re-occupation of vacant retail floorspace;
• the availability of land to accommodate new development;
• the reliability of long term expenditure projections;
• the effect of internet/home shopping on the demand for retail property;
• the level of operator demand for floorspace in LB Southwark;
• the likelihood that LB Southwark’s existing market share of expenditure
will change in the future;
• the potential impact new development may have on existing centres.
8.5 The NPPG suggests town centre strategies should plan for a 3-5 year period,
but the longer term plan period should be considered. Projections up to 2021
are realistic and are based on up to date forecasts, which take into account the

Southwark Retail Study : FINAL REPORT
P44 9190961v2
effects of the recession. The longer term floorspace projections (up to 2031)
provide a useful guide for development plan allocations and development
management decisions. Projected surplus expenditure for comparison goods is
primarily attributable to projected growth in spending per capita. If the growth in
expenditure is lower than that forecast, then the scope for additional space will
reduce. Longer term projections should be monitored and kept under-review.
8.6 The expenditure projections in this study take into account home shopping
made through non-retail businesses, because special forms of trading have
been excluded. The study assumes that special forms of trading will increase
in the future, including the growth of internet shopping. The impact of internet
growth on the demand for retail floorspace is unclear. Some retailers’ home
delivery and internet services utilise existing stores rather than warehouses, for
example Tesco Direct. Growth in internet sales will not always reduce the
demand for shop floorspace. In addition, some of the growth in internet sales
may divert trade away from mail order companies rather than retail operators.
Overall the long term impact of home shopping on expenditure projections is
uncertain.
8.7 The quantitative and qualitative assessment of the potential for new retail
floorspace within the previous sections suggests there is scope for new retail
development within LB Southwark during the study period (to 2031). This
section examines the opportunities for accommodating this projected growth
and assesses potential to accommodate this floorspace.
8.8 The projections up to 2031 suggest there is scope for about 7,500 sq.m gross
of convenience goods floorspace, 33,900 sq.m gross of comparison goods
floorspace and 9,300 sq.m gross of Class A3/A4/A5 floorspace, over and
above commitments. Table 8.1 below summarises the floorspace projections
by zone up to 2031. Floorspace has been apportioned based on the adjusted
market shares derived from the household survey results.
Table 8.1: Summary of Floorspace Projections 2031 (sq.m gross) – Over and Above Commitments
Centre/Area Convenience Comparison Class A3/A4/A5 Total
Southwark North West (zone 1) 13 7,788 1,402 9,203
Southwark North East (zone 2) 3,631 16,279 2,378 22,288
Southwark Central (zone 3) 2,074 6,000 2,693 10,767
Southwark South (zone 4) 1,826 3,856 2,862 8,544
Total 7,544 33,923 9,335 50,802
Source: Appendix 2, 3 and 4
8.9 The sequential approach suggests that designated town centres should be the
first choice for retail development. In accommodating future growth, the
following issues should be taken into consideration:
• What is the locational area of need the development seeks to serve and
what existing centre could potentially fulfil the identified area of need?

Southwark Retail Study : FINAL REPORT
9190961v2 P45
• Is the nature and scale of development likely to serve a wide catchment
area?
• Is a site available in one of the designated centres, including vacant
premises and will this site meet the identified need?
• If the development has a more localised catchment area, is a site
available in a local centre and will this site meet the identified need?
8.10 All development should be appropriate in terms of scale and nature to the
centre in which it is located.
Vacant Floorspace
8.11 The existing stock of premises will have a role to play in accommodating
projected growth, during the economic recovery. The retail capacity analysis in
this report assumes that existing retail floorspace can, on average, increase its
turnover to sales floorspace densities. For comparison goods, a growth rate of
2.5% per annum is assumed and a 1% growth rate is assumed for food and
beverage floorspace. In addition to the growth in sales densities, vacant shops
could help to accommodate future growth.
8.12 There are 152 vacant shop units within the borough, which equates to an
overall vacancy rate of 8.4%, which is lower than the Goad national average
(12.1%). These vacant units total 19,700 sq.m gross. Most of the vacant shop
units are small (under 100 sq.m gross).
8.13 As a target, it may be reasonable to assume the current level of vacant retail
floorspace in the borough could fall by 30%, i.e. from 8.4% to around 6%.
Based on NLP’s experience even healthy centres have some vacant units,
which reflects the nature churn of premises. A target of 6% seems reasonable
for LB Southwark. If this reduction in vacancy rate is achieved then the
number of reoccupied units would be 43 units in the borough as a whole. The
reoccupation of 43 vacant units could accommodate about 4,000 sq.m gross of
Class A1 to A5 floorspace, which represents less than 8% of the retail
floorspace projection to 2031 (50,802 sq.m gross). It is unlikely that vacant
shop units can accommodate much more than 8% of the projected additional
floorspace capacity up to 2031.
Growth in North West Southwark (Zone 1)
8.14 The Elephant and Castle Supplementary Planning Document (SPD) and
Opportunity Area Planning Framework (OAPF) indicate the area has potential
for redevelopment. The vision for the area seeks to facilitate regeneration of
the Elephant and Castle by providing excellent shopping, leisure facilities and
cultural activities with up to 45,000 sq.m of new shopping and leisure
floorspace. The Heygate commitment is part of these regeneration proposals.
Redevelopment of the existing Elephant and Castle Shopping Centre could
further enhance shopping and leisure provision within the area.
Southwark Retail Study : FINAL REPORT
P46 9190961v2
8.15 There are a number of other planning commitments within the North West
zone. All commitments are expected to provide around 9,600 sq.m gross of
convenience goods floorspace, 15,800 sq.m gross of comparison goods
floorspace and 8,000 sq.m gross of food and beverage floorspace, around
33,400 sq.m gross in total.
8.16 Allowing for adjusted market shares, the commitments are expected to absorb
convenience goods expenditure growth in Zone 1 up to 2031. The
commitments will absorb comparison goods expenditure growth in Zone 1 up
to around 2019. Food and beverage growth will be absorbed up to 2021.
8.17 The floorspace projections suggest around 4,000 sq.m gross of Class A1 to A5
could be required in the North West area (Zone 1) of the borough by 2026,
over and above commitments, increasing to 9,200 sq.m gross by 2031.
8.18 Vacant shop premises within the North West Zone could make a contribution
towards meeting the short term floorspace projection. There are 39 vacant
units in this zone, a vacancy rate of 6.8%. These vacant units could
accommodate about 400 sq.m gross, assuming a reduction to the 6% target
vacancy rate.
8.19 Commitments and vacant units can accommodate short to medium term
requirements (up to 2021) in Zone 1, but there is emerging potential up to 2026
and 2031.
8.20 The remaining projection (3,600 sq.m gross by 2026 and 8,500 sq.m gross by
2031) could be accommodated within a comprehensive redevelopment of the
Elephant & Castle Shopping Centre.
8.21 The Elephant & Castle Shopping Centre has recently been bought by
Delancey and APG who have indicated an aspiration to demolish the existing
centre and develop a mix of uses, which includes more shopping space within
a street environment. The redevelopment of the centre could accommodate
the remaining retail floorspace capacity and increase expenditure retention
within the local area.
Growth in North East Southwark (Zone 2)
8.22 There are three planning commitments within the North East zone, at Canada
Water. These commitments, if implemented, would provide around 1,100 sq.m
gross of convenience goods floorspace, 16,100 sq.m gross of comparison
goods floorspace and 3,300 sq.m gross of food and beverage floorspace,
around 20,500 sq.m gross in total.
8.23 Allowing for adjusted market shares, commitments are expected to absorb
convenience goods expenditure growth in Zone 2 up to around 2019. The
commitments will absorb comparison goods expenditure growth in Zone 2 up
to around 2021. Food and beverage growth will be absorbed up to around
2020.
Southwark Retail Study : FINAL REPORT
9190961v2 P47
8.24 The floorspace projections suggest around 10,600 sq.m gross of Class A1 to
A5 could be required in the North East area (Zone 2) of the borough by 2026,
over and above commitments, increasing to 22,300 sq.m gross by 2031.
8.25 Vacant shop premises within the North East Zone could make a contribution
towards meeting the short term floorspace projection. There are 28 vacant
units in this zone, a vacancy rate of 9.1%. These vacant units could
accommodate about 900 sq.m gross, assuming a reduction to the 6% target
vacancy rate.
8.26 Commitments and vacant units can accommodate short to medium term (up to
2021) in Zone 2, but there is emerging potential up to 2026 and 2031.
8.27 The remaining projection (9,700 sq.m gross by 2026 and 21,400 sq.m gross by
2031) could be accommodated within development at the Surrey Quays
Shopping Centre at Canada Water. The potential impact of additional retail
development at Canada Water is assessed later in this Section.
8.28 The Draft Revised Canada Water Area Action Plan (November 2013) seeks to
create a new destination around the Canada Water basin which combines
shopping, civic, education, leisure, business and residential uses to create a
new heart for Rotherhithe. The Draft AAP indicates that Canada Water’s role
as a shopping destination will be strengthened by expanding the amount of
retail space (by around 35,000 sq.m gross) and by providing a much more
diverse range of shops than at present, including a new department store and
independent shops and complementary uses including higher education
facilities, offices, cafes, restaurants and leisure facilities.
8.29 Some of the sites identified within the Draft AAP are now planning
commitments (i.e. the Decathlon site and Surrey Quays Leisure Park) which
have already been taken into within the capacity projections. The extant
planning permission to extend the Surrey Quays Shopping Centre has also
been taken into account.
Growth in Central Southwark (Zone 3)
8.30 The floorspace projections suggest around 6,500 sq.m gross of Class A1 to A5
could be required in the Central area (Zone 3) of the borough by 2026
increasing to 10,800 sq.m gross by 2031.
8.31 Vacant shops premises within the Central Zone could make a contribution
towards meeting the short term floorspace projection. There are 67 vacant
units in this zone, a vacant rate of 10.5%. These vacant units could
accommodate about 2,900 sq.m gross assuming a reduction to the 6% target
vacancy rate.
8.32 The Peckham and Nunhead Action Area Plan – Adopted November 2014
(Policy 1) indicates that new retail (Classes A1/A2/A3/A4) development will be
encouraged in in Peckham town centre to help maintain and enhance its status
as a major town centre in the retail hierarchy. Most new retail provision is
expected to be accommodated on the following sites:

Southwark Retail Study : FINAL REPORT
P48 9190961v2
1 Aylesham Shopping Centre (site PNAAP 1);
2 Copeland Industrial Park and 1-27 Bournemouth Road (site PNAAP 4);
3 Land between the railway arches (site PNAAP 3); and
4 Peckham Rye Station (site PNAAP 6).
8.33 The AAP identifies 16 opportunity sites that could accommodate around 8,000
sq.m gross of retail floorspace in the Peckham core action area, including
around 1,350 sq.m gross at the Aylesham Shopping Centre (over and above
existing floorspace) and 1,800 sq.m gross at the Copeland Industrial Park/
Bournemouth Road.
8.34 The Aylesbury Area Action Plan (January 2010) proposes a small element of
local shopping provision to serve new residential development. Four locations
with Class A uses are identified i.e. Amersham site, Thurlow Street, East Street
and Westmoreland Road. The AAP envisages that 1,750 sq.m gross could be
provided in these locations, to meet day-to-day convenience retail needs or
food and drink uses.
8.35 The two AAPs within the Central Southwark Zone 3 identify opportunities that
could accommodate up to 9,750 sq.m gross. These opportunities plus the
occupation of vacant shop units (say 2,900 sq.m gross) are more than
sufficient to accommodate the floorspace projection up to 2031 (10,800 sq.m
gross). These opportunities could help to accommodate growth transferred
from South Southwark Zone 4.
8.36 The remaining projection (1,850 sq.m gross by 2026 and 6,150 sq.m gross by
2031) could be accommodated within a redevelopment of the Aylesham
Shopping Centre in Peckham town centre.
Growth in South Southwark (Zone 4)
8.37 There are no commitments within Zone 4 to absorb expenditure growth. The
floorspace projections suggest around 5,200 sq.m gross of Class A1 to A5
could be required in the South area (Zone 4) of the borough by 2026
increasing to 8,500 sq.m gross by 2031.
8.38 Due to the low vacancy rate, vacant shops premises within the South Central
Zone are unlikely to make a significant contribution to accommodating growth.
8.39 If the growth in South Southwark cannot be accommodated within centres
within this zone then some floorspace capacity could be transferred to other
parts of the borough, i.e. Peckham in Central Southwark.
Development at Canada Water and Elephant & Castle
8.40 The retail floorspace capacity projections in this section take into account, and
are therefore over and above, planning commitments. The floorspace
projections take into account the planned redevelopment/expansion at Canada
Water i.e. the Decathlon redevelopment, proposals at Surrey Quays Leisure

Southwark Retail Study : FINAL REPORT
9190961v2 P49
Park and the permitted extension to the Surrey Quays Shopping Centre and
development at the Heygate Estate, as listed in Table 8 in Appendix 3.
8.41 There are emerging proposals for a larger development to Surrey Quays
Shopping Centre and proposals are expected to redevelop the Elephant &
Castle. Permitted development at Surrey Quays Shopping Centre includes
10,691 sq.m gross of Class A1 to A5 floorspace. The baseline comparison
goods capacity projections in this section assume 70% of this floorspace
(7,484 sq.m gross) will be occupied by comparison goods retail uses.
8.42 The baseline food and beverage projections assume 2,138 sq.m gross of
Class A3 to A5, will be provided within the extension to Surrey Quays
Shopping Centre.
8.43 As a sensitivity analysis, up to 25,038 sq.m gross of Class A1 comparison
goods floorspace and up to 3,522 sq.m gross Class A3 to A5 floorspace has
been tested as suggested by the adopted AAP, that is 17,544 sq.m gross over
and above the permitted comparison goods floorspace and 1,384 sq.m gross
over and above permitted food and beverage floorspace at Surrey Quays. The
trade draw and expected turnover of this potential floorspace is shown in Table
2 in Appendix 5.
8.44 In addition, redevelopment of sites in the Elephant & Castle opportunity area,
including the shopping centre, has been assumed, which could provide an
additional 25,000 sq.m gross of retail and leisure floorspace, over and above
existing floorspace and commitments. An uplift of 17,500 sq.m gross of
comparison floorspace has been tested and food and beverage floorspace of
2,500 sq.m gross.
8.45 A comparison goods retail impact analysis is shown in Appendix 5. If
implemented, the proposed additional floorspace at Surrey Quays and
Elephant and Castle would convert the projected baseline surplus of £10.13
million in 2021 to a deficit of -£61.38 million. Longer term growth would
produce a surplus of £14.2 million in 2026, compared with the baseline
projection of £87.98 million.
8.46 The projections suggest there is theoretical capacity in the North West Zone 1
to support an additional 17,500 sq.m gross of comparison goods floorspace at
Elephant and Castle by 2023.
8.47 The projections suggest there is theoretical capacity in the North East Zone 2
to support 25,038 sq.m gross of comparison goods floorspace at Surrey
Quays/Canada Water by 2027/28.
8.48 The food and beverage impact figures are also shown in Appendix 5. If
implemented, the proposed additional floorspace would reduce the projected
baseline surplus of £11.36 million in 2021 to £1.97 million. Longer term growth
will reduce the surplus to £23.12 million in 2026, compared with the baseline
projection of £27.78 million.

Southwark Retail Study : FINAL REPORT
P50 9190961v2
8.49 The projections suggest there is theoretical capacity in the North West Zone 1
to support 2,500 sq.m gross of food and beverage floorspace at Elephant &
Castle by 2022, and there is theoretical capacity in the North East Zone 2 to
support 3,522 sq.m gross of food and beverage floorspace at Surrey
Quays/Canada Water by 2025.
8.50 It may not be possible to deliver new floorspace precisely in line with projected
expenditure/floorspace capacity. It is unlikely a development at Surrey Quays
shopping centre could be completed before 2019 at the earliest. Construction
is unlikely to start until 2016, allowing time to work up detailed designs and
obtain planning permission. Construction and fit out is likely to take three
years. If the development opened in 2019 at the earliest then it would not
achieve full and settled trading levels until 2021. The timetable at Elephant &
Castle is likely to follow a similar or slightly later timetable.
8.51 The cumulative impact of delivering all commitments and the additional
floorspace at Surrey Quays Shopping Centre and Elephant & Castle has been
assessed at 2021 as a worst case. The results of the cumulative comparison
and food/beverage impact assessment is summarised in Table 5 and Table 10
in Appendix 5.
8.52 In terms of comparison goods, the levels of impact (i.e. proportional reduction
in turnover) on the most affected centres in 2021 caused by trade diversion to
new developments, are as follows:
1 Bankside & Borough - 29.4%
2 The Blue - 25.8%
3 Old Kent Road - 18.6%
4 Camberwell - 12.7%
5 Peckham - 10.7%
6 Nunhead - 6.3%
8.53 An element of this cumulative impact relates to the permitted commitments.
The impact estimates for other centres is relatively low (less than 3.5%).
8.54 In terms of food and beverage, the levels of impact on the most affected
centres in 2021 are as follows:
1 Southwark/Bankside/Borough - 22.9%
2 Old Kent Road - 11.4%
3 Peckham - 10.2%
4 The Blue - 9.0%
5 Nunhead - 6.8%
6 London Bridge - 10.0%
7 Camberwell - 5.6%

Southwark Retail Study : FINAL REPORT
9190961v2 P51
8.55 Again, a significant element of this cumulative impact relates to permitted
commitments. The impact estimates for other centres is relatively low (3% or
less).
8.56 The two most vulnerable centres appear to be The Blue and
Bankside/Borough. The Old Kent Road is not a designated centre, and
therefore the impact on facilities within this area is not normally a planning
consideration. Development within the Old Kent Road area would help to offset
these impacts. The potential implications of the predicted trade and impact on
the two designated centres are shown below.
The Blue
8.57 The Blue is one of the worst affected in terms of proportional impact, because
it falls between major development proposals within the north of the borough,
i.e. Elephant &Castle, Heygate Estate and at Canada Water. The Blue has 80
shop units with a vacancy rate of 11.3%, compared with the national average
of 12.1%. Class A3 to A5 uses (16 in total) account for 20% of shops units,
which is higher than the national average (less than 18%).
8.58 The base year (2014) comparison turnover of The Blue is £11.17 million. The
base year (2014) food and beverage turnover of The Blue is £20.04 million.
8.59 NLP’s cumulative impact figures suggest The Blue’s comparison turnover is
projected to decrease by only 1.5% between 2014 and 2021. The projected
residual comparison turnover of The Blue is £11 million in 2021. Expenditure
growth after 2021 will offset cumulative trade diversion. Development is not
expected to have a long term impact on the centre. Comparison shop closures
are not envisaged following the predicted cumulative impact.
8.60 NLP’s cumulative impact figures suggest The Blue’s food and beverage
turnover is still projected to increase by 11.3% between 2014 and 2021. The
projected residual food and beverage turnover of The Blue is £22.30 million in
2021. Expenditure growth between 2014 and 2021 is expected to offset
cumulative trade diversion.
8.61 The levels of predicted comparison and food/beverage trade diversion are not
expected to significantly harm the vitality and viability of The Blue at 2021.
Bankside/Borough
8.62 Bankside/Borough is the worst affected in terms of proportional food and
beverage impact, because it is close to major commitments within the north
west of the borough.
8.63 Bankside/Borough has 147 shop units with a vacancy rate of only 4.8%,
compared with the national average of 12.1%. Class A3 to A5 uses (71 in total)
account for 48% of shops units, which is significantly higher than the national
average (less than 18%). Comparison shops (only 16 in total) occupy only 11%
of all shop units in the centre, which is significantly below the national average
(36%).

Southwark Retail Study : FINAL REPORT
P52 9190961v2
8.64 The base year (2014) food and beverage turnover of Bankside/Borough is
£28.87 million. The base year comparison turnover is £17.09 million. NLP’s
cumulative impact figures suggest Bankside/Borough’s comparison turnover is
projected to decrease by 7.3% between 2014 and 2021. The projected residual
comparison turnover is £15.85 million in 2021. Expenditure growth between
2021 and 2026 is expected to offset cumulative trade diversion. Comparison
shopping represents a relatively small part of the offer at Bankside/Borough.
Bankside/Borough does not function as a traditional town centre a traditional
town centre. The mix of uses serves to complement and reinforce one another
and as a result a significant impact on Borough and Bankside would not be
expected.
8.65 NLP’s cumulative impact figures suggest Bankside/Borough’s food and
beverage turnover is projected to reduce by 6.1% between 2014 and 2021.
The projected residual food and beverage turnover is £27.11 million in 2021.
This level of trade diversion is not expected to result in the closure of food and
beverage outlets. Most of this impact relates to existing planned commitments
within the Bankside/Borough area, rather than additional development at
Elephant & Castle and Canada Water.
8.66 It should also be noted that an element of this trade diversion relates to internal
impact to planned commitments within the Bankside/Borough area. The
impact on the centre’s overall turnover will be lower than the impact figures
suggest. There will be no negative impact on customer choice due to
improvements provided by the implemented commitments. Overall the
implementation of commitments and developments at Elephant & Castle will
not harm the long term the vitality and viability of Bankside/Borough at 2021.
Southwark Retail Study : FINAL REPORT
9190961v2 P53
9.0 Policy Review and Delivery Implications
Introduction
9.1 This section considers appropriate policy approaches and measures to inform
future planning for retail and town centre uses in the borough. It is noted that
the Core Strategy was adopted in 2011 and the development management
policies are established in the saved Southwark Plan (2007). The emerging
New Southwark Plan will be a borough-wide planning policy document that will
guide regeneration and development in Southwark. The comments in this
section are intended only for consideration in the emerging New Southwark
Plan and other development plan documents.
The Network of Centres
9.2 Paragraph 23 of the NPPF indicates local authorities should define a network
and hierarchy of centres that is resilient to anticipated future economic
changes. This approach is consistent with the London Plan and the Southwark
Core Strategy. An analysis of the mix of uses and strengths and weaknesses
of the main centres in the Borough is set out in Appendix 7.
9.3 Core Strategy Policy 3 – shopping, leisure and entertainment – identifies a
network of centres, as set out in Section 2 earlier in this report. Policy 3 seeks
to maintain a network of successful town centres that have a wide range of
shops, services and facilities. Large scale leisure and retail developments will
be directed to these town centres. These objectives are consistent with the
NPPF and the London Plan, in particular the town centre first approach.
9.4 The strategy for town centre development is being reviewed and potential
changes to the hierarchy of centres will need to be considered. As indicated in
Section 2, options for the designation of the Bankside, Borough and London
Bridge areas could be considered. Tower Bridge Road could be designated as
a Local Centre.
9.5 The Core Strategy Strategic Targets Policy 2 relates to improving places. The
policy suggests development will improve the places we live and work. The
target areas include Elephant & Castle and Canada Water, where 45,000 sq.m
and 35,000 sq.m of additional shopping and leisure floorspace is envisaged
respectively.
9.6 The updated retail floorspace projections within this report indicate that
projected growth (over and above commitments) can be accommodated within
vacant shop units and development opportunities identified within emerging
Action Area Plans.
9.7 The London Plan identifies a new opportunity area around Old Kent Road.
There is potential for a new town and/or local centres.

Southwark Retail Study : FINAL REPORT
P54 9190961v2
9.8 There is potential to designate a new local centre in the northern part of Old
Kent Road, this area already contains a range of facilities. There may also be
potential to provide new retail space and a new town and/or local centre in the
middle or southern section of the road. Key influences that will determine the
need to designate new centres will be the scale of residential growth that takes
place around the Old Kent Road, the potential for public transport
improvements, including new tube stations on a Bakerloo line extension and
the timing of growth.
Impact and Sequential Tests
9.9 Emerging development plan policies should cross refer to the impact and
sequential tests within NPPF national policy. The NPPF states that, when
assessing applications for retail, leisure and office development outside of town
centres, which are not in accordance with an up to date local plan, local
planning authorities should require an impact assessment if the development is
over a proportionate, locally set threshold. If there is no locally set threshold,
then the default threshold is 2,500 sq.m gross. Development plan policies need
to consider the need for a proportionate locally set impact threshold.
9.10 The NPPG states that if setting a locally appropriate threshold, it is important to
consider:
• the scale of proposals relative to town centres;
• the existing viability and vitality of town centres;
• cumulative effects of recent developments;
• whether local town centres are vulnerable;
• likely effects of development on any town centre strategy; and
• the impact on any other planned investment.
9.11 If the NPPF threshold (2,500 sq.m gross) was adopted, then a single
development proposal could exceed the entire short term (up to 2021)
floorspace projections for each of the four zones within the borough without the
need for a retail impact assessment. Cumulative impact is also an issue within
the borough, bearing in mind the significant amount of retail commitments in
the pipeline and planned investment within designated centres.
9.12 Proposals that significantly exceed the floorspace projections for each zone
are likely to significantly reduce the turnover of existing floorspace, and this
impact should be carefully tested on a case by case basis.
9.13 The NPPF threshold of 2,500 sq.m gross is inappropriate as a blanket
threshold within LB Southwark, as this scale of development would represent a
significant proportion of the overall retail projections in each of the four zones
within the borough. Development below 2,500 sq.m gross may also have
cumulative impact implications. Development smaller than 2,500 sq.m gross
could have a significant adverse impact on smaller centres. A reduced
threshold of 1,000 sq.m gross should be considered in the borough.
Southwark Retail Study : FINAL REPORT
9190961v2 P55
9.14 The level of guidance relating to the sequential approach to site selection has
reduced within the NPPF. The NPPF gives preference to accessible edge and
out-of-centre sites that are well-connected to the town centre; this applies to
both plan-making and considering applications.
9.15 In order to apply the sequential approach, it is necessary to define town and
local centre boundaries. The current designated boundaries and protected
frontages within these boundaries are shown in Figure 9.1 overleaf. This
approach is consistent with the NPPF and London Plan.
9.16 The designation of primary shopping areas (PSA) or centre boundaries is
important when applying the sequential approach and directing town centre
uses to appropriate locations. The NPPF suggests development plans should
define the extent of town centres and primary shopping areas, based on a
clear definition of primary and secondary frontages.
9.17 The NPPF indicates that the first preference for retail uses should be the
primary shopping area, which will comprise the primary frontages and the
secondary frontages that are contiguous with the primary frontages. The first
preference for leisure uses is normally the wider defined town centre, which
usually includes the primary shopping area and other parts of the centre.
Based on NLP’s experience, separate town centre boundaries and PSA are
only necessary in larger centres, which have significant commercial areas
surrounding the retail core e.g. office, civic, community or leisure uses.
9.18 In LB Southwark the centre boundaries are relatively widely drawn, in particular
Bankside/Borough/London Bridge and Elephant & Castle/Walworth Road.
These widely defined areas are appropriate for focusing main town centre uses
in general. One option would be to distinguish a primary shopping area within
the centre boundaries, where concentrating retail uses within a smaller core
area could be considered. This option could be considered within Major
Centres in LB Southwark.
9.19 If this approach is adopted, emerging development policies will need to
distinguish between the PSA and the wider centre boundary in terms of the
location of different town centre uses, i.e. retail use should be directed to the
PSA, while other uses such as offices, hotels and leisure, would be appropriate
within the wider town centre area. Alternatively the Council could continue the
approach as set out in the Core Strategy and Saved Southwark Plan, which is
pragmatic and in the Council’s view has not resulted in town centre uses within
inappropriate locations.
9.20 The wording of the NPPF requires that the sequential test is applied to
planning applications for main town centre uses. This means that the
sequential test should be applied to the proposal (i.e. the application) rather
than requiring consideration of whether the needs can be met in a different way
in sequentially preferable locations. This approach is endorsed in the Dundee
legal decision (Tesco Stores Ltd v Dundee City Council [2012] UKSC13) and
the Inspector’s Report for the Rushden call-in, endorsed by the Secretary of
State (APP/G2815/V/12/2190175).

Southwark Retail Study : FINAL REPORT
P56 9190961v2
Figure 9.1: Town and Local Centre Boundaries and Protected Frontages
9.21 The NPPF refers by example to flexibility in terms of format and scale but not
to disaggregation. The Rushden decision clearly states there is no requirement
to disaggregate. Flexibility of format and scale should be applied to the
application proposal as a whole which would not require substantive
disaggregation of multi-unit/use schemes. The question of flexibility in terms of

Southwark Retail Study : FINAL REPORT
9190961v2 P57
scale and format needs to be construed in the real world. The approach to
flexibility may be influenced by whether the proposal is by an operator or a
developer.
9.22 The Rushden call-in decision also provides guidance on the area of search for
sequential sites i.e. which centres need to be considered. This decision
suggests town centres cannot automatically be discounted based on size,
position within the hierarchy or location relative to other centres i.e. if they are
not the nearest centre to the application site. Town centres should only be
dismissed on the basis of suitability and viability. Centres may also be
discounted because they do not serve the intended catchment area, and are
therefore unsuitable/unviable. The relevant centres to consider within LB
Southwark will need to be considered on a case by case basis, depending on
the intended catchment area of the application proposals.
9.23 The Rushden decision also provides guidance on “availability”. The NPPF asks
whether town centre or edge of centre sites are “available” it does not ask
whether such sites are likely to become available during the remainder of the
plan period or over a period of some years. When considering a sequential
site’s availability with regards to the likely timetable for the completion of the
application proposal.
9.24 To satisfy the availability criteria, sites should be capable of being delivered in
a shorter period, or similar time period when compared with the application
proposals. This period of time will vary for change of use applications and new
build development.
9.25 Where a proposal fails the sequential approach, it is accepted that it should be
refused when the proposal’s benefits can be provided on a suitable, available
and viable more central site if other material considerations do not indicate to
the contrary.
Protected Shopping Frontages
9.26 The NPPF suggests that in drawing development plans, local authorities
should define primary and secondary frontages within designated centres, and
set policies that make clear which uses will be permitted in such locations.
Primary and secondary frontages may be different to the extent of town centre
or the primary shopping areas. The primary shopping area normally includes
both primary and secondary frontages.
9.27 The NPPF provides limited guidance on the approach policies should adopt.
The NPPF glossary indicates that primary frontages are likely to include a high
proportion of retail uses which may include food, drinks, clothing and
household goods. Secondary frontages provide greater opportunities for a
diversity of uses such as restaurants, cinemas and businesses.
9.28 The NPPF (paragraph 23) also suggests competitive town centres should be
promoted that provide customer choice and a diverse retail offer reflecting the
Southwark Retail Study : FINAL REPORT
P58 9190961v2
individuality of town centres. This implies the most appropriate approach is
likely to vary from centre to centre.
9.29 The Southwark Plan does not distinguish between primary and secondary
frontages, but the Saved Policies seek to retain certain uses within designated
centres and protected shopping frontages.
9.30 Saved Policy 1.7 indicates that within all major, district and local centres, any
floorspace currently in A Class use should be retained or replaced, unless the
proposed use provides a direct service to the general public and the proposal
would not harm the retail vitality and viability of the centre. The proposals
should also not materially harm the amenities of surrounding occupiers.
9.31 Saved Policy 1.9 provides further controls within protected shopping frontages.
Protected shopping frontages are defined as “a frontage of shops where there
is a concentration of retail activity. These frontages comprise a cluster of 10 or
more retail shops.” This policy protects frontages within major, district and
local centres and other local parades.
9.32 Saved Policy 1.9 controls changes of use from Class A1 within protected
shopping frontages. Changes of use will be granted where:
1 the proportion of units within any protected shopping frontage in A1 Use
Class does not fall below 50%;
2 the premises have been vacant for a period of at least 12 months with
demonstrated sufficient effort to let, or have not made a profit over a 2
year period;
3 the proposal would not result in a material loss of amenity for surrounding
occupiers;
4 the proposed use provides a service involving visits to the premises by
members of the public; and
5 the proposal would not harm the vitality or appearance of the protected
shopping frontage.
9.33 Saved Policy 1.10 protects small scale shops and services outside the town
and local centres and protected shopping frontages. Class A uses are
protected except where:
• the loss would not materially harm the amenities of surrounding
occupiers; and
• the use that will be lost is not the only one of its kind within a 600m
radius; and
• the loss would not harm the vitality and viability of nearby shops or
shopping parades; or
• the premises have been vacant for a period of at least 12 months with
demonstrated sufficient effort to let, or have not made a profit over a two
year period.

Southwark Retail Study : FINAL REPORT
9190961v2 P59
9.34 The capacity projections within this study indicate there is a need to retain
Class A1 to A5 uses within designated centres, protected frontages and other
local shops and services, in order to meet the growing needs of the
community. The objectives of Saved Policies 1.7, 1.9 and 1.10 remain valid.
9.35 Southwark has 48 designated protected shopping frontages, as shown in
Figure 9.1. Most of these frontages are small clusters of shop units. The NPPF
indicates these types of smaller parade/clusters should not be designated as
local centres. However it is necessary to maintain these local parades to
ensure residents have access to local shops and services within walking
distance of their home (normally not more than 500 to 800 metres).
9.36 The audit of major, district and local centres in Appendix 7, indicates the
proportion of Class A1 uses varies significantly from centre to centre, as
follows:
1 Peckham 71%;
2 Elephant & Castle 57% (no protected frontages);
3 Walworth Road 70%;
4 Canada Water 57%;
5 London Bridge 44% (no protected frontages);
6 Bankside/Borough 33%;
7 Lordship Lane 56%;
8 Camberwell 55%;
9 Herne Hill 62%;
10 The Blue 58%;
11 Dulwich Village 59%;
12 Nunhead 52%.
9.37 The 50% threshold has not been breached in most centres. The proportion of
the centre that is defined as protected frontages also varies from centre to
centre.
9.38 The Council’s current approach of identifying shopping frontages, without
distinguishing between primary and second has the benefit of providing some
flexibility and represents a pragmatic approach. On the other hand, the Council
also has the option of designating primary and secondary frontages. The
benefit of this approach is that it would help maintain a high proportion of A1
use in the most important town centre frontages, while allowing greater
diversification in the wider town centre. In the sections below we set out how
frontages could be designated.
Peckham
9.39 The majority of Peckham is designated as protected frontage, but there
appears to be considerable potential for changes of use from Class A1
Southwark Retail Study : FINAL REPORT
P60 9190961v2
because the current proportion of Class A1 uses (71%) is high compared with
the minimum policy threshold (50%).
9.40 The Council could consider maintaining the existing approach and seek an
appropriate proportion of Class A1 use across the shopping frontages in
Peckham. Alternatively, consider designating primary and secondary frontages
with new thresholds for Class A1 use. The main focus for Class A1 uses, larger
shop units and multiple retailers is along Rye Lane (between Peckham High
Street and Choumert Road) and the Aylesham Centre. Goad Plan information
suggests around 83% of units in this area are in Class A1 use. This area could
be designated as primary frontage. In other parts of the centre e.g. Peckham
High Street, the southern end of Rye Lane and side streets off Rye Lane, the
proportion of Class A1 uses is much lower (around 60%). This area could be
designated as secondary frontage.
9.41 Primary shopping frontage for Rye Lane and Aylesham Centre should seek to
maintain the focus of Class A1 uses, and a minimum limit of 80% could be
adopted. With the secondary frontages more flexibility and diversity could be
promoted and the current 50% minimum could be retained.
Elephant and Castle
9.42 Elephant and Castle is now part of a wider Major Town Centre including most
of Walworth Road and the Heygate regeneration area. There are no protected
frontages within the Elephant & Castle area. The boundary of the centre and
the need for a primary shopping area and designated shopping frontages could
be reviewed after the implementation of the Heygate redevelopment and the
potential redevelopment of the Elephant and Castle Shopping Centre.
Walworth Road
9.43 Walworth Road (north of Merrow Street) is now part of a wider Major Town
Centre including Elephant and Castle Shopping Centre and the Heygate
regeneration area. The protected frontages within Walworth Road (as shown
on the adopted proposals map) cover most of the centre from Merrow Street
up to Browning Street, and East Street, where the street market is located.
There appears to be considerable potential for changes of use from Class A1
because the current proportion of Class A1 uses (70%) is high in Walworth
Road.
9.44 The town centre boundary and protected frontage do not in include frontages
that extend south along Camberwell Road, which is included within the Goad
Plan area for Walworth Road. This area has about 90 shop units. The
proportion of Class A1 uses in this area is about 60%. Within the protected
frontages along Walworth Road and East Street the proportion of Class A1
uses is about 75%. The area to the north of the protected frontage (within the
designated Major Centre) has a much lower proportion of Class A1 uses with
less than 40%.
Southwark Retail Study : FINAL REPORT
9190961v2 P61
9.45 The Council could consider designating primary and secondary frontages with
new thresholds for Class A1 use. The main focus for Class A1 uses, larger
shop units and multiple retailers is along Walworth Road between Merrow
Street to East Street, and the East Street market area. This area could be
designated as primary shopping frontage, where a high proportion (as least
75%) could be retained in Class A1 use. The secondary shopping frontages
could be extended to north to Larcom Street and beyond, which would help to
regenerate dead frontages in the north part of Walworth Road and improve
footfall.
9.46 Other parts of the centre, including the frontages along Camberwell Road
could be designated as secondary frontages. With the secondary frontages,
more flexibility and diversity could be promoted and the current 50% minimum
could be retained. The boundary of the centre could be extended south to
Albany Road to include existing shops and services.
Canada Water
9.47 The Major Town Centre boundary includes Surrey Quays Shopping Centre and
its surface car park, the Decathlon store and Lower Road. The protected
shopping frontages include most of Lower Road and the mall within Surrey
Quays Shopping Centre.
9.48 The Area Action Plan envisages the potential for a transformation of the Surrey
Quays Shopping Centre. The future approach towards the designation of
frontages should be reviewed in the light of future regeneration.
9.49 The proportion of Class A1 uses on the ground floor within the Surrey Quays
Shopping Centre is about 84% and there is potentially considerable scope for
changes of use from Class A1, within the 50% limit. Within the protected
frontage along Lower Road and Plough Way the proportion of Class A1 uses is
only around 40%.
9.50 The Council should consider designating primary and secondary frontages with
new thresholds for Class A1 use. The main focus for Class A1 uses, larger
shop units and multiple retailers is within the Surrey Quays Shopping Centre.
The need for designated shopping frontages in the shopping centre could be
reviewed after the implementation of development on the site. Lower Road,
Plough Way and Rotherhithe Old Road could be designated as secondary
frontages where a more flexible approach could be adopted e.g. 40% within
Class A1 use.
9.51 The boundary of the centre and the need for a primary shopping area and
designated shopping frontages could be reviewed after the implementation of
potential redevelopment of Surrey Quays Shopping Centre.
London Bridge
9.52 As indicated in Section 2, the Core Strategy town centre boundary for London
Bridge is cast widely. The area contains a diverse range of uses including

Southwark Retail Study : FINAL REPORT
P62 9190961v2
retail, office, law, cultural, tourism, education, health, transport and residential
which help reinforce the central activities zone. London Bridge has three main
clusters of commercial use i.e. London Bridge Station (currently being
redeveloped), Hays Galleria and More London Place. The centre could be
extended to include Shad Thames and Bermondsey Street.
9.53 One option available to the Council would be to designate CAZ frontages on
existing retail parades. However this would not fully reflect the dynamism of the
area or change which is occurring. The second option available to the Council
would be to maintain the existing approach which provides greater flexibility to
enable change and the establishment of new retail uses in appropriate
locations.
9.54 There are no protected frontages within the London Bridge area. This area is
only afforded protection within saved Policy 1.7, regarding the loss of Class A
uses. Measures could be introduced to introduce and protect Class A1 uses.
Bankside/Borough
9.55 The Core Strategy town centre boundary at Bankside/Borough is also cast
widely and contains a diverse range of uses. Facilities within the
Bankside/Borough are fragmented. Again one option available to the Council
would be to designate CAZ frontages, but this area also has similar
characteristics to London Bridge District Centre. The second option available to
the Council would be to maintain the existing approach which provides greater
flexibility to enable change and the establishment of new retail uses in
appropriate locations.
9.56 The protected frontage along Borough High Street has a relatively low
proportion of Class A1 uses (around 30%). The 50% threshold has been
breached. Tighter measures could be introduced to protect Class A1 uses.
Lordship Lane
9.57 Most of Lordship Lane is designated as protected frontage. Within the
protected shopping frontages the proportion of Class A1 use is around 55%,
similar to other parts of the centre.
9.58 The Council could consider designating primary and secondary frontages with
new thresholds for Class A1 use. The protected frontages could be defined as
primary shopping frontage with a 50% minimum limit on Class A1 use. The rest
of the designated centre could be designated secondary frontage where more
flexibility and diversity could be promoted with a 40% minimum for Class A1
use.
Camberwell
9.59 The majority of Camberwell is designated as protected frontage. Within the
protected shopping frontages the proportion of Class A1 use is just over 55%,
compared with around 45% in other parts of the district centre.

Southwark Retail Study : FINAL REPORT
9190961v2 P63
9.60 The Council could consider designating primary and secondary frontages with
new thresholds for Class A1 use. The protected frontages could be defined as
primary shopping frontage with a 55% minimum limit on Class A1 use. The rest
of the designated centre could be designated secondary frontage where more
flexibility and diversity could be promoted with a 40% minimum for Class A1
use.
Herne Hill
9.61 Much of the designated centre is within LB Lambeth. The shopping frontages
within LB Southwark form an important part of the centre and should be
maintained. The policy approach adopted for these frontages should be
consistent with the approach in LB Lambeth policy, in order to maintain the
vitality and viability of the centre as a whole.
The Blue, Dulwich Village and Nunhead
9.62 The Blue, Dulwich Village and Nunhead are designated Local Centres with
protected shopping frontages. The scale of the centres and the distribution of
uses suggest a primary and secondary frontage approach is not suitable in
these centres. The current approach adopted within protected shopping
frontages could be retained.
Other Local Parades
9.63 The even distribution of protected shopping frontages across the borough
helps to ensure high level of accessibility to local shopping facilities for most
residents. In order to maintain high levels of accessibility across the borough,
all protected shopping frontages should be retained, even if the number of
shops and services falls below 10 units. Based on NLP’s experience across
London, local parades of around 5 shop units can also fulfil an important
shopping function.
9.64 Local centres and parades should provide a good mix of shops, services and
community uses. Uses that would typically be found in local centres/parades
include a range of A1 to A5 and D1 uses:
1 food or convenience store suitable for top-up shopping (A1);
2 bank (A2);
3 post office (A1);
4 newsagent (A1);
5 off licence (A1);
6 chemist (A1);
7 takeaway (A5)
8 café or restaurant (A3);
9 public house (A4);
10 bookmakers (Sui Generis);
Southwark Retail Study : FINAL REPORT
P64 9190961v2
11 dry cleaners/laundrette (A1/Sui Generis);
12 hairdressers/beauty salon (A1);
13 florist (A1);
14 estate agents (A2);
15 community hall (D1);
16 doctor’s/dentist surgery (D1); and
17 library (D1).
9.65 This list of typical uses found within local centres/parades suggests the 50%
threshold for Class A1 uses is generally appropriate for centres of this kind.
9.66 As described in Section 6, Southwark has a relatively high provision if betting
shops and payday loan shops, with particular concentration in Peckham,
Walworth and Camberwell. The provision of hot-food takeaways is also
relatively high, particularly in district centres. Maintaining a mix of uses will
benefit the vitality and viability of high streets.
Southwark Retail Study : FINAL REPORT
9190961v2 P65
10.0 Conclusions
Introduction
10.1 This report provides a borough-wide needs assessment for retail and other
town centre uses in LB Southwark. The principal conclusions of the analysis
contained within this study are summarised below.
Meeting Needs in LB Southwark
10.2 The NPPF states that local planning authorities should assess the quantitative
and qualitative needs for land or floorspace for man town centre uses over the
plan period up to 2031
10.3 When planning for growth in their town centres, local planning authorities
should allocate a range of suitable sites to meet the scale and type of retail
development needed. It is important that the needs for retail and other main
town centre uses are met in full and not compromised by limited site
availability.
Class A1 to A5 Retail Uses
10.4 The quantitative assessment of the potential capacity for new floorspace
suggests that there is scope for new Class A1 to A5 development within LB
Southwark. The projections up to 2031 suggest there is scope for about 7,500
sq.m gross of Class A1 convenience goods floorspace, 33,900 sq.m gross of
Class A1 comparison goods floorspace and 9,300 sq.m gross of Class
A3/A4/A5 floorspace.
10.5 In qualitative terms, all residents in the borough have good access to food
stores both within and outside the borough. Southwark is reasonably well
served by superstores (over 2,500 sq.m net) although there are limited large
superstores located to the south of the borough. There are no obvious areas of
deficiency in food store provision.
10.6 Peckham is the main comparison goods shopping destination in terms of
number of outlets and sales floorspace and has a reasonable range of
comparison shops including national multiples and independent specialists.
Surrey Quays shopping centre has the highest proportion of national multiple
retailers.
10.7 The main centres within Southwark offer a good mix and choice of comparison
goods retailers, with a reasonable proportion of clothing and footwear shops
and presence of national multiple retailers. The smaller centres generally have
higher proportions of lower order comparison shops, i.e. selling items bought
on a regular basis, and more independent retailers. Old Kent Road is also a
major comparison goods shopping destination in the borough, including a
range of predominantly bulky goods retail units.

Southwark Retail Study : FINAL REPORT
P66 9190961v2
10.8 The proportions of Class A3/A5 within Canada Water (including Lower Road
and the leisure park) and the District Centres are much higher than the national
average and Peckham has a particularly low proportion of restaurants (Class
A3) and public houses/bars (Class A4).
10.9 The provision of betting shops and payday loan shops is above the national
average in most centres.
Commercial Leisure
10.10 The commercial leisure assessment suggests:
1 current and proposed cinema provision within LB Southwark should
accommodate future growth;
2 there could be scope for four or five additional health and fitness clubs in
LB Southwark over the study period;
3 there is no theoretical need for additional tenpin bowling or bingo facilities
or nightclubs; and
4 the demand for additional theatre facilities and nightclubs in LB
Southwark may be constrained by provision in central London. However
if proposals emerge for new facilities then these proposals could help
reinforce the cultural offer, especially in the central activities zone and
can help enliven town centres.
Development Plan Strategy Recommendations
10.11 The strategy to accommodate growth in the borough is summarised in Table
10.1 below.
Table 10.1: Accommodating Retail Growth in Southwark
Centre/Area 2031
Floorspace Sq.M Gross
Comment
North West Southwark 9,203
Delivery of commitments at Heygate, Borough. Reduction in shop vacancy rate. Remaining requirement accommodated in redevelopment of Elephant & Castle Shopping Centre.
North East Southwark 22,288
Delivery of commitments at Canada Water. Reduction in shop vacancy rate. Remaining requirement accommodated in a larger development at Surrey Quays Shopping Centre.
Southwark Central 10,767 Reduction in shop vacancy rate. Delivery of Peckham and Nunhead AAP and Aylesbury AAP proposals.
Southwark South 8,544 Transfer capacity to Peckham Southwark Central.
Total 50,802

Southwark Retail Study : FINAL REPORT
9190961v2 P67
10.12 In addition to the potential to accommodate growth shown above. The London
Plan identifies a new opportunity area around Old Kent Road. There is
potential for a new town and/or local centres.
Impact and Sequential Tests
10.13 The NPPF threshold of 2,500 sq.m gross is inappropriate as a blanket
threshold within LB Southwark. Development smaller than 2,500 sq.m gross
could have a significant adverse impact on smaller centres. A reduced
threshold of 1,000 sq.m gross should be considered in the borough.
10.14 In order to apply the sequential approach, it is necessary to define town and
local centre boundaries. The current designated boundaries are consistent with
the NPPF and London Plan. Concentrating retail uses within a smaller core
area primary shopping area should be considered within Major Centres in LB
Southwark. If this approach is adopted, emerging development policies will
need to distinguish between the PSA and the wider centre boundary.
Protected Shopping Frontages
10.15 The NPPF suggests that in drawing development plans, local authorities
should define primary and secondary frontages within designated centres. The
Southwark Plan does not distinguish between primary and secondary
frontages, but the Saved Policies seek to retain certain uses within designated
centres and protected shopping frontages.
10.16 The capacity projections within this study indicate there is a need to retain
Class A1 to A5 uses within designated centres, protected frontages and other
local shops and services, in order to meet the growing needs of the
community. The objectives of Saved Policies 1.7, 1.9 and 1.10 remain valid.
10.17 A number of options relating to the designation of primary and secondary
shopping frontages should be considered by the Council, and new thresholds
for Class A1 use considered.
10.18 As describe in Section 6, Southwark has a relatively high provision of betting
shops and payday loan shops, with particular concentrations in Peckham,
Walworth and Camberwell. The provision of hot-food takeaways is also
relatively high, particularly in district centres. Maintaining an appropriate mix of
uses will benefit the vitality and viability of high streets.
