southern regional council on education administration · southern regional council on education...
TRANSCRIPT
SRCEASouthern Regional Council on Education Administration
E-JournalPaul Watkins, Editor
Volume I, Issue I2012

Spring 2012 ■ i
TABLE OF CONTENTS On the Inaugural Issue of the Southern Journal of Educational Administration................................................................................................... Paul Watkins 1 Principals’ Perceptions of the Relationships Between School Efficiency Factors and .................................................................... Eddie V. Obleton, Student Success in Alternative Schools ..................................Ellen H. Reams & Frances K. Kochan 3 Educational Accountability: The Role of Efficiency, .............................................................. Tak C. Chan, Effectiveness and Productivity ............................ Mindy Crain-Dorough, & Michael D. Richardson 19 Designing a Blended Specialist Program in Educational Leadership ................................. Margaret Dalton, Ruth Ann Roberts & Ray Dowdy 27

Spring 2012 ■ ii
Spring 2012 ■ 1
On the Inaugural Issue of the Southern Journal of Educational Administration
Paul Watkins, Editor
Southeast Missouri State University The Southern Regional Council of Educational Administration (SRCEA) through its many years of service to school leadership is launching its first issue of the Southern Journal of Educational Administration (SJEA). The focus for this journal is the education of school leaders and research that gives voice to those issues that impact schools and their leadership. Through the lens of our journal, we hope to capture the stories and research of those who are helping shape thinking around educational leadership. Further, SJEA intends to be inclusive of our graduate student community, which often looks at issues with fresh eyes and unique perspectives. Leadership education shares the stage as a critical topic for exploration. The journal will provide information, data, and stories that will generate a larger conversation around educating and preparing future school leaders. If we are not the ones to define educational leadership and preparation programs, there are others outside the profession eager to do it for us. SJEA’s mission is simply this: provide a forum for presentation and discussion around school leadership and leadership preparation. The articles captured in this, the inaugural launch, closely fit our mission. We encourage SRCEA members and other leaders among us to support the journal’s effort by continuing to submit scholarship for coming issues.

2 ■ Southern Journal of Educational Administration

Spring 2012 ■ 3
Principals’ Perceptions of the Relationships Between School Efficiency Factors and Student
Success in Alternative Schools
Eddie V. Obleton Ellen H. Reames Columbus State University Auburn University
Frances K. Kochan Auburn University
Abstract This is the first part of a three part study examining the relationship between student success and elements within the context of Type II alternative schools in Georgia. The study examined principals’ perceptions of the relationships between six student success factors and dimensions that comprise the school efficiency domain. The school success factors were: dropout rate, average grade point average (GPA), average absences per student, recidivism rate and student suspension rate. The School Efficiency Domains comprised of dimensions within leadership, organizational structure and resources, and comprehensive and effective planning. Results indicated that principals perceived a relationship between the student outcome measure of suspension rate and all three of the Efficiency Domain factors (planning, organizational structure, and leadership). Previous research supports these relationships. However, the only other relationship noted was between recidivism and organizational structure and resources. The possible reasons for these findings and implications for practice and research are discussed.
Introduction
Most school systems in America seek to provide a quality education for all of their students. However, issues of equity in assuring that all children succeed in public schools have been a focus of debate for decades (Lange & Sletten, 2002). In 2001 a major revision of Public Law 107-110, commonly known as No Child Left Behind (NCLB) brought this issue into the spotlight and began impacting students and schools throughout the nation in some very powerful ways. The NCLB targeted low performing schools and students and encouraged states to adopt the idea that all children can learn and that no child should be left behind (Aron, 2006; Barr & Parrett, 2003; Swarts, 2002).
As schools have moved toward meeting the mandates of NCLB, alternative schools have expanded and have taken on a much broader, healthier, more comprehensive role. Advocates for these alternative educational settings argue that they are imperative in meeting the needs of all students (Barr & Parrett. 2001; Natriello, McDill & Pallas, 1990; Raywid, 1999; Young, 1990).
Raywid (1994) developed a typology recognizing three types of alternative schools and programs. A Type I alternative school emphasizes academic performance and would

Eddie V. Obleton, Ellen H. Reames & Frances K. Kochan
4 ■ Southern Journal of Educational Administration
characteristically include charter schools, magnet schools, multicultural schools and schools without walls (Lange & Slatten, 2002; Lehr et al., 2004; Morley, 1991). Type I schools are based on choice and usually appeal to students because of a specialized curriculum or a unique educational setting.
Type II alternative schools usually do not involve choice and characteristically work with at-risk students, many of whom are in danger of dropping out of school (Aron, 2006; Gregg, 1999; Lange & Sletten, 2002; Lehr et al., 2004; Raywid, 1994). Type II alternative programs emphasize discipline. Often students are placed in these schools as a final step before they are expelled. These schools include an involuntary placement for a specified period of time. Violent or disruptive students are often placed in these alternative schools (Kochhar-Bryant & Lacey, 2005). Other typical examples of Type II schools are last-chance or second-chance schools (Aron, 2006; Cash, 2004). The atmosphere in these schools is generally highly structured and punitive, the curriculum is limited, and the assignments are provided by the home school (Aron, 2006; Lange & Sletten, 2002; Raywid, 1994).
Type III alternative schools emphasize a therapeutic, student-centered approach. Characteristics of Type III alternative schools include focusing on rehabilitating attitudes and behaviors. Type III alternative schools address emotional and social barriers to learning which the student encountered in traditional settings (Gregg, 1999). The climates in these schools tend to be caring, nurturing and supportive. Residential schools are an example of Type III alternative schools. They are designed for special case students and they are usually placed in this setting by their families or the courts. Background of Study The state of Georgia established an alternative education program in 1995. The mission of this program is “to provide a learning environment that includes the objectives of the quality core curriculum; and that the instruction in an alternative education program shall enable students to return to a general or career education program as quickly as possible” (Cox, 2008). Four models of alternative schools were created to meet this mission. The models are: Community-based Alternative Education Program, In-School Suspension, School-Community Guidance Center, and CrossRoads Alternative Education Program (160-4-8-.12, 2001).
Using Raywid’s (1994) alternative school categories, the Community-based Program would be categorized as Type I, and the In-school Suspension Program would be in the Type II category. The School Community Guidance Center would fall in the Type III category. The In-School Suspension Program and the CrossRoads Program would be in a Type II category. This research study focused on the CrossRoads model Type II punitive alternative school.
Most of the students are placed in the Type II schools for violating school rules and policies such as violent and disruptive behavior, inappropriate sexual behavior, drug and alcohol use, and possession and weapon violations (Cox, 2008). Georgia has 154 Type II alternative schools, which serve students in grades 6–12. Students in Georgia’s Type II
Student Success in Alternative Schools
Spring 2012 ■ 5
punitive alternative schools are not given a choice of whether to attend the school because they are typically placed in CrossRoads schools through school system tribunals.
Georgia has mandated that CrossRoads schools follow best practices guidelines and has identified key elements of successful alternative school programs based on research (Barr & Parrett, 2001, 2003, 2004; Cash, 2004; Cox, 2008). Thus, in 2006 the Georgia Department of Education Alternative Education Subcommittee recommended the following attributes be incorporated into these schools:
• Having a clear mission • Designing a discipline code and rules that are clear to all • Hiring teachers who wish to work with the at-risk population • Hiring faculty and administrators who have high expectations for students and for
their levels of achievement • Creating a culture of caring in the school • Implementing and supporting on-going faculty professional development • Having a common commitment that all students succeed. Although these schools have been in place for many years, the research on their
success and the perceptions of those who lead them is scant. This study sought to investigate this issue by examining the perceptions of those administering them.
Purpose of the Study This is the first part of a three part study examining the relationship between student
success and elements within the context of Type II alternative schools in Georgia. The study examined principals’ perceptions of the relationships between six student success factors and dimensions that comprise the school efficiency domain. The school success factors were: dropout rate, average grade point average (GPA), average absences per student, recidivism rate and student suspension rate. The School Efficiency Domains comprised of dimensions within leadership, organizational structure and resources, and comprehensive and effective planning.
Research on Georgia Alternative Schools
The Georgia Department of Education Alternative Education Subcommittee Report (2006) notes that when teachers choose to work with this at-risk population, classes are kept small, the curriculum is individualized and student success rates increase. According to the report the individualized attention and prescribed nature of the punitive alternative school allows it to address the risk factors that the students possess (Cox, 2008).
A research study of first year of Type II CrossRoads alternative schools in 1995 was undertaken during the first year of their existence (1995) to address the program’s impact and effectiveness. The qualitative study asked four questions: (1) How well is the program working? (2) What works and doesn’t work and why? (3) What needs to be improved and how? and (4) How has the program impacted students? The questions were answered by
Eddie V. Obleton, Ellen H. Reames & Frances K. Kochan
6 ■ Southern Journal of Educational Administration
educators and students in these schools (Karlin & Harnish, 1995). The researchers identified two primary themes: the importance of community and program administration. The theme of ‘community of support’ was described by the researchers as including three properties: (1) the program as community; (2) connections to the community outside of the school; and (3) perceptions of the community. The program as community property fosters a team approach that includes teachers, administrators, and parents. The connections to the community outside of the school property provides needed resources from the outside agencies such as Health Departments, Department of Family and Children Services, Georgia Department of Labor, and other agencies that at-risk students might consider safe havens and helping agencies. Elements of Effective Alternative Schools While there is some research on and about alternative schools in general, there is limited research on what makes alternative schools effective and few if any scientifically-based evaluation instruments are available that establish which components lead to positive outcomes for alternative school students (Aron, 2006).
A review of the literature suggests alternative schools that are doing well appear to have common fundamentals in areas of: (1) organizational structures and processes, (2) leadership and governance, (3) academic press and student support, (4) ongoing and continuous staff development, and (5) program assessment and evaluation. Swarts’ Dimensions of Effective Alternative Schools Swarts (2002) attempted to operationalize a definition of alternative school effectiveness from these lists of common elements. Swarts (2003/04) developed three domains of alternative school effectiveness. Those domains are: academic performance, learning environment, and efficiency. In the domain of academic performance are the dimensions/standards of curriculum, assessment, and instruction. In the learning environment domain are the dimensions/standards of organizational culture and diversity, student, family and community support and professional development. In the efficiency domain, which this research examined, are the dimensions/standards of comprehensive and effective planning, leadership and governance, and organizational structures and processes. These efficiency dimensions/standards are described in more detail in the section that follows. Comprehensive and Effective Planning The dimension of comprehensive and effective planning includes the development, implementation, and evaluation of a clear purpose and direction and a focus on teaching and learning. The planning dimension also includes safety and crisis management plans whereby particular procedures and protocols have been established. The established protocols and procedures should be appropriate for an alternative school and fall within the policies established by the local Board of Education.

Student Success in Alternative Schools
Spring 2012 ■ 7
Leadership and Governance Leadership and governance refers to how engaged and involved the faculty, administrators, students, parents and other community stakeholders are in the program. Leadership from all members of the school community (i.e., school administrators, faculty members, families, students and other community stakeholders) is necessary to drive the school in positive directions for student success (Aron, 2006; Kochan,1999; Leone & Drakeford, 1999; Raywid, 1994).
Also included is how supportive the Local Educational Agency (LEA) is of the alternative school efforts. Those alternative schools which are given autonomy by the central office, as opposed to those that are highly controlled, appear to be more successful in meeting student academic, social and behavioral outcomes (Aron, 2006; Cash, 2004; Schorr, 1997).
Effective alternative schools must have a clear vision and mission with defined goals and expected outcomes focused on academic success of every student. The school must have a clearly defined discipline code which is fair and just (Schargel & Smink, 2001). In addition, students, faculty and staff should have a voice that is heard in the operation of the school (Aron, 2006; Kochar-Bryant, 2005). Organizational Structures and Processes Organizational variables and structures are those items that build and maintain the organization as a learning community (Dufour & Eaker, 1998; Hord, 1997; Raywid, 2006). In effective alternative schools this would include more humane treatment of students and teachers because classes and teacher/student class ratios are much smaller, and because teachers and administrators have a commitment to their success (Aron, 2006; Koetke, 1999; Meyers, 2001; Raywid, 1994). Using small school frameworks allows for a “sense of community and personal caring” (Morley, 1991, p. 5). Furthermore, the use of unconventional approaches and organizational structures, individualized instruction and consistency in organizational rules and personnel interactions with students helps establish important elements of the alternative schools (DeBlois, 2000; Koetke, 1999; Morley, 1991; Schorr, 1997).
The small school concept is an essential element of effective alternative schools (Aron, 2006; Lange & Sletten, 2002; Raywid, 2006). Students of all talents and personalities have greater opportunities to fit into their environment in such schools (Katsiyannis & Williams, 1998). This type of organizational structure also gives faculty and staff a greater opportunity to reach these youth (DeBlois, 2000; Tobin & Sprague, 2000). Using a small schools framework helps to create a “sense of community and personal caring” (Morley, 1991, p. 5). Schargel and Smink (2001) recommend a maximum of a 1:10 teacher/student ratio and a maximum student population of 250. Other studies have demonstrated the impact of small learning communities on achievement and youth development (Castellano et al., 2001; Raywid 2001; Secada 1999; Zweig, 2003).
Eddie V. Obleton, Ellen H. Reames & Frances K. Kochan
8 ■ Southern Journal of Educational Administration
Alternative schools that are organized as student-centered environments, that have instructional programs stressing a specific philosophy and operate a noncompetitive learning environment show positive results with the youth they serve (Koetke 1999). Alternative schools that provide flexible school schedules and offer multiple scheduling formats are also shown to have positive results with the students served (Schargel & Smink, 2001). However, even with such flexibility, alternative school classrooms which are highly structured, where expectations are clear and rules and routines are clearly defined and reinforced have the benefits of teaching self-management skills and have high rates of academic gains for students (Tobin & Sprague, 2000).
Instrumentation As previously noted, Swarts (2002) created an instrument to measure elements of effective alternative schools. However, the validity and reliability of the instrument have not been established. In addition the instrument is long, containing 117 items. Since there did not appear to be an instrument available that had been deemed valid and reliable and which could be easily administered, the researcher sought and received permission from Swartz to use his research findings and to amend and use his instrument as a basis for the study.
The details of the development of the instrument are reported in another venue (Obleton, 2010). After identifying the basic conceptual frame from the research literature, the researcher identified and worked with an expert panel to assist in designing the instrument. A pilot test was then conducted and the instrument was revised based upon this test. Test reliability was determined during the research process.
The final instrument, the Swarts Measure of Alternative Schools (Obleton version) has three parts. Part 1 deals with school, faculty and student demographics and contains 9 descriptive items. Part 2 asks 5 yes/no questions relative to the 5 student success factors. Part 3 contains 88 questions using a five-point Likert Scale (from Strongly Agree to Strongly Disagree) dealing with three domains of effective schools based on the Swarts’ domains. The domains were named the Efficiency Domain (Planning, Leadership, Organizational Structures and Resources), the Learning Environment Domain (Culture, Climate and Diversity, Professional Development, Parental Involvement, Community Involvement, School Linked Integrated Support Services), and the Academic Performance Domain (Curriculum, Instruction, and Assessment). There were 24 questions in the Efficiency Domain, which is the focus of this article. It takes approximately 25 minutes to complete the instrument.
Data Collection
An online version of the survey was constructed using Survey Methods (http://www.surveymethods.com). Respondents were given an informational email with a link to the survey. If the respondent agreed to answer the survey and went to the link, he or she was instructed to first provide some basic demographic data about their alternative

Student Success in Alternative Schools
Spring 2012 ■ 9
school and the students who attended the school. The respondent was then asked to participate in the second and third parts of the survey.
Data Analysis and Findings The most appropriate statistical method for this study was determined to be a series of one-way ANOVAS using the F-test statistic. The analysis involved examining the relationships between the five dependent variables of student success as measured by dropout rate, suspension rate, grade point average (GPA), student absentee rate and student recidivism rate and the independent variables included in the dimensions of the Efficiency Domain: planning and continuous improvement, school leadership and governance, and organizational structures and resources.
The data analysis, findings, and a discussion about them, are organized into two sections. The first section summarizes the findings relative to the reliability of the instrument as it relates to the Efficiency Domain. The second section reports the results of the relationships between student success factors and the Efficiency Domain.
Findings Instrument Reliability for the Efficiency Domain Reliability coefficients were computed for each scale in the Efficiency Domain and for the overall domain. Specifics for each of the scales in reported in Obleton (2010). With Cronbach’s alpha of .60 or greater being a generally accepted standard for measures assessing group differences (Nunnally & Bernstein, 1994; Thorndike, 1997), the reliability coefficients which ranged from .81 to .97 strongly substantiates the internal consistency of all nine scales. In fact, the scales far exceed the standards set for minimum levels of reliability (Thorndike, 2005). Perceived Relationships between Success Factors and the Efficiency Domain Alternative school principal’s did not perceive any significant relationship between absentee rates of greater than or equal to 7 days per semester (> 7 days per semester) or less than 7 days per semester (< 7 days per semester) and the nine dimensions examined.
Means, standard deviations, and results of the univariate analysis of variance test of the differences on the scales between the groups reporting student absentee rate of greater than or equal to 7 days per semester (> 7 days per semester) (n = 26) or a student absentee rate of less than 7 days per semester (< 7 days per semester) (n = 43) are given in Table 1. Eta and power were also reported.
Eddie V. Obleton, Ellen H. Reames & Frances K. Kochan
10 ■ Southern Journal of Educational Administration
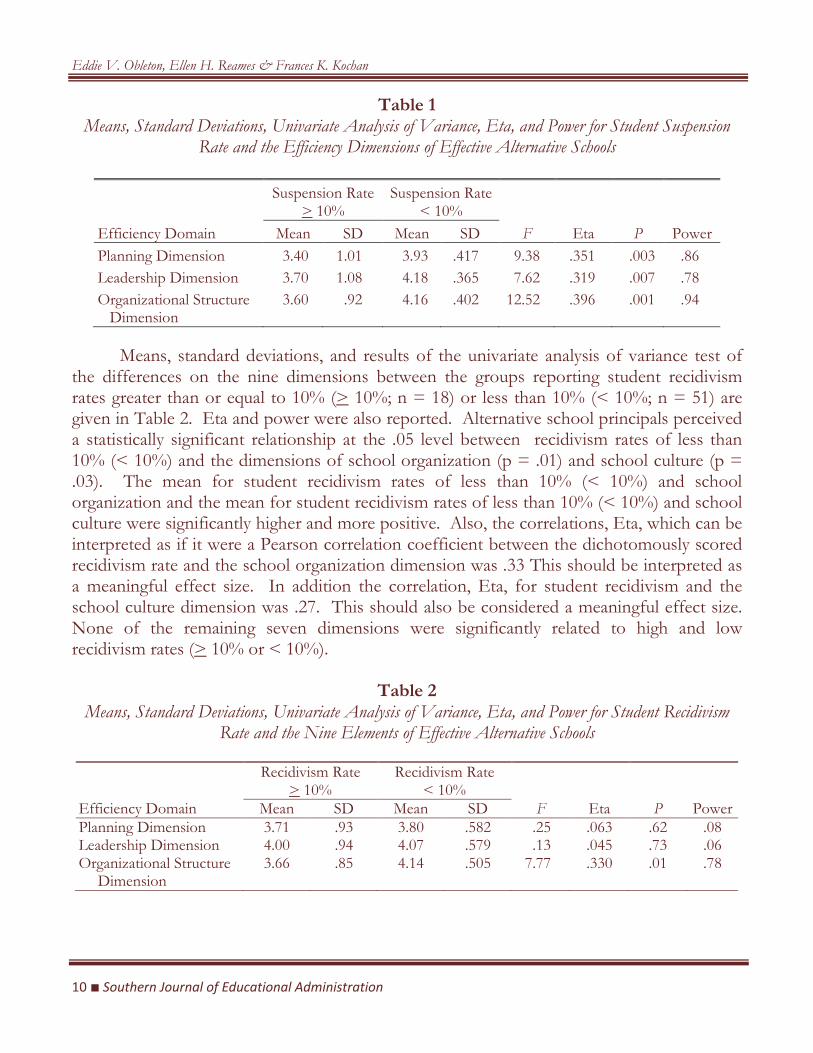
Table 1 Means, Standard Deviations, Univariate Analysis of Variance, Eta, and Power for Student Suspension
Rate and the Efficiency Dimensions of Effective Alternative Schools
Suspension Rate > 10%
Suspension Rate < 10%
Efficiency Domain Mean SD Mean SD F Eta P Power Planning Dimension 3.40 1.01 3.93 .417 9.38 .351 .003 .86 Leadership Dimension 3.70 1.08 4.18 .365 7.62 .319 .007 .78 Organizational Structure
Dimension 3.60 .92 4.16 .402 12.52 .396 .001 .94
Means, standard deviations, and results of the univariate analysis of variance test of
the differences on the nine dimensions between the groups reporting student recidivism rates greater than or equal to 10% (> 10%; n = 18) or less than 10% (< 10%; n = 51) are given in Table 2. Eta and power were also reported. Alternative school principals perceived a statistically significant relationship at the .05 level between recidivism rates of less than 10% (< 10%) and the dimensions of school organization (p = .01) and school culture (p = .03). The mean for student recidivism rates of less than 10% (< 10%) and school organization and the mean for student recidivism rates of less than 10% (< 10%) and school culture were significantly higher and more positive. Also, the correlations, Eta, which can be interpreted as if it were a Pearson correlation coefficient between the dichotomously scored recidivism rate and the school organization dimension was .33 This should be interpreted as a meaningful effect size. In addition the correlation, Eta, for student recidivism and the school culture dimension was .27. This should also be considered a meaningful effect size. None of the remaining seven dimensions were significantly related to high and low recidivism rates (> 10% or < 10%).
Table 2 Means, Standard Deviations, Univariate Analysis of Variance, Eta, and Power for Student Recidivism
Rate and the Nine Elements of Effective Alternative Schools
Recidivism Rate > 10%
Recidivism Rate < 10%
Efficiency Domain Mean SD Mean SD F Eta P Power Planning Dimension 3.71 .93 3.80 .582 .25 .063 .62 .08 Leadership Dimension 4.00 .94 4.07 .579 .13 .045 .73 .06 Organizational Structure
Dimension 3.66 .85 4.14 .505 7.77 .330 .01 .78

Student Success in Alternative Schools
Spring 2012 ■ 11
Means, standard deviations, and results of the univariate analysis of variance test of the differences on the nine dimensions between the groups (n = 69) reporting student GPA > 2.00 (n = 56) and GPA < 2.00 (n = 13) are given in Table 3. Eta and power were also reported. Alternative school principal’s perceived a statistically significant relationship between student’s with a GPA greater than or equal to a 2.0 (> 2.00) and Professional Development (p = .036), Parental Involvement (p = .049) and the Community Involvement (p = .026) dimensions within the Learning Environment Domain. Means on these three scales were significantly different at the .05 level for the GPA less than 2.0 (< 2.00) and the GPA that was equal to or greater than 2.0 (> 2.00). The means for the Professional Development, Parental Involvement, and Community Involvement dimensions were significantly higher and more positive, for the group with a GPA equal to or greater than 2.0 than the group with a GPA lower than 2.0. Also the correlations, Eta, which can be interpreted as if it were a Pearson correlation coefficient between the dichotomously scored GPA measure and the three continuous quantitative dimensions ranged from .24 to .27 which should be interpreted as a meaningful effect size. Interestingly, these three dimensions comprise 3 of the 5 dimensions of the Learning Environment Domain. The fifth dimension, School Linked Integrated Support Services (p = .057) was not significant with a GPA equal to or greater than a 2.0 (> 2.00). The first dimension, school culture was not significant with a GPA of 2.0 (p = .077).
Table 3 Means, Standard Deviations, Univariate Analysis of Variance, Eta, and Power for GPA Groups and the
Nine Dimensions of Effective Alternative Schools (n = 69)
GPA > 2.00
GPA < 2.00
Efficiency Domain: Mean SD Mean SD F Eta P Power Planning Dimension 3.82 .60 3.72 .92 .20 .055 .653 .07 Leadership Dimension 4.08 .58 3.90 1.02 .67 .100 .416 .13 Organization Structure
Dimension 4.04 .62 3.92 .63 .40 .077 530 .10
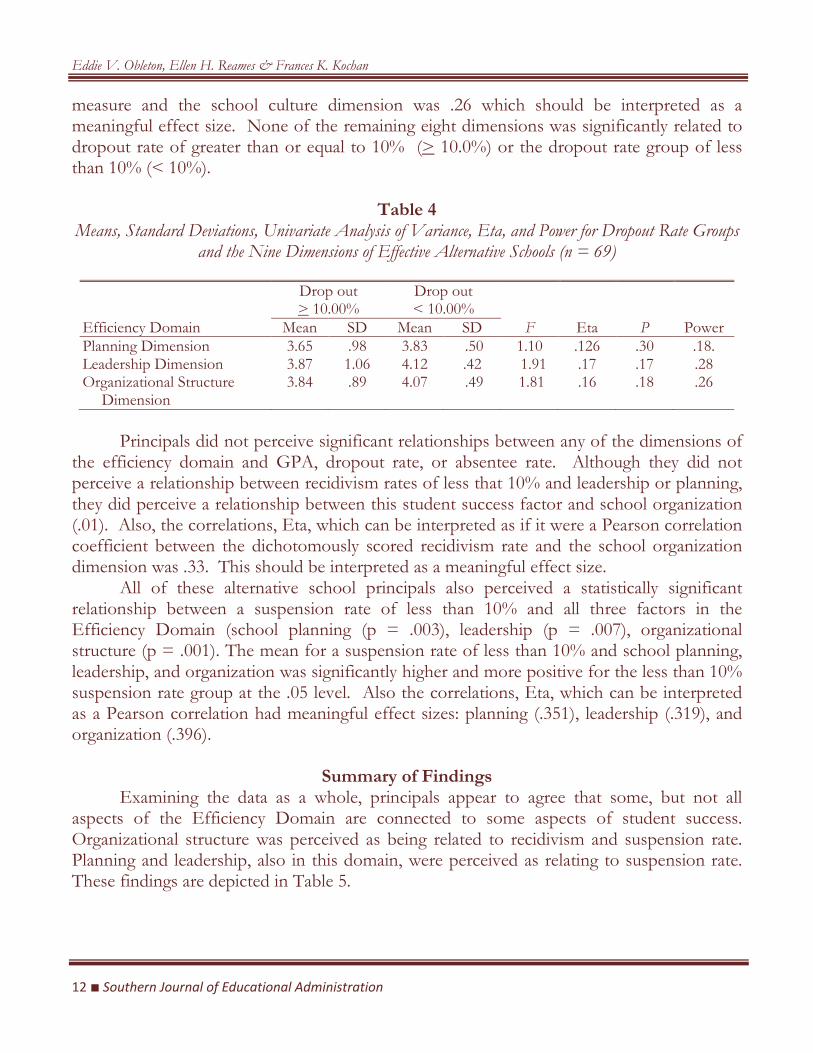
Means, standard deviations, and results of the univariate analysis of variance test of the differences on the nine dimensions between the groups (n = 69) reporting student dropout rate greater than or equal to 10% (> 10.0%; n = 20) or less than 10% (< 10%; n = 49) are given in Table 4. Eta and power were also reported. Alternative school principals perceived a statistically significant relationship at the .05 level between student dropout rate less than 10% (< 10%) and the dimension of school culture (p = .03). The mean for student dropout rate and school culture related indicators was significantly higher and more positive for the student dropout rate of less than 10% than the greater than or equal to 10% (> 10.0%; n = 20) dropout rate. Also the correlations Eta, which can be interpreted as if it were a Pearson correlation coefficient between the dichotomously scored dropout rate
Eddie V. Obleton, Ellen H. Reames & Frances K. Kochan
12 ■ Southern Journal of Educational Administration
measure and the school culture dimension was .26 which should be interpreted as a meaningful effect size. None of the remaining eight dimensions was significantly related to dropout rate of greater than or equal to 10% (> 10.0%) or the dropout rate group of less than 10% (< 10%).
Table 4 Means, Standard Deviations, Univariate Analysis of Variance, Eta, and Power for Dropout Rate Groups
and the Nine Dimensions of Effective Alternative Schools (n = 69)
Drop out > 10.00%
Drop out < 10.00%
Efficiency Domain Mean SD Mean SD F Eta P Power Planning Dimension 3.65 .98 3.83 .50 1.10 .126 .30 .18. Leadership Dimension 3.87 1.06 4.12 .42 1.91 .17 .17 .28 Organizational Structure
Dimension 3.84 .89 4.07 .49 1.81 .16 .18 .26
Principals did not perceive significant relationships between any of the dimensions of
the efficiency domain and GPA, dropout rate, or absentee rate. Although they did not perceive a relationship between recidivism rates of less that 10% and leadership or planning, they did perceive a relationship between this student success factor and school organization (.01). Also, the correlations, Eta, which can be interpreted as if it were a Pearson correlation coefficient between the dichotomously scored recidivism rate and the school organization dimension was .33. This should be interpreted as a meaningful effect size. All of these alternative school principals also perceived a statistically significant relationship between a suspension rate of less than 10% and all three factors in the Efficiency Domain (school planning (p = .003), leadership (p = .007), organizational structure (p = .001). The mean for a suspension rate of less than 10% and school planning, leadership, and organization was significantly higher and more positive for the less than 10% suspension rate group at the .05 level. Also the correlations, Eta, which can be interpreted as a Pearson correlation had meaningful effect sizes: planning (.351), leadership (.319), and organization (.396).
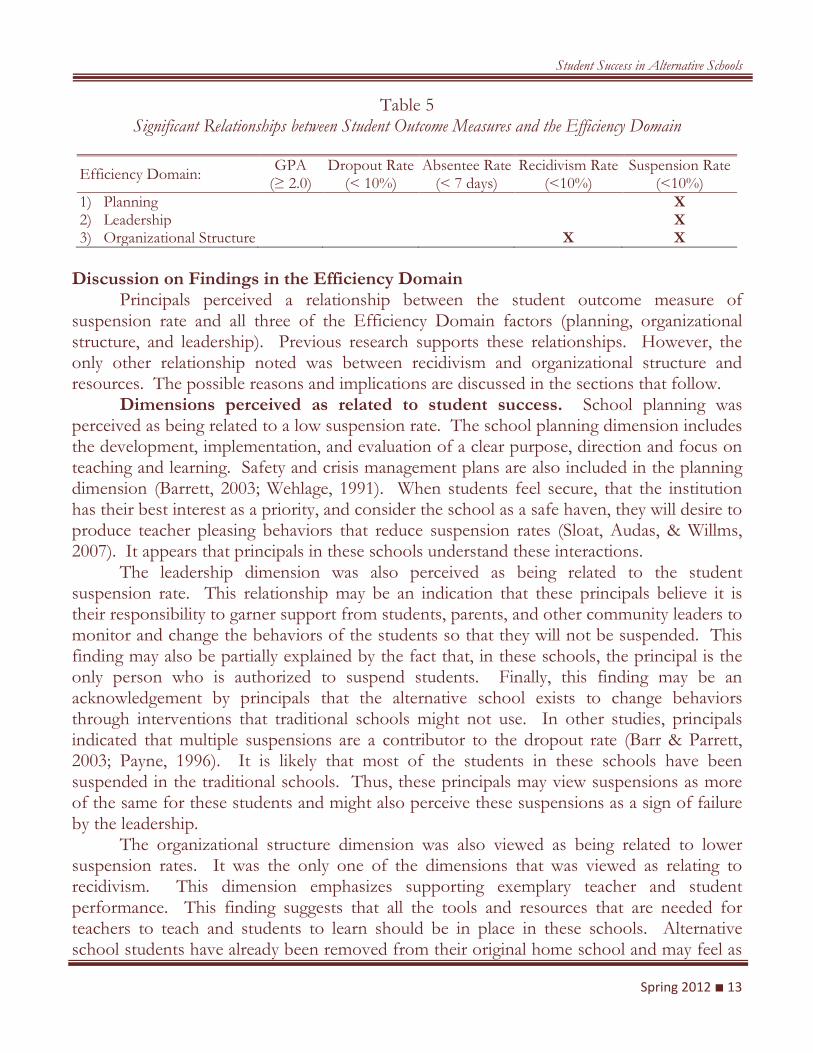
Summary of Findings Examining the data as a whole, principals appear to agree that some, but not all
aspects of the Efficiency Domain are connected to some aspects of student success. Organizational structure was perceived as being related to recidivism and suspension rate. Planning and leadership, also in this domain, were perceived as relating to suspension rate. These findings are depicted in Table 5.
Student Success in Alternative Schools
Spring 2012 ■ 13
Table 5 Significant Relationships between Student Outcome Measures and the Efficiency Domain
Efficiency Domain: GPA (≥ 2.0)
Dropout Rate (< 10%)
Absentee Rate (< 7 days)
Recidivism Rate (<10%)
Suspension Rate (<10%)
1) Planning X 2) Leadership X 3) Organizational Structure X X
Discussion on Findings in the Efficiency Domain Principals perceived a relationship between the student outcome measure of suspension rate and all three of the Efficiency Domain factors (planning, organizational structure, and leadership). Previous research supports these relationships. However, the only other relationship noted was between recidivism and organizational structure and resources. The possible reasons and implications are discussed in the sections that follow. Dimensions perceived as related to student success. School planning was perceived as being related to a low suspension rate. The school planning dimension includes the development, implementation, and evaluation of a clear purpose, direction and focus on teaching and learning. Safety and crisis management plans are also included in the planning dimension (Barrett, 2003; Wehlage, 1991). When students feel secure, that the institution has their best interest as a priority, and consider the school as a safe haven, they will desire to produce teacher pleasing behaviors that reduce suspension rates (Sloat, Audas, & Willms, 2007). It appears that principals in these schools understand these interactions.
The leadership dimension was also perceived as being related to the student suspension rate. This relationship may be an indication that these principals believe it is their responsibility to garner support from students, parents, and other community leaders to monitor and change the behaviors of the students so that they will not be suspended. This finding may also be partially explained by the fact that, in these schools, the principal is the only person who is authorized to suspend students. Finally, this finding may be an acknowledgement by principals that the alternative school exists to change behaviors through interventions that traditional schools might not use. In other studies, principals indicated that multiple suspensions are a contributor to the dropout rate (Barr & Parrett, 2003; Payne, 1996). It is likely that most of the students in these schools have been suspended in the traditional schools. Thus, these principals may view suspensions as more of the same for these students and might also perceive these suspensions as a sign of failure by the leadership.
The organizational structure dimension was also viewed as being related to lower suspension rates. It was the only one of the dimensions that was viewed as relating to recidivism. This dimension emphasizes supporting exemplary teacher and student performance. This finding suggests that all the tools and resources that are needed for teachers to teach and students to learn should be in place in these schools. Alternative school students have already been removed from their original home school and may feel as
Eddie V. Obleton, Ellen H. Reames & Frances K. Kochan
14 ■ Southern Journal of Educational Administration
though they do not matter. Teachers, too, may feel alienated if they did not choose to teach in an alternative school setting. This finding indicates that principals in this study understand that if students and teachers are shown that they are valued by being supplied with the necessary tools needed to succeed, they will be more likely to perform in an exemplary manner. Dimensions perceived as not related to student success. Since research indicates relationships between the dimensions of the Efficiency Domain and student GPA, absenteeism, drop-out rate, and recidivism, it is perplexing that the principals in this study did not perceive relationships between these student success factors and all but one of the dimensions of the Efficiency Domain. These findings may be related to the way in which these schools are structured. Students are in alternative schools for only a brief period of time. Principals may believe that this may limit their capacity to impact GPA. They may not view their planning efforts, leadership, or the organizational structure of the school or resources provided as being able to have a powerful enough impact on the students’ grades to be able to change their GPA. The lack of a perceived relationship between student absenteeism and dimensions of the Efficiency Domain is particularly problematic, because truancy has been found to be a great indicator of students becoming at-risk for dropping out of school (Walker, Ramsey & Gresham, 2004). We as a country have placed a great deal of emphasis on attendance by enacting mandatory attendance laws, hiring truant officers, and even denying credit to a student who does not meet the attendance requirement. Yet, these principals do not appear to view a relationship between this success element and the many factors inherent in the Efficiency Domain.
One possibility for this finding is that these principals may have come to the conclusion that they have minimum control over student attendance and can do little to change it within their environment. Some students enter the alternative school with poor attendance records that have already placed them in a loss of credit status. If students know that they have already lost credit, then there is no incentive for school attendance. However, if the alternative school is structured so that a student can take advantage of credit recovery opportunities, then the student might increase their attendance. The fact that principals do not view the ways in which they are structuring the organization of the school as having a relationship to students coming to school may indicate a lack of knowledge about this approach to teaching and learning.
Another reason for this finding may be that the court systems have become inundated with far more serious crimes than truancy, even when there is a strong truancy prevention program. Students and parents alike know that before some truancy cases reach court that school might be over for the year or the students’ age surpasses the mandatory school attendance age. Thus, principals may see this as a futile area in which to put their efforts when compared to other issues.
Finally, the advent of distance learning and the fact that some states are moving from a standard that measures daily attendance to one that measures hours or discounts

Student Success in Alternative Schools
Spring 2012 ■ 15
attendance altogether and the performance of the students is all that counts, these principals believe that attendance is not be as important as once thought (Kellogg & Politoski, 2002). If the student can master the curriculum by proving his/her mastery through assessments, then attendance may not be considered as very important.
These principals do not view elements in the leadership or planning dimensions as being related to students dropping out of school or recidivism. It is difficult to understand why principals would hold this view. Since a primary purpose of these schools is to prevent dropping out of school and since suspension seemed to be of importance, these findings are perhaps the most troubling. They may indicate a feeling of futility or a lack of control over school-based factors on the part of these leaders. These findings require further investigation.
Implications for Practice and Areas for Further Study The findings of this study have implications for the State of Georgia and for those interested in student success and in positively impacting students from dropping out of school throughout the nation. The findings also have implications for additional research which will aid in addressing these issues.
It appears that principals in this study placed limited emphasis upon their own leadership, the structure of their schools, and their planning processes in addressing student success factors. Focus groups, individual interviews and similar approaches may help to explain these findings. If further research supports the fact that principals do not believe that they can impact student learning through their leadership and the way in which they plan and structure the school and through the curriculum and assessment which occurs within the schools, this may result in a lack of attention to these factors, which could negatively affect student learning (Obleton, 2010). Professional development, mentoring, or coaching of principals may be helpful in this situation.
If the findings are more related to the way in which the schools are structured, which places students in the schools for a short period of time, structural adaptations may be required. These responses may be tied to bureaucratic elements, which are hindering these principals from having adequate control over dimensions in their schools, thus requiring some changes at the county or state levels.
It appears that it would be beneficial for those in other states to investigate this issue as well, particularly in institutions where students are in schools for short period of times. It is essential that those leading schools have the knowledge, power, and control they need to assure student success in schools (Fallon, 2004). This is particularly important in schools such as those in the study, which are designed to assist those who are not succeeding in the traditional school. Additional research on the degree to which these leaders perceive themselves as having such knowledge and control is essential in assuring that all students achieve success in school. Replication of the study nationally with Type II Alternative Schools would help determine if the findings are the same in the nation, in regions or in states.

Eddie V. Obleton, Ellen H. Reames & Frances K. Kochan
16 ■ Southern Journal of Educational Administration
Concluding Statement Principals in this study did not view many of the dimensions, which research indicates are important in student success, as having such a relationship. Whether these beliefs are indicative of principals in these types of schools throughout the region or nation is unknown. The study adds to our knowledge about principals’ beliefs about their ability to foster student success in Type II alternative schools. It is hoped that this study will foster additional research and help to enhance principal competence and student success in alternative school settings in Georgia, throughout the nation, and in other parts of the world where such schools are operating or where student failure is a reality. It is essential that we find avenues to foster student success for the good of our children, our future, and our world.
References Aron, L. (2006). An overview of alternative education. The Urban Institute, U.S. Department of Labor,
January, 2006. Retrieved from http://www.urban.org/publications/411283.html Barr, R. D., & Parrett, W. H. (2003). Saving our students, saving our schools. Thousand Oaks, CA: Corwin Press. Barr, R. D., & Parrett, W. H. (2001). Hope-filled for at-risk and violent youth. Boston: Allyn & Bacon. Cash, T. (2004). Alternative schooling. In J. Smink & F. P. Schargel (Eds.), Helping students graduate: Strategic
approach to dropout prevention. Larchmont, NY: Eye on Education. Castellano, M., Stringfield, S., & Stone, J. R. (2001). Career and technical education reforms and
comprehensive school reforms in high schools and community colleges: Their impact on educational outcomes for at-risk youth. St. Paul, MN: National Research Center for Career and Technical Education (ED 461 720). Retrieved from http://www.nccte.org/publications/ infosynthesis/r&dreport/ TE%20Rfrms_Stringfield.pdf
Council of Chief State School Officers. (1996). Interstate School Leaders Licensure Consortium standards for school leaders. Retrieved from http://wps.ablongman.com/ab_bacon_edadmin_1/ 0,6183,462533-,00.html
Cozzorelli, C. (2004). Social science data on the impact of marriage and divorce on children. Washington, DC: Children’s Defense Fund. Retrieved from: http://www.childrensdefense.org/site/DocServer/ testimony_on_marriage_initiatives.pdf?docID=936
Cox, K. (2008). Alternative education subcommitte report. Georgia Department of Education. Retrieved from http://public.doe.k12.ga.us/ci_iap_magnet.aspx?PageReq= CIMAESubcommittee
DeBlois, R. (2000). The need for more alternative schools. Education Week on the Web, 19, 24(February 23, 2000), 40, 45.
DuFour, R., & Eaker, R. (1998). Professional learning communities at work: Best practices for enhancing student achievement. Alexandria, VA: Association for Supervision and Curriculum Development.
Gregg, S. (1999). Creating effective alternative schools for disruptive students. The Clearing House, 73(2), 107–113.
Hord, S. (1997). Professional learning communities: Communities of continuous inquiry and improvement. Austin, TX: Southwest Educational Development Laboratory. Retrieved from http://www.sedl.org/pubs/change34/2.html
Karlin, S., & Harnish, D. (1995). An evaluation assessment of the CrossRoads alternative schools in Georgia. Georgia: Georgia Department of Education Office of Research Evaluation and Assessment, University of Georgia College of Education. (ERIC Document Reproduction Service No. ED 393 239)
Student Success in Alternative Schools
Spring 2012 ■ 17
Katsiyannis, A., & Williams, B. (1998). A natural survey of state initiatives on alternative education. Remedial and Special Education, 19(5), 276–284.
Kochan, F. (1999). School as family: A voyage of the soul. In C. Mullen & D. Lick (Eds.), New directions in mentoring: Creating a culture of synergy (pp. 213–226). London: Falmer Press.
Kochhar-Bryant, C., & Lacey, R. (2005). Alternative education as a quality choice for youth: Preparing educators for effective programs. Washington, DC: George Washington University, Hamilton Fish Institute on School and Community Violence.
Koetke, C. (1999). One size doesn’t fit all. Technos Quarterly, 8(2), 20–26. Lange, C. M., & Sletten, S. J. (2002). Alternative education: A brief history and research synthesis. Alexandria, VA:
Project Forum, National Association of State Directors of Special Education. (ERIC Document Reproduction Service No. ED 462 809)
Lehr, C. A., Moreau, R. A., Lange, C. M., & Lanners, E. J. (2004). Alternative schools: Findings from a national survey of the states (Research Report 2). Minneapolis, MN: University of Minnesota, College of Education and Human Development.
Leone, P., & Drakeford, W. (1999). Alternative education: From last chance to a proactive model. The Clearing House, 73(2), 86–89.
Morley, R. E. (1991). Alternative education. Dropout prevention reports. Clemson, SC: National Dropout Prevention Center.
Obleton, E. V., & Kochan, F. K. (2010). A study of the relationship between indicators of Georgia alternative school effectiveness and measures of student success as perceived by alternative school administrators. Dissertation Abstracts International, DAI-A 71/08. (UMI No. 3416090)
Payne, R. (1996). A framework for understanding poverty. Highlands, TX: aha! Process, Inc. Poyrazli, S., Ferrer-Wreder, L., Meister, D. G., Forthun, L., Coatsworth, J., & Grahame, K. (2008).
Academic achievement, employment, age, and gender and students’ experience of alternative school. Adolescence, 43(171), 547–556.
Raywid, M. A. (1999). Current literature on small schools. Charleston, WV: ERIC Clearinghouse on Rural Education and Small Schools. (ERIC Document Reproduction Service No. ED 425 049) Retrieved from www.ed.gov/database/ERIC_Digests/ed425049.html
Raywid, M. A. (1994). Alternative schools: The state of the art. Educational Leadership, 52(1), 26–31. Schargel, F. P., & Swarts, L. (2001). Strategies to help solve our school dropout problem. Larchmont, NY: Eye on
Education. Schorr, L. B. (1997). Common purpose: Strengthening families and neighborhoods to rebuild America. New York, NY:
Anchor Books. Secada, W. G. (1999). Lessons learned by the Hispanic dropout project. Clearing House, 73(2), 93–95. Sloat, E. A., Audas, R. P., & Willms, J. D. (2007). Evaluating programs for at-risk adolescents: Toward an
outcome-based assessment framework. Journal of Education for Students Placed at Risk, 12(4), 459–476. Smink, J., & Schargel, F. P. (2004). Helping students graduate: A strategic approach to dropout prevention. Larchmont,
NY: Eye on Education. Swarts, L. (2004). Alternative education accountability: Kentucky’s approach. Impact, pp. 20–21.
Minneapolis: University of Minnesota, College of Education and Human Development. Retrieved from http://ici.umn.edu/products/impact/163/prof5.html
Swarts, L. (2003). Alternative education accountability: Evaluating staff improvement needs and school/program performance. Louisville, KY: Sapphire Publishing.
Swarts, L. (2002). An investigation of alternative education programs in Kentucky. Unpublished manuscript. Thorndike, R. (2005). Concepts of culture-fairness. Journal of Educational Measurement, 8(2), 63–70. Thorndike, R. (1997). Measurement and evaluation in psychology and education. New Jersey: Merrill. Tobin, T., & Sprague, J. (2000). Alternative education strategies: Reducing violence in school and
community. Journal of Emotional and Behavioral Disorders, 8(3), 177–186.
Eddie V. Obleton, Ellen H. Reames & Frances K. Kochan
18 ■ Southern Journal of Educational Administration
Walker, R., & Gresham, F. (2004). Antisocial behavior in school: Strategies and best practices (2nd ed.). Pacific Grove, CA: Brooks/Cole.
Wehlage, G. G. (1991). School reform for at-risk students. Equity and Excellence, 25, 15–24. Wehlage, G. G., Rutter, R. A., & Turnbaugh, A. (1986). Evaluation of a model program for at-risk students.
Madison, WI: National Center on Effective Secondary Schools. Young, T. (1990). Public alternative education. New York, NY: Teachers College Press. Zweig, J. (2003). Vulnerable youth: Identifying their need for alternative educational settings. Washington, DC: The
Urban Institute, Charles Stewart Mott Foundation.
Spring 2012 ■ 19
Educational Accountability: The Role of Efficiency, Effectiveness and Productivity
Tak C. Chan Mindy Crain-Dorough Kennesaw State University Southeastern Louisiana University
Michael D. Richardson Southeastern Louisiana University
Abstract Efficiency and effectiveness are often misused and misunderstood in educational accountability and by the persons who are being held accountable for educational productivity. Defining the measurable product of education has been a longstanding challenge. Accountability gives an educational institution the evidence it needs to enhance productivity. The key concept is determining how to measure productivity in service organizations like schools and colleges. What are the criteria for measurement that will satisfy policymakers, politicians, parents and educators?
Introduction The United States educational system has struggled for years with limited approaches to accountability. Federal supports for education have been funded through the award of grants the acceptance of which is a commitment to the set conditions of accountability. What it means is that when federal funding is not involved, the standard of accountability is limited. In the case of the unfunded mandate of No Child Left Behind Act, the role of educational leadership and accountability is confusingly shifted from the Federal to the states with multiple standards. The concept of educational accountability is not new. Some have even advocated eliminating education because it is “inherently unmanageable and incapable of performance” (Drucker, 1974, p. 134). However, this is no valid evidence that modern American society wants to eliminate education. Rather, what society demands is a more manageable institution. In fact, many who advocate the most for reforming education are the people who want more and better education, not the elimination of the institution. Pfeffer (1998) declared “It is the job of management to lead a process in which these key success factors are understood, measurements for them developed, and then attention focused on those measures” (p. 38). Further, he stated that “measuring what really matters ... is critical” (p. 38). Drucker (1999) speculated that,
Fifty years hence we may well conclude that there was no ‘crisis of American education’ in the closing years of the twentieth century--there was only a growing incongruence between the way twentieth-century schools taught and the way late-twentieth-century children learned. (p. 51)

Tak C. Chan, Mindy Crain-Dorough & Michael D. Richardson
20 ■ Southern Journal of Educational Administration
America’s educational institutions have been subjected to externally driven demands for accountability that have not proven to be useful or beneficial (Ginsberg & Berry, 1998). Regardless of the ineffectiveness, numerous states, particularly those with popularly elected governors, have advocated strong external accountability without understanding the low organizational capacity of the educational institutions to deliver critical productivity (Baker & Richards, 2004). Anderson (1997) concluded that education was not productive because of the unwillingness to examine the unproductive or obsolete methods of managing the organization. He advocated for a more streamlined organization that would meet the challenges of the marketplace through increased accountability. As a result, the magnitude of the accountability movement indicates that the survival of public education may hinge on the ability of educators to demonstrate productivity and accountability in a chaotic marketplace (Fusarelli, 2001).
American education is currently enmeshed in an accountability quandary (Mai, 2004). The second wave of the accountability picture is slowly coming into focus. The initial wave examined the standards and outcomes of education (Ohanian, 1999). Although these have not been solved, the second wave is now evident. Whereas the first wave focused on outcomes, the second wave focused on the utilization of resources to meet the demands of the first wave (Guile, 2001).
Accountability Accountability has been a concern for educators for as long as schools have existed (Kirst, 1990). The globalization of the 21st century fuels the current interest in accountability because the future of America is tied inextricably to education (Tangen, 2005). Economic terms such as efficiency, effectiveness and accountability have been employed to define the tasks of second-wave reform. Efficiency is defined as short-term while effectiveness is more long-term; however, the long-range purpose of accountability is to enhance productivity (Rolle, 2004). A very basic definition of accountability is: a method for ensuring task completion in the correct manner (Diewert, 1992). In educational organizations this means that a person is held accountable for performing a certain task or tasks and for performing the tasks in a correct manner (Raywid, 2002). Therefore, educational accountability is two-fold: (1) task completion, and (2) the correctness with which the task was completed (Johnson, 2001). A second powerful application of accountability is comparing productivity across individuals, grade levels, schools and even competitors in private schools (Charlton, 2002). According to Bishop and Wobman (2004), the primary administrative job of the manager is to optimize the resources available to the organization. Therefore, accountability is necessary to measure quantitatively the investment in education because education is about the utilization of human resources (Diewert, 1992). In practical accountability measures, an output represents results. But are the results the correct results or even the intended results of the leader or the organization (Fusarelli, 2001)?

Educational Accountability
Spring 2012 ■ 21
Accountability measurement relies upon performance indicators that have an economic utility (Pritchard, 2002). They are created with a business bias and industry relevance, within a consumer discourse and ideology. The performance indicators force educators to define ourselves and to define quality of education in terms of business (efficiency, productivity, performativity) and in a standardized and quantifiable way (Propper & Wilson, 2003). Contemporary accountability is focused on measurement indicators - numerical measurements that are supposed to show ‘quality’. They are increasingly focused on outputs (rather than process) in order to facilitate comparisons. Quantitative measures force educators to emphasize sets of skills or knowledge, instead of focusing on the process of learning – the how and the why a student is learning (Walberg, 2006). For a person to be held accountable in an educational organization, three factors must be present (Sergiovanni, Kelleher, McCarthy & Wirt, 2004). First, the person must have a thorough and complete knowledge of the system. The person must be made aware of the tasks of the organization, the acceptability or correctness of the task, and responsibilities necessary to perform the tasks. Second, the person must have sufficient qualifications to handle the job. It is absurd to hold a paraprofessional accountable for student performance when they do not have the necessary qualifications or certifications for the task. That is not to say that a paraprofessional might not be a better teacher than the person holding the certification, but the organization cannot hold the person accountable for tasks that are outside their qualifications. Third, the person must have sufficient authority and autonomy to complete the tasks assigned. In today’s educational environment, more and more of the authority and autonomy are being removed from educators and placed in the hands of policymakers. However, to be effective the educator cannot delegate his/her responsibility for accountability to anyone else. This is a key point that most of the policymakers do not fully comprehend: accountability cannot be delegated (Kirst, 1990). Efficiency and Effectiveness Efficiency and effectiveness are terms that are used synonymously when they mean very different things in the application of educational accountability and by the persons who are being held accountable for educational productivity (Biesta, 2004). Educational efficiency and effectiveness must operate in tandem for today’s educational organizations to be successful (Waite, Boone & McGhee, 2001). Organizations can temporarily survive without perfect efficiency; they usually die if they are ineffective. Efficiency typically implies a short-term response to accountability, while effectiveness specifies a long-term reaction. Efficiency refers to the relationship between inputs and outputs (Simpkins, 1994). Are the outputs better or more marketable than the inputs? For educational organizations, the input is raw material (student) that comes to the school in a variety of shapes, sizes and colors. This disparity is quite evident between education and business (Proenza, 2010). Business can be selective in their choice of raw materials. The transformation of raw materials into a finished product is the process of adding value to the product. Only at the end of the process can efficiency be determined, and only when there is a measurable product (Evans &

Tak C. Chan, Mindy Crain-Dorough & Michael D. Richardson
22 ■ Southern Journal of Educational Administration
Lindsay, 2005). Multiple, shifting purposes and measuring difficulties make increasing school efficiency a difficult and grueling task. According to Kohn (2000), “It is easier to measure efficiency than effectiveness, easier to rate how well we’re doing something than to ask whether what we’re doing makes sense” (pp. 3–4). Drucker (1974) stated, “Efficiency is concerned with doing the right things. Effectiveness is doing things right” (p. 45). As reported by Sergiovanni, Kelleher, McCarthy and Wirt (2004),
“No market exists to determine effectiveness.... Measures of progress toward goals are difficult to devise.... Goals and objectives are often unclear and contradictory.... Resources are distributed on the basis of formula and other approximations of equity rather than on merit. (p. 139)
Educators and policy makers have difficulty defining educational accountability, particularly the second wave (Wilson, 2004).
Suboptimization Defining the measurable product of education has been a longstanding challenge. What is educations’ product? Student achievement? Some speculate that the only measure of performance is student achievement. But how is student achievement measured? Educators are forced to objectify, measure and quantify persons, programs and processes (Kohn, 2000). This discrepancy of quantity over quality creates an unhealthy ethos in the educational institution that threatens to destroy the very persons and programs that the efficiency is designed to measure (Berliner & Biddle, 1995). The threat of measuring and improving aspects of operation not essentially vital to overall organization productivity is called the threat of “suboptimization”—optimizing the performance of secondary, or even irrelevant, aspects of operation (Deem & Brehony, 2005). The sub-optimization threat is especially valid in today’s large and complex educational institutions where there are literally hundreds of units (Guile, 2001). Educators want to be accountable for what they do for children. Politicians, policymakers and business executives have complained for decades that schools are inefficient and should be run more like businesses (Mai, 2004). They complain about financial waste, poor performance indicators, limited marketability, lack of competition, and an ill-conceived vision of the future (Kohn, 2000). In the real world of the knowledge-based society, efficiency and effectiveness must lead to measurable productivity which is aimed at improving educational quality. Measuring quality is one of the most significant challenges that educational leaders encounter because it is essential to measure and manage quality to insure productivity (Stainer & Stainer, 2011). Productivity Accountability gives an educational institution the evidence it needs to make substantial changes to enhance productivity (Weimer & Vining, 2005). The key concept is

Educational Accountability
Spring 2012 ■ 23
determining how to measure productivity in service organizations like schools (Houston, 1999). Measuring intangible characteristics is difficult because they typically depend on “employee performance and behavior” (Evans & Lindsay, 2005, p. 60). Therefore, persons consistently rate or judge a service industry by the quality of the human contact. Again, there have been widespread debate and disagreement about the definitions of educational productivity measures. Are the measures taken from student performance? Are the measures taken from teacher evaluation systems, or administrator evaluation systems? Are the measures exclusively quantitative or qualitative? Who determines what is to be measured and why whom? What are the criteria for measurement that will satisfy policymakers, politicians, parents and educators (Grosjean, Atkinson-Grosjean, Rubenson & Fisher, 2000)? Pfeffer (1998) reported that “wise leaders use measures not only to focus attention but also to drive change and continuous improvement” because “what gets measured gets done” (p. 39).
According to Goodlad (1979), “My major objection to accountability based only on outcome measures of behaviorally defined competencies and proficiencies is that it takes one’s attention away from all those qualitative elements inherent in the educational process” (p. 313). Accountability can be measured in several ways. First, the manager can make a personal inspection of the product. For years in education, teachers and administrators have been evaluated based upon their performance.
Second, the persons in the organization can evaluate the product. Historically, educators have assigned grades and made decisions about the performance of students. Third, an independent arbitrator can evaluate the product. Very few educational programs or processes have been externally evaluated for either efficiency or effectiveness. Fourth, some measuring device can determine evaluation. Based upon an initial review, this technique probably has the most potential for addressing the second wave of accountability. However, the question remains, what is the appropriate measuring device to be used (Sahay, 2005)? Politics Since every state is a different educational system, the federal government has tried repeatedly to influence education at the state and local levels for the expressed purpose of holding them accountable for performance and productivity (Raywid, 2002). In most accountability systems, rules and regulations are handed down from the state or federal level (Johnson, 2001). These rules and regulations have little to do with the outcomes of education, but rather, specify schooling inputs such as school calendar, textbooks, graduation requirements or other bureaucratic practices (Simpkins, 1994). Such inputs have little to do with the real world (reality) in educational institutions. In their haste to become more accountable, educational administrators must not lose sight of the capacity of the school to deal with accountability issues (Subotnik & Walberg, 2006). Change is difficult and often produces results that are not intended (Piccolo & Colquitt, 2006). Organizational capacity to meet accountability demands must be examined
Tak C. Chan, Mindy Crain-Dorough & Michael D. Richardson
24 ■ Southern Journal of Educational Administration
in light of the demands on all school employees (Newman, King & Ridgon, 1997). Consequently, educational leaders need to understand accountability, know their organizational capacity and be able to clearly articulate the role accountability plays in their organization. Accountability is here to stay, but it must be understood in relation to contextual reality of schools and colleges and not just in the abstract thinking of theorists and politicians (Burch, 2007). The primary issue in educational accountability is not the responsiveness of educators to be accountable; rather, the issue is how to measure the products of the educational process (Phelps, 2008). Most of these measurement mechanisms include the use of performance indicators in some shape or form (Monk, Walberg & Wang, 2001). They are imbued with a consumer ideology that encourages the view of education as a commodity (Duyan, McNeal & Kara, 2006). Educational Process Educators and others have searched for years for the technique or method that would accurately and fairly measure educational productivity. However, before the outcomes can be measured, they must be defined (Newman, King & Ridgon, 1997). General Motors must determine the tolerances in a motor before it can pass inspection and be placed in a new car. If the tolerances are too great, the part is returned as defective to be reprocessed (Gronroos & Ojasalo, 2004). However, children cannot be reprocessed. What comes through the door of the public school must be dealt with regardless of standards or tolerances. The American educational system educates, or attempts to educate, every child in the country (Elmore, 2000). In the above model, is the child an “input” or an “outcome?”
Conclusions Many teachers and administrators are focusing their instructional efforts on making sure that students adequately perform on standardized tests, rather than learning concepts and skills. The difficulty with educational accountability is the “weak technical core” of education. The speculation is that, because education has no universal definition of “good teaching”, there is great pressure to be held accountable with little information about the nature of the accountability standard due to the “weak technical core.” However, some recent researchers have speculated on the concept of value-added as the answer to accountability. Many would speculate that the public acceptance of accountability is fundamentally based upon the satisfaction of the public’s perception of legitimacy. Are the basic concepts of accountability, efficiency and effectiveness accepted as appropriate, applicable and legitimate for public education? Measuring the quality and productivity in schools is more difficult than in business organizations due to the multiple, ambiguous, and frequently changing educational goals advocated by politicians and by society. Over the past decade there has been a progressive decline in federal and state funding coupled with a dramatic increase in demands for accountability and student achievement. Some see the limits on spending as a means for controlling the public agenda and to drive change to make schools more efficient and effective. The shift in focus has led some to
Educational Accountability
Spring 2012 ■ 25
conclude that increasing efficiency simply means doing more with less. Finally, to create a more efficient organization will be far easier than creating an effective organization.
References Andersen, P. (1997). Organizational linkages: Understanding the productivity paradox. Administrative Science
Quarterly, 42, 595–597. Baker, B., & Richards, C. (2004). The ecology of educational systems: Data, models, and tools for improvisational leading
and learning. Englewood Cliffs, NJ: Prentice Hall. Berliner, D. C., & Biddle, J. B. (1995). The manufactured crisis: Myths, fraud and the attack on America’s public
schools. Reading, MA: Addison-Wesley. Biesta, G. J. J. (2004). Education, accountability, and the ethical demand: Can the democratic potential of
accountability be regained? Educational Theory, 54(3), 233–250. Bishop, J. H., & Wobmann, L. (2004). Institutional effects in a simple model of educational production.
Education Economics, 12(1), 17–38. Burch, P. (2007). Educational policy and practice from the perspective of institutional theory: Crafting a
wider lens. Educational Researcher, 36, 84–95. Charlton, B. G. (2002). Audit, accountability, quality and all that: The growth of managerial technologies in
UK universities. In S. Prickett & P. Erskine-Hill (Eds.), Education! education! education! Managerial ethics and the law of unintended consequences (pp. 58–92). Exeter, England: Imprint Academic.
Deem, R., & Brehony, K. (2005). Management as ideology: The case of ‘new managerialism’ in higher education. Oxford Review of Education, 31(2) 217–235.
Diewert, W. E. (1992). The measurement of productivity. Bulletin of Economic Research, 44, 163–198. Drucker, P. F. (1974). Management: Tasks, responsibilities, practices. New York: Harper-Row. Drucker, P. F. (1999). Beyond the information revolution. The Atlantic Monthly, 284(4), 47–57. Duyar, I., McNeal, L., & Kara, O. (2006). Accountability. In F. English (Ed.), Encyclopedia of educational
leadership and administration (pp. 807–809). Thousand Oaks, CA: Sage. Elmore, R. (2000). Building a new structure for school leadership. Washington, DC: The Albert Shanker Institute. Evans, J. R., & Lindsay, W. M. (2005). The management and control of quality (6th ed.). Mason, OH: South-
Western. Fusarelli, L. D. (2001). The political construction of accountability: When rhetoric meets reality. Education
and Urban Society, 33(2), 157–169. Ginsburg, R., & Berry, B. (2000). The capability for enhancing accountability. In R. J. S. Macpherson (Ed.),
The politics of accountability. Thousand Oaks, CA: Corwin Goodlad, J. L. (1979). An ecological version of accountability. Theory Into Practice, 18(5), 308–315. Grönroos, C., & Ojasalo, K. (2004). Service productivity: Towards a conceptualization of the
transformation of inputs into economic results in services. Journal of Business Research, 57(4), 414–423. Grosjean, G., Atkinson-Grosjean, J., Rubenson, K., & Fisher, D. (2000). Measuring the unmeasureable:
Paradoxes of accountability and the impacts of performance indicators on liberal education in Canada. Ottawa: CFHSS.
Guile, D. (2001). Education and the economy: Rethinking the question of learning for the ‘knowledge’ era. Futures, 33(6), 469–482.
Houston, P. D. (1999). Skeptical about our nation’s accountability agenda. School Administrator, 56(10), 54. Johnson, W. R. (2001). Meeting accountability or evading responsibility. Theory Into Practice, 18(5), 372–378. Kirst, M. (1990). Accountability: Implications for state and local policymakers. Washington, DC: U.S. Department of
Education, Office of Educational research and Improvement, Information Services. Kohn, A. (2000). The case against standardized testing. Portsmouth, NH: Heinemann.

Tak C. Chan, Mindy Crain-Dorough & Michael D. Richardson
26 ■ Southern Journal of Educational Administration
Mai, R. (2004). Leadership for school improvement: Cues from organizational learning and renewal efforts. The Educational Forum, 68(3), 211–221.
Monk, D.H., Walberg, H. J., & Wang, M. C. (2001). Research in educational productivity. Greenwich, CT: Information Age.
Newman, F. M., King, M. B., & Ridgon, M. (1997). Accountability and school performance—Implications from restructuring schools. Harvard Educational Review, 67(1), 41–74.
Ohanian, S. (1999). One size fits few: The folly of educational standards. Portsmouth, NH: Heinemann. Pfeffer, J. (1998). The real keys to high performance. Leader to Leader, 8, 31–43. Piccolo, R. F., & Colquitt, J. A. (2006). Transformational leadership and job behaviors: The mediating role
of core job characteristics. Academy of Management Journal, 49(2), 327–340. Pritchard, A. (2002). Measuring productivity change in the provision of public services. Economic Trends, 582,
20–32. Proenza, L. M. (2010). Relevance, connectivity, and productivity: Three paths to innovation in higher
education. Innovations, 5(2), 3–11. Propper, C., & Wilson, D. (2003). The use and usefulness of performance measures in the public sector.
Oxford Review of Economic Policy, 19, 250–267. Raywid, M. A. (2002). Accountability: What’s worth measuring? Phi Delta Kappan, 83(6), 433–437. Rolle, R. A. (2004). Out with the old–in with the new: Thoughts on the future of educational productivity
research. Peabody Journal of Education, 79(3), 31–56. Sahay, B. S. (2005). Multi-factor productivity measurement model for service organization, International
Journal of Productivity and Performance Measurement, 54(1), 7–22. Sergiovanni, T. J., Kelleher, P., McCarthy, M. M., & Wirt, F. M. (2004). Educational governance and
administration (5th ed.). Boston, MA: Allyn & Bacon. Simpkins, T. (1994). Efficiency, effectiveness, and the local management of schools. Journal of Education
Policy, 9(1), 15–33. Stainer, D. L. J., & Stainer, A. (2011). Productivity science and sustainability—A value-driven synthesis.
International Journal of Management and Decision Making, 11(3–4), 197–216. Subotnik, R. F., & Walberg, H. J. (Eds.). (2006). The scientific basis of educational productivity. Greenwich, CT:
Information Age. Tangen, S. (2005). Demystifying productivity and performance. International Journal of Productivity and
Performance Management, 54(1), 34–46. Waite, D., Boone, M., & McGhee, M. (2001). A critical sociocultural view of accountability. The Journal of
School Leadership, 11(3), 182–203. Walberg, H. J. (2006). Improving educational productivity: A review of extant research. In R. F. Subotnik &
H. J. Walberg (Eds.), The scientific basis of educational productivity (pp. 103–159). Greenwich, CT: Information Age.
Weimer, D. L., & Vining, A. R. (2005). Policy analysis: Concepts and practice. Upper Saddle River, NJ: Pearson. Wheatley, M, (1997). Goodbye, command and control. Leader to Leader, 5, 12–19. Wilson, D. (2004). Which ranking? The impact of a ‘value-added’ measure of secondary school
performance. Public Money and Management, 24, 37–45.

Spring 2012 ■ 27
Designing a Blended Specialist Program In Educational Leadership
Margaret Dalton Ruth Ann Roberts Southeast Missouri State University Southeast Missouri State University
Ray Dowdy Southeast Missouri State University
Eighty percent of universities in the United States offer blended learning as an option to students (Arabasz & Baker, 2003). In the university studied, the highly blended model of instruction was defined as courses that met face to face five times a semester while the rest of the instruction was conducted online. The faculty determined that some activities that had been conducted in the classroom could be conducted online equally as effectively. An instructional approach where both face to face learning and online learning are utilized can enhance the educational experience of the student.
When redesigning degree programs, the question must be asked what happens to teaching and learning? Does the candidate benefit from the new style of instruction? In 2009, one midwestern university implemented a redesigned specialist degree program in school administration focusing on blended and online instruction. In this case, the traditional face-to-face instruction was replaced with a blended style of instruction. The replacement model (Twigg, 2003) was used to develop a new style of instruction for the entire specialist degree program. The new style called for meeting face to face five times a semester and blended the remaining instruction with online activities.
The specialist degree in school administration is a 36 hour degree program that leads to the superintendent certificate. The traditional program consisted of six hours of electives, four hours of internship, six hours taught entirely online and 20 hours taught face to face. The blended program changed the electives to six hours of professional development, kept the four hours of internship, maintained the six hours of online coursework, added one hour of entirely online coursework, and changed 19 hours of coursework to blended instruction.
Review of Literature When face to face instruction is combined with online instruction, students feel more
connected and satisfied with the educational program (Conrad, 2005, p. 9). By creating two types of communities, students feel a great sense of belonging. In the virtual community, students are able to have the immediate or quick feedback through chat rooms or postings. However, also having that face to face interaction gives students that human interaction that cannot be replaced by technology particularly in an Educational Leadership program. Conrad (p. 9) also found that communication improved when both types of instruction occurred. It is important that students learn to communicate and interact on both levels.

Margaret Dalton, Ruth Ann Roberts & Ray Dowdy
28 ■ Southern Journal of Educational Administration
Blended learning is a good setting for personal reflection and collaboration that leads to a higher level of learning and allows students to construct higher order learning outcomes and understandings. Collaboration can lead to reflective thinking (Song, 2005) particularly when the professor provides direct instruction and helps students make the necessary connections. In blended instruction, both collaboration and reflection should be present. Students react to instructional differences in a variety of ways. Face-to-face instruction is perceived by students as more teacher driven while online instruction is viewed as more internally or student driven (Garrison, Cleveland-Innes, & Fung, 2004, p. 70). Students prefer the face to face classroom environment (Abrams, 2005). However, Abrams also found that students are more willing to criticize other students’ work online. The development of blended instruction should take into account students’ preferences for face to face instruction as well as the thoroughness of online expectations when designing blended instruction. Blended learning is wide spread among universities with both students and faculty reporting high levels of satisfaction (Albrecht, 2006; Vaughan & Garrison, 2006). Blended learning is helping universities and educational leadership departments rethink the best way to deliver programs. When redesigning educational leadership programs, student preferences need to be considered. Students want technology to help with convenience and connection issues but show very little preference for which technology (Kvavik & Caruso, 2005). Kvavik and Caruso also found that students fear that technology will interfere with the communication between faculty and student. The blended learning environment can help alleviate some of those fears. Even with the addition of technology to the learning environment, students still value the face to face communication with faculty and other students (Windham, 2005). How students are assessed is important in the blended model of instruction. Students learn what is measured. Therefore if you only test or assess surface knowledge, that is all that students will learn (Ramsden, 2003). In designing blended learning courses, the content of the course must get to the deeper learning through discussion, reflection and the internalization of materials. The professor needs to search for ways to effectively present the learning outcomes so that the students have the opportunity to engage in collaborative tasks that lead to higher order learning. The possibilities for positive learning outcomes in blended learning are endless. For example, some evidence demonstrates that brainstorming is more effective in an online situation than in a face to face classroom when seeking solutions to a problem (Rocco, 1996). Of course the strategy of brainstorming could be used in both settings. Many Educational Leadership departments around the country have explored ways to use technology to enhance programs and instructional delivery. At one midwestern university the Replacement Model was chosen to redesign its specialist in school administration program. The Replacement Model is defined as reduction in class meeting time with a “replacement” of interactive learning activities online (Twigg, 2003). The online activities can be conducted either individually or in small groups. One of the basic

Designing a Blended Specialist Program in Educational Leadership
Spring 2012 ■ 29
assumptions of the Replacement Model is that some learning objectives that were traditionally conducted in a face-to-face class can be better achieved in an online setting. Two approaches to this model give the Replacement Model flexibility. One approach replaces some classes with online instruction and keeps the face-to-face classes the same as before. The second approach replaces some classes with online instruction and significantly changes the approach to the face-to-face classes. The overall approach to instruction in the replacement model considers why and how often a class should meet. The Midwest University cited above chose to use the first method and kept face-to-face instruction for its undergraduate programs. Helping to guide instructional decisions and curriculum development, the Replacement Model adapts well to the course redesign principals. These five principles of redesign require that faculty: redesign the whole course; encourage active learning; provide students with individualized assistance; build in ongoing assessment and prompt (automated) feedback; ensure sufficient time on task and monitor student progress (The National Center for Academic Transformation, 2011). In redesigning the whole course, a course is improved by getting the commitment of the whole or several faculty members to develop stronger learning activities and outcomes. Thus, if each faulty member who teaches a course is involved in the redesign, then each candidate who takes the course will have a similar outcome. Encouraging active learning requires the use of interactive learning materials and requires a shift away from lecturing. Providing candidates with individualized assistance is a part of the educational system that will never go away. Human interaction will always be a need, a need that technology cannot replace. A system must be provided for superintendent candidates to get help from a person. The more ongoing assessment and prompt feedback a candidate can receive the better the candidate will learn. Ensuring sufficient time on task and monitoring student progress means that the courses are not self-paced. The courses require significant learning objectives be mastered before moving on to the next level. This paper will explore a blended model of instructional delivery and its effect on graduate student learning in the specialist program for school administration. A juxtaposition of blended learning against traditional course delivery provided the framework for the research implications.
Research Design and Methodology Data was collected for four years based on the eleven research questions. From the
Fall of 2007 to the Spring of 2009, the specialist program was taught in the traditional face-to-face method of instruction. From the Fall of 2009 to Spring 2011, the specialist program was taught using the blended model of instruction. Problem Statement
The focus of this research was to determine what effect the program redesign had on candidate learning. The specialist degree program had a long history of being a standards-
Margaret Dalton, Ruth Ann Roberts & Ray Dowdy
30 ■ Southern Journal of Educational Administration
based program and had assessments in place that could be used for comparisons to determine if learning increased, decreased, or stayed the same on specific assessments. Research Questions
1. Do candidates in a school administration specialist program taught through blended and online instruction score as well on Assessment 1 School Superintendent Assessment as candidates taught through face-to-face instruction?
2. Do candidates in a school administration specialist program taught through blended and online instruction score as well on Assessment 2 Comprehensive Exam as candidates taught through face-to-face instruction?
3. Do candidates in a school administration specialist program taught through blended instruction score as well on Assessment 3 School Improvement Plan EA 737 as candidates taught through face to face instruction?
4. Do candidates in a school administration specialist program taught through blended instruction score as well on Assessment 4 School Improvement Plan EA 710 as candidates taught through face to face instruction?
5. Do candidates in a school administration specialist program taught through blended instruction score as well on Assessment 5 Portfolio as candidates taught through face to face instruction?
6. Do candidates in a school administration specialist program taught through blended instruction score as well on Assessment 6 Internship as candidates taught through face to face instruction?
7. Do candidates in a school administration specialist program taught through blended instruction score as well on Assessment 7 Case Study EA 710 as candidates taught through face-to-face instruction?
8. Do candidates in a school administration specialist program taught through blended instruction score as well on Assessment 8 Case Study EA 755 as candidates taught through face-to-face instruction?
9. Do candidates in a school administration specialist program taught through blended instruction score as well on Assessment 9 Case Study EA 737 as candidates taught through face-to-face instruction?
10. Do candidates in a school administration specialist program taught through blended instruction score as well on Assessment 10 Simulation EA 785 as candidates taught through face-to-face instruction?
11. Do candidates in a school administration specialist program taught through blended instruction score as well on Assessment 11 Simulation EA 756 as candidates taught through face-to face instruction?
Research questions 1 and 2 focused on the program as a whole. Research questions 5 and 6 focus on applying information learned in all coursework in the internship experience. The remaining questions focus on data collected from assessments in blended courses. No
Designing a Blended Specialist Program in Educational Leadership
Spring 2012 ■ 31
data was collected from courses taught entirely online. The eleven assessments are described below. Assessments
Assessment 1, Table 1 is the School Superintendent Assessment (SSA). All candidates in the State are required to pass the SSA before a Superintendent certificate is issued. The SSA was developed by the Educational Testing Service and measures whether candidates have the standards-relevant knowledge necessary for competent professional practice. It is scored according to a standards rubric developed by the Educational Testing Service.
Assessment 2, Table 2 is the oral comprehensive exam taken at the end of the program by all candidates. The purpose of the comprehensive examination is to determine if the candidate learned content knowledge throughout the coursework and was able to reflect on the application of that knowledge in the field during the internship experience. The comprehensive examination is directly aligned with the ELCC standards.
Assessment 3, Table 3 is the portion of the school improvement plan completed in the course EA 737 Administration of Curriculum. Candidates complete a school improvement plan in two courses: EA 737 Administration of Curriculum and EA 710 School District Administration. Each part of the plan is assessed separately and focuses on different elements of effective school improvement. Assessment 3 is designed to provide the candidate with an opportunity to demonstrate the skills necessary to develop an improvement plan for the local school district that includes applying theory and research related to organizational and educational leadership while engaging in the collection, organization, and analysis of a variety of information, including student performance, data, required to assess progress toward the district’s vision, mission, and goals.
Assessment 4, Table 4 is the portion of the school improvement plan completed in the course EA 710 School District Administration. Assessment 4 was designed to provide an opportunity for the candidate to demonstrate the skills necessary to develop a school district improvement plan that will guide the District in developing, articulating, implementing, and carrying out a vision of learning that is required to support high levels of learning for all students. Assessment 5, Table 5 is the portfolio completed during the internship. The candidate’s professional portfolio is a collection of academic and internship accomplishments that documents the candidate’s management and leadership experiences. It is a collection of the candidate’s work that tells the story of the efforts, progress, and achievement for preparation to become a successful administrator. The purpose of the portfolio is to allow the candidate to demonstrate knowledge of coursework and skills required for an educational leader.
Assessment 6, Table 6 is the internship field supervisor evaluation. This assessment is designed to provide the candidate with an opportunity to implement the skills developed during coursework that will allow the candidate to act as a competent, reflective and caring
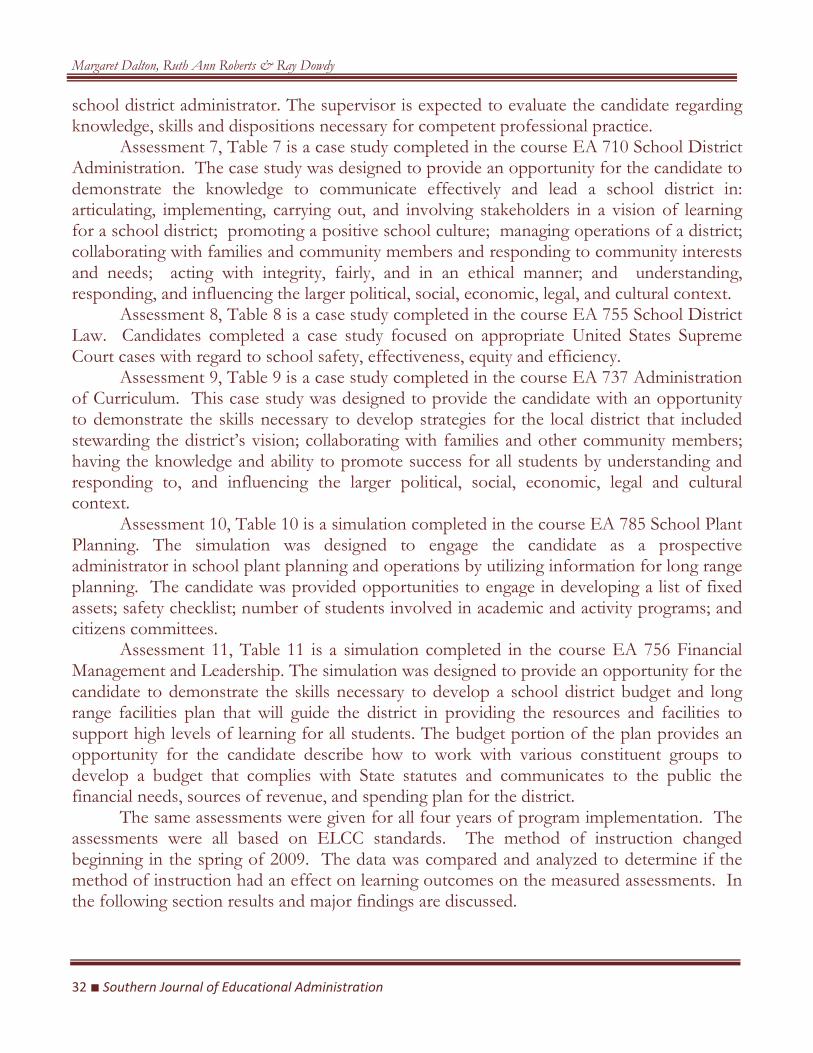
Margaret Dalton, Ruth Ann Roberts & Ray Dowdy
32 ■ Southern Journal of Educational Administration
school district administrator. The supervisor is expected to evaluate the candidate regarding knowledge, skills and dispositions necessary for competent professional practice. Assessment 7, Table 7 is a case study completed in the course EA 710 School District Administration. The case study was designed to provide an opportunity for the candidate to demonstrate the knowledge to communicate effectively and lead a school district in: articulating, implementing, carrying out, and involving stakeholders in a vision of learning for a school district; promoting a positive school culture; managing operations of a district; collaborating with families and community members and responding to community interests and needs; acting with integrity, fairly, and in an ethical manner; and understanding, responding, and influencing the larger political, social, economic, legal, and cultural context.
Assessment 8, Table 8 is a case study completed in the course EA 755 School District Law. Candidates completed a case study focused on appropriate United States Supreme Court cases with regard to school safety, effectiveness, equity and efficiency. Assessment 9, Table 9 is a case study completed in the course EA 737 Administration of Curriculum. This case study was designed to provide the candidate with an opportunity to demonstrate the skills necessary to develop strategies for the local district that included stewarding the district’s vision; collaborating with families and other community members; having the knowledge and ability to promote success for all students by understanding and responding to, and influencing the larger political, social, economic, legal and cultural context.
Assessment 10, Table 10 is a simulation completed in the course EA 785 School Plant Planning. The simulation was designed to engage the candidate as a prospective administrator in school plant planning and operations by utilizing information for long range planning. The candidate was provided opportunities to engage in developing a list of fixed assets; safety checklist; number of students involved in academic and activity programs; and citizens committees. Assessment 11, Table 11 is a simulation completed in the course EA 756 Financial Management and Leadership. The simulation was designed to provide an opportunity for the candidate to demonstrate the skills necessary to develop a school district budget and long range facilities plan that will guide the district in providing the resources and facilities to support high levels of learning for all students. The budget portion of the plan provides an opportunity for the candidate describe how to work with various constituent groups to develop a budget that complies with State statutes and communicates to the public the financial needs, sources of revenue, and spending plan for the district.
The same assessments were given for all four years of program implementation. The assessments were all based on ELCC standards. The method of instruction changed beginning in the spring of 2009. The data was compared and analyzed to determine if the method of instruction had an effect on learning outcomes on the measured assessments. In the following section results and major findings are discussed.
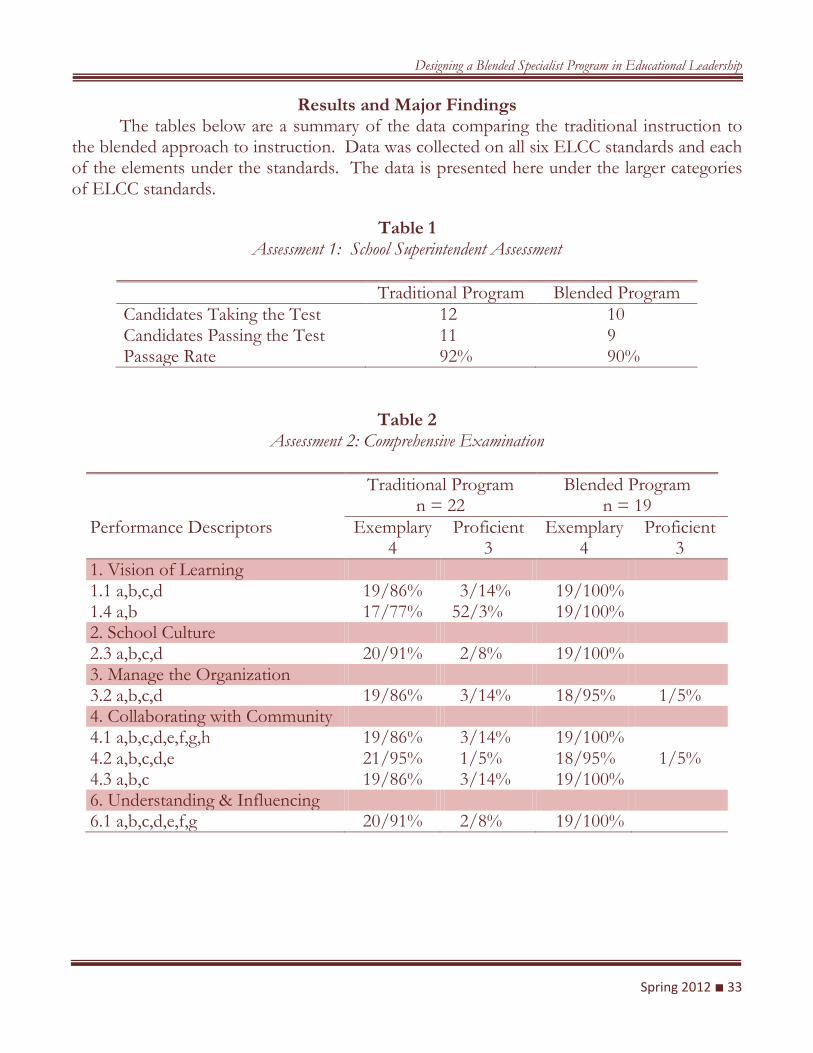
Designing a Blended Specialist Program in Educational Leadership
Spring 2012 ■ 33
Results and Major Findings The tables below are a summary of the data comparing the traditional instruction to
the blended approach to instruction. Data was collected on all six ELCC standards and each of the elements under the standards. The data is presented here under the larger categories of ELCC standards.
Table 1 Assessment 1: School Superintendent Assessment
Traditional Program Blended Program Candidates Taking the Test 12 10 Candidates Passing the Test 11 9 Passage Rate 92% 90%
Table 2 Assessment 2: Comprehensive Examination
Traditional Program
n = 22 Blended Program
n = 19 Performance Descriptors Exemplary
4 Proficient
3 Exemplary
4 Proficient
3 1. Vision of Learning 1.1 a,b,c,d 19/86% 3/14% 19/100% 1.4 a,b 17/77% 52/3% 19/100% 2. School Culture 2.3 a,b,c,d 20/91% 2/8% 19/100% 3. Manage the Organization 3.2 a,b,c,d 19/86% 3/14% 18/95% 1/5% 4. Collaborating with Community 4.1 a,b,c,d,e,f,g,h 19/86% 3/14% 19/100% 4.2 a,b,c,d,e 21/95% 1/5% 18/95% 1/5% 4.3 a,b,c 19/86% 3/14% 19/100% 6. Understanding & Influencing 6.1 a,b,c,d,e,f,g 20/91% 2/8% 19/100%
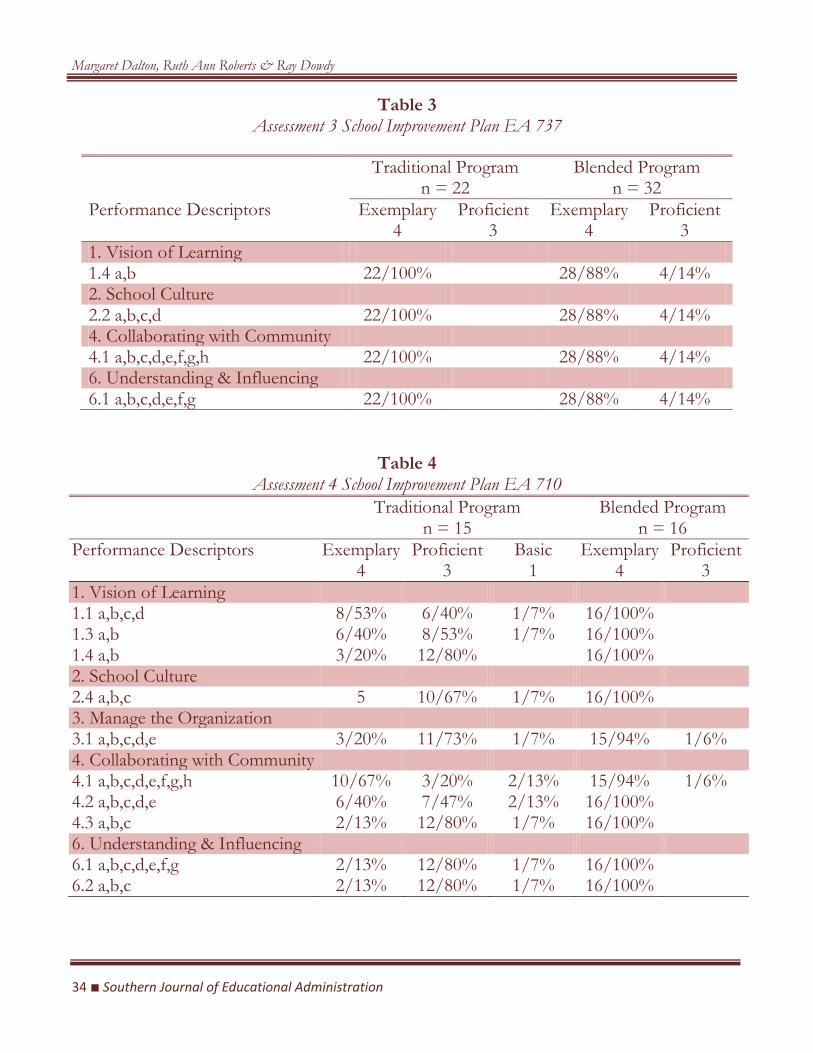
Margaret Dalton, Ruth Ann Roberts & Ray Dowdy
34 ■ Southern Journal of Educational Administration
Table 3 Assessment 3 School Improvement Plan EA 737
Traditional Program
n = 22 Blended Program
n = 32 Performance Descriptors Exemplary
4 Proficient
3 Exemplary
4 Proficient
3 1. Vision of Learning 1.4 a,b 22/100% 28/88% 4/14% 2. School Culture 2.2 a,b,c,d 22/100% 28/88% 4/14% 4. Collaborating with Community 4.1 a,b,c,d,e,f,g,h 22/100% 28/88% 4/14% 6. Understanding & Influencing 6.1 a,b,c,d,e,f,g 22/100% 28/88% 4/14%
Table 4 Assessment 4 School Improvement Plan EA 710
Traditional Program n = 15
Blended Program n = 16
Performance Descriptors Exemplary 4
Proficient 3
Basic 1
Exemplary 4
Proficient 3
1. Vision of Learning 1.1 a,b,c,d 8/53% 6/40% 1/7% 16/100% 1.3 a,b 6/40% 8/53% 1/7% 16/100% 1.4 a,b 3/20% 12/80% 16/100% 2. School Culture 2.4 a,b,c 5 10/67% 1/7% 16/100% 3. Manage the Organization 3.1 a,b,c,d,e 3/20% 11/73% 1/7% 15/94% 1/6% 4. Collaborating with Community 4.1 a,b,c,d,e,f,g,h 10/67% 3/20% 2/13% 15/94% 1/6% 4.2 a,b,c,d,e 6/40% 7/47% 2/13% 16/100% 4.3 a,b,c 2/13% 12/80% 1/7% 16/100% 6. Understanding & Influencing 6.1 a,b,c,d,e,f,g 2/13% 12/80% 1/7% 16/100% 6.2 a,b,c 2/13% 12/80% 1/7% 16/100%
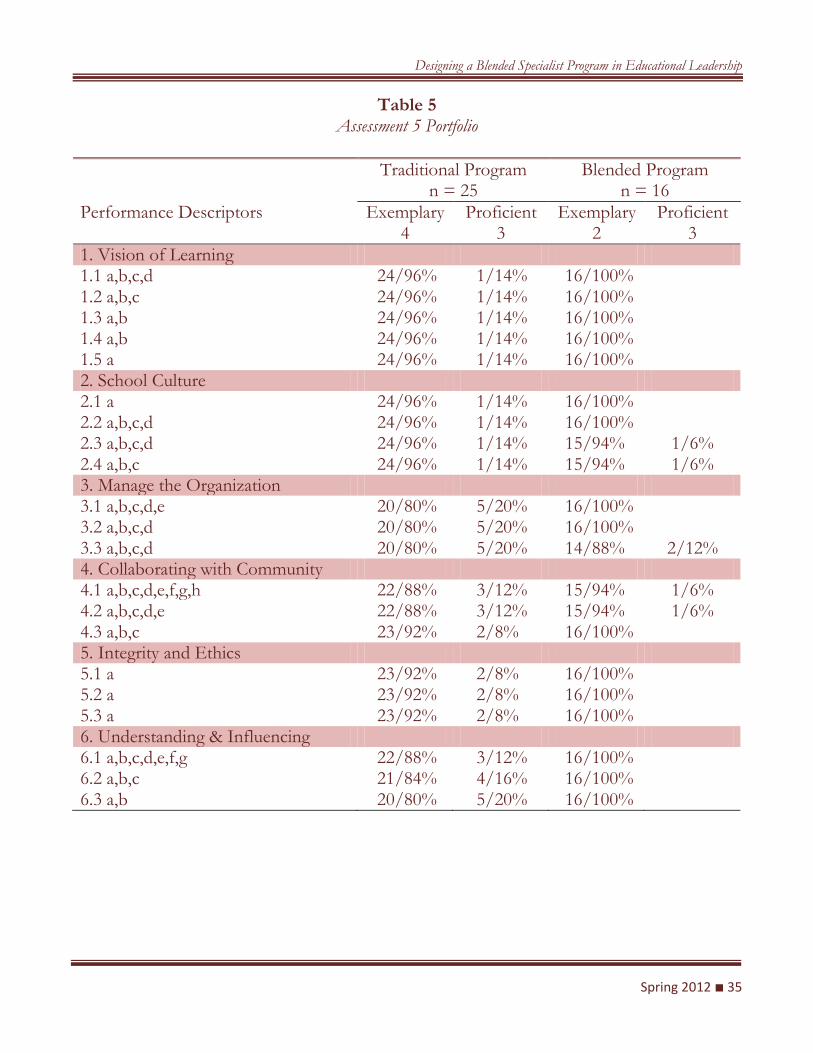
Designing a Blended Specialist Program in Educational Leadership
Spring 2012 ■ 35
Table 5 Assessment 5 Portfolio
Traditional Program
n = 25 Blended Program
n = 16 Performance Descriptors Exemplary
4 Proficient
3 Exemplary
2 Proficient
3 1. Vision of Learning 1.1 a,b,c,d 24/96% 1/14% 16/100% 1.2 a,b,c 24/96% 1/14% 16/100% 1.3 a,b 24/96% 1/14% 16/100% 1.4 a,b 24/96% 1/14% 16/100% 1.5 a 24/96% 1/14% 16/100% 2. School Culture 2.1 a 24/96% 1/14% 16/100% 2.2 a,b,c,d 24/96% 1/14% 16/100% 2.3 a,b,c,d 24/96% 1/14% 15/94% 1/6% 2.4 a,b,c 24/96% 1/14% 15/94% 1/6% 3. Manage the Organization 3.1 a,b,c,d,e 20/80% 5/20% 16/100% 3.2 a,b,c,d 20/80% 5/20% 16/100% 3.3 a,b,c,d 20/80% 5/20% 14/88% 2/12% 4. Collaborating with Community 4.1 a,b,c,d,e,f,g,h 22/88% 3/12% 15/94% 1/6% 4.2 a,b,c,d,e 22/88% 3/12% 15/94% 1/6% 4.3 a,b,c 23/92% 2/8% 16/100% 5. Integrity and Ethics 5.1 a 23/92% 2/8% 16/100% 5.2 a 23/92% 2/8% 16/100% 5.3 a 23/92% 2/8% 16/100% 6. Understanding & Influencing 6.1 a,b,c,d,e,f,g 22/88% 3/12% 16/100% 6.2 a,b,c 21/84% 4/16% 16/100% 6.3 a,b 20/80% 5/20% 16/100%

Margaret Dalton, Ruth Ann Roberts & Ray Dowdy
36 ■ Southern Journal of Educational Administration
Table 6 Assessment 6 Internship
Traditional Program
n = 12 Blended Program
n = 20 Performance Descriptors Exemplary
4 Proficient
3 Exemplary
4 Proficient
3 1. Vision of Learning 1.1 a,b,c,d 10/83% 2/17% 20/100% 1.2 a,b,c 10/83% 2/17% 20/100% 1.3 a,b 10/83% 2/17% 20/100% 1.4 a,b 11/92% 1/8% 20/100% 1.5 a 11/92% 1/8% 20/100% 2. School Culture 2.2 a,b,c,d 11/92% 1/8% 19/95% 1/5% 2.4 a,b,c 11/92% 1/8% 20/100% 3. Manage the Organization 3.1 a,b,c,d,e 10/83% 2/17% 19/95% 1/5% 3.3 a,b,c,d 11/92% 1/8% 19/95% 1/5% 4. Collaborating with Community 4.1 a,b,c,d,e,f,g,h 12/100% 20/100% 4.2 a,b,c,d,e 11/92% 1/8% 20/100% 5. Integrity and Ethics 5.1 a 10/83% 2/17% 20/100% 5.2 a 10/83% 2/17% 20/100% 5.3 a 10/83% 2/17% 20/100% 6. Understanding & Influencing 6.1 a,b,c,d,e,f,g 10/83% 2/17% 19/95% 1/5% 6.3 a,b 10/83% 2/17% 19/95% 1/5%
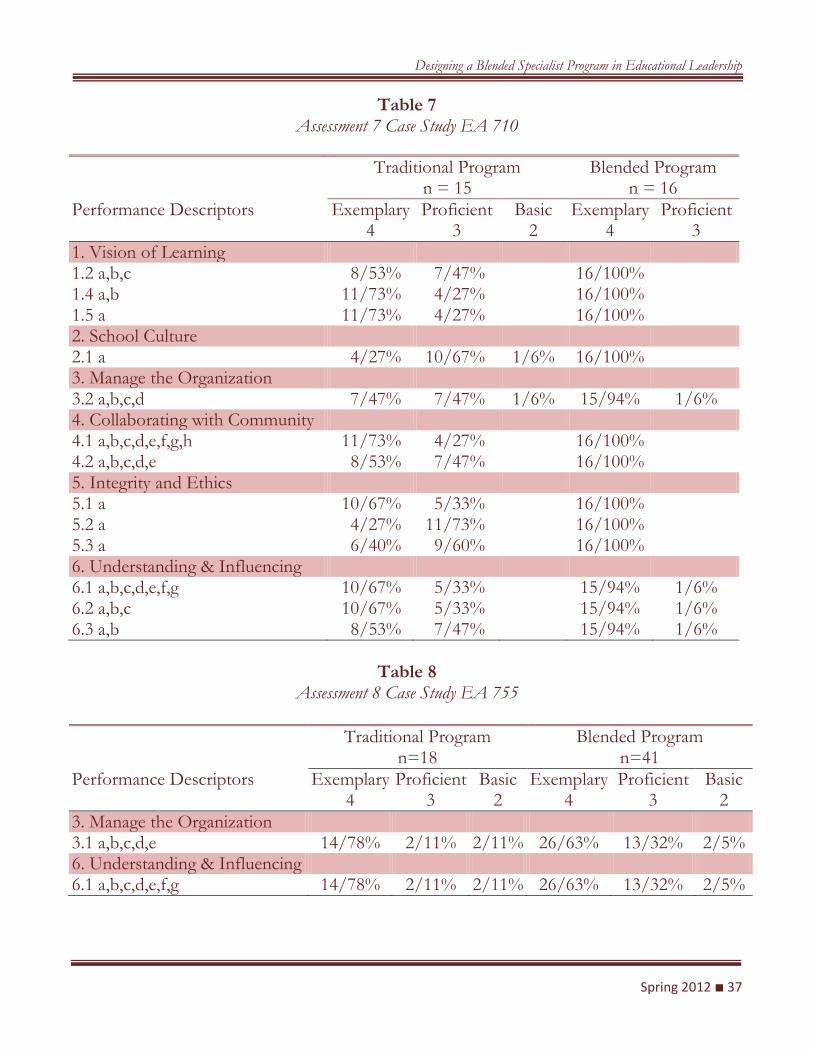
Designing a Blended Specialist Program in Educational Leadership
Spring 2012 ■ 37
Table 7 Assessment 7 Case Study EA 710
Traditional Program
n = 15 Blended Program
n = 16 Performance Descriptors Exemplary
4 Proficient
3 Basic
2 Exemplary
4 Proficient
3 1. Vision of Learning 1.2 a,b,c 8/53% 7/47% 16/100% 1.4 a,b 11/73% 4/27% 16/100% 1.5 a 11/73% 4/27% 16/100% 2. School Culture 2.1 a 4/27% 10/67% 1/6% 16/100% 3. Manage the Organization 3.2 a,b,c,d 7/47% 7/47% 1/6% 15/94% 1/6% 4. Collaborating with Community 4.1 a,b,c,d,e,f,g,h 11/73% 4/27% 16/100% 4.2 a,b,c,d,e 8/53% 7/47% 16/100% 5. Integrity and Ethics 5.1 a 10/67% 5/33% 16/100% 5.2 a 4/27% 11/73% 16/100% 5.3 a 6/40% 9/60% 16/100% 6. Understanding & Influencing 6.1 a,b,c,d,e,f,g 10/67% 5/33% 15/94% 1/6% 6.2 a,b,c 10/67% 5/33% 15/94% 1/6% 6.3 a,b 8/53% 7/47% 15/94% 1/6%
Table 8 Assessment 8 Case Study EA 755
Traditional Program
n=18 Blended Program
n=41 Performance Descriptors Exemplary
4 Proficient
3 Basic
2 Exemplary
4 Proficient
3 Basic
2 3. Manage the Organization 3.1 a,b,c,d,e 14/78% 2/11% 2/11% 26/63% 13/32% 2/5% 6. Understanding & Influencing 6.1 a,b,c,d,e,f,g 14/78% 2/11% 2/11% 26/63% 13/32% 2/5%
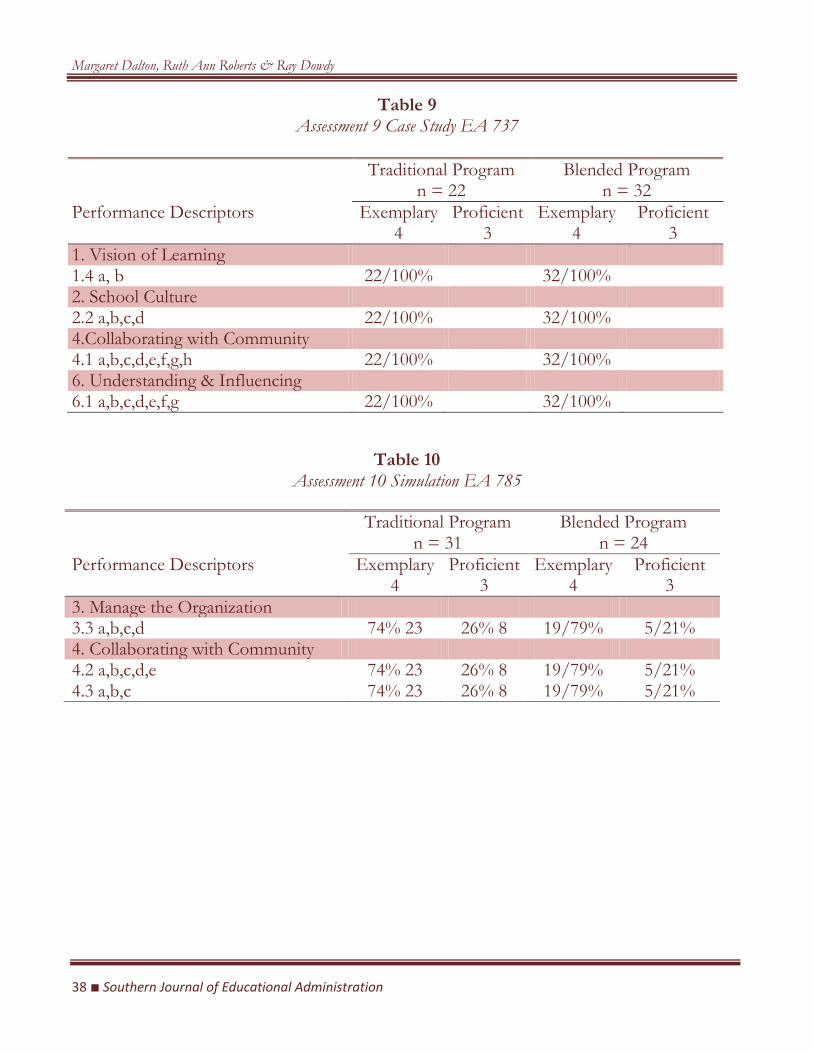
Margaret Dalton, Ruth Ann Roberts & Ray Dowdy
38 ■ Southern Journal of Educational Administration
Table 9 Assessment 9 Case Study EA 737
Traditional Program
n = 22 Blended Program
n = 32 Performance Descriptors Exemplary
4 Proficient
3 Exemplary
4 Proficient
3 1. Vision of Learning 1.4 a, b 22/100% 32/100% 2. School Culture 2.2 a,b,c,d 22/100% 32/100% 4.Collaborating with Community 4.1 a,b,c,d,e,f,g,h 22/100% 32/100% 6. Understanding & Influencing 6.1 a,b,c,d,e,f,g 22/100% 32/100%
Table 10 Assessment 10 Simulation EA 785
Traditional Program
n = 31 Blended Program
n = 24 Performance Descriptors Exemplary
4 Proficient
3 Exemplary
4 Proficient
3 3. Manage the Organization 3.3 a,b,c,d 74% 23 26% 8 19/79% 5/21% 4. Collaborating with Community 4.2 a,b,c,d,e 74% 23 26% 8 19/79% 5/21% 4.3 a,b,c 74% 23 26% 8 19/79% 5/21%

Designing a Blended Specialist Program in Educational Leadership
Spring 2012 ■ 39
Table 11 Assessment 11 Simulation EA 756
Traditional Program
n = 31 Blended Program
n = 7 Performance Descriptors Exemplary
4 Proficient
3 Exemplary
4 Proficient
3 2. School Culture 2.2 a,b,c,d 24/77% 7/23% 5/71% 2/29% 3. Manage the Organization 3.1 a,b,c,d,e 24/77% 7/23% 4/57% 3/43% 3.2 a,b,c,d 24/77% 7/23% 5/71% 2/29% 3.3 a,b,c,d 28/90% 3/10% 6/86% 1/14% 4. Collaborating with Community 4.2 a,b,c,d,e 24/77% 7/23% 4/57% 3/43% 4.3 a,b,c 21/68% 10/32% 4/57% 3/43% 6. Understanding & Influencing 6.1 a,b,c,d,e,f,g 25/81% 6/19% 3/43% 457%
Assessment 1 was the School Superintendent Assessment (SSA). The data showed 11 out of 12 candidates in the traditional program passed the test. Similarly, 9 out of 10 candidates in the blended program passed the test. The traditional program had a 92% passage rate while the blended program had a 90% passage rate. Both programs had a similar and acceptable passage rate on the SSA. Assessment 2 measured the ELCC standards Vision of Learning, School Culture, Manage the Organization, Collaborating with Community and Understanding and Influencing the Larger Context. The data from the comprehensive examination showed all 22 candidates in the traditional program scored in the exemplary or proficient range. Similarly, the 19 candidates in the blended program all scored in the exemplary or proficient range. On Assessment 2 the candidates in the blended program scored as well as or better than the candidates in the traditional program on all indicators. Assessment 3 measured the ELCC standards Vision of Learning, School Culture, Collaborating with Community and Understanding and Influencing the Larger Context. The data from the school improvement plan showed all 22 candidates in the traditional program scored in the exemplary or proficient range. Similarly, the 32 candidates in the blended program all scored in the exemplary or proficient range. On Assessment 3, 100% of the traditional candidates scored exemplary while only 88% of the candidates in the blended program scores exemplary. Assessment 4 measured the ELCC standards Vision of Learning, School Culture, Manage the Organization, Collaborating with Community and Understanding and Influencing the Larger Context. The data from the school improvement plan showed most

Margaret Dalton, Ruth Ann Roberts & Ray Dowdy
40 ■ Southern Journal of Educational Administration
of the 15 candidates in the traditional program scored in the exemplary or proficient range with one or two candidates scoring in the basic range on each indicator. The 16 candidates in the blended program all scored in the exemplary or proficient range. The candidates in the blended program scored significantly better on this part of the school improvement plan than the candidates in the traditional program. This is in contrast to Assessment 3 which is the other part of the School Improvement Plan. Assessment 5 measured the ELCC standards Vision of Learning, School Culture, Manage the Organization, Collaborating with Community and Understanding and Influencing the Larger Context. The data from the portfolio showed all 25 candidates in the traditional program scored in the exemplary or proficient range. Similarly, the 16 candidates in the blended program all scored in the exemplary or proficient range. On all but two indicators on School Culture, candidates in the blended program scored better than the traditional candidates. Assessment 6 measured the ELCC standards Vision of Learning, School Culture, Manage the Organization, Collaborating with Community, Integrity and Ethics and Understanding and Influencing the Larger Context. The data from the internship showed all 12 candidates in the traditional program scored in the exemplary or proficient range. Similarly, the 20 candidates in the blended program all scored in the exemplary or proficient range. The candidates in the blended program scored higher on all indicators than candidates in the traditional program. Assessment 7 measured the ELCC standards Vision of Learning, School Culture, Manage the Organization, Collaborating with Community, Integrity and Ethics and Understanding and Influencing the Larger Context. The data from the case study in EA 710 School District Administration showed most of the 12 candidates in the traditional program scored in the exemplary or proficient range with one candidate scoring in the basic range on the School Culture and Manage the Organization indicators. The 16 candidates in the blended program all scored in the exemplary or proficient range. The candidates in the blended program scored higher on all indicators than candidates in the traditional program.
Assessment 8 measured the ELCC Manage the Organization and Understanding and Influencing the Larger Context. The data from the case study in EA 755 School District Law showed most of the 18 candidates in the traditional program scored in the exemplary or proficient range with two candidates scoring in the basic range on both indicators. Most of the 41 candidates in the blended program scored in the exemplary or proficient range with two candidates scoring in the basic range on both indicators. More students in the traditional program scored in the exemplary range than in the blended program. When the exemplary and proficient categories are combined, the candidates in the blended program score 95% and the candidates in the traditional program score 89%. Candidates in the blended program scored at least as well as candidates in the traditional program. Assessment 9 measured the ELCC standards Vision of Learning, School Culture, Collaborating with Community, and Influencing the Larger Context. The data from the case study in EA 737 Administration of Curriculum showed all 22 candidates in the traditional
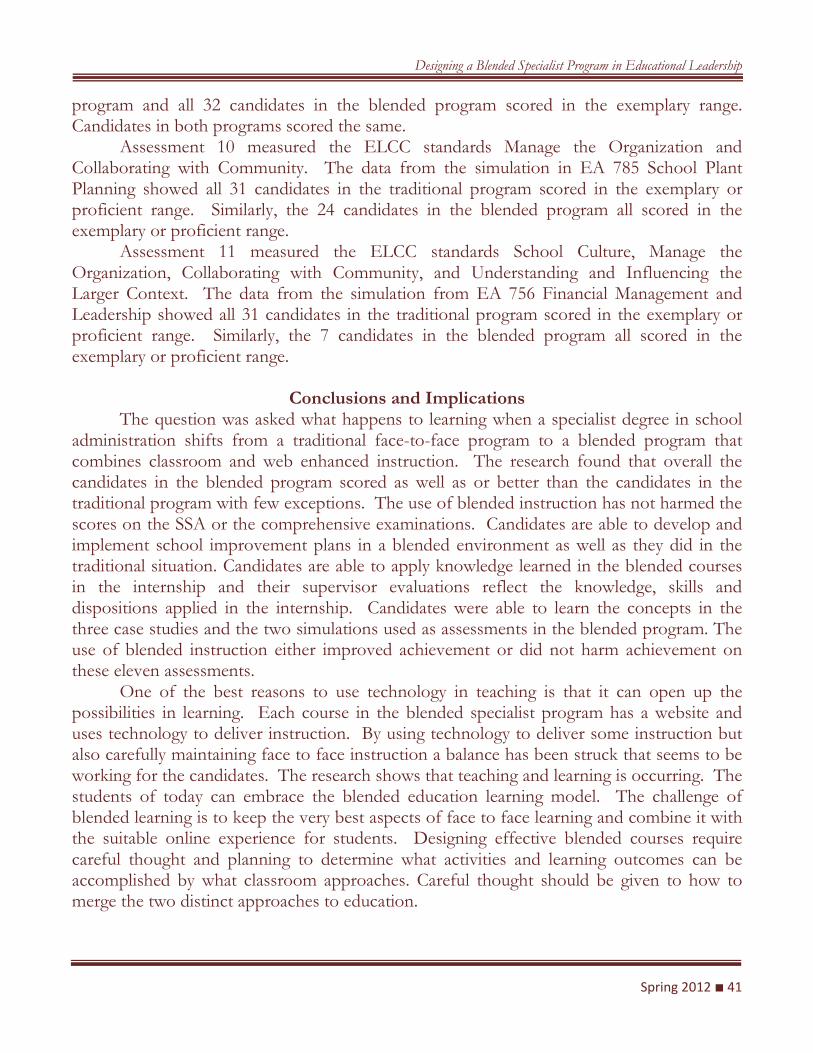
Designing a Blended Specialist Program in Educational Leadership
Spring 2012 ■ 41
program and all 32 candidates in the blended program scored in the exemplary range. Candidates in both programs scored the same. Assessment 10 measured the ELCC standards Manage the Organization and Collaborating with Community. The data from the simulation in EA 785 School Plant Planning showed all 31 candidates in the traditional program scored in the exemplary or proficient range. Similarly, the 24 candidates in the blended program all scored in the exemplary or proficient range. Assessment 11 measured the ELCC standards School Culture, Manage the Organization, Collaborating with Community, and Understanding and Influencing the Larger Context. The data from the simulation from EA 756 Financial Management and Leadership showed all 31 candidates in the traditional program scored in the exemplary or proficient range. Similarly, the 7 candidates in the blended program all scored in the exemplary or proficient range.
Conclusions and Implications The question was asked what happens to learning when a specialist degree in school
administration shifts from a traditional face-to-face program to a blended program that combines classroom and web enhanced instruction. The research found that overall the candidates in the blended program scored as well as or better than the candidates in the traditional program with few exceptions. The use of blended instruction has not harmed the scores on the SSA or the comprehensive examinations. Candidates are able to develop and implement school improvement plans in a blended environment as well as they did in the traditional situation. Candidates are able to apply knowledge learned in the blended courses in the internship and their supervisor evaluations reflect the knowledge, skills and dispositions applied in the internship. Candidates were able to learn the concepts in the three case studies and the two simulations used as assessments in the blended program. The use of blended instruction either improved achievement or did not harm achievement on these eleven assessments.
One of the best reasons to use technology in teaching is that it can open up the possibilities in learning. Each course in the blended specialist program has a website and uses technology to deliver instruction. By using technology to deliver some instruction but also carefully maintaining face to face instruction a balance has been struck that seems to be working for the candidates. The research shows that teaching and learning is occurring. The students of today can embrace the blended education learning model. The challenge of blended learning is to keep the very best aspects of face to face learning and combine it with the suitable online experience for students. Designing effective blended courses require careful thought and planning to determine what activities and learning outcomes can be accomplished by what classroom approaches. Careful thought should be given to how to merge the two distinct approaches to education.

Margaret Dalton, Ruth Ann Roberts & Ray Dowdy
42 ■ Southern Journal of Educational Administration
References Abrams, Z. (2005). ACMC, collaboration and the development of critical thinking in a graduate seminar in
applied linguistics. Canadian Journal of Learning Technology, 31(2), 23–47. Albrecht, B. (2006). Enriching student experience through blended learning. Research Bulletin,
12, EDUCAUSE Centre for Applied Research. Conrad, D. (2005). Building and maintaining community in cohort-based online learning. Journal of Distance
Education, 20(1), 1–20. Garrison, D. R., Cleveland-Innes, M., & Fung, T. (2004). Student role adjustment online communities of
inquiry: Model and instrument validation. Journal of Asynchronous Learning Networks, 8(2), 61–74. Kvavik, R. B., & Caruso, J. B. (2005). ECAR study of students and information technology, 2005:
Convenience, connection, control, and learning. Research Study from EDUCAUSE Centre for Applied Research.
National Policy Board (2002). Standard for advanced programs in educational leadership: For principals, superintendent, curriculum directors, and supervisors. Retrieved June 27, 2011 from
http://npbea.org/ELCC/ELCCStandards%20_5-02.pdfRamsden, P. (2003). Learning to teach in higher education (2nd ed.). London: Routledge. Rocco, E. (1996). Cooperative efforts in electronic contexts: The relevance of prior face-to-face interactions.
Computational and Mathematical Organization Theory Workshop, Washington, DC. Song, H. D., Koszalka, T. A., & Grabowski, B. L. (2005). Exploring instructional design factors prompting
reflective thinking in young adolescents. Canadian Journal of Learning and Technology, 34(4), 15–23. Twigg, C. A. (2003). Improving learning and reducing costs: New models for online learning. Educause
Review. Edited version retrieved March 27, 2011 from http://www.thencat.org/ Articles/NewModels.html
The National Center for Academic Transformation (2011). Five principles of successful course redesign. Retrieved March 27, 2011 from http://www.thencat.org/PlanRes/ R2R_PrinCR.htm
Windham, C. (2005). Father Google & mother IM: Confessions of a net gen learner. EDUCAUSE Review, 40(5), 42–58.