southern cone / andean ceo conference 8-9 may...
TRANSCRIPT

Ricardo ReyesFelipe Arancibia
BTG Pactual & CelfinSouthern Cone / Andean CEO Conference
8-9 May 2012, Santiago, Chile

Disclaimer
1
Statements made in this presentation that relate to CCU’s future
performance or financial results are forward-looking statements, which
involve uncertainties that could cause actual performance or results to
materially differ. We undertake no obligation to update any of these
statements. Listeners are cautioned not to place undue reliance on these
forward-looking statements. These statements should be taken in
conjunction with the additional information about risk and uncertainties set
forth in CCU’s annual report filed with the Chilean Superintendencia de
Valores y Seguros (SVS) and in CCU’s 20-F filled with the US Securities
and Exchange Commission (SEC).

III. Historical sources of growth 11
V. Summary 17
2
I. CCU Overview 3
IV. Targeted sources of growth 15
Agenda
II. CCU’s Recent Performance 8

3
Agenda
III. Historical sources of growth 11
V. Summary 17
I. CCU Overview 3
IV. Targeted sources of growth 15
II. CCU’s Recent Performance 8

(1) Information as of December 31, 2011
~ 18,390,000 Hlts
~ MMUSD 1,800 Net Sales
~ MMUSD 450 EBITDA
~ 5,700 full-time employees
I. CCU Overview
4
CCU is a diversified beverage company operating principally in Chile and Argentina(1):

Quiñenco S.A. Heineken
IRSA(2) ADRs Others50.0% 50.0%
66.1% 12.1% 21.8%
Wine(5)
VSPTBeer Chile(3)
CCU ChileArgentina(7)CCU Argentina
Non Alcoholic beverages(4)
ECCUSA
Spirits(6)
CPCHSnacks(8)
Foods
I. CCU OverviewOwnership structure(1)
5
100% 99.9% 50.01% 80% 100% 50%
(3) Additionally includes+50% stake of CCK and50% stake of Austral
(8) Does not consolidated.Includes 50% stake ofNutrabien.
(4) CCU has a 50.1%stake in Aguas CCU-Nestlé to develop thewaters business in Chileand a 50% JV inPromarca (Nectar andJuices)
(1) As of March 31, 2012. Number of shares: 318,502,872(2) IRSA owns directly 61.7% of CCU’s equity and 4.4% through a 99.9% owned vehicle
(7) On December 27, 2010acquired the control ofSaénz Briones and SidraLa Victoria.
(5) Consolidates SanPedro, Santa Helena,Altair, Tarapacá, Misionesde Rengo, Viñamar, CasaRivas, Valles de Chile andFinca La Celia (Argentina).
(6) On December 2011,CPCh aquired 49% ofCompañía PisqueraBauzá S.A.

% Revenues % EBITDA
32% 48%
20% 13%
26% 20%
14% 10%
5% 4%
2% 6%
100% 100%
% Volumes
Beer Chile 29%
Beer Argentina 24%
Non-Alcoholics 38%
Wine 7%
Spirits 1%
Other 1%
Total (1)(2) 100%
(1) Public information as of December 31, 2011(2) Figures may not add 100% due to rounding effects
Source: CCU, under IFRS
I. CCU OverviewContribution by segment
6

I. CCU OverviewWell positioned in a growing market
7
CCU’s weighted market share growth Industry growth (liters per capita)(1)
Source: (1) CCU final estimates for 2011, (2) AC Nielsen, (3) ““Asociación de viñas de Chile, AG” for Chilean export (excludes bulk wine and exports from Argentina)(4) Weighted average market share of all businesses in which CCU participates
2002 2011 D points 02-11
TOTAL CHILE 35.3% 37.8% 2.5Beer Chile (1) 88.7% 80.2% -8.5
Non-Alcoholics (2) 26.4% 29.4% 3.0
Domestic Wine (2) 17.3% 24.6% 7.3
Spirits (1) - 37.1% -
BEER ARGENTINA (1) 12.9% 22.9% 10.0WINE EXPORTS (3) 17.5% 12.1% -5.4
TOTAL CCU (4) 27.5% 31.1% 3.6
2002 2011 CAGR 02-11
TOTAL CHILE 159 222 3.8%Beer Chile 25 39 4.9%
Non-Alcoholics 114 165 4.2%
Domestic Wine 17 13 -2.5%
Spirits 3 4 4.8%
BEER ARGENTINA 33 44 3.5%

8
Agenda
III. Historical sources of growth 11
V. Summary 17
I. CCU Overview 3
IV. Targeted sources of growth 15
II. CCU’s Recent Performance 8

Volume growth(%) (1) 2009 Q1'10 Q2'10 Q3'10 Q4'10 2010 Q1'11 Q2'11 Q3'11 Q4'11 2011 Q1'12
Beer Chile -1.9 -7.7 10.3 6.8 1.6 1.5 9.6 -2.9 0.0 8.4 4.6 5.6
Beer Argentina 7.7 5.3 3.2 7.9 6.5 5.8 6.9 6.5 4.0 2.8 4.9 -2.2
Non-Alcoholics 3.8 9.8 9.9 13.2 7.4 9.8 3.7 4.9 7.2 8.2 6.1 18.6
Wines 20.1 27.6 24.8 -0.7 -6.0 9.3 -1.7 -6.5 1.0 10.9 0.6 5.8
Spirits -5.5 1.9 10.7 7.4 5.9 6.7 6.6 -2.5 5.5 19.4 7.5 25.4
TOTAL (3) 3.7 3.5 9.7 8.7 4.5 6.2 6.1 2.4 5.3 10.0 6.4 8.8
9
II. CCU’s Recent Performance Volume growth trend 2009-2012
(2)
(1) Compares quarter’s volumes with same quarter’s in prior year(2) Supply constraints due to Feb 27, 2010 earthquake(3) Total includes Cider business in Argentina

10
II. CCU’s Recent Performance CCU Latest Results
(1) “Normalized” refers to performance measures before Exceptional items. During 2011 CCU recorded as EI the settlement of the insurance claims for the earthquake (CLP MM 13,289) and the severance paid related to the cider business in Argentina (CLP MM 384). In 2010, the sale of a site in Lima generated a one-time profit of CLP 6,791 million.
(2) NFD: Net Financial Debt
CLP Billions 2011 2010 D% Q1'12 Q1'11 D%
Volumes (Th HL) 18,397 17,298 6.4% 5,408 4,970 8.8%
Net Sales 969.6 838.3 15.7% 281.5 242.3 16.2%
Gross Profit 519.0 454.4 14.2% 155.2 134.7 15.2%Gross margin (%) 53.5% 54.2% 55.1% 55.6%
Normalized EBIT (1) 177.9 155.3 14.6% 56.4 53.2 6.1%
Normalized EBIT margin (%) 18.3% 18.5% 20.1% 22.0%
Normalized Net Income 119.0 107.9 10.3% 40.2 37.5 7.4%
Normalized EBITDA 225.6 200.5 12.6% 69.3 64.7 7.0%
YoY growth (%) 12.6% 10.4% 7.0% 10.9%
Normalized EBITDA margin (%) 23.3% 23.9% 24.6% 26.7%
EBIT 190.8 162.0 17.7% 56.4 65.9 -14.3%
EBIT margin (%) 19.7% 19.3% 20.1% 27.2%
Net Income 122.8 110.7 10.9% 40.2 45.5 -11.6%
EBITDA 238.5 207.3 15.1% 69.3 77.4 -10.5%EBITDA margin (%) 24.6% 24.7% 24.6% 32.0%
NFD/EBITDA (2) 0.29 0.39 0.23

11
Agenda
III. Historical sources of growth 11
V. Summary 17
I. CCU Overview 3
IV. Targeted sources of growth 15
II. CCU’s Recent Performance 8

12
CCU has been growing consistently over the last 20 years
≈ 50% Organic growth
≈ 50% Non-organic(1) Under CHGAAP, figures in CLP Billions of December 1990(2) Under IFRS, figures in nominal CLP Billions. Before NRI is CLP225.6 Billions and CAGR is 12.3%
CCU has become a multicategory company
(4) Before Exceptional items is 49%/51%
III. Historical sources of growth
(3)
(3) Figures have been rounded and may not sum exactly the totals shown
(3)
EBITDA MIX 1990 2011 (4)
Beer Chile 89% 48%
Other segments 11% 52%
CCU 100% 100%
EBITDA CLP Billions 1990 (1) 2011 (2) CAGR
CCU 19,8 238,5 12,6%
EBITDA CLP Billions 1990 (1) 2011 (2) CAGRBeer Chile 17.5 115.6 9.4%
Other segments 2.2 123.0 21.1%
CCU (3) 19.8 238.5 12.6%
Balanced growth
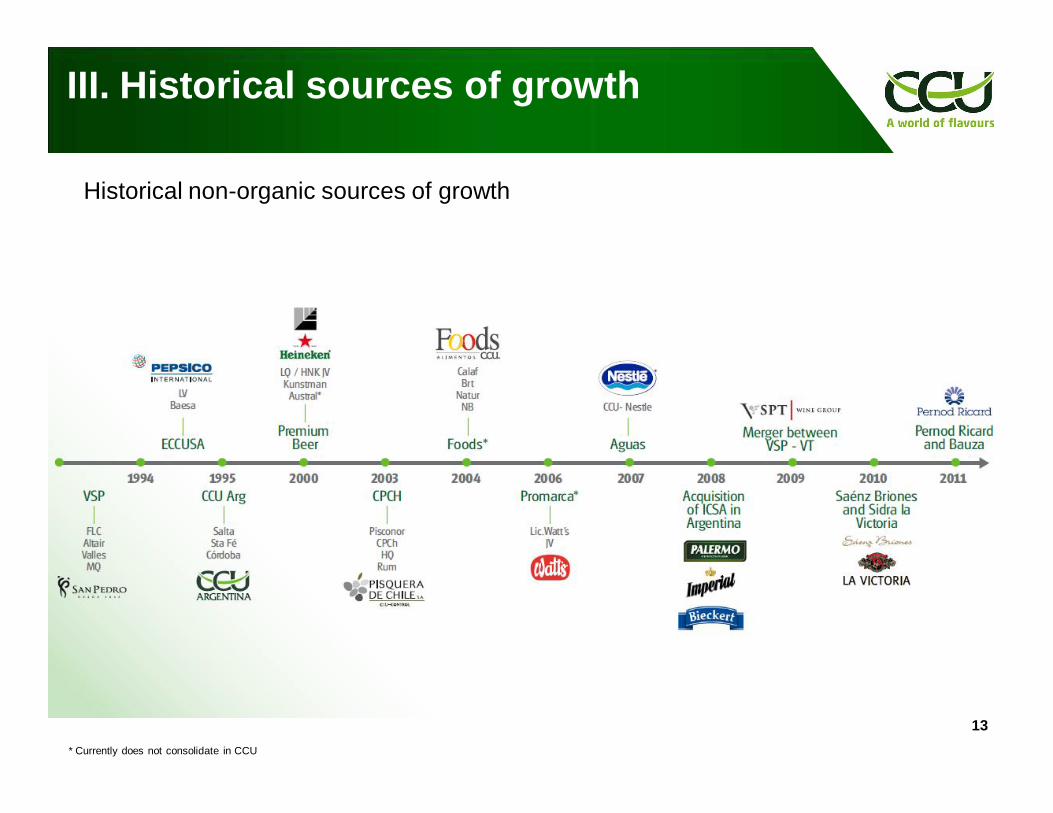
* Currently does not consolidate in CCU
13
Historical non-organic sources of growth
III. Historical sources of growth

CLP Billions 2002 2003 2004 2005 2006 2007 2008 2009 2010 2011ProfitabilityEBIT 37.6 45.9 58.7 66.5 79.7 101.4 124.0 137.4 155.3 177.9 18.8%EBITDA 80.3 86.4 98.6 107.6 121.8 146.8 163.9 181.5 200.5 225.6 12.2%EBITDA MARGIN 23.2% 22.5% 23.4% 21.9% 22.3% 23.4% 23.1% 23.4% 23.9% 23.3%ROCE(3) 8.6% 11.4% 15.0% 15.8% 18.2% 21.4% 20.1% 19.0% 24.0% 26.3%
GrowthRevenues 345.9 384.1 420.6 492.0 545.8 628.3 710.2 776.5 838.3 969.6 12.1%Volume (millons of HL) 10.1 10.9 11.4 12.3 13.4 14.2 15.7 16.3 17.3 18.4 6.9%Market Share(4) 27.5% 27.9% 27.8% 27.8% 28.1% 29.0% 30.1% 31.4% 31.3% 31.1%SAM domestic(5) - - 17.7 25.5 32.2 44.0 63.3 82.6 91.9 117.8 31.1%
SustainabilityFirst Preference(6) 26.8% 30.0% 29.6% 32.1% 31.5% 29.3% 30.0% 30.8% 30.9% 31.1%Organizational environment(7) 67% 69% 72% 70% 72% 72% 73% 77% 77% 76%
CHGAAP(1) IFRS(2) CAGR 02-11
Source: CCU and Adimark(1) Under Chilean GAAP. Figures in CLP Billions of December of each year(2) IFRS, figures in nominal CLP Billions, after non recurring items(3) ROCE: Return on capital employed(4) Weighted market share of all businesses in which CCU participates(5) Direct profit in CLP Billions contributed by products considered in the high margin segment (Segmento de Alto Margen or SAM)(6) Quarterly consumer poll, which measures brand value through asking for consumer's preferred brand in each product segment(7) Internal poll done to all CCU employees, that measures the level of employee’s satisfaction at the job 14
Since the prior crisis, figures in the dimensions Profitability, Growth and Sustainability show a constant improvement
III. Historical sources of growth Main indicators 2002 – 2011

15
Agenda
III. Historical sources of growth 11
V. Summary 17
I. CCU Overview 3
IV. Targeted sources of growth 15
II. CCU’s Recent Performance 8

a. Chilean beverage industry
i. Per capita consumption increase
ii. Well positioned in growing markets
iii. Higher SAM (1)
b. Beer industry in Argentina
i. Per capita consumption increase
ii. Profitability increase
c. Improve the ROCE in the wine business
16* To be evaluated on a case by case basis(1) SAM = Segmento de alto margen. Is the direct profit contributed by products considered in the high margin segment
IV. Targeted sources of growthOrganic and non-organic sources of growth
NON-ORGANIC* GROWTH
a. Multicategory business in Argentina
b. Ready to eat (RTE) in Chile
c. Dairy products in Chile
d. Surrounding markets
e. Ready to mix (RTM) in Chile
ORGANIC GROWTH

17
Agenda
III. Historical sources of growth 11
V. Summary 17
I. CCU Overview 3
IV. Targeted sources of growth 15
II. CCU’s Recent Performance 8
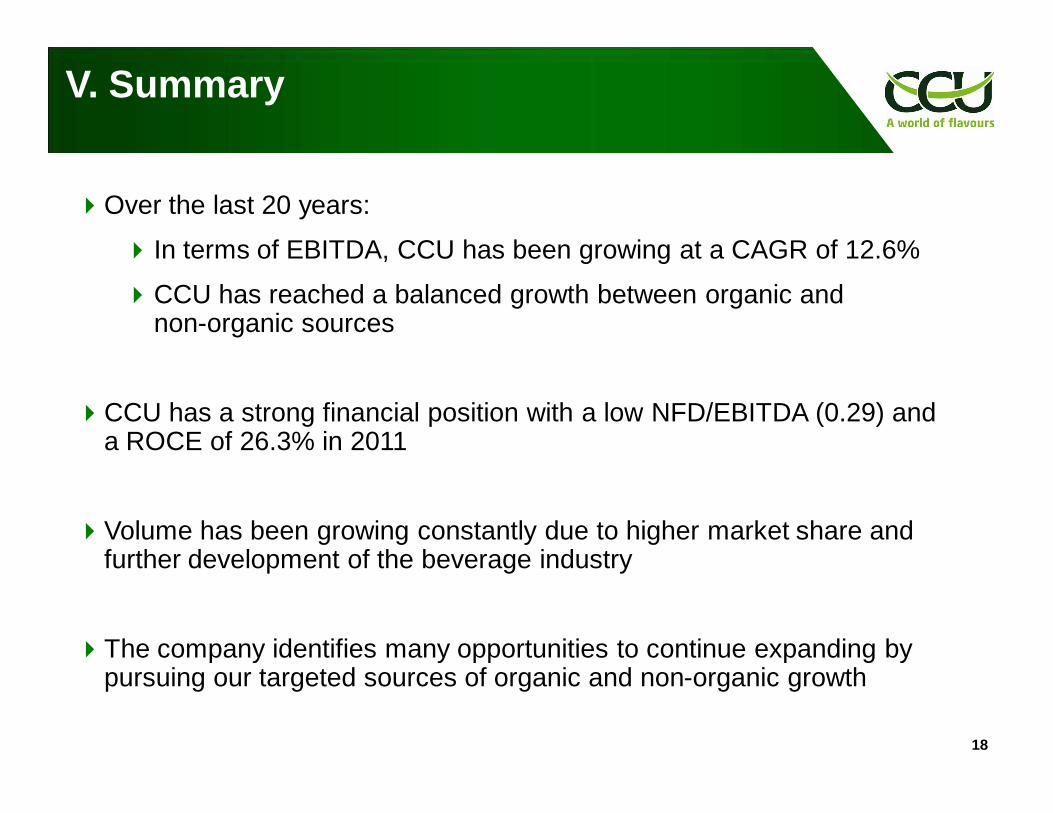
V. Summary
18
Over the last 20 years:
In terms of EBITDA, CCU has been growing at a CAGR of 12.6%
CCU has reached a balanced growth between organic and non-organic sources
CCU has a strong financial position with a low NFD/EBITDA (0.29) and a ROCE of 26.3% in 2011
Volume has been growing constantly due to higher market share and further development of the beverage industry
The company identifies many opportunities to continue expanding by pursuing our targeted sources of organic and non-organic growth

Ricardo ReyesFelipe Arancibia
BTG Pactual & CelfinSouthern Cone / Andean CEO Conference
8-9 May 2012, Santiago, Chile

i. Per capita consumption increase (1)
222159
2002 2011
PCC Evolution in Chile
Organic growtha. Chilean beverage industry
(1) Source: CCU 2011 estimates for Chile beverage and beer Argentina; Canadean estimated 2011 for other countries’ PCC. Excludes bottled milk. Income per capita (PPP): 1.0 times Argentina/Chile, 2.3 times Spain/Chile, 3.2 times USA/Chile and 2.7 times Australia/Chile. Income per capita (PPP) source: World Bank, 2009
(2) Figures have been rounded and may not sum exactly the totals shown 20
Liters per capita Chile Argentina Spain USA AustraliaBeer 39 44 75 73 82Soft drinks 120 117 78 152 105Nectars and juices 22 5 31 50 36
Nectars 18 4 13 3 9Others 4 1 18 47 27
Water 22 91 115 89 28Functional products 2 2 10 43 18
Sport beverages 0.9 1.3 5.2 14.8 5.0Energy drinks 0.5 0.9 1.3 5.7 5.5Tea 0.3 0.0 3.1 21.5 2.1Coffee 0.0 0.0 0.0 0.9 5.3
Wine 13 25 20 9 22Spirits 4 3 6 6 17TOTAL (2) 222 288 334 423 307

35.3%
37.3%37.8%
2002 2008 2011
Organic growtha. Chilean beverage industry
21
ii. Well positioned in growing markets - CCU is stronger in categories with higher potential, which have been growing at a faster pace
(1) Includes all nectars and juices market. CCU has 55.5% market share in the bottled nectar categoryPCC Sources: CCU 2011 estimatesMS Sources: CCU 2011 estimates for beer and ACNielsen for all other
Categories with high potential growth
Market share in Chile
Source: CCU internal estimates
(1)
Liters per capita Chile CAGR 02-11 CCU's MSBeer 39 4.9% 80.2%Soft drinks 120 2.3% 24.8%Nectars and juices 22 10.8% 38.5%
Nectars 18 11.8%Other 4 7.3%
Water 22 11.3% 50.6%Mineral water 10 1.8% 58.2%Purified water 3 20.7%Flavoured water 4 56.6%HOD 5
Functional products 2 53.1% 46.1%Sport beverages 0.9 42.8% 64.5%Energy drinks 0.5 11.4%Tea 0.3 41.5%
Wine 13 -2.5% 24.6%Spirits 4 4.8% 37.1%
Pisco 2.1 -1.0% 48.9%Rum 1.4 28.1% 16.9%Other spirits 0.6 11.5%
TOTAL 222 3.8% 37.8%
(1)

20.6 24.733.6
44.158.6
69.078.7
2005 2006 2007 2008 2009 2010 2011
iii. Higher SAM
Organic growtha. Chilean beverage industry
SAM (Direct profit*) CLP Billions
* Figures in CLP Billion of each year
22
• SAM Chile = Segmento de alto margen. Is the direct profit contributed by products considered in the high margin segment.

Liters per capita Chile Argentina Spain USA AustraliaBeer 39 44 75 73 82
i. Per capita consumption increase
Organic growthb. Beer industry in Argentina
23
(1) Figures have been roundedSource: CCU 2011 estimates
43434033 34 35 36 38
2002 2003 2004 2005 2006 2007 2008 2009
Beer: Liters per capita in Argentina (1)
43
2010 2011
44

10.8 15.523.6
36.7 42.955.3
79.9
2005 2006 2007 2008 2009 2010 2011
12%
28%34% 38%
47%
65%
2002 ... 2008 2009 2010 2011 ... 2020 Target*
50
21 2734
40 4450
5761
73
92
2001 2002 2003 2004 2005 2006 2007 2008 2009 2010 2011
Higher % of direct distribution
* As of December of each year.
ii. Profitability increase
Organic growthb. Beer industry in Argentina
24
SAM Argentina (Direct profit) * USD Millions
* Figures in nominal million USD of each year. Under CHGAAP
Beer price in Argentina (US$/HL) (1)
Source: CCU(1) Figures in nominal USD. 2001-2007 under CHGAAP; 2008-2011 under IFRS
Source: Argentine Beer Industry Chamber
Market share
2010
13%10%
3%
6%
2002 2003 2004 2005 2006 2007 2008 2009
Other Brands Budweiser Heineken
13% 14% 15% 16% 16% 16%21%
22%
3%
13%
5%3%
9%
5%2%
10%
3%1%
10%
4%2%
10%
4%2%
10%
4%1%
13%
7%
23%
3%
23%
2011
13%
7%
3%

9.3%
4.1%5.2%
1.9% 1.6%
6.0% 7.4%7.6%
6,8% 6,7%
11%
2002 2003 2004 2005 2006 2007 2008 2009 2010 2011
Initiatives to increase the ROCE from 6.7% to 11% minimum: Export market
Domestic market
Argentina
ROCE
25
Organic growthc. Improve the ROCE in the wine business
689 692 610 560 530 521 530 554 511 484 AER
(1)
(2)
Source: CCU. AER: Wine exports sales average exchange rate(1) Capital Employed does not consider goodwill of 2008 VT M&A; If included ROCE is 5.9%, 6.0%, 5.3% and 5,1% for 2008, 2009, 2010 and 2011 respectively(2) ROCE for 2011 does not include Exceptional items. If included ROCE is 10.9%, and considering goodwill 8.3%
2011
CHGAAP IFRS
MinimumMedium
TermTarget

Liters per capita (1) Chile Argentina Spain USA AustraliaBeer 39 44 75 73 82Soft drinks 120 117 78 152 105Nectars and juices 22 5 31 50 36Water 22 91 115 89 28Functional products 2 2 10 43 18Wine 13 25 20 9 22Spirits 4 3 6 6 17Cider 0 2 2 0 1Milk(2) 21 46 77 69 104TOTAL (3) 243 335 413 493 412
Non-organic growth*a. Multicategory business in Argentina Replicate CCU's business model in Argentina
Higher direct sales as a tool to build the multicategory business (as of December of each year)
26
2002 2008 2009 2010 2011
12% 28% 34% 38% 47%
(1) Only bottled milk. CCU estimates based on Canedean 2011 for Chile and Argentina and Australia: Dairy Australia (equivalent to Odepa in Chile),Spain: UUAA (equivalent to Fedeleche in Chile), USA: USDA (US Department of Agriculture). Australia, Spain and USA adjusted for growth rate Canadean2011 estimates
(2) Source: CCU 2011 estimates for Chile beverage and Argentina; CCU estimates based on Canadean 2011 excluding powder milk for other countries’PCC. Income per capita (PPP): 1.0 time Argentina/Chile, 2.3 times Spain/Chile, 3.2 times USA/Chile and 2.7 times Australia/Chile. Income percapita (PPP) source: World Bank, 2009
(3) Figures have been rounded and may not sum exactly the totals shown
* To be evaluated on a case by case basis
% of direct distributionin Argentina

27
Entry to the cider and spirits market in Argentina in December 2010 Control of Sáenz Briones (50.2%) and Sidra La Victoria (71.4%)
Price paid: US$ 13.2 millions
Estimate market share: 34.5%
Non-organic growth*First move towards the multicategory in Argentina
Execute strong operational programs Break seasonality of the cider
Revenue synergies with our direct distribution in Argentina
Cost synergies and best practices
* To be evaluated on a case by case basis
USD Millions Excecution date
One year after
Cider Volume (MHl) 188 +200 1.1x
Revenue 29 +45 1.5x
EBITDA 3.9 +8.7 2.2x

6,224 7,344
2005 2008
8,641
2011
Sale volumes (tons)
(3)
Ready to eat market in Chile (US$ 1.4bn) 2020 ready to eat market estimated in US$ 2.0bn CCU currently has a 50-50 JV with Indalsa(1)
Market share 2010: 5%(2)
Non-organic growth*b. Ready to eat market in Chile
(1) Currently does not consolidate in CCU(2) Source: CCU internal estimates (3) Currently does not consolidate in Foods; option to increase Food’s ownership and consolidate in the future 28
* To be evaluated on a case by case basis
Revenues CLP Billions
7.812.8
2005 2008
19.0
2011

29
Non-organic growth*c. Dairy products in Chile
Dairy products market size(1):US$ 1,397 million
* To be evaluated on a case by case basis(1) Includes cheese, liquid and powder milk, yoghurt and other milk based products.(2) Only bottled milk. CCU estimates based on Canedean 2011 for Chile and Argentina and Australia: Dairy Australia (equivalent to Odepa in Chile), Spain: UUAA (equivalent to
Fedeleche in Chile), USA: USDA (US Department of Agriculture) Australia, Spain and USA adjusted for growth rate Canadean 2011 estimates
Liters per capita(2) Chile Argentina Spain USA AustraliaMilk 21 46 77 69 104
PCCRTD 2011Beer 39Soft Drinks 120Nectars and Juices 22Water 22Functional 2Wine (D) 13Spirits 4CCU 222Milk 21Total RTD 243

Non-organic growth*d. Surrounding markets
Beverage industry of Peru + Paraguay + Uruguay + Bolivia + Ecuador + Colombia:
30(1) Source: CCU estimates based on Canadean 2011* To be evaluated on a case by case basis
Liters per capita(1) Peru Paraguay Uruguay Bolivia Ecuador ColombiaBeer 48 41 30 40 37 42Soft drinks 68 79 121 76 57 53Nectars and juices 13 4 5 13 11 10Water 17 7 57 5 32 18Functional products 4 1 1 0 4 2Wine 2 5 23 3 1 1Spirits 2 13 3 13 3 3Milk 10 48 65 27 46 70TOTAL 163 197 304 179 191 200
Population 29.5 6.3 3.5 10.9 14.8 45.6
1st step started to export Schneider from Argentina to Paraguay in 2011

31(1) CCU 2011 estimates. Liters per capita equivalent
Non-organic growth*e. Ready to mix in Chile (RTM)
* To be evaluated on a case by case basis
Liters per capita (1) 2011Powder Juices 29.5Powder Milk 44.7Tea 61.3Coffee 45.7Soup 19.3Total RTM 200.6

Ricardo ReyesFelipe Arancibia
BTG Pactual & CelfinSouthern Cone / Andean CEO Conference
8-9 May 2012, Santiago, Chile