southern california beach valuation study · valuation study michael hanemann ... • conducted in...
TRANSCRIPT


2
Context
• Conducted in the aftermath of the American Trader case, involving an oil spill of 415,598 gallons of crude at Huntington beach on Feb 7, 1990.
• The case went to trial in Orange County in the fall of 1997. On December 8, 1997, the jury awarded damages to the state of $18 million.

3
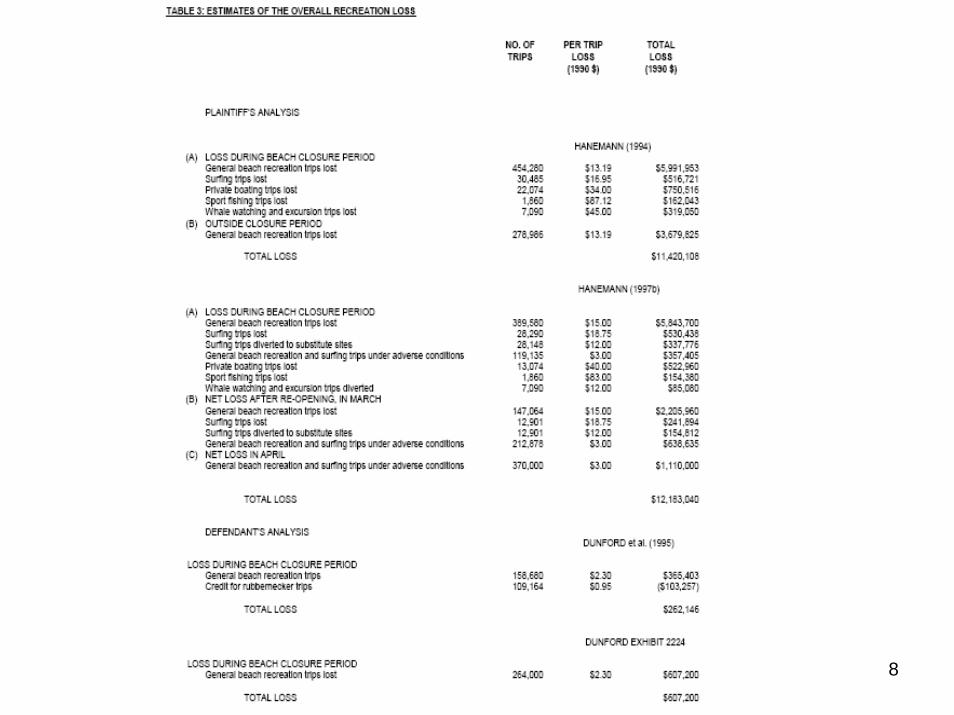
Major issues raised in the litigation• How many people would have gone to the
affected beaches if they had been open February 8 – March 15, 1990?
• Can you answer this reliably based on lifeguard estimates of beach attendance?
• Did people merely go to the many other beaches in the area that remained open?
• Did they merely go once the beaches re-opened.
• What is the relevant estimate of consumer’s surplus per lost trip?

4

5
TABLE 1: RECREATION ACTIVITIES IN THE OIL SPILL AREA AREA G
ener
al B
each
R
ecre
atio
n
Surf
ing
Shor
elin
e A
ctiv
ities
Priv
ate
Boa
ting
Party
/ C
harte
r B
oatin
g
Wild
life
/ B
ird V
iew
ing
Long Beach Marina / Alamitos Bay Seal Beach Anaheim Bay / Huntington Harbor Sunset Beach Bolsa Chica State Beach Huntington City Beach Huntington State Beach Santa Ana River Mouth Beach Newport Beach Newport Harbor Crystal Cove State Beach

6

7
8

9
WHY?
People use the Beach.Pollution is on the rise.Cleanup is costly.How much is worth cleaning up?
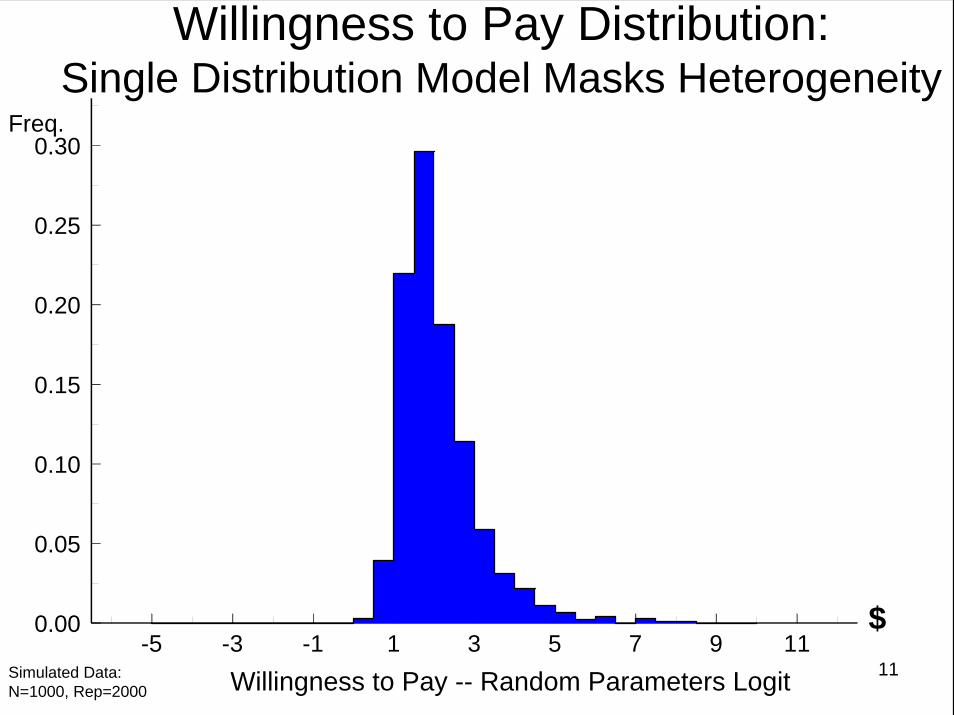
Why the finite mixture model? Different people have different tastes.

10
• 1496 postings in LA county in 2004.
• 45% of beach goers that do not go in the water say pollution keeps them out.
11
Willingness to Pay Distribution:Single Distribution Model Masks Heterogeneity
-5 -3 -1 1 3 5 7 9 11
RPL WTP
0.00
0.05
0.10
0.15
0.20
0.25
0.30
Simulated Data: N=1000, Rep=2000
$
Freq.
Willingness to Pay -- Random Parameters Logit

12
Similar Preferences?19th, 2003

13
Beaches are characterized by diverse preferences and people

14
Choosing the ‘right’ beach can be difficult!
Credit: Linwood Pendleton
Swim near the Lifeguard
Don’t swim near the Storm Drains

15
Southern California Beaches:Los Angeles and Orange Counties
Link

16
Survey Respondent Residence Location
Link
17
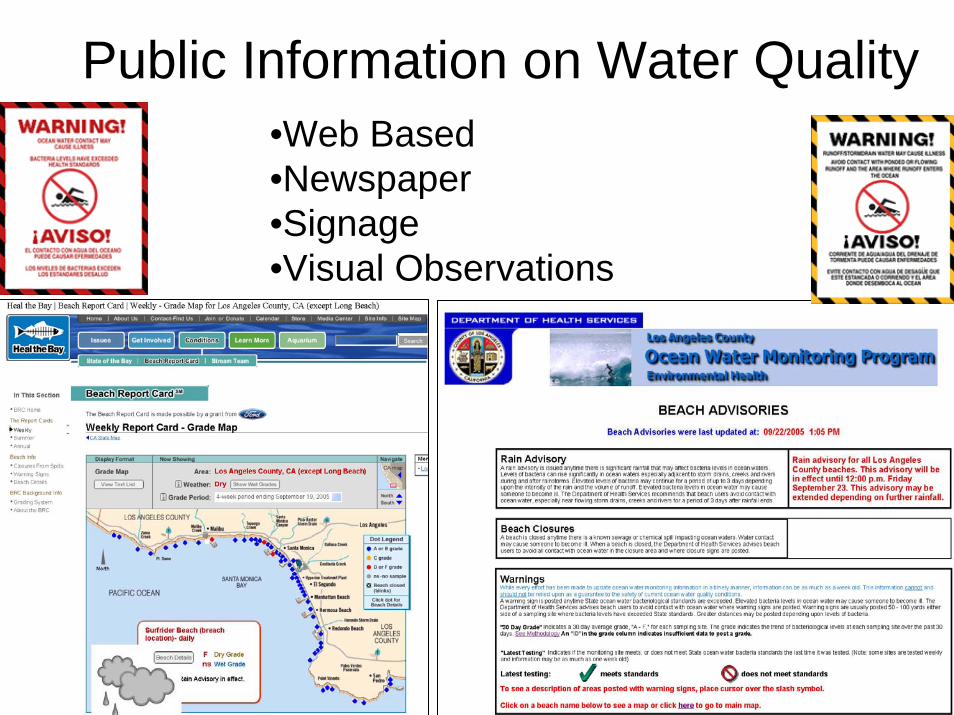
Public Information on Water Quality •Web Based•Newspaper•Signage•Visual Observations

18
What water quality grades actually mean:
• Biological Pollutants: total & fecal coliform & enterococcus.
• Stomach flu, ear infection, upper respiratory infection and skin rash
• No Measures for Toxins, Human Debris, Natural Debris
Link / Index

19
WTP Distribution for Multimodal Model:Captures Heterogeneity
-5 -3 -1 1 3 5 7 9 11
SIMULATED WTP (Bq/B$)
0.00
0.02
0.04
0.06
0.08
0.10
0.12
0.14
0.16
0.18
0.20
0.22
0.24
Simulated Data: N=1000, Rep=2000
$$
Freq.
Link / IndexWillingness to Pay -- Finite Mixture Logit

20