southern acids (m) berhad shareholders’ briefing audited fy10 results 28 october 2010 delivering...
TRANSCRIPT
SOUTHERN ACIDS (M) BERHAD
Shareholders’ BriefingAudited FY10 Results
28 October 2010
DELIVERING QUALITY SINCE 1981

Contents
2
1. Group Financial Highlights
5. Share Price Performance
4. Dividend Record
2. Review of Major Operations
3. 5-Year Financial Performance

3
GroupFinancial
Highlights

4
FINANCIAL RESULTS FOR THE YEAR ENDED 30 APR 2010
Oleochemical
Palm Oil Plantation
Healthcare
Warehousing & Port Cargo Handling
Investment & management
Continuing Operations
5
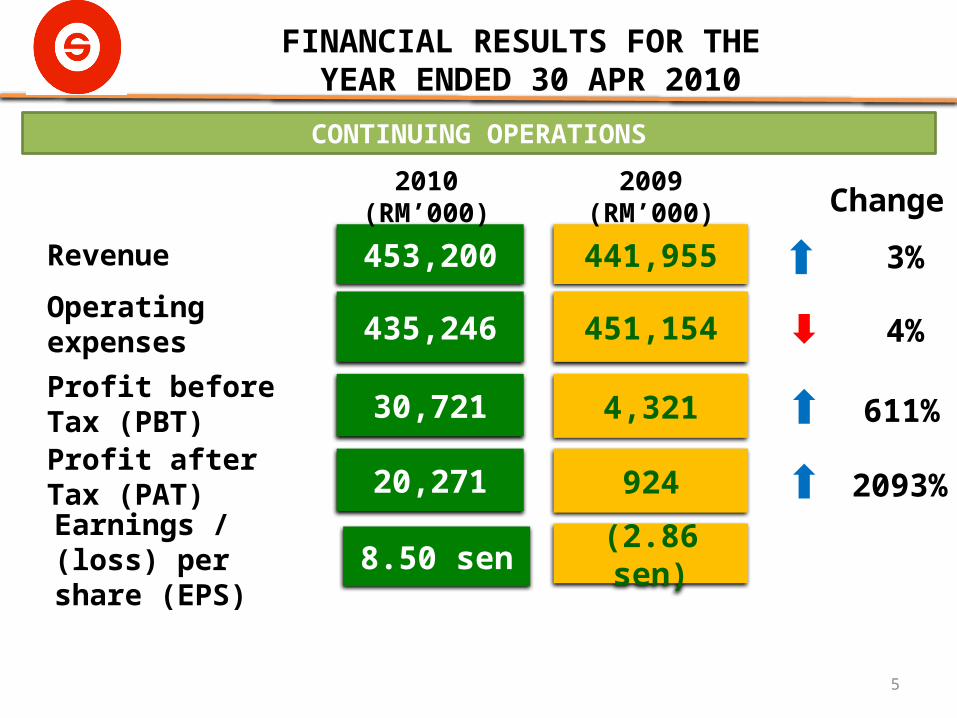
FINANCIAL RESULTS FOR THE YEAR ENDED 30 APR 2010
453,200 441,955
2010 (RM’000) 2009 (RM’000) Change
3%
4%
611%
435,246
30,721
451,154
4,321Profit before Tax (PBT)
Operating expenses
Revenue
CONTINUING OPERATIONS
8.50 sen (2.86 sen)Earnings / (loss) per share (EPS)
20,271Profit after Tax (PAT) 924 2093%
6
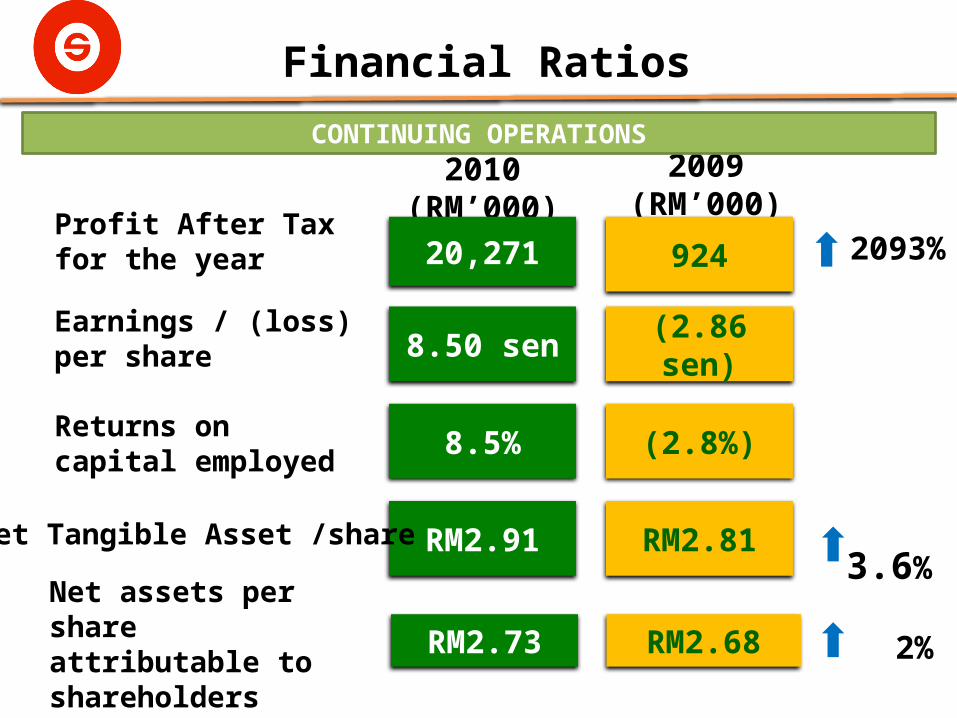
Financial Ratios
2009 (RM’000)
Returns on capital employed
8.5% (2.8%)
RM2.91 RM2.81
Net assets per share attributable to shareholders
(2.86 sen)8.50 senEarnings / (loss) per share
2010 (RM’000)
CONTINUING OPERATIONS
92420,271Profit After Tax for the year 2093%
3.6%
RM2.73 RM2.68
Net Tangible Asset /share
2%
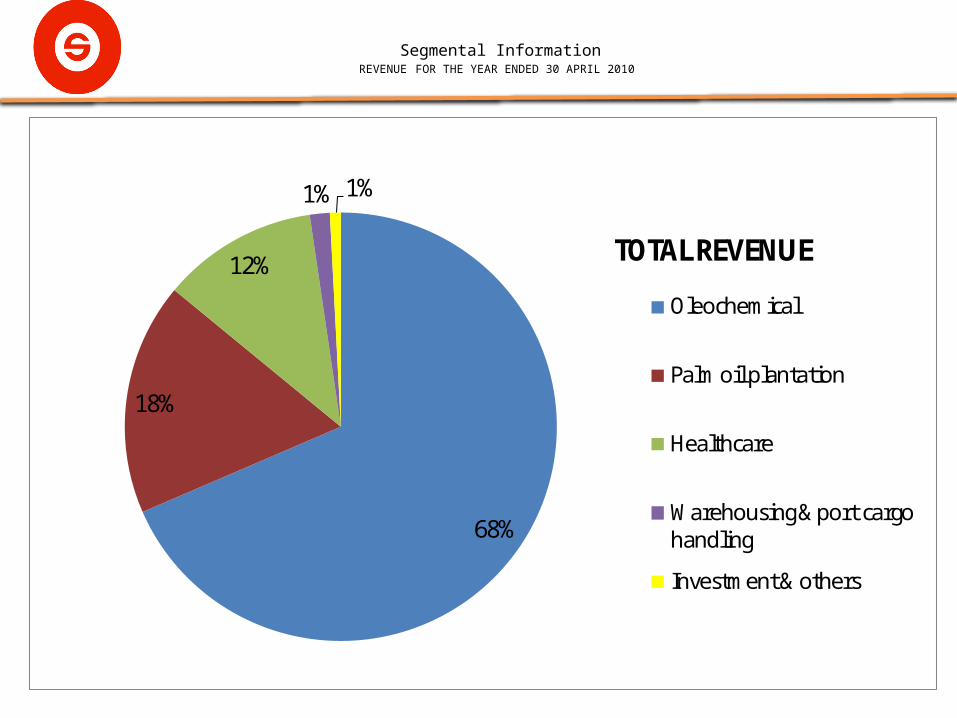
Segmental InformationREVENUE FOR THE YEAR ENDED 30 APRIL 2010
68%
18%
12%
1% 1%
TOTAL REVENUE
Oleochemical
Palm oil plantation
Healthcare
Warehousing & port cargo handling
Investment & others
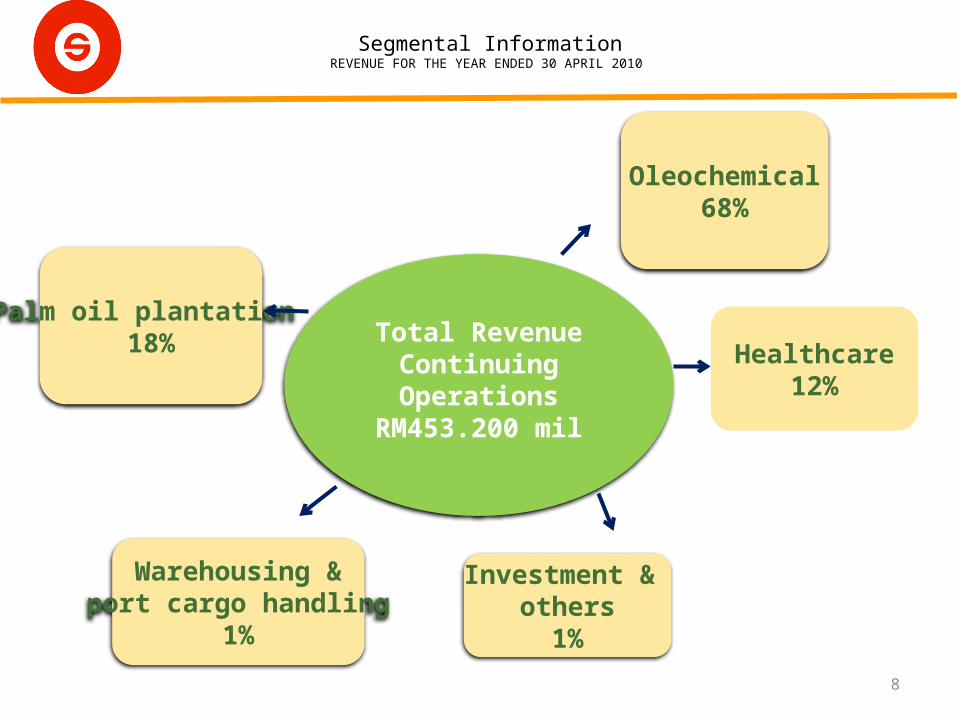
Segmental InformationREVENUE FOR THE YEAR ENDED 30 APRIL 2010
8
Oleochemical68%
Palm oil plantation 18%
Investment & others
1%
Warehousing &port cargo handling
1%
Healthcare12%
Total RevenueContinuingOperations
RM453.200 mil
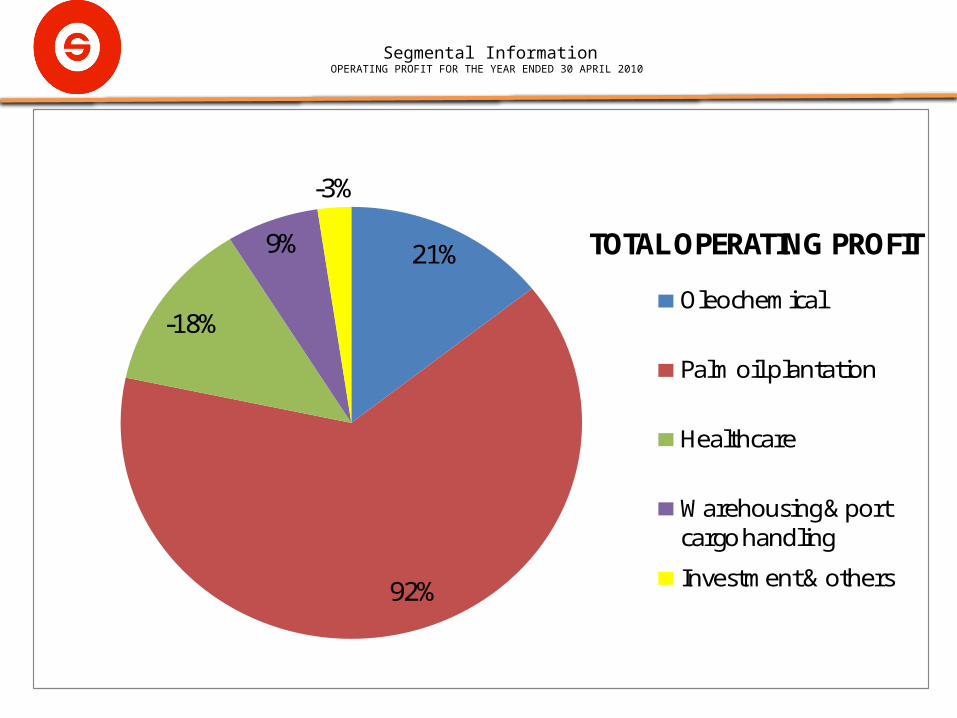
Segmental InformationOPERATING PROFIT FOR THE YEAR ENDED 30 APRIL 2010
21%
92%
-18%
9%
-3%
TOTAL OPERATING PROFIT
Oleochemical
Palm oil plantation
Healthcare
Warehousing & port cargo handling
Investment & others
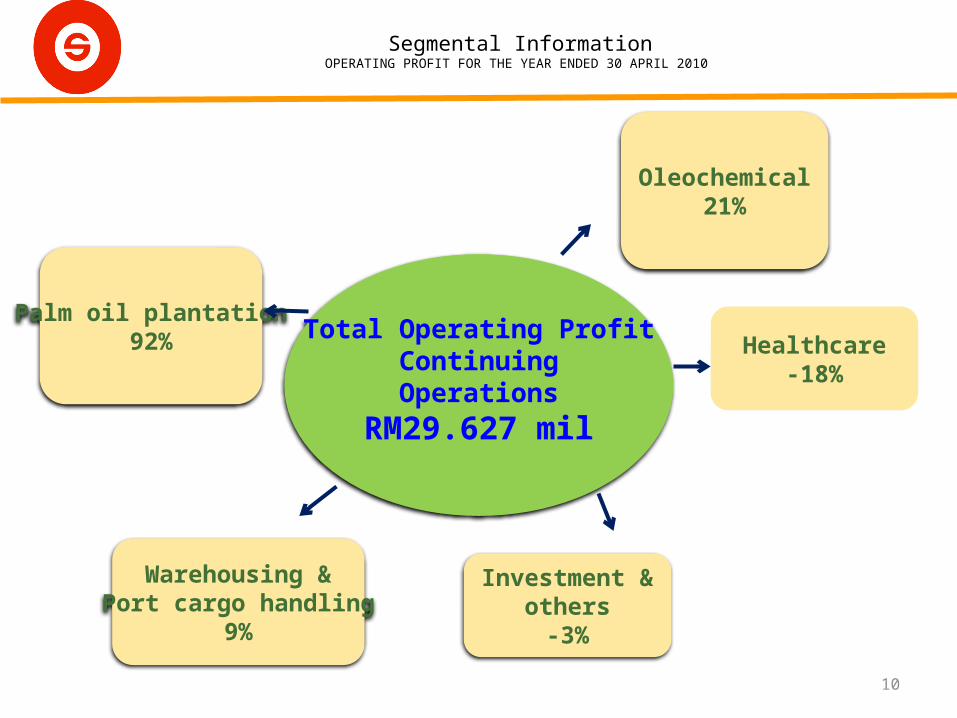
Segmental InformationOPERATING PROFIT FOR THE YEAR ENDED 30 APRIL 2010
10
Oleochemical21%
Palm oil plantation92%
Investment &others
-3%
Warehousing &Port cargo handling
9%
Healthcare-18%
Total Operating ProfitContinuingOperations
RM29.627 mil
11
ReviewOf Major
Operations
(50,000)
-
50,000
100,000
150,000
200,000
250,000
300,000
350,000
316,
446
(13,
153)
310,
387
6,08
9
FYE 2009
FYE 2010
Review of Major Operations
12
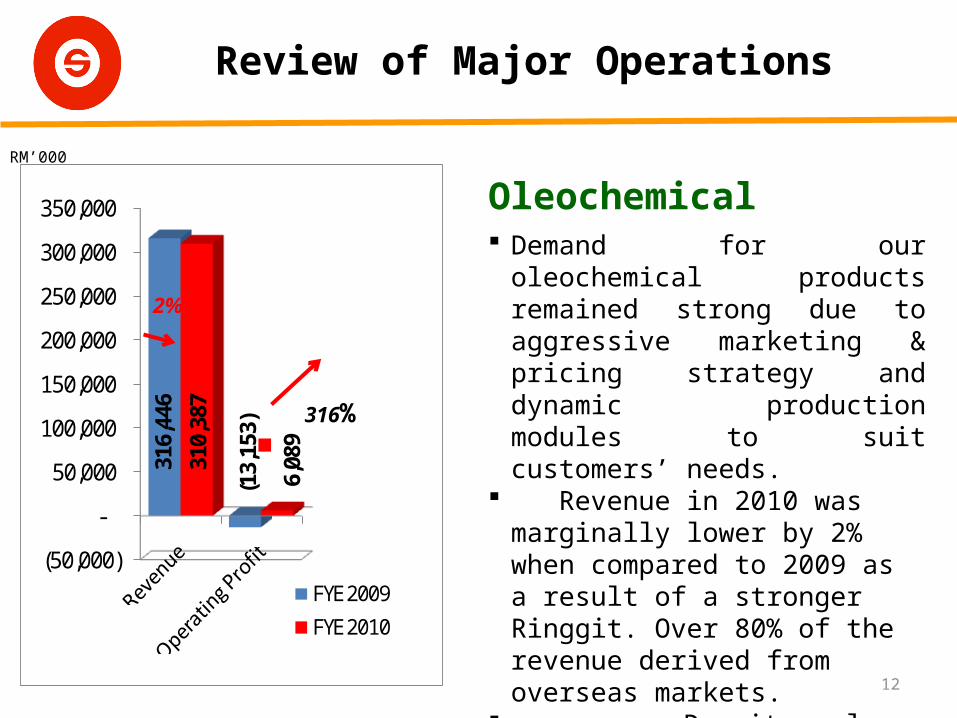
Oleochemical Demand for our oleochemical products
remained strong due to aggressive marketing & pricing strategy and dynamic production modules to suit customers’ needs.
Revenue in 2010 was marginally lower by 2% when compared to 2009 as a result of a stronger Ringgit. Over 80% of the revenue derived from overseas markets.
Despite a lower revenue, the oleochemical division staged a turnaround from a loss of RM13.153 mil to a profit of RM6.089 mil mainly due to lower forex loss.
RM’000
2%
316%
Review of Major Operations
13
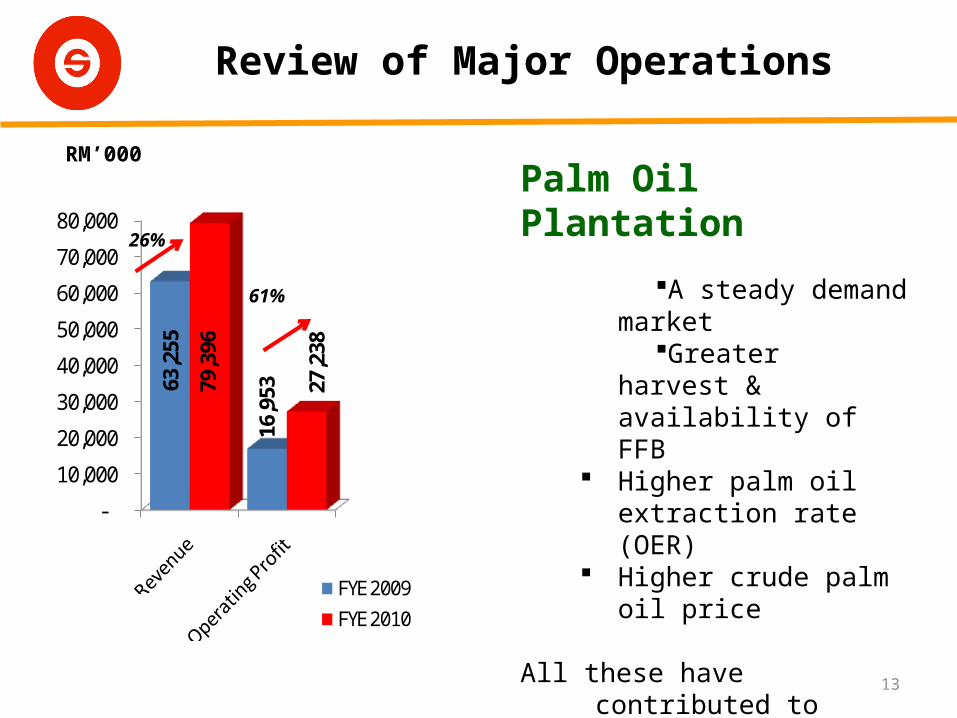
Palm Oil Plantation
A steady demand marketGreater harvest &
availability of FFB Higher palm oil extraction rate
(OER) Higher crude palm oil price
All these have contributed to increase in both revenue and profitability of our palm oil division.
RM’000
79%
-
10,000
20,000
30,000
40,000
50,000
60,000
70,000
80,000
63,2
55
16,9
53
79,3
96
27,2
38
FYE 2009
FYE 2010
26%
61%

Review of Major Operations
14
(10,000)
-
10,000
20,000
30,000
40,000
50,000
60,000
50,9
08
(2,9
88)
52,9
76
(5,4
53)
FYE 2009
FYE 2010
Private Healthcare
Our Sri Kota Medical Specialist Centre continued to operate in a highly competitive environment with many new competitors blooming in the surrounding areas.
• Despite the stiff competitions, revenue increased by 4% from RM50.908 mil to RM52.976 mil.
• Higher patient registration contributed to 4.1% increase in revenue.
• Increased loss due to non-recurrent expenses brought to account in FY2010.
• Aggressive marketing and pursuing MSQH Accreditation to tap into Health Tourism market.
4%
(82%)
RM’000
Review of Major Operations
15
-
1,000
2,000
3,000
4,000
5,000
6,000
7,000
RM5.
6 m
2,35
4
RM6.
9 m
2,75
2
FYE 2009
FYE 2010
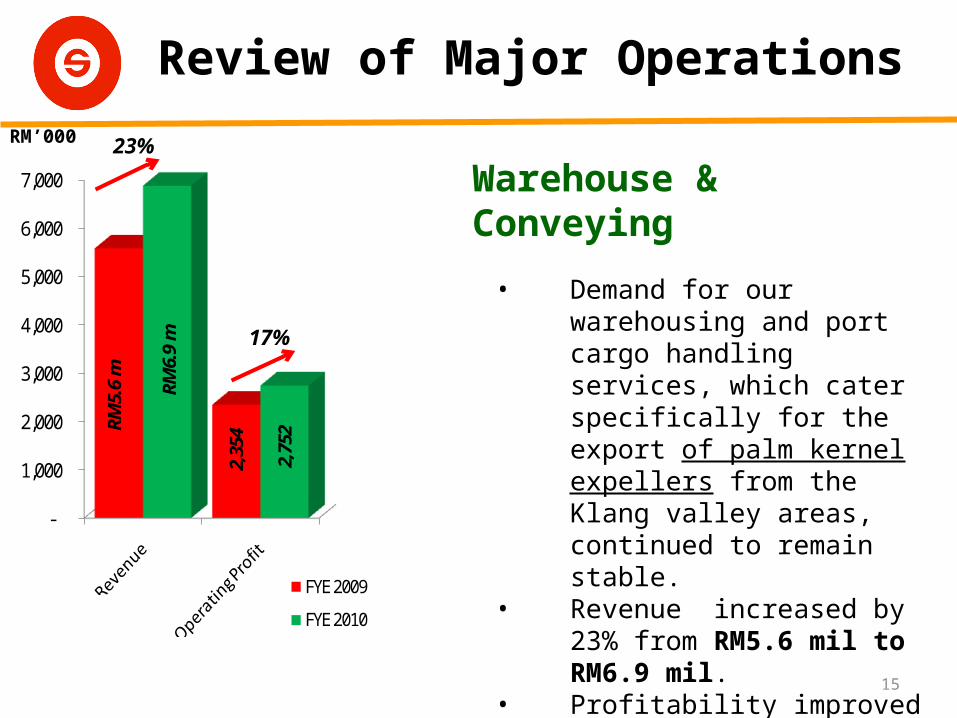
Warehouse & Conveying
• Demand for our warehousing and port cargo handling services, which cater specifically for the export of palm kernel expellers from the Klang valley areas, continued to remain stable.
• Revenue increased by 23% from RM5.6 mil to RM6.9 mil.
• Profitability improved 17% from RM2.354 mil to RM2.752 mil.
• Improved result was due to higher revenue from warehouse rental
RM’000
17%
23%
16
5-YearFinancial
Performance
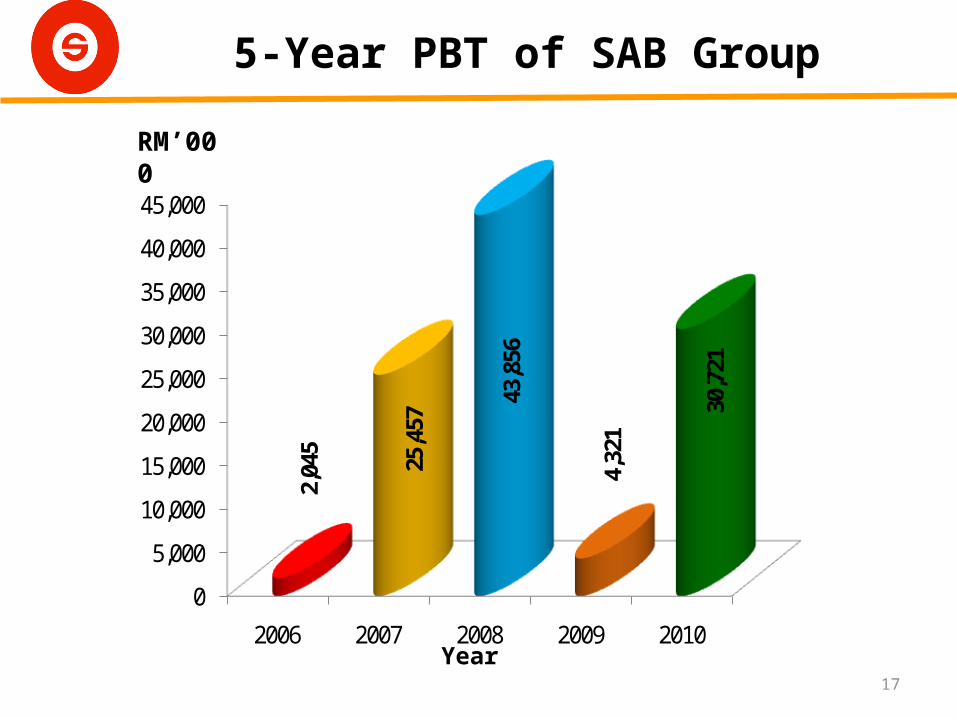
5-Year PBT of SAB Group
17
0
5,000
10,000
15,000
20,000
25,000
30,000
35,000
40,000
45,000
2006 2007 2008 2009 2010
2,04
5
25,4
57 43
,856
4,32
1
30,7
21
RM’000
Year

18
DividendRecord
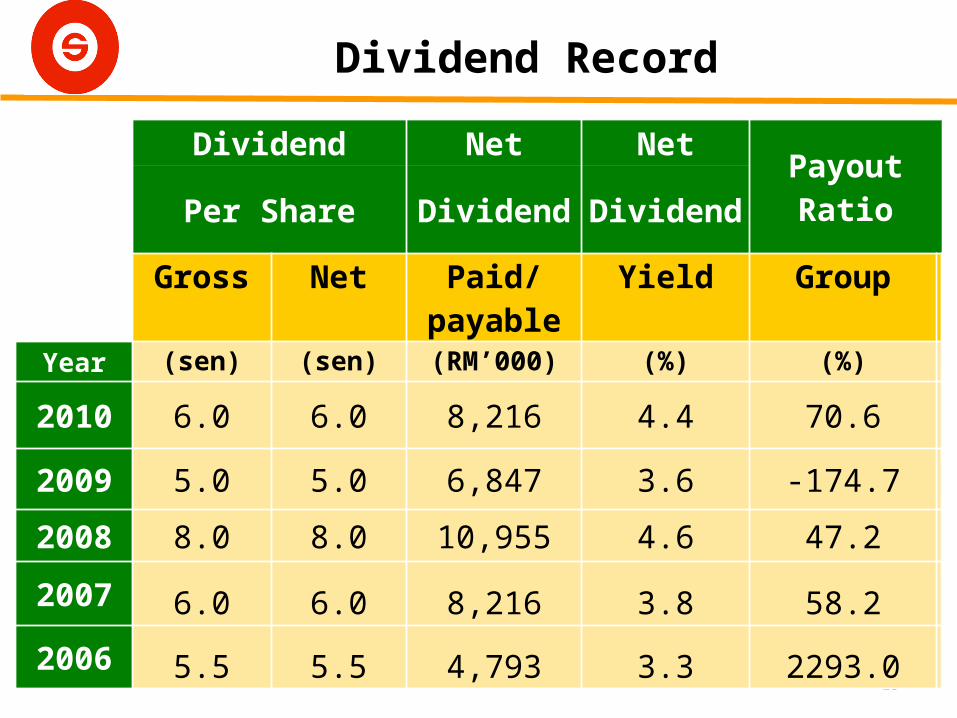
Dividend Record
19
Dividend Net NetPayout Ratio
Per Share Dividend Dividend
Gross Net Paid/payable Yield Group
Year (sen) (sen) (RM’000) (%) (%)
2010 6.0 6.0 8,216 4.4 70.6
2009 5.0 5.0 6,847 3.6 -174.7
2008 8.0 8.0 10,955 4.6 47.2
2007 6.0 6.0 8,216 3.8 58.2
2006 5.5 5.5 4,793 3.3 2293.0
20
Share PricePerformance
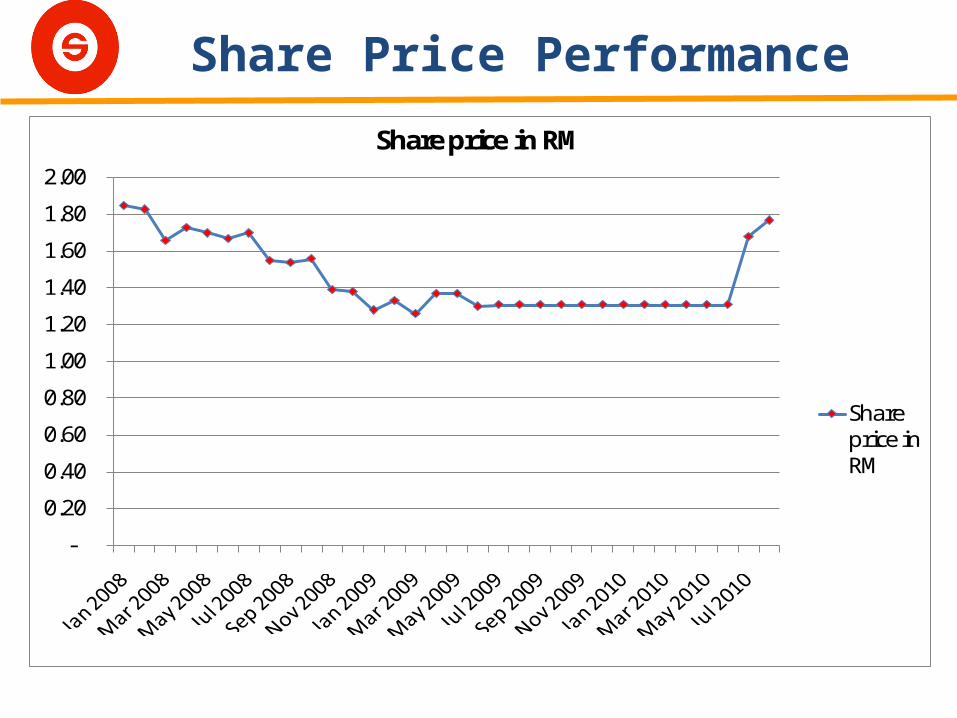
Share Price Performance
-
0.20
0.40
0.60
0.80
1.00
1.20
1.40
1.60
1.80
2.00
Share price in RM
Share price in RM
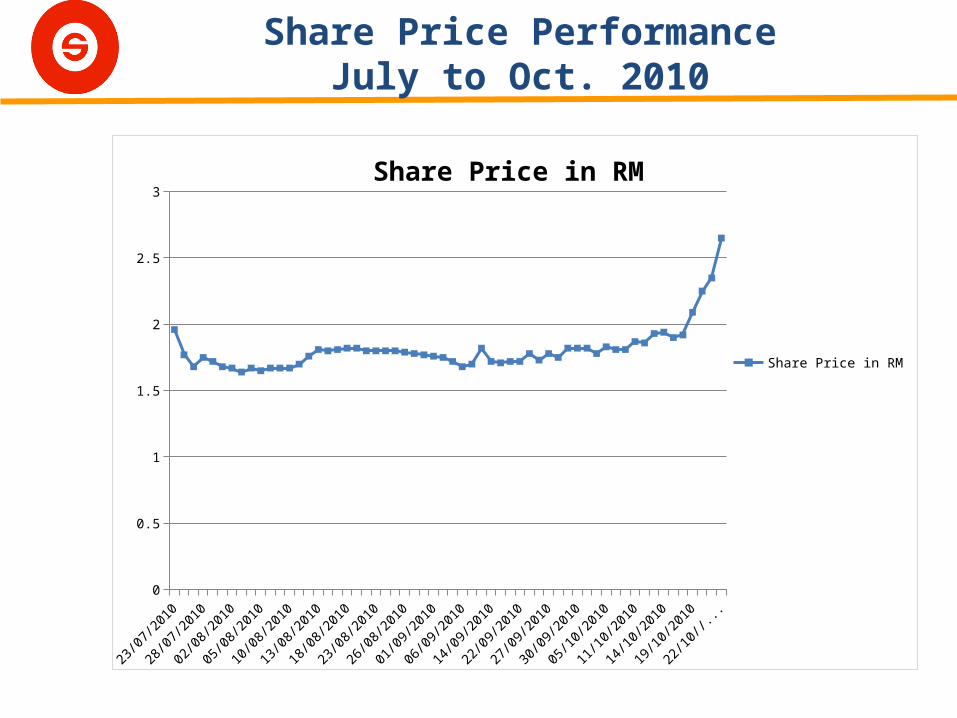
Share Price PerformanceJuly to Oct. 2010
23/07/2
010
27/07/2
010
29/07/2
010
02/08/2
010
04/08/2
010
06/08/2
010
10/08/2
010
12/08/2
010
16/08/2
010
18/08/2
010
20/08/2
010
24/08/2
010
26/08/2
010
30/08/2
010
02/09/2
010
06/09/2
010
08/09/2
010
15/09/2
010
22/09/2
010
24/09/2
010
28/09/2
010
30/09/2
010
04/10/2
010
07/10/2
010
11/10/2
010
13/10/2
010
15/10/2
010
19/10/2
010
21/10/2
0100
0.5
1
1.5
2
2.5
3
Share Price in RM
Share Price in RM