south wealden and eastbourne transport study · south wealden and eastbourne transport study...
TRANSCRIPT
South Wealden and Eastbourne Transport Study Report by East Sussex County Council for Wealden District Council and Eastbourne Borough Council, based on technical reports by Transport Planning (International) Ltd
South Wealden and Eastbourne Transport Study (SWETS) November 2010
Page 1 18/11/2010
1 Introduction 2
2 Phase I Study 2
3 Phase II Study 16
4 Phase III SWETS 28
5 Conclusion of SWETS 30
Appendix 1 32
Appendix 2 33
Appendix 3 44
Appendix 4 45
Appendix 5 47
Appendix 6 53
Appendix 7 72
Appendix 8 103
South Wealden and Eastbourne Transport Study (SWETS) November 2010
Page 2 18/11/2010
1.0 Introduction Overview 1.1 The South Wealden and Eastbourne Transport Study (SWETS) is a study commissioned by Wealden District Council (WDC), Eastbourne Borough Council (EBC) and East Sussex County Council to assist in the preparation of the Wealden District and Eastbourne Borough Core Strategies as part of the respective Local Development Frameworks (LDF). 1.2 The study was carried out in three phases, reflecting changing circumstances nationally, due to the revocation of the South East Plan, the outcome of each phase of SWETS and the developing Core Strategies. SWETS therefore is part of the iterative process of the development of the Core Strategies. 1.3 The original study (SWETS phase I) also provides an evidence base to assist in identification in a range of packages of transport measures, which may include major and/ or minor infrastructure investment, and other wider measures, in the Polegate / Folkington area around the A22/A27 and A271 corridors. It also provides an evidence base and framework within which an updated Local Area Transport Strategy (LATS) for the area may be developed. 1.4 Transport modelling work was carried out by consultants Transport Planning (International) Ltd (TPi), managed on behalf of the commissioning authorities by East Sussex County Council (ESCC). The original brief (SWETS phase I) was overseen by a Steering Group comprising the three local authorities and representatives of the Highways Agency (HA) and the South East England Partnership Board (which has now recently been disbanded). 1.5 Two subsequent iterations of SWETS, Phase II and Phase III were commissioned by Wealden District Council, to further the development of the evidence base for the Core Strategy. The results of Phase II and III are incorporated in this report. 2.0 Phase I Study Background to Phase I 2.1 The initial study required development of the existing Eastbourne multi-modal transport model sufficiently to: Inform the preparation of the Local Development Framework (LDF) Core
Strategies for both Wealden District and Eastbourne Borough, enabling identification and testing of transport measures needed to deliver the respective Core Strategies;
Provide an evidence base to assist in identification in a range of packages of transport measures, which may include major and / or minor
South Wealden and Eastbourne Transport Study (SWETS) November 2010
Page 3 18/11/2010
infrastructure investment, and other wider measures, in the Polegate/ Folkington area around the A22/A27 and A271 corridors; and
Provide an evidence base and framework within which an updated Local Area Transport Strategy (LATS) for the area may be developed
2.2 The initial study (phase I) was commissioned in January 2010 prior to the revocation of the Regional Spatial Strategy, the South East Plan, and whilst the respective Core Strategies were being developed. At this time a number of options were being considered by each authority and the purpose of the study was to assist in the determination, with other evidence, of the most appropriate spatial distribution. 2.3 The principal objectives for phase I SWETS were (from a WDC perspective) to advise whether the South East Plan
requirements for growth (from 2006 to 2026) could be accommodated within existing transport networks, and whether additional deliverable infrastructure is necessary facilitate to growth required by the South East Plan;
(particularly from an EBC perspective) to advise on the transport case for long standing new highways proposals in the Eastbourne Park area;
to identify, if appropriate, preferred LDF housing and employment development allocation options for both EBC and WDC on the basis of a comparative transport appraisal; and
to identify any causal linkages between the alternative LDF housing and employment development allocation options and improvement of the trunk road network to the west of Polegate (an intervention known as the Folkington Link or similar).
Scope of Phase I Study 2.4 The project entailed the following main stages: Achieve an accurate model representation of current highway and public
transport (PT) conditions at base year 2009 AM and PM peaks, in the Eastbourne / South Wealden modelled area;
Prepare future year demand forecasts in the study area at 2016 and 2026 for a reference case1 and combinations of nine alternative LDF housing and employment development allocation options to for both WDC and EBC2;
Assign the future year demand forecasts to the highway and public transport networks at 2016 and 2026, to determine the likely impact upon existing transport networks;
Identify appropriate transport interventions to mitigate the effects of the different development scenarios; and
Undertake a comparative appraisal of the transport impacts of combinations of alternative LDF housing and employment development
1 Modelled using TEMPRO data (base case and usually lower traffic flows) 2 Modelled using TRICS data (industry standard for LDF testing resulting in higher traffic flows than base case)
South Wealden and Eastbourne Transport Study (SWETS) November 2010
Page 4 18/11/2010
allocation options for both WDC and EBC and identify, if appropriate, preferred options on that basis.
Modelling 2.5 The study is based upon a base model which takes into account completions and commitments3 as of June 2009 for the study area. The study area is shown in Appendix 1. 2.6 WDC and EBC provided three alternative distribution options for housing and employment development from this base date, showing the proposed additional development at 2016 and 2026. These alternative distributions are shown in Appendix 2. The WDC and EBC alternative options combined provided for nine scenarios. 2.7 WDC alternatives included one scenario meeting the South East Plan requirements for 7,000 dwellings in the part of Wealden within the Sussex Coast Sub Region4. The other two WDC alternatives resulted in housing numbers lower than the South East Plan requirement in the part of Wealden within the Sussex Coast Sub Region and provided two alternative spatial distribution, around the towns of Hailsham and Polegate. A windfall allowance, based on previous trends, was included in addition to the allocations being tested. It was considered at the stage of Core Strategy development reached at the initiation of phase 1 that testing these configurations would assist in providing evidence as to the most appropriate distribution, taking into account concerns raised regarding the deliverability of 7,000 homes in south Wealden and the pressure on transport infrastructure. 2.8 EBC alternatives included three alternative spatial distributions within Eastbourne, based on developing scenarios. Each distribution required windfalls to meet the South East Plan requirements, and these were taken into account in the modelling. 2.9 The work carried out for Phase I included demand forecasting and assignment work on forecasting the impacts on the existing transport networks of the alternative nine LDF housing and employment development allocation options to 2016 and 2026 for both WDC and EBC. From this initial stage it was agreed to test the Wealden South East Plan option with the three EBC alternative options with a range of appropriate packages of transport interventions. The packages of transport interventions are shown on page 9. Base Model 2.10 The multi-modal transport model in existence prior to this study has been updated to 2009 weekday AM and PM peak conditions in an expanded study area extending west to east between East Dean and Pevensey and from south to north from the coast to Hailsham as shown in Appendix 1. 3 Extant Planning Permissions for both housing and employment as of June 2009 4 A region defined by the South East Plan including Hailsham and Polegate

South Wealden and Eastbourne Transport Study (SWETS) November 2010
Page 5 18/11/2010
2.11 In order to create a model which is fit for purpose the base year trip origin to destination (O-D) matrices have been updated using Census data and matrix estimation, together with traffic count data from the last three years and new bus boarding and alighting counts from 2010. The resultant highway matrices contain three vehicle types: Car, Light Commercial Vehicle and Heavy Commercial Vehicle. The public transport matrices contain two passenger types: bus and rail. 2.12 Model calibration notes have been prepared by TPi (Technical Note 1, SATURN Model Calibration, and Technical Note 2, Public Transport Model Calibration). These are available on request from ESCC. 2.13 The SATURN highway model achieved a flow calibration in which 84% of assigned flows in the AM peak and 86% of flows in the PM peak are within an accuracy level (‘GEH statistic’) of 5.0 or less, compared with observed flows (The ‘GEH statistic’ target set by Department for Transport (DfT) is 85% within 5.0 or less). Similarly, the model achieved a journey time calibration in which 86% of routes in the AM peak and 92% of routes in the PM peak showed a modelled time within 15% of observed (the target set by DfT is 85% within 15% of observed). 2.14 In the public transport model, 85% of assigned passenger flows in the AM peak and 88% of flows in the PM peak are within an accuracy level (‘GEH statistic’) of 5.0 or less, compared with observed flows ( the ‘GEH statistic’ target set by DfT is 85% within 5.0 or less). 2.15 The model therefore provides an acceptable overall level of calibration accuracy and is considered to be sufficiently robust to be used as the basis for the forecasting purposes of this study. There are, however, some aspects which will need to be considered and addressed, if appropriate, in any future use of the model which are outlined in Appendix 3. Forecast Model 2.16 Forecast AM and PM peak period travel demand O-D matrices were assembled for a ‘Reference Case’ and for all LDF scenarios at both 2016 and 2026. The reference case is in line with nationally recognised trip generating databases and the specific approach for forecasting the reference case and the LDF scenarios are shown in Appendix 4. Assessment 2.17 Development Options are defined as alternative LDF housing and employment development spatial and quantum allocations to 2016 and 2026 prepared for the purposes of this study by both WDC and EBC for their respective areas. 2.18 Development Scenarios are defined as combinations of Development Options.
South Wealden and Eastbourne Transport Study (SWETS) November 2010
Page 6 18/11/2010
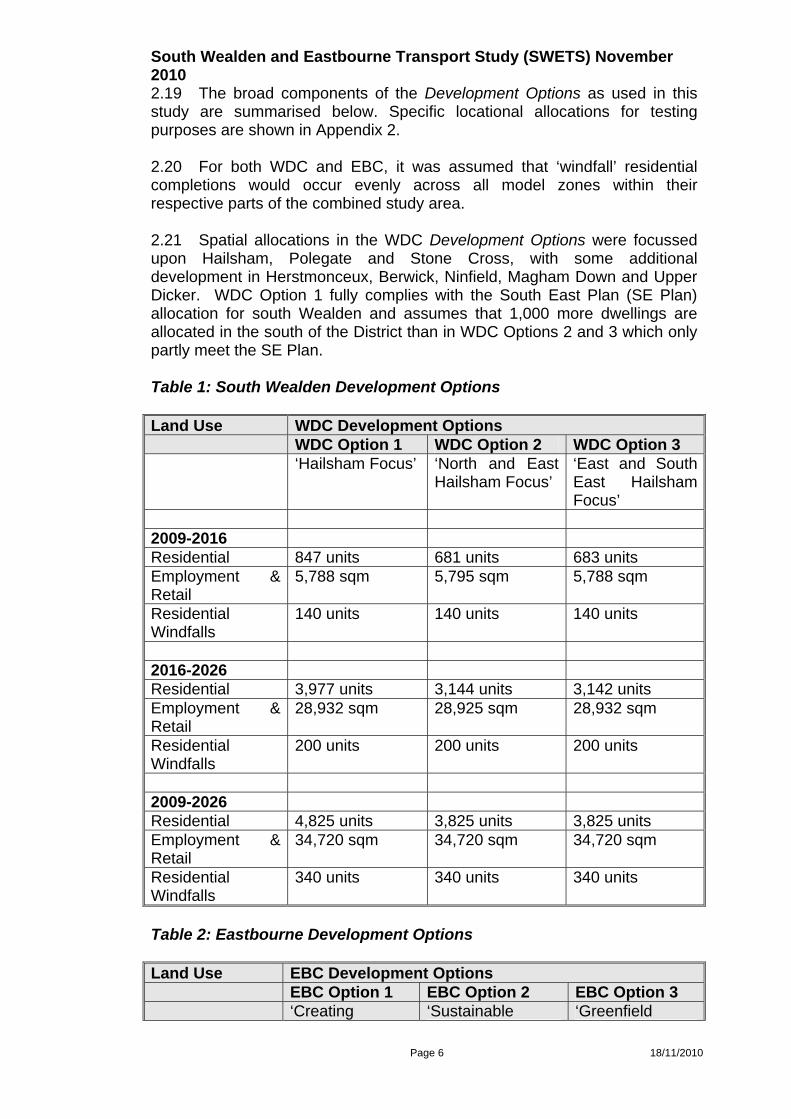
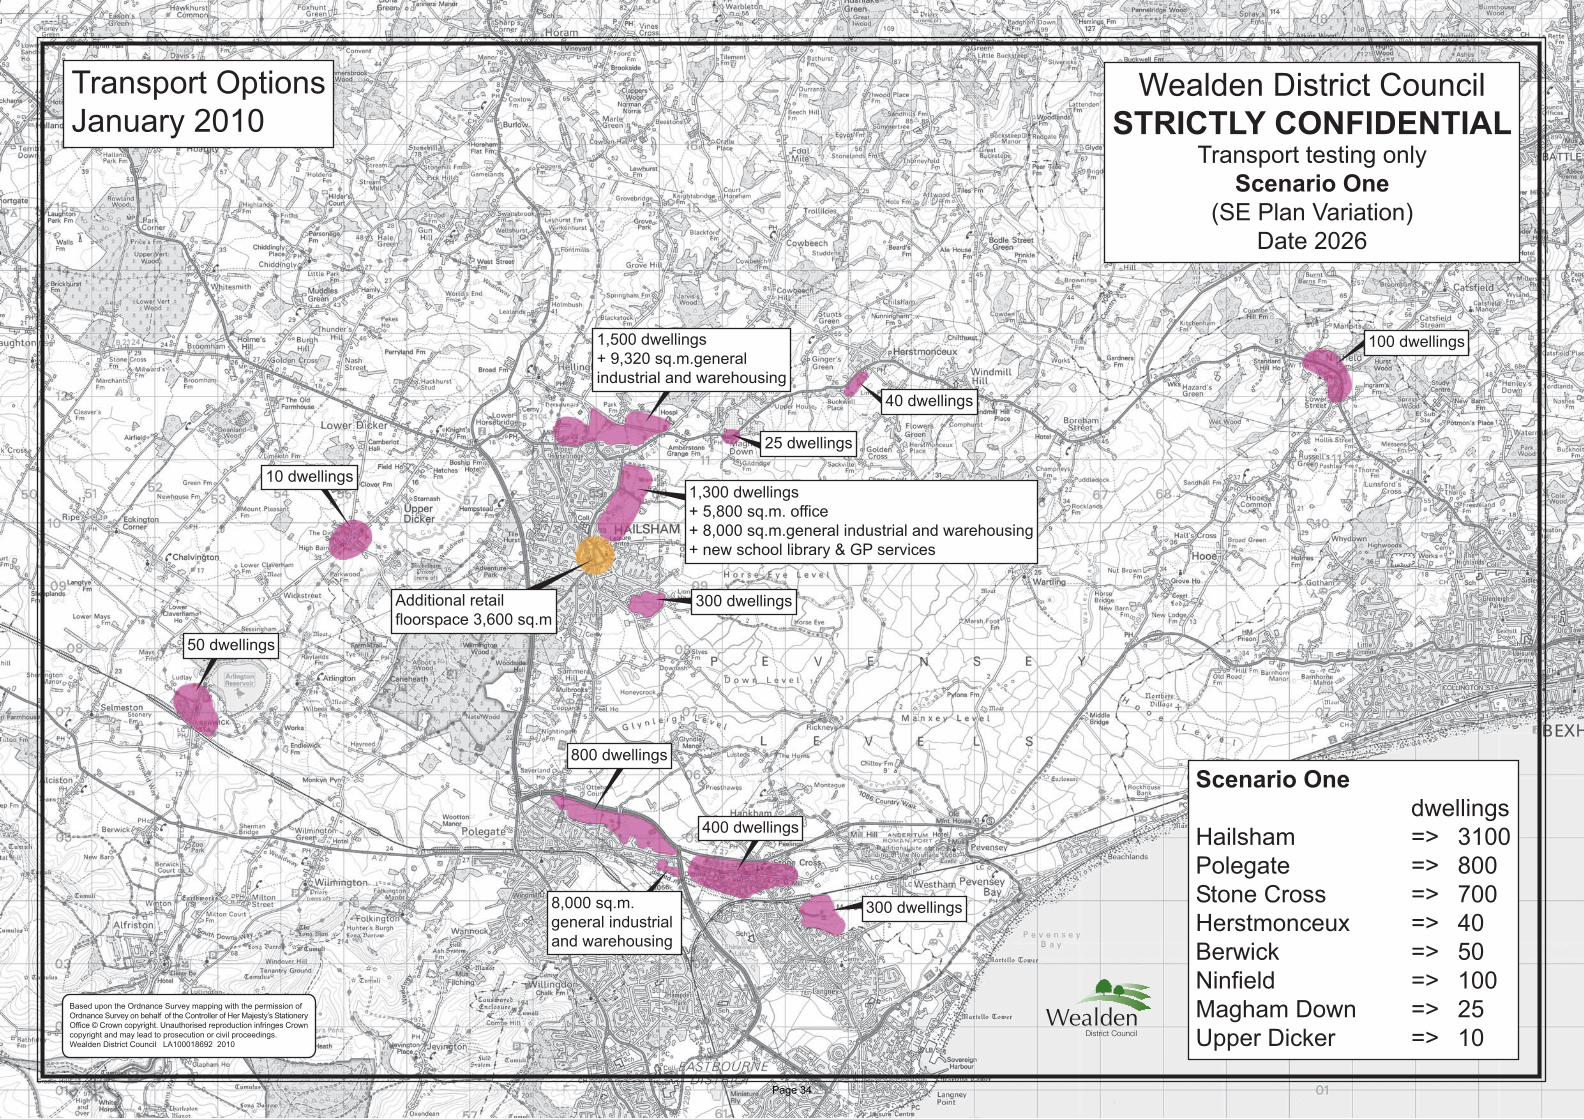
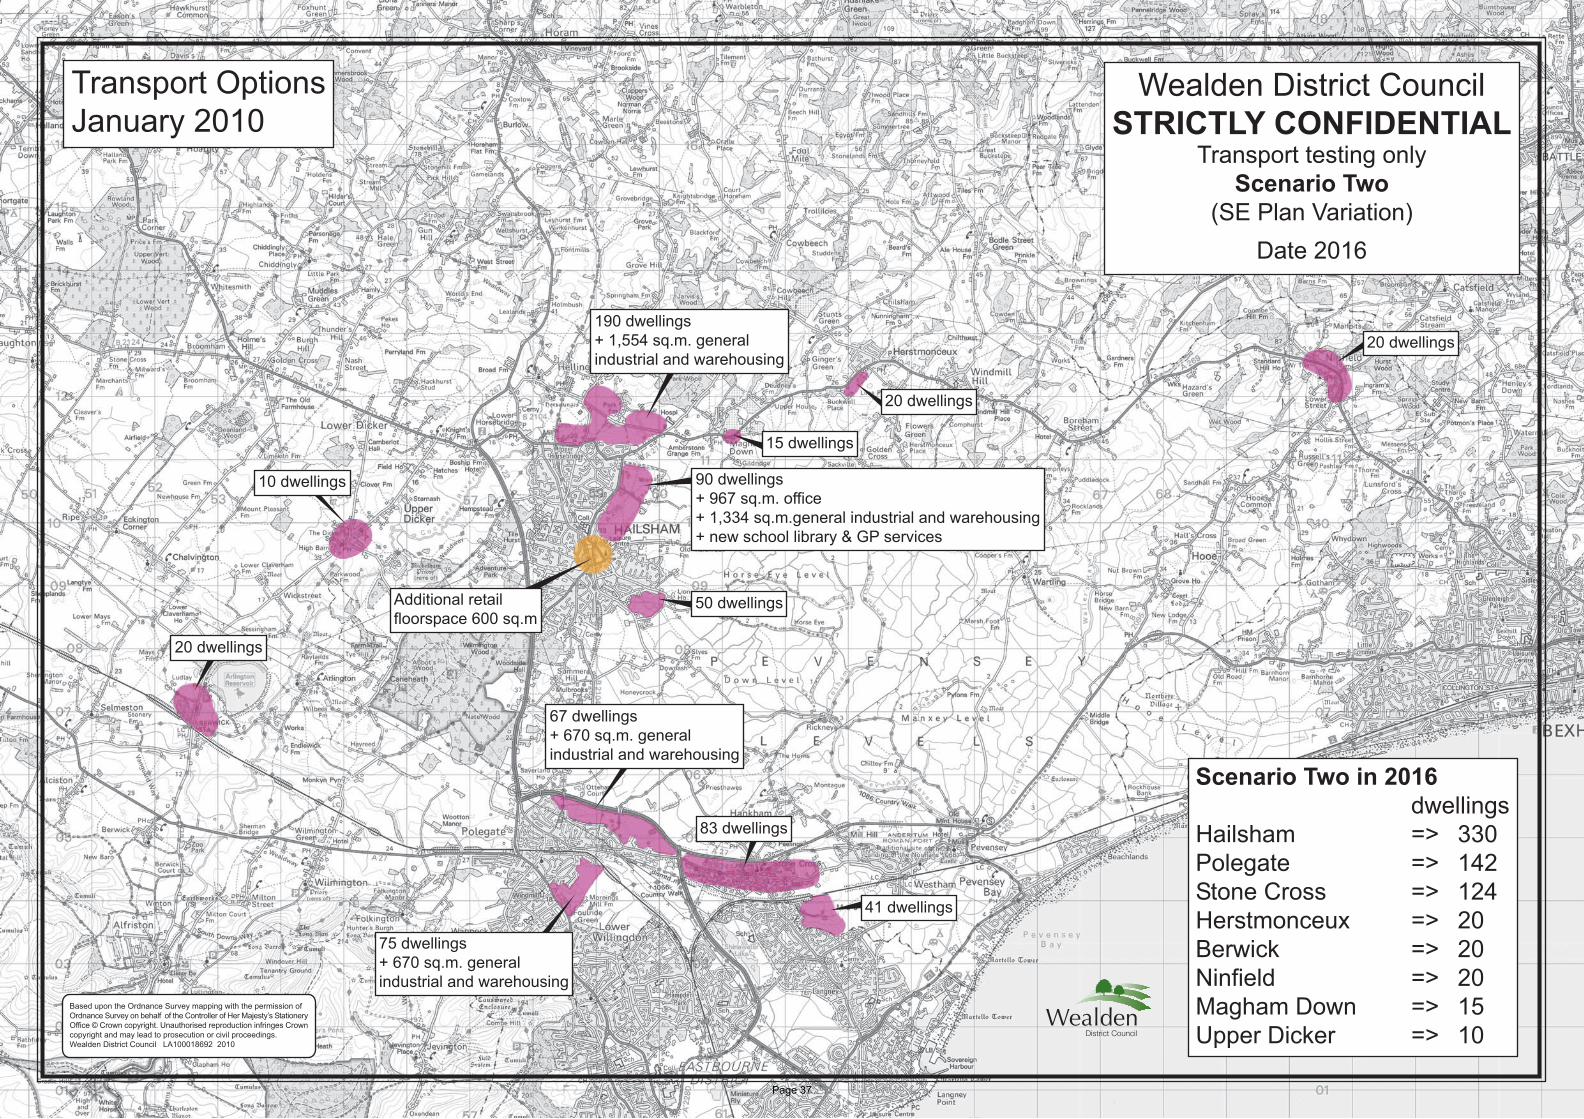
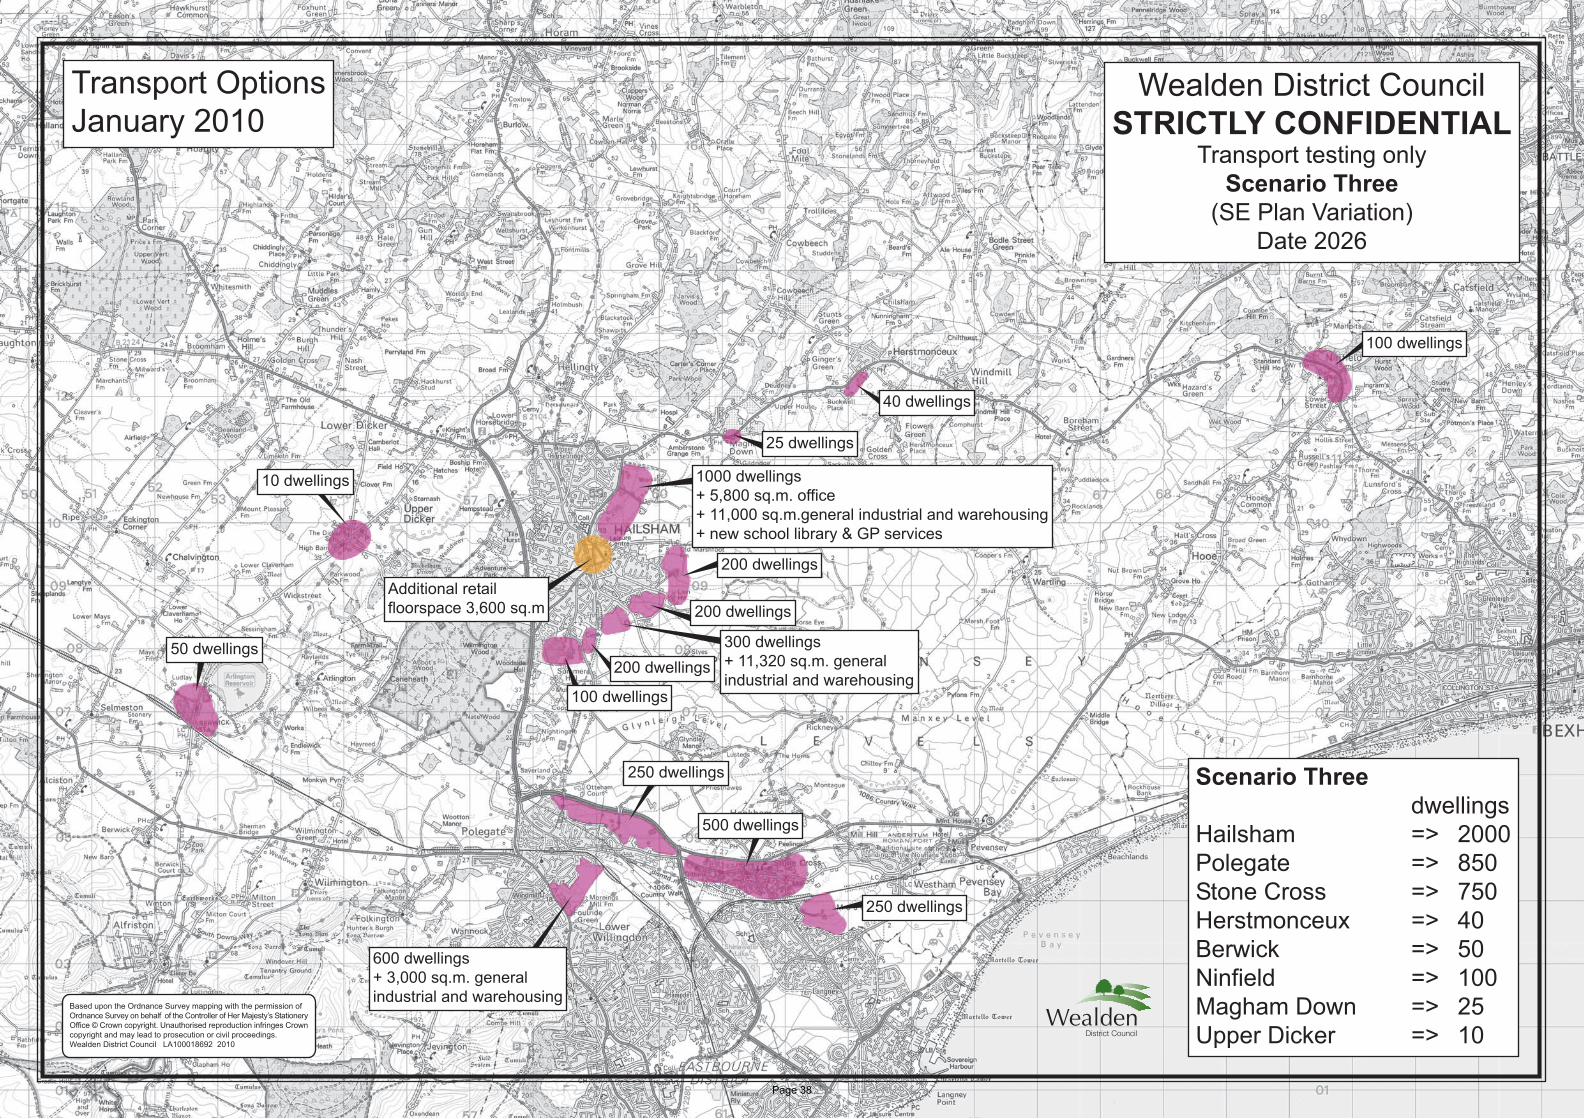
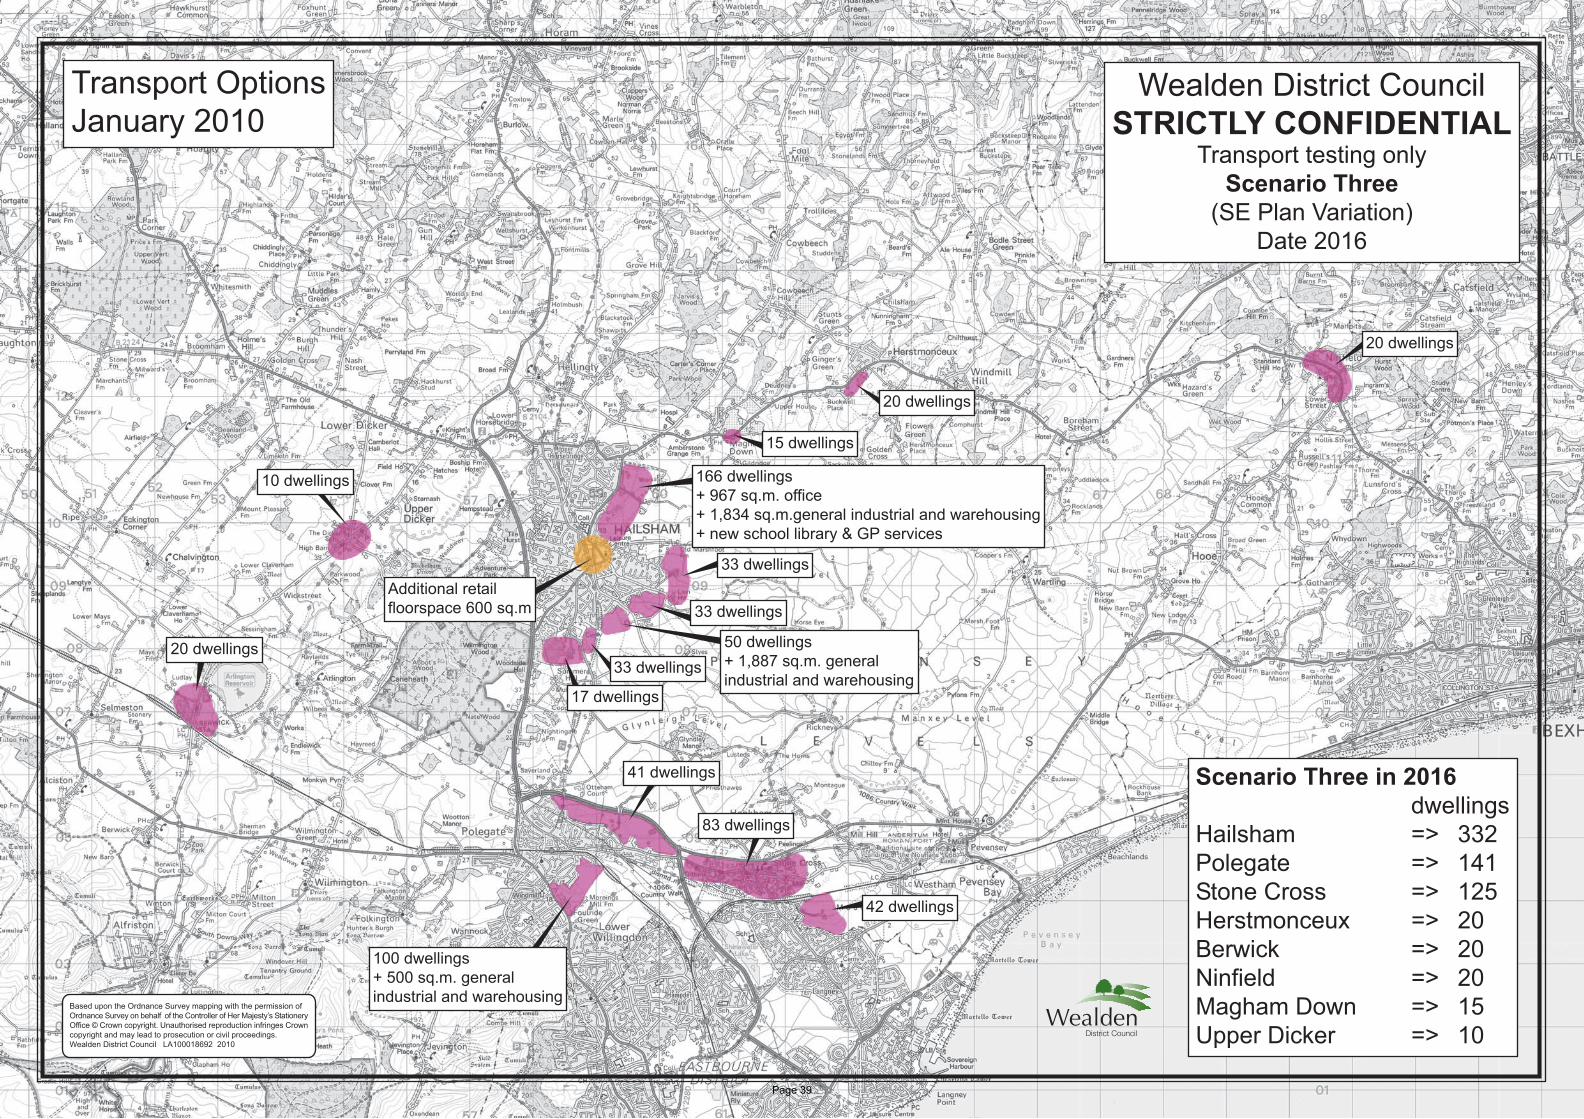
2.19 The broad components of the Development Options as used in this study are summarised below. Specific locational allocations for testing purposes are shown in Appendix 2. 2.20 For both WDC and EBC, it was assumed that ‘windfall’ residential completions would occur evenly across all model zones within their respective parts of the combined study area. 2.21 Spatial allocations in the WDC Development Options were focussed upon Hailsham, Polegate and Stone Cross, with some additional development in Herstmonceux, Berwick, Ninfield, Magham Down and Upper Dicker. WDC Option 1 fully complies with the South East Plan (SE Plan) allocation for south Wealden and assumes that 1,000 more dwellings are allocated in the south of the District than in WDC Options 2 and 3 which only partly meet the SE Plan. Table 1: South Wealden Development Options Land Use WDC Development Options WDC Option 1 WDC Option 2 WDC Option 3 ‘Hailsham Focus’ ‘North and East
Hailsham Focus’ ‘East and South East Hailsham Focus’
2009-2016 Residential 847 units 681 units 683 units Employment & Retail
5,788 sqm 5,795 sqm 5,788 sqm
Residential Windfalls
140 units 140 units 140 units
2016-2026 Residential 3,977 units 3,144 units 3,142 units Employment & Retail
28,932 sqm 28,925 sqm 28,932 sqm
Residential Windfalls
200 units 200 units 200 units
2009-2026 Residential 4,825 units 3,825 units 3,825 units Employment & Retail
34,720 sqm 34,720 sqm 34,720 sqm
Residential Windfalls
340 units 340 units 340 units
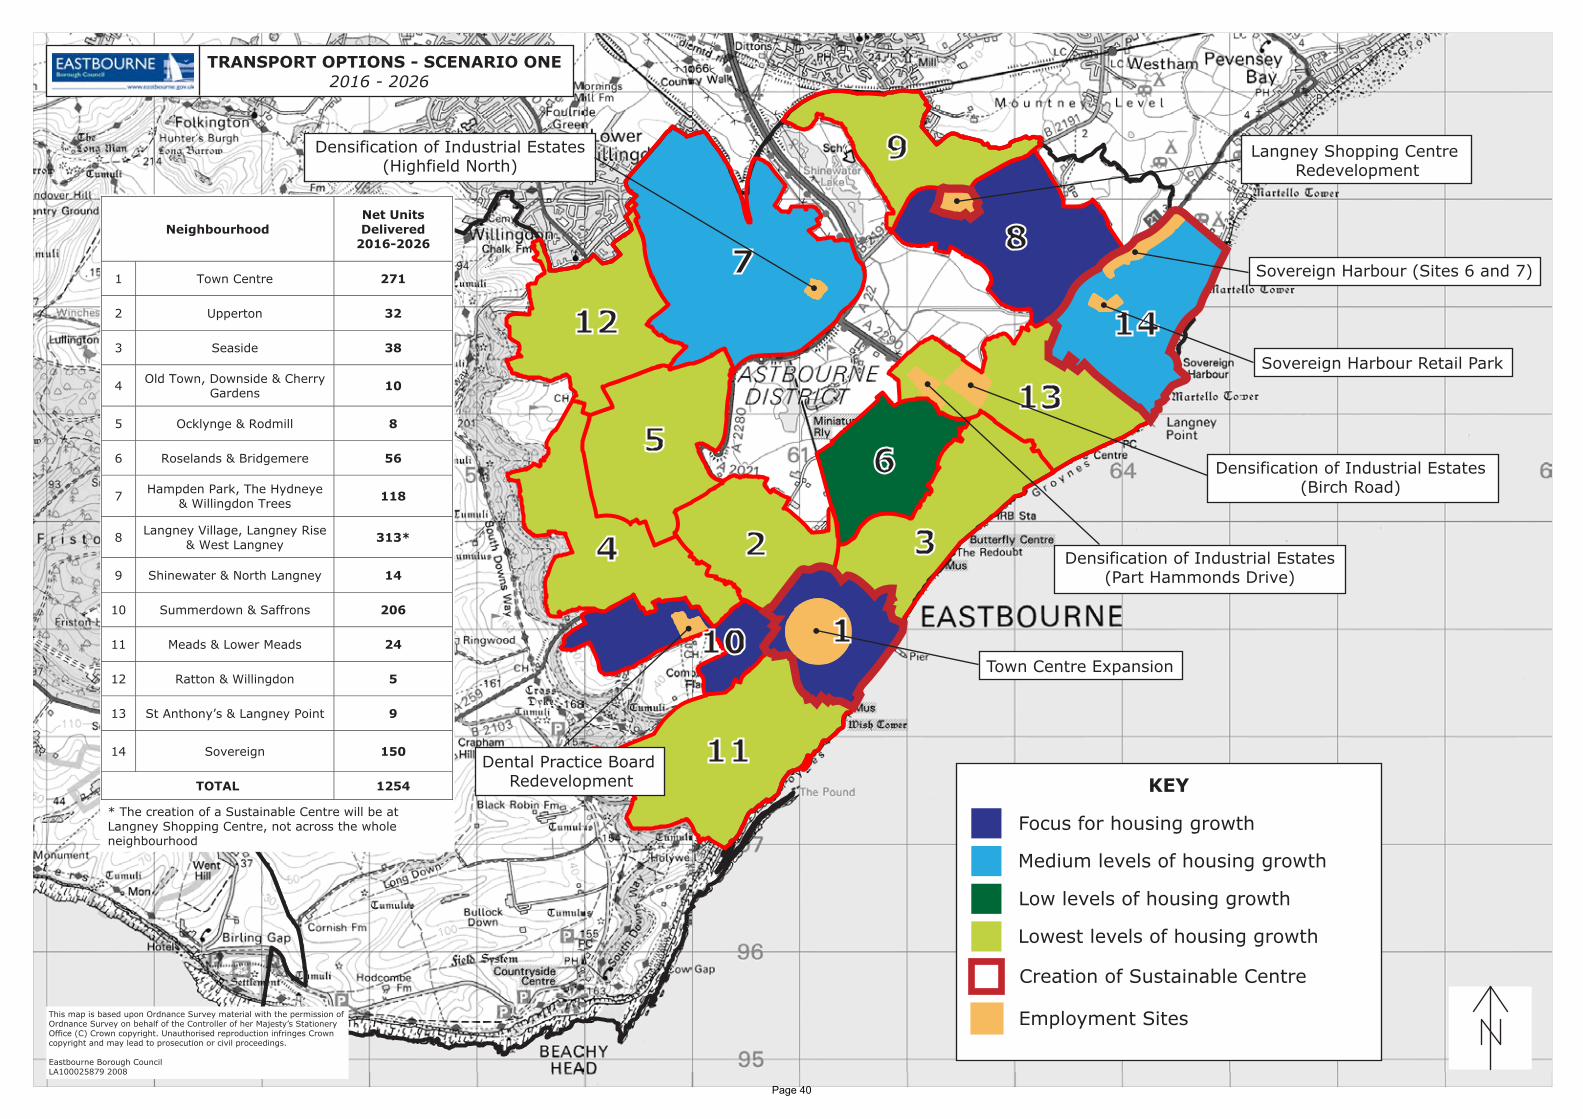
Table 2: Eastbourne Development Options Land Use EBC Development Options EBC Option 1 EBC Option 2 EBC Option 3 ‘Creating ‘Sustainable ‘Greenfield

South Wealden and Eastbourne Transport Study (SWETS) November 2010
Page 7 18/11/2010
Sustainable Centres’
Neighbourhoods’ extensions’
2009-2016 Residential 1,358 units 1,358 units 1,358 units Employment & Retail
0 sqm 0 sqm 0 sqm
Residential Windfalls
0 units 0 units 0 units
2016-2026 Residential 1,254 units 1,049 units 1,011 units Employment & Retail
138,625 sqm 135,685 sqm 193,685 sqm
Residential Windfalls
1,154 units 1,359 units 1,397 units
2009-2026 Residential 2,612 units 2,407 units 2,369 units Employment & Retail
138,625 sqm 135,685 sqm 193,685 sqm
Residential Windfalls
1,154 units 1,359 units 1,397 units
Infrastructure Issues 2.22 Infrastructure Issues testing modelled the impacts of each Development Scenario on the existing transport networks at the longer term 2026 planning horizon. Initial Infrastructure Issues testing was carried out for all nine possible Development Scenario combinations at 2026. 2.23 Subsequently it was agreed that further model assessments should be carried out only for those Development Scenarios based on full compliance with the SE Plan. No further testing was therefore carried out using WDC Options 2 and 3. In addition, the employment forecast in EBC Option 3 was amended to be the same as in EBC Option 2 (the difference being the removal of new ‘greenfield’ development in the Eastbourne Park area which would be expected to be conditional on the Eastbourne Park road proposals). 2.24 Combined Development Scenarios subject to testing through transport intervention stage were therefore:
2016 Scenario 1 (WDC Option 1 and EBC Option 1); 2026 Scenario 1 (WDC Option 1 and EBC Option 1);
Scenario 6 (WDC Option 1 and EBC Option 2); and Scenario 10 (WDC Option 1 and EBC Option 3a – as 3 but excluding additional Greenfield site employment allocations)
2.25 An additional scenario has been included, which is described as scenario 1 minus 10%. This scenario modifies scenario 1 and reduces traffic
South Wealden and Eastbourne Transport Study (SWETS) November 2010
Page 8 18/11/2010
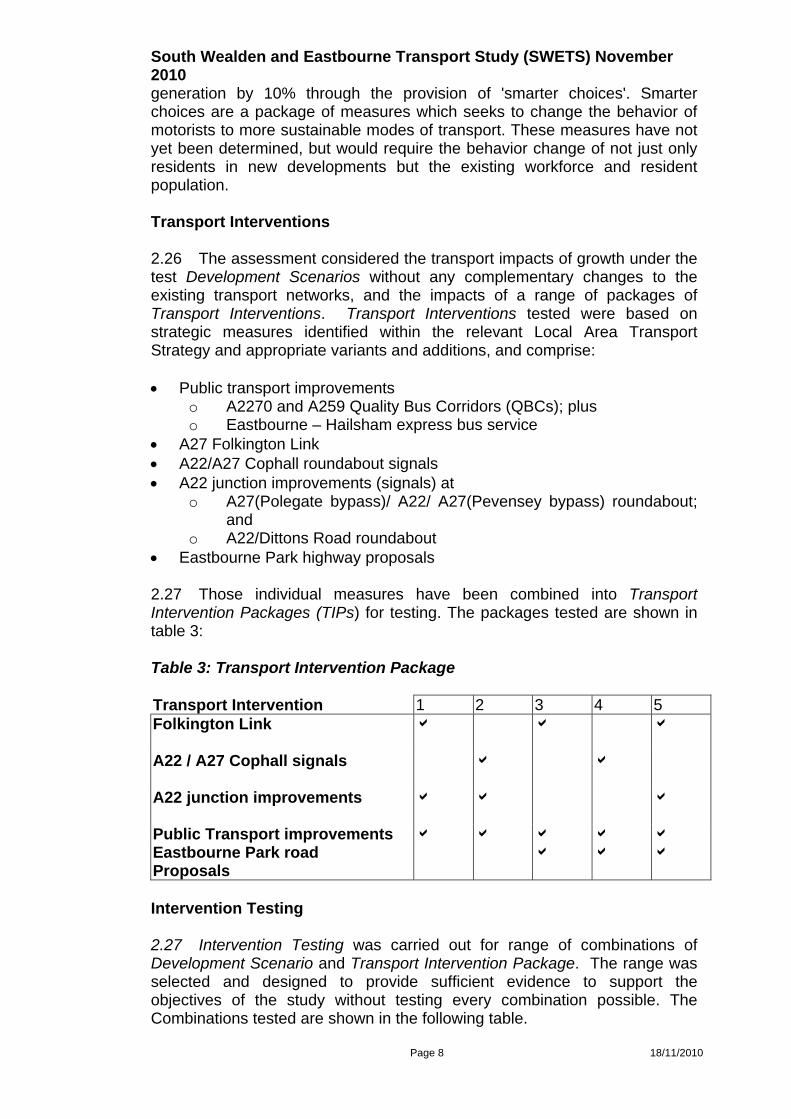
generation by 10% through the provision of 'smarter choices'. Smarter choices are a package of measures which seeks to change the behavior of motorists to more sustainable modes of transport. These measures have not yet been determined, but would require the behavior change of not just only residents in new developments but the existing workforce and resident population. Transport Interventions 2.26 The assessment considered the transport impacts of growth under the test Development Scenarios without any complementary changes to the existing transport networks, and the impacts of a range of packages of Transport Interventions. Transport Interventions tested were based on strategic measures identified within the relevant Local Area Transport Strategy and appropriate variants and additions, and comprise:
Public transport improvements
o A2270 and A259 Quality Bus Corridors (QBCs); plus o Eastbourne – Hailsham express bus service
A27 Folkington Link A22/A27 Cophall roundabout signals A22 junction improvements (signals) at
o A27(Polegate bypass)/ A22/ A27(Pevensey bypass) roundabout; and
o A22/Dittons Road roundabout Eastbourne Park highway proposals 2.27 Those individual measures have been combined into Transport Intervention Packages (TIPs) for testing. The packages tested are shown in table 3: Table 3: Transport Intervention Package Transport Intervention 1 2 3 4 5 Folkington Link
A22 / A27 Cophall signals
A22 junction improvements
Public Transport improvements Eastbourne Park road Proposals
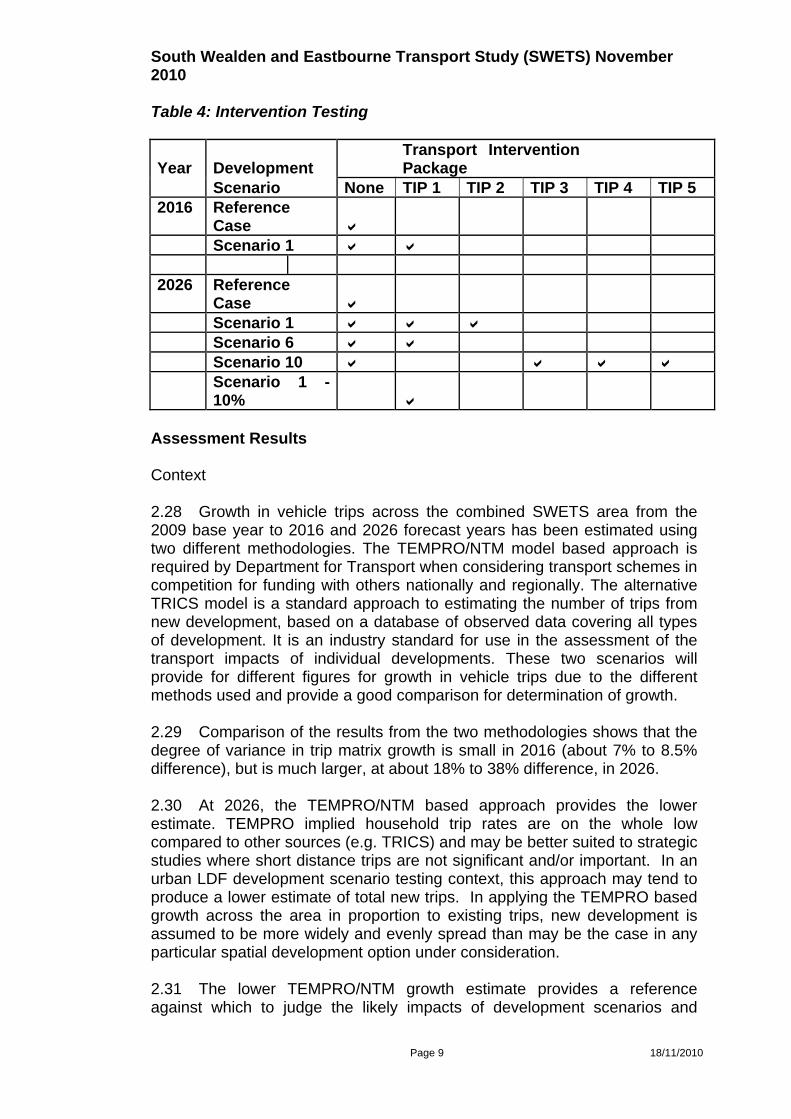
Intervention Testing 2.27 Intervention Testing was carried out for range of combinations of Development Scenario and Transport Intervention Package. The range was selected and designed to provide sufficient evidence to support the objectives of the study without testing every combination possible. The Combinations tested are shown in the following table.
South Wealden and Eastbourne Transport Study (SWETS) November 2010
Page 9 18/11/2010
Table 4: Intervention Testing
Year Development Transport Intervention Package
Scenario None TIP 1 TIP 2 TIP 3 TIP 4 TIP 5 2016 Reference
Case Scenario 1 2026 Reference
Case Scenario 1 Scenario 6 Scenario 10
Scenario 1 - 10%
Assessment Results Context 2.28 Growth in vehicle trips across the combined SWETS area from the 2009 base year to 2016 and 2026 forecast years has been estimated using two different methodologies. The TEMPRO/NTM model based approach is required by Department for Transport when considering transport schemes in competition for funding with others nationally and regionally. The alternative TRICS model is a standard approach to estimating the number of trips from new development, based on a database of observed data covering all types of development. It is an industry standard for use in the assessment of the transport impacts of individual developments. These two scenarios will provide for different figures for growth in vehicle trips due to the different methods used and provide a good comparison for determination of growth. 2.29 Comparison of the results from the two methodologies shows that the degree of variance in trip matrix growth is small in 2016 (about 7% to 8.5% difference), but is much larger, at about 18% to 38% difference, in 2026. 2.30 At 2026, the TEMPRO/NTM based approach provides the lower estimate. TEMPRO implied household trip rates are on the whole low compared to other sources (e.g. TRICS) and may be better suited to strategic studies where short distance trips are not significant and/or important. In an urban LDF development scenario testing context, this approach may tend to produce a lower estimate of total new trips. In applying the TEMPRO based growth across the area in proportion to existing trips, new development is assumed to be more widely and evenly spread than may be the case in any particular spatial development option under consideration. 2.31 The lower TEMPRO/NTM growth estimate provides a reference against which to judge the likely impacts of development scenarios and

South Wealden and Eastbourne Transport Study (SWETS) November 2010
Page 10 18/11/2010
packages of transport interventions at the most favourable extreme of the possible range. Testing of the transport implications of growth at this level without transport intervention is represented by the ‘Reference Case’. 2.32 The higher 2026 estimate results from application of TRICS derived trip rates for all proposed new development, with TEMPRO/NTM used only for through trips. 2.33 This approach may produce an upper estimate when applied as it reflects current travel practices. Therefore the impact of any proposed new development designed to promote the use of alternative transport methods is not taken into account. In addition, it is unable to take into account of possible (downward) changes in trip rates over time in response to demographic, economic and attitudinal factors outside its scope. It does, however, enable more spatially exact forecasts of where growth in transport demands are actually likely to arise in response to any particular spatial development strategy.
2.34 The higher, worst case, growth estimate has been used in all comparative testing carried out in this study. All conclusions are therefore robust at the higher extreme of the possible range of growth outcomes, and is taken into account when undertaking analysis of results. 2.35 A further test was carried out at 2026 for Development Scenario 1 + TIP 1 with the matrix reduced by 10% (i.e. the upper end of the possible range – approx +18 to +38% - reduced to approx +24%). This test was undertaken to assess the sensitivity of conclusions at the upper growth level to a more central estimate of growth (also allowing for about 3-4% reduction resulting from area-wide promotion of other non-infrastructure ‘Smarter Choices’ initiatives). 2.36 Transport impacts have been expressed using a range of transport network statistics, including:
private / public transport modal share; highway network total travel time, distance and fuel consumption, and
average vehicle speed; ‘junction stress’ – expressed as the percentage of key junctions on major
routes that have one or more arm(s) approaching or at capacity (key junctions are those which are either important nodes in the network or those which are significant means of access to/from adjacent areas); and
Increase / decrease in flow (compared to 2009 base year) on major routes.
2.37 Appendix 5 shows the summarised results. 2.38 Appendix 6 shows the detailed model outputs for junction traffic loadings, with those showing ‘junction stress’ being identified using a traffic-light colour coding system.

South Wealden and Eastbourne Transport Study (SWETS) November 2010
Page 11 18/11/2010
2.39 Appendix 7 shows ‘dot diagrams’ of junctions under stress, mapped on an Ordnance Survey base of the study area. 2.40 Detailed reviews of the results and their implications for EBC and WDC separately are presented below. Eastbourne (EBC) 2.41 In 2009 base year, 10-20% of junctions are stressed (depending on peak hour), and average network speed is about 38 kph (24 mph). Overall this is not unacceptable for such an urban area. 2.42 By 2016, in both Reference Case and Development Scenario 1, there is a slight deterioration but overall network average speeds, and the percentage of key junctions on major routes experiencing stress, are similar to 2009. 2.43 By 2026 (Low growth estimate – the Reference Case), the number of junctions that are stressed has broadly doubled to 20-35%, but average network speed is less changed at about 35 kph (22 mph). 2.44 By 2026 (High growth estimate), and with no transport interventions, the transport impacts of the three Development Scenarios are more substantial. Average network speeds reduce to about 25-28kph (16-18 mph) and the percentage of junctions showing stress increases to 40-50%. The overall network impacts of the three Development Scenarios are similar, although Scenario 1 performs slightly less well than both Scenarios 6 and 10 in the PM peak. 2.45 With a Transport Interventions Package (TIP 1) including the A2270 and A259 Quality Bus Corridors QBCs, junction improvements at the northern end of A22 Jubilee Way, and the A27 Folkington Link, average speeds can be improved to about 30kph (19 mph) and junctions at stress reduced to 35-40%. Inclusion of signals at Cophall roundabout (as in TIP 2) instead of the Folkington Link (as in TIP 1) would only give about half of this improvement. Scenario 6 remains slightly the better performer compared to Scenario 1. 2.46 Including the Eastbourne Park road proposals in Scenario 10 (+ TIP 5) improves its performance to equal or slightly better than Scenario 6 (+ TIP 1) depending on peak hour. Both Folkington Link and the A22 Jubilee Way junction improvements contribute to the improved Scenario 10 (TIP 5) performance compared to Scenario 10 alone.
2.47 Regardless of Development Scenario and Transport Interventions Package, outstanding highways issues at 2026 include traffic volumes on the town centre ring road, and the competing demands for capacity (public transport / private) on the identified QBC corridors. 2.48 A 10% matrix reduction at 2026 (equivalent to just under the mid-point of the low / high forecasting range) would have a roughly pro-rata effect on
South Wealden and Eastbourne Transport Study (SWETS) November 2010
Page 12 18/11/2010
impacts (i.e. transport impacts lie just under halfway between those arising from low and high growth). 2.49 Key conclusions for Eastbourne are:
In 2009 base year, 10-20% of junctions are stressed (depending on
peak hour), and average network speed is about 38 kph (24 mph). Overall this is not unacceptable for such an urban area.
Additional trips in both forecast years increase traffic pressures on the highway network. By 2016 there is a slight deterioration in overall network average speeds, and in the percentage of key junctions on major routes experiencing stress. By 2026 (high growth), average highway speeds drop to about 25 kph (from about 38 kph in 2009) with about half of all key junctions on major roads showing stress.
The network performance indicators used suggest that, within the range of development tested, the highway network responds in a fairly consistent manner, i.e. there does not appear to be a development quantum ‘tipping point’ beyond which additional development gives rise to disproportionately large highway performance consequences.
There is no clear front runner in the choice between the three Eastbourne Development Options. Option 1 performs least well overall and Option 3a slightly the best, but the differences are small and often limited to only one of the peak hours.
All Transport Intervention Packages tested can partially address the issues arising in 2026.
It is unlikely that the marginal transport impact advantages of Scenario 10 (EBC Option 3a) + TIP 5 compared to Scenario 6 (EBC Option 2) + TIP 1 would outweigh the considerably greater cost of the Eastbourne Park road proposals in TIP5 in a more comprehensive cost-benefit analysis.
The preferred choice would therefore appear to lie between Development Scenarios 1 and 6 (i.e. EBC Development Options 1 and 2), together with Transport Intervention Packages 1 or 2. The assessment indicates that Scenario 6 has an overall network advantage, and that TIP 1 (which includes Folkington Link) is better than TIP 2 (which includes signals at Cophall roundabout instead). The preferred combination is therefore EBC Development Option 2 plus Transport Intervention Package 1.
In the absence of the Folkington link, or equivalent, in any regional funding then Transport Intervention Package 2 would mitigate the impact on the transport network sufficient to allow development to progress.
Regardless of Development Scenario and Transport Intervention Package, outstanding issues at 2026 include traffic volumes on the town centre ring road, and the competing (public / private transport) demands for available capacity on the identified QBC corridors.
South Wealden (WDC)
South Wealden and Eastbourne Transport Study (SWETS) November 2010
Page 13 18/11/2010
2.50 In 2009 base year, only 7-15% of junctions are stressed, and average network speed is about 50-55 kph (31-34 mph). Overall this indicates a network generally able to accommodate current flows.
2.51 By 2016, in both Reference Case (lower case scenario) and Development Scenario 1 (higher case scenario), there is a slight deterioration in overall network average speeds. The percentage of key junctions on major routes experiencing stress increases markedly, particularly in the PM peak, but often as a result of relatively small changes in performance around the threshold values of flow: capacity ratio adopted in the assessment. 2.52 These changes in 2016 PM peak network performance concentrate where the A27 and A22/A2270 corridors intersect. The major component of housing growth 2009-2016 in south Wealden is in Hailsham, but traffic growths on the A22N and A27 are not only higher than the average network growth 2009-2016, but are consistently higher in the Reference Case than in Scenario 1. This indicates that both strategic and local factors contribute to change at this critical part of the network with strategic growth the more important. 2.53 Inclusion of Transport Interventions Package 1 at 2016 substantially improves overall network performance to as good as or better than (depending on peak hour) the 2009 base year. The main contributor in TIP 1 being the Folkington Link, which resolves capacity issues in 2016 at the A22/A2070.
2.54 By 2026 (Low growth estimate – the Reference Case), the number of junctions that are stressed has substantially increased to 22-38%, but average network speed remains relatively high at about 45-50 kph (28-31 mph).
2.55 By 2026 (High growth estimate), and with no transport interventions, the transport impacts of the three Development Scenarios increase. Average network speeds reduce to about 40-44 kph (25-27 mph) and the percentage of junctions showing stress increases to 50-57%. The overall network impacts of the three Development Scenarios, with no Transport Interventions, are similar. Without Transport Interventions, nearly all major junctions in and around Hailsham and Polegate suffer stress.
2.56 With a Transport Interventions Package (TIP 1) including the A2270 (and in Eastbourne the A259) Quality Bus Corridors, junction improvements at the northern end of A22 Jubilee Way, and the A27 Folkington Link, average speeds for Development Scenarios 1 and 6 can be improved to about 45-50 kph (28-31 mph) and junctions at stress reduced to 32-35%. Junctions within Polegate no longer suffer stress and the number in Hailsham town is halved. Inclusion of signals at Cophall roundabout (as in TIP 2) instead of the Folkington Link (as in TIP 1) would only give about half of this improvement. 2.57 Including the Eastbourne Park road proposals in Development Scenario 10 (and TIP 5) improves its performance in the south Wealden area
South Wealden and Eastbourne Transport Study (SWETS) November 2010
Page 14 18/11/2010
to equal that of Development Scenarios 1 or 6 (with TPI 1). Both Folkington Link and the A22 improvements contribute to the improved Scenario 10 performance. 2.58 Regardless of Development Scenario and Transport Interventions Package, outstanding issues include traffic volumes on the A271 and A22 around Hailsham, and on Ersham Road.
2.59 A 10% matrix reduction at 2026 (equivalent to just under the mid-point of the low/high forecasting range) would have a roughly pro-rata effect on impacts (i.e. transport impacts lie just under halfway between those arising from low and high growth). 2.60 Key conclusions for south Wealden are:
In 2009 base year, only 7-15% of junctions are stressed, and average
network speed is about 50-55 kph (31-34 mph). Overall this indicates a network generally able to accommodate current flows;
Additional trips in both forecast years increases traffic pressures on the highway network. However, the range of network performance indicators used suggests that, within the range of development tested, the highway network responds in a fairly consistent manner, i.e. there does not appear to be a ‘tipping point’ beyond which additional development gives rise to disproportionately large highway performance consequences.
Without any Transport Interventions, transport issues in 2016 concentrate where the A27 and A22/A2270 corridors intersect, principally in the PM peak and largely as a result of relatively small changes in performance around the threshold values of flow: capacity ratio adopted in the assessment. Both strategic and local factors contribute to change at this critical part of the network. The full Transport Intervention Package 1 (TIP 1) resolves those issues. Whilst, on the basis of this work, delivery of the WDC 2016 Development Option cannot be said to be contingent on delivery of TIP 1, the travel demands of those developments contribute significantly to the need to provide a range of transport interventions, including an improvement at Polegate, within the 2009-2026 period;
Without any Transport Interventions, transport capacity issues in 2026 would be widespread throughout Hailsham and Polegate. As far as can be determined from this work, the full SE Plan housing allocation to 2026 can be accommodated within south Wealden with an appropriate Transport Interventions Package including an improvement at the A27/A22 crossing. Signals at Cophall roundabout (as in TIP 2) would only give about half of the potential mitigation of the Folkington Link (as in TIP 1). Folkington Link (or something similar) is desirable not only to respond to increasing strategic transport demands and to ensure delivery of the WDC 2026 Development Option, but also to maximise opportunities for reallocation of highway network capacity to buses along the intended Quality Bus Corridor. If Folkington Link is not able to be provided, a less effective alternative such as signals at Cophall roundabout may allow delivery of the WDC 2026 Development Option, albeit with more residual transport issues (such as at the signalised
South Wealden and Eastbourne Transport Study (SWETS) November 2010
Page 15 18/11/2010
junctions of A27/A22/A2270 and, important for Quality Bus Corridor delivery, A2270 / Wannock Road / Polegate High Street ).
In respect of their impacts on south Wealden, there is no clear preference in the choice between the three Eastbourne Development Scenarios. The differences are small and often limited to only one of the peak hours.
Regardless of Development Scenario and Transport Interventions Package, outstanding issues at 2026 include traffic pressures on the A271 and A22 around Hailsham, on B2104 Ersham Road and its junction with B2247 Dittons Road, and the junction of A259 / Pevensey High Street.
Issues relating to Phase I SWETS 2.61 The work undertaken for the Phase I study does not provide for: Identification of all the transport implications of individual developments.
The exercise looks at the aggregate impacts of a particular Development Scenario and best represents those impacts in a strategic network-wide sense. The specific contributions of an individual development site allocation to the need for particular transport improvements cannot generally be identified. Other more local impacts, and consequential needs for more local transport network improvements, including improvements to pedestrian and cycle networks cannot be identified. Identification of transport issues and programming of Transport Interventions other than within the two broad assessment periods of 2009-2016 and 2016-2026. More detailed timescale advice would be dependent on the modelling process being repeated for other forecast years, i.e. 2021 if 3 broad assessment / programming periods (2009-2016, 2016-2021 and 2021-2026) was sufficient. If required, for each such new forecast year the whole modelling process would have to be replicated, from and including the preparation of suitable planning data by both WDC and EBC for that forecast year. Advising on the transport impacts of new development spatial distributions representing significant changes to those included in the Development Options tested as part of this work. Any such changes would require re-testing as a new Development Option. If required, for each such new development option the whole modelling process would have to be replicated, from and including the preparation of suitable planning data by both WDC and EBC for each required forecast year. Other transport related costs and benefits, including safety, environmental, economic and social. Other than the extent to which such aspects have a proportional relationship with differences in transport network performance impacts, this is outside the scope of the exercise undertaken.
South Wealden and Eastbourne Transport Study (SWETS) November 2010
Page 16 18/11/2010
Full Business Case support for promotion or rejection of identified highway schemes (e.g. Folkington Link and Eastbourne Park road proposals).
The work undertaken provides part of the evidence base for any such Business Case, but further work would be necessary to provide an appropriate level of support for detailed scheme assessment.
3.0 Phase II Study Background to Phase II 3.1 Between January 2010 and August 2010 WDC developed the spatial distribution of growth based upon the outcome of SWETS Phase I, the completion of the Wealden Strategic Housing Land Availability Assessment (SHLAA), the sustainability appraisal of broad locations and the revocation of the Regional Spatial Strategy the South East Plan (in July 2010). 3.2 As a result, the overall housing and employment provision was reduced, and the preferred locations for development were refined. In, addition it was also necessary to increase the plan period by one year to 2027, in order to provide a plan period of 15 years from anticipated adoption. 3.3 EBC had also undertaken further work by refining employment options, extending the plan period by one year and agreeing an approach to proposed housing distribution. 3.4 As a result of the change in strategy, especially with particular regard to the revocation of the South East Plan, WDC commissioned further work by TPi to test the new emerging proposed spatial strategy. In addition, WDC sought to build upon Phase I and sought to resolve concerns raised at Hailsham Town Centre and the A271. East Sussex County Council assisted in the management and the interpretation of the modelling, and EBC supplied a further iteration of their spatial distribution. Scope of Phase II Study 3.5 The study was solely required to inform the preparation of, and to provide an appropriate evidence base for, the LDF Core Strategy for Wealden District. The study was commissioned in order to: 1. Provide advice, based on modelling, of the ability of the highway network,
with prescribed interventions, to accommodate the levels and distributions of development being considered for the Core Strategy taking into account the proposed development in the emerging Eastbourne Core Strategy; and
2. Provide advice on the opportunities that may exist for mitigating any particular adverse transport impacts that are highlighted by the modelling, and their likely effectiveness.
South Wealden and Eastbourne Transport Study (SWETS) November 2010
Page 17 18/11/2010
3.6 The brief specifically required advice on the transport impacts of development, and potential transport interventions necessary to support growth, in the following parts of the study area highway network: 1. Hailsham town centre; 2. The A271 to the north of Hailsham (Boship roundabout to Battle Road); 3. The A22 to the west of Hailsham, including Hempstead Lane junction; 4. North/south routes between Hailsham and the Polegate / Eastbourne
area (A22 and B2104 Hailsham Road) 5. The crossing of the north/south A22 and the east/west A27. Scope of the Study 3.7 The WDC and EBC scenarios were required to be tested for two time scenarios one medium term and one long term with: No transport interventions; and A standard package of transport interventions (to be agreed) 3.8 For the longer term assessment year, work was also required to provide advice on: the individual transport impacts of disaggregated elements of the
development data (north Hailsham, east Hailsham and Polegate); associations between those impacts and elements of the standard
transport interventions package; transport impacts, and consequences for delivering the longer term
development scenario, of a range of additional potential highway transport interventions.
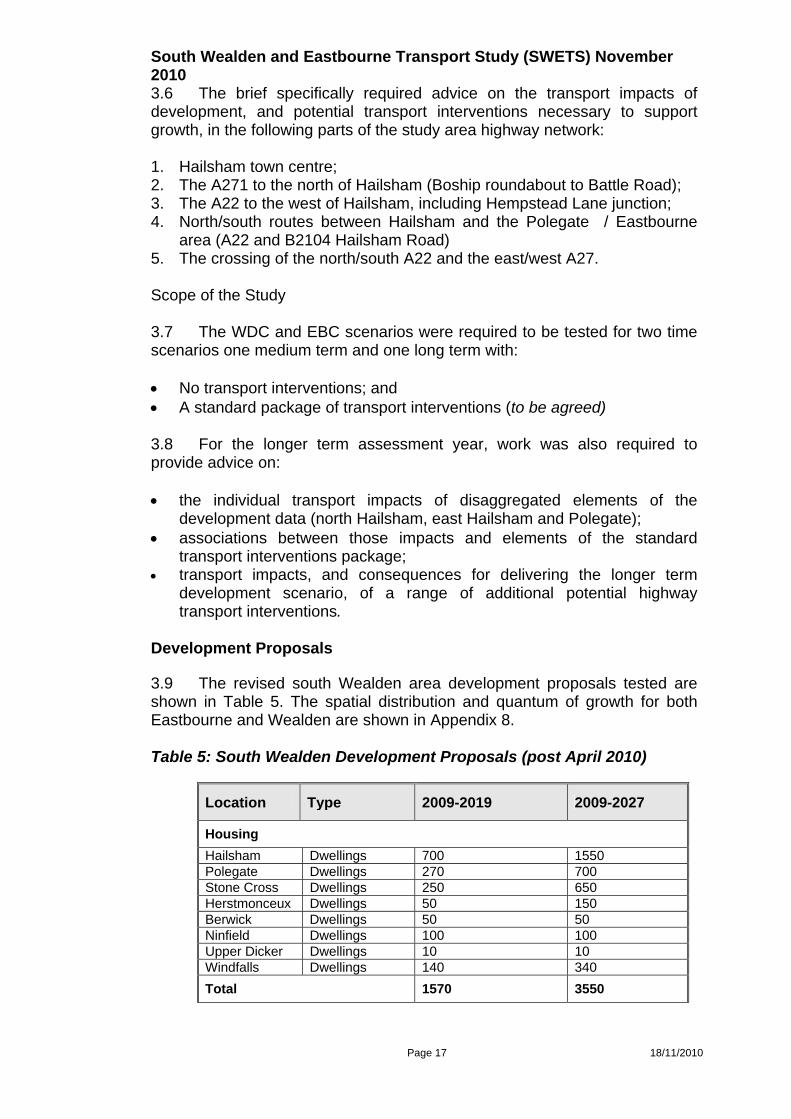
Development Proposals 3.9 The revised south Wealden area development proposals tested are shown in Table 5. The spatial distribution and quantum of growth for both Eastbourne and Wealden are shown in Appendix 8. Table 5: South Wealden Development Proposals (post April 2010)
Location Type 2009-2019 2009-2027
Housing
Hailsham Dwellings 700 1550 Polegate Dwellings 270 700 Stone Cross Dwellings 250 650 Herstmonceux Dwellings 50 150 Berwick Dwellings 50 50 Ninfield Dwellings 100 100 Upper Dicker Dwellings 10 10 Windfalls Dwellings 140 340
Total 1570 3550
South Wealden and Eastbourne Transport Study (SWETS) November 2010
Page 18 18/11/2010
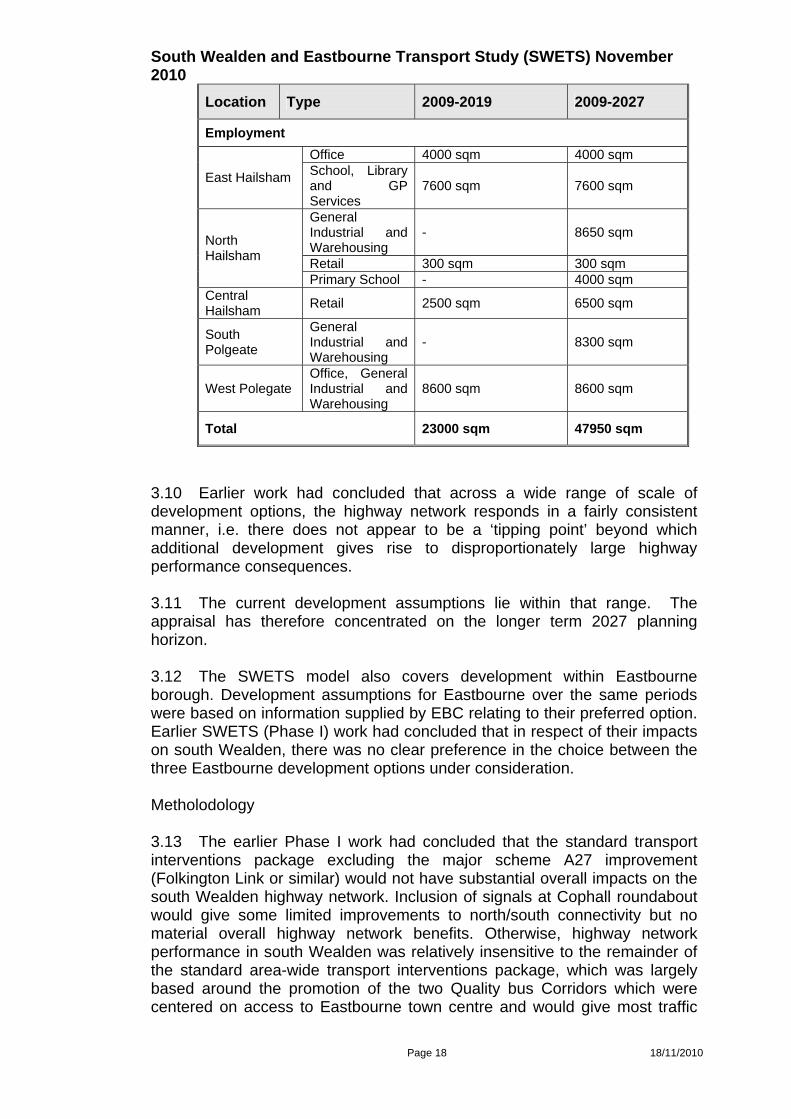
Location Type 2009-2019 2009-2027
Employment
Office 4000 sqm 4000 sqm
East Hailsham School, Library and GP Services
7600 sqm 7600 sqm
General Industrial and Warehousing
- 8650 sqm
Retail 300 sqm 300 sqm
North Hailsham
Primary School - 4000 sqm Central Hailsham
Retail 2500 sqm 6500 sqm
South Polgeate
General Industrial and Warehousing
- 8300 sqm
West Polegate Office, General Industrial and Warehousing
8600 sqm 8600 sqm
Total 23000 sqm 47950 sqm
3.10 Earlier work had concluded that across a wide range of scale of development options, the highway network responds in a fairly consistent manner, i.e. there does not appear to be a ‘tipping point’ beyond which additional development gives rise to disproportionately large highway performance consequences.
3.11 The current development assumptions lie within that range. The appraisal has therefore concentrated on the longer term 2027 planning horizon. 3.12 The SWETS model also covers development within Eastbourne borough. Development assumptions for Eastbourne over the same periods were based on information supplied by EBC relating to their preferred option. Earlier SWETS (Phase I) work had concluded that in respect of their impacts on south Wealden, there was no clear preference in the choice between the three Eastbourne development options under consideration. Metholodology 3.13 The earlier Phase I work had concluded that the standard transport interventions package excluding the major scheme A27 improvement (Folkington Link or similar) would not have substantial overall impacts on the south Wealden highway network. Inclusion of signals at Cophall roundabout would give some limited improvements to north/south connectivity but no material overall highway network benefits. Otherwise, highway network performance in south Wealden was relatively insensitive to the remainder of the standard area-wide transport interventions package, which was largely based around the promotion of the two Quality bus Corridors which were centered on access to Eastbourne town centre and would give most traffic
South Wealden and Eastbourne Transport Study (SWETS) November 2010
Page 19 18/11/2010
benefits to those corridors within Eastbourne. Unresolved issues in the south Wealden area included traffic pressures on the A271 and A22 around Hailsham, on B2104 Ersham Road and its junction with B2247 Dittons Road, and the junction of A259 / Pevensey High Street. 3.14 In light of earlier Phase I work, the assessment of impacts and the contributions of development proposals and more local highway proposals in this study have been carried out by comparison to forecasts assuming no other transport interventions in place, with associated commentary where necessary on the potential effects of the latter. 3.15 Using the model, development related transport impacts are measurable as changes in network performance for a given forecast year plus development option compared to the base year (or to a different development option for the same forecast year). Network performance indicators can reflect overall levels of service through to specific impacts at individual locations. The mitigation afforded by transport enhancements / improvements can be assessed by comparing network performance with and without those measures.
3.16 In this report, network performance has principally been demonstrated by considering: General highway network summary statistics, including overall network
total travel time, distance and fuel consumption, and average vehicle speed;
Route statistics, including journey times and levels of traffic flow on important routes in the highway network; and
Junction statistics, measuring the levels of ‘junction stress’ – expressed as the percentage of key junctions on major routes that have one or more arm(s) approaching or at capacity (key junctions are those which are either important nodes in the network or those which are significant means of access to/from adjacent areas).
3.17 The model can also broadly estimate the extent to which individual development areas contribute to traffic increases at identified junctions – the ‘attributable effects’. This has been carried out for this report, the junctions used being those included in the above ‘junction statistics’ assessment. 3.18 In Phase II, the modelling has been based on the TRICS model (high estimates of traffic), as opposed to the TEMPRO or indeed using the scenario of a 10% reduction due to smarter choices. This relies upon previous trends and is not modified to take into account any behavioural change created by sustainable development, and provides the worst case scenario of traffic impact, which needs to be considered when undertaking analysis and drawing conclusions. Therefore any behavioural change in use of transport, including by the implementation of the Quality Bus Corridor will have a positive contribution of the transport network.
Appraisal Results

South Wealden and Eastbourne Transport Study (SWETS) November 2010
Page 20 18/11/2010
Network summary statistics 3.19 Summary overall highway network statistics are shown in Table 6 for base year 2009 and forecast year 2027 for both AM peak and PM peaks. Table 6: Network Summary Statistics (South Wealden)
2009 Base Year 2027 Criteria
AM PM AM PM
Total time (pcu hrs per hr)
1972 2340 3160 3456
Total distance (pcu kms per hr)
105659 109106 136400 134147
Queuing Delay (pcu hrs per hr)
303 312 577 496
Av. Speed (kph)
54 47 43 39
Total fuel consumption (ltrs per hr)
8211 8863 11628 11711
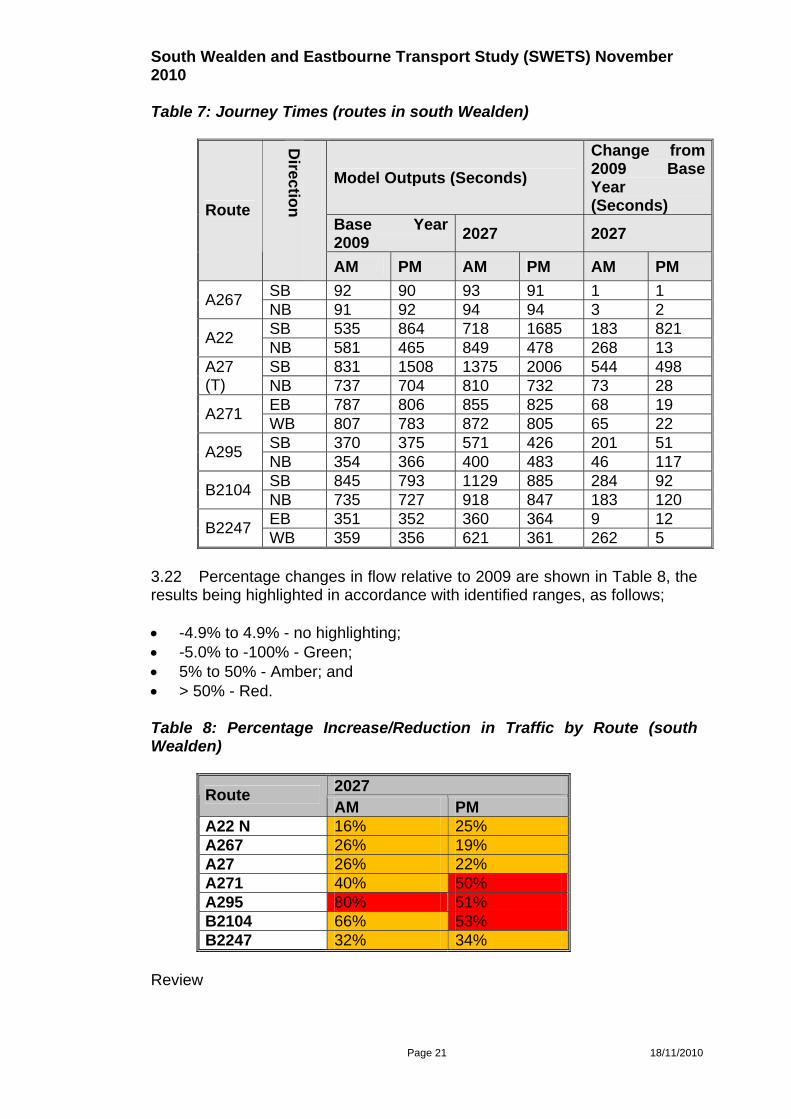
Review 3.20 Through the assessment period, general network performance will degrade with more than 30% growth in the number of trips between the 2009 base year and the 2027 forecast year. Forecast South East regional growth in car trips is about one half of that, indicating that the more major contributor to traffic growth in the south Wealden area is growth in south Wealden itself. Overall average network speeds will reduce as a result of increases in travel time being about twice the increase in travel distance, reflecting a continuing decline in performance on both local and strategic routes in south Wealden. Locally focussed transport mitigation measures may address particular ‘hot-spot’ issues but it is inevitable that a measure of overall decline in level of service would result from future traffic growth. Route statistics 3.21 Journey time comparisons were extracted for the following important routes in south Wealden, with the results shown in Table 7:
A267 Horam to Lower Horsebridge; A22 Golden Cross to Polegate; A27(T) Wilmington to Pevensey; A271 Lower Horsebridge to Herstmonceux; A295 A271 to A22; A2270 Polegate to Gildredge Park; B2104 Upper Horsebridge to Langney Bridge; and B2247 Polegate to Stone Cross.
South Wealden and Eastbourne Transport Study (SWETS) November 2010
Page 21 18/11/2010
Table 7: Journey Times (routes in south Wealden)
Model Outputs (Seconds)
Change from 2009 Base Year (Seconds)
Base Year 2009
2027 2027
Route
Directio
n
AM PM AM PM AM PM
SB 92 90 93 91 1 1 A267
NB 91 92 94 94 3 2 SB 535 864 718 1685 183 821
A22 NB 581 465 849 478 268 13 SB 831 1508 1375 2006 544 498 A27
(T) NB 737 704 810 732 73 28 EB 787 806 855 825 68 19
A271 WB 807 783 872 805 65 22 SB 370 375 571 426 201 51
A295 NB 354 366 400 483 46 117 SB 845 793 1129 885 284 92
B2104 NB 735 727 918 847 183 120 EB 351 352 360 364 9 12
B2247 WB 359 356 621 361 262 5
3.22 Percentage changes in flow relative to 2009 are shown in Table 8, the results being highlighted in accordance with identified ranges, as follows; -4.9% to 4.9% - no highlighting; -5.0% to -100% - Green; 5% to 50% - Amber; and > 50% - Red. Table 8: Percentage Increase/Reduction in Traffic by Route (south Wealden)
2027
Route AM PM
A22 N 16% 25% A267 26% 19% A27 26% 22% A271 40% 50% A295 80% 51% B2104 66% 53% B2247 32% 34%
Review
South Wealden and Eastbourne Transport Study (SWETS) November 2010
Page 22 18/11/2010
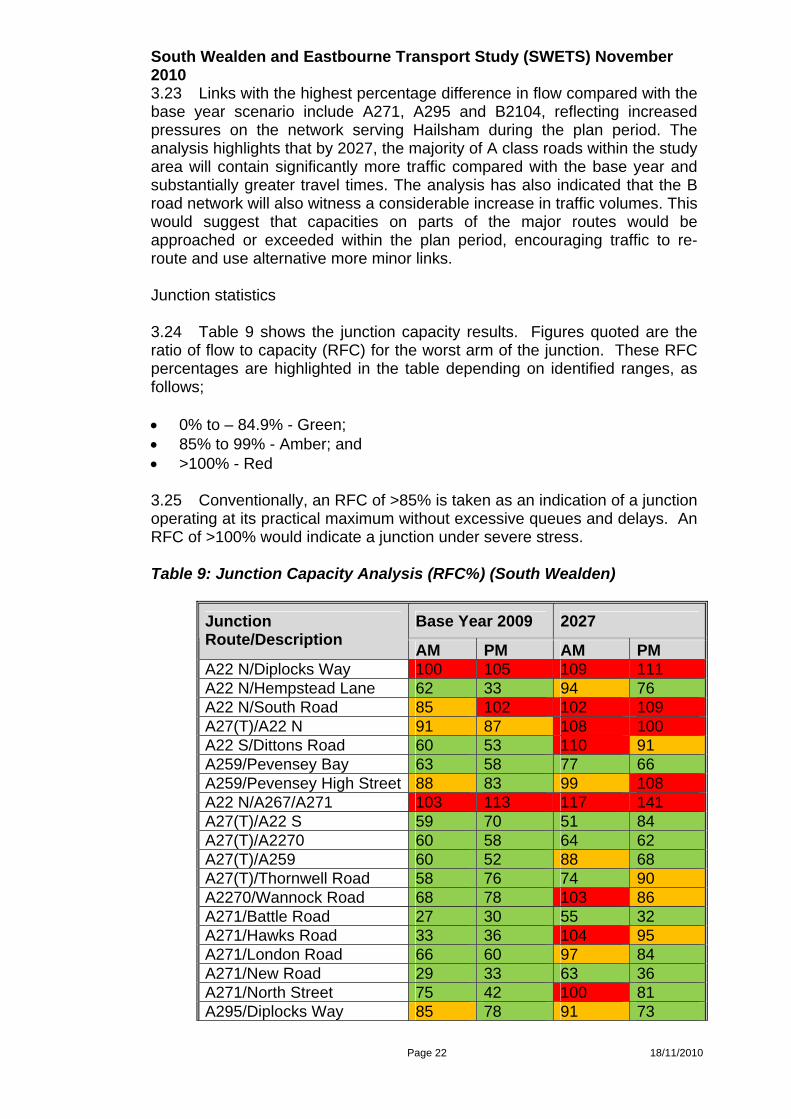
3.23 Links with the highest percentage difference in flow compared with the base year scenario include A271, A295 and B2104, reflecting increased pressures on the network serving Hailsham during the plan period. The analysis highlights that by 2027, the majority of A class roads within the study area will contain significantly more traffic compared with the base year and substantially greater travel times. The analysis has also indicated that the B road network will also witness a considerable increase in traffic volumes. This would suggest that capacities on parts of the major routes would be approached or exceeded within the plan period, encouraging traffic to re-route and use alternative more minor links. Junction statistics 3.24 Table 9 shows the junction capacity results. Figures quoted are the ratio of flow to capacity (RFC) for the worst arm of the junction. These RFC percentages are highlighted in the table depending on identified ranges, as follows; 0% to – 84.9% - Green; 85% to 99% - Amber; and >100% - Red 3.25 Conventionally, an RFC of >85% is taken as an indication of a junction operating at its practical maximum without excessive queues and delays. An RFC of >100% would indicate a junction under severe stress. Table 9: Junction Capacity Analysis (RFC%) (South Wealden)
Base Year 2009 2027 Junction Route/Description
AM PM AM PM A22 N/Diplocks Way 100 105 109 111 A22 N/Hempstead Lane 62 33 94 76 A22 N/South Road 85 102 102 109 A27(T)/A22 N 91 87 108 100 A22 S/Dittons Road 60 53 110 91 A259/Pevensey Bay 63 58 77 66 A259/Pevensey High Street 88 83 99 108 A22 N/A267/A271 103 113 117 141 A27(T)/A22 S 59 70 51 84 A27(T)/A2270 60 58 64 62 A27(T)/A259 60 52 88 68 A27(T)/Thornwell Road 58 76 74 90 A2270/Wannock Road 68 78 103 86 A271/Battle Road 27 30 55 32 A271/Hawks Road 33 36 104 95 A271/London Road 66 60 97 84 A271/New Road 29 33 63 36 A271/North Street 75 42 100 81 A295/Diplocks Way 85 78 91 73

South Wealden and Eastbourne Transport Study (SWETS) November 2010
Page 23 18/11/2010
A295/Ersham Road 56 51 93 76 A295/Harebeating Drive 74 27 105 33 A295/Harmers Hay Road 96 37 89 38 A295/Hawthylands Road 28 23 51 30 A295/High Street 93 82 104 92 A295/London Road 86 94 109 103 A295/North Street 67 54 88 63 A295/Station Road 47 42 81 76 A295/Tesco 63 92 94 113 A295/Western Road 101 87 112 101 B2104/A267 35 29 65 35 B2104/Church Road 18 10 101 18 B2104/Dittons Road 92 81 105 106 B2104/Hawks Road 64 65 111 87 B2104/London Road 45 62 36 102 B2191/Rattle Road 18 16 38 24 B2247/High Street 26 26 102 43 A2270/Broad Road 53 66 101 102 A2270/Church Street 73 59 81 73 A2270/Huggetts Lane 97 96 109 102 A2270/The Triangle 81 72 82 92 South Wealden Number of Junctions RFC >= 85%
12 8 27 19
South Wealden %age of Junctions RFC >=85%
30% 20% 67% 47%
Review
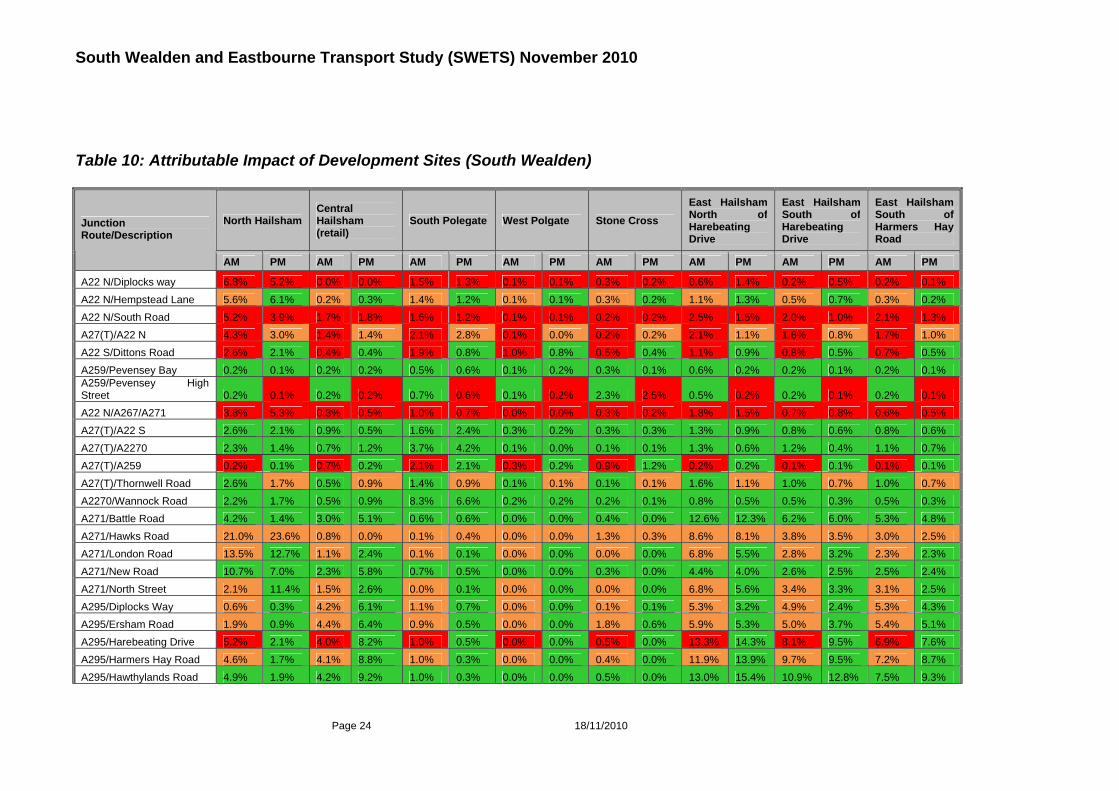
3.26 The number of junctions approaching, at, or over capacity increases significantly between 2009 and 2027. Worst affected routes are A22, A295, A2270 and B2104. Attributable Effects 3.27 Table 10 shows the proportion of total junction inflow attributable to each broad development area for key junctions within South Wealden. The results are colour coded to coincide with the junction capacity analysis in Table 9, namely: RFC 0% to – 84.9% - Green; RFC 85% to 99% - Amber; and RFC >100% - Red Review 3.28 Generally, the attributable impacts are predictably larger the closer to the development area in question. All development areas in Hailsham also contribute to a significant extent to increasing traffic problems in the town centre, and to varying extents to problems elsewhere in and around the town.
South Wealden and Eastbourne Transport Study (SWETS) November 2010
Page 24 18/11/2010
Table 10: Attributable Impact of Development Sites (South Wealden)
North Hailsham Central Hailsham (retail)
South Polegate West Polgate Stone Cross
East Hailsham North of Harebeating Drive
East Hailsham South of Harebeating Drive
East Hailsham South of Harmers Hay Road
Junction Route/Description
AM PM AM PM AM PM AM PM AM PM AM PM AM PM AM PM
A22 N/Diplocks way 6.8% 5.2% 0.0% 0.0% 1.5% 1.3% 0.1% 0.1% 0.3% 0.2% 0.6% 1.4% 0.2% 0.5% 0.2% 0.1%
A22 N/Hempstead Lane 5.6% 6.1% 0.2% 0.3% 1.4% 1.2% 0.1% 0.1% 0.3% 0.2% 1.1% 1.3% 0.5% 0.7% 0.3% 0.2%
A22 N/South Road 5.2% 3.9% 1.7% 1.8% 1.6% 1.2% 0.1% 0.1% 0.2% 0.2% 2.5% 1.5% 2.0% 1.0% 2.1% 1.3%
A27(T)/A22 N 4.3% 3.0% 1.4% 1.4% 2.1% 2.8% 0.1% 0.0% 0.2% 0.2% 2.1% 1.1% 1.6% 0.8% 1.7% 1.0%
A22 S/Dittons Road 2.6% 2.1% 0.4% 0.4% 1.9% 0.8% 1.0% 0.8% 0.5% 0.4% 1.1% 0.9% 0.8% 0.5% 0.7% 0.5%
A259/Pevensey Bay 0.2% 0.1% 0.2% 0.2% 0.5% 0.6% 0.1% 0.2% 0.3% 0.1% 0.6% 0.2% 0.2% 0.1% 0.2% 0.1% A259/Pevensey High Street 0.2% 0.1% 0.2% 0.2% 0.7% 0.6% 0.1% 0.2% 2.3% 2.5% 0.5% 0.2% 0.2% 0.1% 0.2% 0.1%
A22 N/A267/A271 3.8% 5.3% 0.3% 0.5% 1.0% 0.7% 0.0% 0.0% 0.3% 0.2% 1.8% 1.5% 0.7% 0.8% 0.6% 0.5%
A27(T)/A22 S 2.6% 2.1% 0.9% 0.5% 1.6% 2.4% 0.3% 0.2% 0.3% 0.3% 1.3% 0.9% 0.8% 0.6% 0.8% 0.6%
A27(T)/A2270 2.3% 1.4% 0.7% 1.2% 3.7% 4.2% 0.1% 0.0% 0.1% 0.1% 1.3% 0.6% 1.2% 0.4% 1.1% 0.7%
A27(T)/A259 0.2% 0.1% 0.7% 0.2% 2.1% 2.1% 0.3% 0.2% 0.9% 1.2% 0.2% 0.2% 0.1% 0.1% 0.1% 0.1%
A27(T)/Thornwell Road 2.6% 1.7% 0.5% 0.9% 1.4% 0.9% 0.1% 0.1% 0.1% 0.1% 1.6% 1.1% 1.0% 0.7% 1.0% 0.7%
A2270/Wannock Road 2.2% 1.7% 0.5% 0.9% 8.3% 6.6% 0.2% 0.2% 0.2% 0.1% 0.8% 0.5% 0.5% 0.3% 0.5% 0.3%
A271/Battle Road 4.2% 1.4% 3.0% 5.1% 0.6% 0.6% 0.0% 0.0% 0.4% 0.0% 12.6% 12.3% 6.2% 6.0% 5.3% 4.8%
A271/Hawks Road 21.0% 23.6% 0.8% 0.0% 0.1% 0.4% 0.0% 0.0% 1.3% 0.3% 8.6% 8.1% 3.8% 3.5% 3.0% 2.5%
A271/London Road 13.5% 12.7% 1.1% 2.4% 0.1% 0.1% 0.0% 0.0% 0.0% 0.0% 6.8% 5.5% 2.8% 3.2% 2.3% 2.3%
A271/New Road 10.7% 7.0% 2.3% 5.8% 0.7% 0.5% 0.0% 0.0% 0.3% 0.0% 4.4% 4.0% 2.6% 2.5% 2.5% 2.4%
A271/North Street 2.1% 11.4% 1.5% 2.6% 0.0% 0.1% 0.0% 0.0% 0.0% 0.0% 6.8% 5.6% 3.4% 3.3% 3.1% 2.5%
A295/Diplocks Way 0.6% 0.3% 4.2% 6.1% 1.1% 0.7% 0.0% 0.0% 0.1% 0.1% 5.3% 3.2% 4.9% 2.4% 5.3% 4.3%
A295/Ersham Road 1.9% 0.9% 4.4% 6.4% 0.9% 0.5% 0.0% 0.0% 1.8% 0.6% 5.9% 5.3% 5.0% 3.7% 5.4% 5.1%
A295/Harebeating Drive 5.2% 2.1% 4.0% 8.2% 1.0% 0.5% 0.0% 0.0% 0.5% 0.0% 13.3% 14.3% 8.1% 9.5% 6.9% 7.6%
A295/Harmers Hay Road 4.6% 1.7% 4.1% 8.8% 1.0% 0.3% 0.0% 0.0% 0.4% 0.0% 11.9% 13.9% 9.7% 9.5% 7.2% 8.7%
A295/Hawthylands Road 4.9% 1.9% 4.2% 9.2% 1.0% 0.3% 0.0% 0.0% 0.5% 0.0% 13.0% 15.4% 10.9% 12.8% 7.5% 9.3%

South Wealden and Eastbourne Transport Study (SWETS) November 2010
Page 25 18/11/2010
A295/High Street 3.5% 2.0% 3.4% 7.6% 0.7% 0.2% 0.0% 0.0% 0.5% 0.1% 7.7% 6.1% 6.6% 4.1% 7.1% 6.0%
A295/London Road 3.9% 2.0% 3.7% 7.7% 0.8% 0.2% 0.0% 0.0% 0.4% 0.0% 10.1% 8.4% 8.3% 5.8% 9.0% 7.9%
A295/North Street 1.6% 0.7% 6.0% 13.1% 0.8% 0.4% 0.0% 0.0% 0.8% 0.3% 5.8% 5.0% 5.2% 3.4% 5.6% 5.1%
A295/Station Road 1.3% 0.0% 6.5% 10.8% 0.9% 0.5% 0.0% 0.0% 0.9% 0.4% 6.1% 5.5% 5.5% 3.7% 6.0% 5.8%
Table 10: (Continued) Attributable Impact of Development Sites (South Wealden)
North Hailsham Central Hailsham (retail)
South Polegate West Polgate Stone Cross
East Hailsham North of Harebeating Drive
East Hailsham South of Harebeating Drive
East Hailsham South of Harmers Hay Road
Junction Route/Description
AM PM AM PM AM PM AM PM AM PM AM PM AM PM AM PM
A295/Tesco 2.5% 1.4% 8.2% 9.2% 0.7% 0.3% 0.0% 0.0% 0.8% 0.3% 6.4% 5.4% 5.6% 3.7% 6.0% 5.4%
A295/Western Road 2.0% 0.9% 5.3% 7.8% 0.9% 0.5% 0.0% 0.0% 1.8% 0.5% 6.1% 5.5% 5.2% 3.9% 5.7% 5.4%
B2104/A267 9.9% 4.5% 0.9% 2.1% 0.6% 0.3% 0.0% 0.0% 0.0% 0.3% 2.7% 2.7% 1.8% 1.7% 1.7% 1.7%
B2104/Church Road 16.0% 9.5% 1.4% 4.5% 0.0% 0.0% 0.0% 0.0% 0.0% 0.5% 4.2% 5.8% 2.8% 3.7% 2.7% 3.7%
B2104/Dittons Road 0.7% 0.4% 1.1% 1.8% 1.4% 1.6% 0.2% 0.2% 4.4% 2.1% 1.2% 3.0% 0.9% 1.9% 1.0% 2.0%
B2104/Hawks Road 12.9% 8.7% 1.1% 3.7% 0.2% 0.6% 0.1% 0.0% 1.3% 0.3% 2.2% 2.4% 0.6% 1.5% 0.4% 0.6%
B2104/London Road 3.1% 3.0% 2.5% 5.0% 0.4% 0.1% 0.0% 0.0% 3.4% 0.4% 4.0% 3.3% 2.5% 2.4% 3.0% 2.7%
B2191/Rattle Road 0.1% 0.0% 0.3% 0.0% 0.6% 0.3% 0.2% 0.1% 4.1% 5.3% 0.4% 0.0% 0.3% 0.0% 0.3% 0.0%
B2247/High Street 0.9% 0.7% 0.1% 0.1% 9.9% 2.6% 1.1% 0.7% 0.8% 0.6% 0.3% 0.1% 0.2% 0.1% 0.2% 0.1%
A2270/Broad Road 2.6% 1.8% 0.5% 0.9% 6.9% 6.2% 0.0% 0.0% 0.0% 0.0% 1.0% 0.6% 0.6% 0.4% 0.6% 0.4%
A2270/Church Street 1.9% 1.6% 0.4% 0.8% 3.7% 4.2% 0.0% 0.0% 0.0% 0.0% 0.7% 0.5% 0.5% 0.3% 0.5% 0.3%
A2270/Huggetts Lane 1.9% 1.5% 0.4% 0.7% 5.3% 5.2% 0.0% 0.0% 0.0% 0.0% 0.7% 0.5% 0.5% 0.3% 0.5% 0.3%
A2270/The Triangle 2.1% 1.7% 0.4% 0.8% 5.9% 5.6% 0.0% 0.0% 0.0% 0.0% 0.8% 0.5% 0.5% 0.3% 0.5% 0.3%

South Wealden and Eastbourne Transport Study (SWETS) November 2010
Page 26 18/11/2010
Highway Network Issues A271 / A22 3.29 The development option tested includes major housing allocations in north and east Hailsham that would place increased traffic pressure on A271 from Battle Road to the Boship roundabout. Without any additional measures to increase traffic flows on A271 or elsewhere, capacity would become an issue at the junctions of A271 with Hawks Road, London Road and North Street, and the existing queuing problems at A22/A267/A271 Boship roundabout (particularly on the A271 in the PM peak) would be exacerbated. Whilst new on-site highway provision may be a mitigating feature of development in north Hailsham, the issues arising on the western part of A271 would remain unresolved. Other junctions on the A22 at Diplocks Way and South Road would increasingly suffer congestion. The possibility of opening up the junction of A22 with Hempstead Lane has been considered. Currently a restricted ‘left in / left out’ junction, its conversion to ‘all moves’ by construction of a roundabout has been tested. The results indicate that this would have widespread benefits without significant area or local disbenefits. By providing an additional connection between the town and the A22 corridor, traffic redistributions would reduce the incidence of queuing on A271 at Boship (the worst performing arm), reduce pressures on Diplocks Way and South Road junctions with the A22, and improve the accessibility of development proposals in north and east Hailsham. The implications of such a solution would require further consideration, in order to test physical and financial deliverability. If the reconfiguration of the junction at Hempstead Lane could not be achieved it would be necessary to consider an alternative, but less effective solution, involving the reconfiguration of the Boship roundabout itself. Different design solutions would need to be tested and the most appropriate solution sought. However, it is critical that the potential future incidence of queuing on the A271 created by additional development is resolved. Notwithstanding any solution modelled queuing on A22 south into the junction in the AM peak would remain a problem at Boship roundabout. No solution implementable within the highway boundary is apparent, including one or more slip lanes. Hailsham Town Centre 3.30 Given the amount of development proposed for Hailsham, some intensification of traffic pressures on the town centre highway network is inevitable. The principal capacity issues now and in the future would arise at the London Road / Battle Road and High Street / North Street junctions. A small measure of relief would result from the previous proposal to open up Hempstead Lane / A22 junction. Further relief could only stem from lower traffic demands, either a general reduction of town traffic through, as yet unidentified, demand management measures, and by increasing use of the existing B2104 via Summerheath Road. Initial testing of a scheme including traffic signals at the northern and southern ends of Summerheath Road, encouraging its use by north / south traffic avoiding the town centre and providing an alternative means of accessing the southern part of the town centre from the north, suggest that this could help to resolve the capacity

South Wealden and Eastbourne Transport Study (SWETS) November 2010
Page 27 18/11/2010
issues at London Road / Battle Road and High Street / North Street junctions. Further consideration will be required with respect to the impact of measures on the Battle Road and North Road Junctions within the Town Centre and the need to improve the High Street. The overall movement of traffic would benefit from demand management measures, as demonstrated through the 10% matrix reduction in SWETS 1, and would be part of the package to resolve town centre capacity issues. A2270 3.31 Commencing south of the A22/A27 signalised junction, this is an important access corridor from the north (including Hailsham) and west to Eastbourne. Previous work has identified that substantial traffic benefits could arise only from provision of a new A27 link west of Polegate to Cophall roundabout which would encourage a greater proportion of traffic between the west and central Eastbourne to use Polegate bypass and Jubilee Way. An alternative of signalising Cophall roundabout would only give more limited benefits overall and delivers significantly less traffic reduction on A2270. The A2270 is identified as top priority Quality Bus Corridor. Importantly for this SWETS investigation, the current work has made no specific provision for the inevitable impacts of capacity reduction for general traffic as a consequence of roadspace reallocation to achieve bus priority. Taking this into account, in the forecast year junction capacity would become an increasingly important issue not only at A2270 / Polegate High Street / Wannock Road and at Huggets Lane / A2270, but also at intermediate junctions providing access to adjacent areas (e.g. Broad Road and The Triangle). B2104 / B2247 Stone Cross crossroads 3.32 This junction appears in Table 10 as a junction currently approaching capacity and over-capacity in the forecast year. The arm least effectively working, in both cases is the B2104 towards Hailsham. The junction appears to be able to satisfactorily accommodate present and future flows on other arms. The capacity issue on B2104 north would tend to inhibit its use as an alternative route (to the A22) for traffic between Hailsham and parts of Eastbourne, and therefore increase trips on the A22. Development Consequences 3.33 From the work carried out to date, the following observations can be made about the suitability, from a transport perspective, of individual major development proposals tested. References to particular transport measures investigated in this stage of SWETS should not be taken to preclude any potential other(s) not yet identified or tested.
Hailsham 3.34 Development to the scale and location proposed in north and east Hailsham could be accommodated subject to improvement to the town centre network as identified and to the A22 / Hempstead Lane junction. Without the
South Wealden and Eastbourne Transport Study (SWETS) November 2010
Page 28 18/11/2010
latter, the consequences of development at north Hailsham for the satisfactory operation of the Boship roundabout would be severe. South Polegate and East Willingdon 3.35 This site would access directly onto the A2270 south of the Wannock Road / Polegate High Street junction. It would be a major contributor to traffic flows at that junction, and at the junction of A2270 with Huggets Lane to the south. Junction capacity will be an increasingly important issue at both sites in the future, particularly in light of the need to accommodate bus priority measures in support of the QBC proposal for this highway corridor. Concern is therefore raised with respect to residential development at the scale envisaged. Stone Cross 3.36 The assessment has not identified any transport issues of consequence associated with this development proposal. 4.0 Phase III SWETS Context 4.1 The significant difference between the distribution of spatial options in Phase I and Phase II SWETS is in Polegate. Scenario 1 in Phase I was focussed upon land north of Dittons Road, whereas Phase II focussed on an alternative location on land south of Polegate and east of Willingdon. The results of Phase II was in conclusive in relation to development in this area. Therefore, based on the Phase I approach, that development of 700 dwellings could be accommodated in north of Dittons Road, Phase III seeks to clarify how much development can be accommodated in south of Polegate and East of Willingdon. 4.2 A further iteration of the development option increased the time scale for delivery at Wealden District from 2027 to 2030 and made some minor amendments to the quantum of development in outlying villages, with an overall reduction in development to that tested. For the purpose of SWETS this is not considered to be a material factor in the assessment of results. Methodology 4.3 The principal highways concern relating to the potential allocation on land south of Polegate and east of Willingdon is the ability of that part of the A2270, which would form the access to/from the main highway network, to accommodate the traffic demands of the site. The principal issue was accommodating those demands on a major route which will remain heavily trafficked in the future, and within which it is intended to provide capacity-allocation measures consistent with its intended role as part of the QBC. 4.4 The approach adopted for Phase III was therefore to compare assignment results with and without the allocation on this site, to determine

South Wealden and Eastbourne Transport Study (SWETS) November 2010
Page 29 18/11/2010
whether the site allocation was capable of being accommodated in full or, if not, to what extent. Results 4.5 This section of the A2270 serves as part of the principal accesses between Hailsham and Eastbourne, and between areas served by the A27 west of Polegate and Eastbourne. Both have a choice of routes (A2270 or A22 Jubilee Way) influenced by trip end location in Eastbourne and by the overall cost of using either route. The cost difference is greater for traffic to/from the A27 west of Polegate and this contributes to the observation that, in the base year, whilst about 60% of traffic on the A27 west of Polegate has an origin or destination in Eastbourne, of that, about three quaters uses the A2270. 4.6 This part of the A2270 is heavily trafficked in base year. As traffic demands grow over the assessment period, the ‘natural’ demand to use this route will also increase, and the ability of the route to accommodate growth will decrease. The usual network response would be for traffic to reassign to other parts of the network, spreading the impact. Without a major improvement to the A27 west of Polegate (e.g. Folkington Link), the time and cost penalty associated with the use of A22 instead of A2270 by traffic to/from the west is substantial. 4.7 The assignments comparison nonetheless showed that the degree and extent of traffic capacity problems on this section of the A2270 are similar with or without the allocation on this site. Other traffic is therefore reassigning to second choice routes as a result of this allocation. As traffic flows on the section are broadly similar, the scale of reassignment appears to be directly related to the scale of the development in this location. Not only would total network time, distance and fuel consumption increase, so would the need for improvements at critical junctions on both first and alternative route choices, including parts of the standard intervention package. Conclusion of SWETS Phase III 4.8 On the basis of this work it can be concluded that any allocation at this site will intensify traffic demands on the A2270, which is already under pressure, and which must be capable of accommodating capacity-allocation measures consistent with its intended role as part of the QBC. Consequences are likely to be experienced not only locally but also elsewhere on the highway network due to reassignment of other traffic. 4.9 The extent to which the allocation can be partially or fully accommodated is dependent on the acceptability of those network-wide impacts and is contingent upon mitigation including: Junction improvements at A2270 / Polegate High Street / Wannock Road; Junction improvements at A22/ A27 / A2270 intersection; Traffic signals at Cophall roundabout;
South Wealden and Eastbourne Transport Study (SWETS) November 2010
Page 30 18/11/2010
Improvements at junctions between A22 Jubilee Way and A27 and Dittons Road;
Access junction(s) onto A2270 providing adequate capacity, and consistent in design with overall corridor QBC requirements; and
Incorporation of strong, effective demand management measures and proposals.
5.0 Conclusion Eastbourne 5.1 On the basis of the SWETS1 work undertaken, there is no clear front runner in the choice between the three Eastbourne Development Options. All Transport Intervention Packages tested can partially address the issues arising in 2026, although it is unlikely that their marginal transport impact advantages would outweigh the considerably greater cost of the Eastbourne Park road proposals in TIP5 in a more comprehensive cost-benefit analysis. 5.2 The preferred choice would appear to lie between Development Scenarios 1 and 6 (i.e. EBC Development Options 1 and 2), together with Transport Intervention Packages 1 or 2. The assessment indicates that Scenario 6 has an overall network advantage, and that TIP 1 (which includes Folkington Link) is better than TIP 2 (which includes signals at Cophall roundabout instead). The preferred combination is therefore EBC Development Option 2 plus Transport Intervention Package 1. Regardless of Development Scenario and Transport Intervention Package, outstanding issues at 2026 would include traffic volumes on the town centre ring road, and the competing (public / private transport) demands for available capacity on the identified QBC corridors. Wealden 5.3 SWETS has shown that a number of traffic issues are predicted through development proposals in south Wealden from 2009 to 2030. In order to deliver growth it is considered that a range of mitigation measures will be required which could include: Addressing capacity, safety and severance issues along the A271
including improvements at Boship roundabout and/or at the junction of A22 and Hempstead Lane;
Adoption of demand management (e.g. Smarter Choices) approaches for new and existing development in the south Wealden area, to help mitigate Hailsham town centre issues and the impacts of traffic on the wider town and strategic road networks;
Promotion and inclusion of Summerheath Road, Hailsham in a wider town centre network, including new signalised junctions;
Signal improvements at Battle Road / London Road and North Road / High Street junctions;
Junction improvements at A2270 / Polegate High Street / Wannock Road junction;
South Wealden and Eastbourne Transport Study (SWETS) November 2010
Page 31 18/11/2010
Junction improvements at A22/ A27 / A2270 junction; Traffic signals at Cophall roundabout; Improvement at roundabout junctions of A22 Jubilee Way with the A27
and Dittons Road; Incorporation of measures on sites adjacent to the A22/A2270, or
otherwise directly or significantly affecting the corridor, to manage and accommodate demands by car and other means so as not to prejudice the delivery or effective operation of the QBC.
5.4 On the basis of the proposed mitigation measures it is considered that the development proposed in south Wealden could be delivered.

South Wealden and Eastbourne Transport Study (SWETS) November 2010
Page 32 18/11/2010
APPENDIX 1 MAP SHOWING EXTENT OF STUDY AREA
Study Area

South Wealden and Eastbourne Transport Study (SWETS) November 2010
Page 33 18/11/2010
APPENDIX 2 EBC AND WDC LDF DEVELOPMENT OPTIONS
�����
�����������
���������
�����������
������������������������������������������������������������������������������������������� �!"����#���
�����������
����������
����������
����������
������������������������������������������������
���������������$��%���������������������������������
%���������
&������������������'������(�������
)���'����*'���+������%���
,������-������.���������������� ������
)���'�����������������������
/01�"���2�����3-����%�%(
�����������������
4������ 56 ����"������� 56 ���0����.���� 56 7��4���������8 56 �9����: 56 ��;���� 56 ���<������-�� 56 %�=''���-�:�� 56 ��
9������'������*������0��#�����''����������'���������*������0��#��������������������.������������4���<�>����?��0�������*�����@�.������'�������=������������'��������������.�����'���������������������'�������������#��'���������,������-������.�������A&������($%��%���
Page 34

�����
����������
����������
����������
� ���������������������������� �������������������������������������������������� ���!�"�#$����%���
&���������
���������
����������
����������
&��������� ������������������������������������
�&����������� �&&����������������������������������
&��������
'������������������(������������
)���(����*(���+����!��� �
,������-������.���������������� ������
)���(������������!����������
/01�$���2�����3-������ �
�����������������������
4������ 56 & �$������� 56 ��0����.���� 56 �4���������7 56 ��8����9 56 ��:���� 56 ��;������-�� 56 &<((���-�9�� 56 �
8������(������*������0��%�!���((����������(���������*������0��%�!��� ��������������.������������4���;�=���!>��0������!*�����?�.������(!������<������������(��������������.�����(!����������!���������(�������������%��(���������,������-������.�������@' ��� A������� �
Page 35

�����
�����������
���������
������������ �������������������������������������
������������������������������������������������������������������������������������������� !����"���
#����������
����������
����������
�����������
���������������$�#%����������������������������������
������������ �������������������������������������
%���������
%����������
&������������������'����#�(�������
)���'����*'���+������%���
,������-������.���������������� ������
)���'������������������������
/01�!���2�����3
-����%�%(
������������������
4������ 56 %���!������� 56 ���0����.���� 56 7��4���������8 56 �9����: 56 ��;���� 56 ���<�������-�� 56 %�=''���-�:�� 56 ��
9������'������*������0��"�����''����������'���������*������0��"��������������������.������������4���<�>����?��0�������*�����@�.������'�������=������������'��������������.�����'���������������������'�������������"��'���������,������-������.�������A&������($%��%���
Page 36
�����
����������
����������
����������� �����������������������������������
������������� ������������������������������������������������������������������ ���!�"�#$����%���
&���������
����������
����������
'���������
���������������&&����������������������������������
�&���������� �����������������������������������
�&��������
����������
(������������������)���� �������
*���)����+)���,����!�����
-������.������/���������������� ������
*���)������������!�����������
012�$���3�����4
.�������
������������������������
5������ 67 ���$������� 67 ���1����/���� 67 ���5���������8 67 ��9����: 67 ��;���� 67 ��<������.�� 67 �&=))���.�:�� 67 ��
9������)������+������1��%�!���))����������)���������+������1��%�!��� ��������������/������������5���<�>���!?��1������!+�����@�/������)!������=������������)��������������/�����)!����������!���������)�������������%��)���������-������.������/�������A(�����' ��������
Page 37
�����
�����������
���������
�����������
������������������������������������������������������������������������������������������� �!"����#���
����������
����������
�����������
$������������%�������������������������������������
�����������
����������
%���������������%�����������������������������������
�����������
&������������������'����%�$�������
�����������
�����������
�����������
(���'����)'���*����������
+������,������-���������������� ������
(���'��������������������������./0�"���1�����2
,�������$
��������������������
3������ 45 ����"������� 45 ���/����-���� 45 6��3���������7 45 �8����9 45 ��:���� 45 ���;������,�� 45 ��<''���,�9�� 45 ��
8������'������)������/��#�����''����������'���������)������/��#��������������������-������������3���;�=����>��/�������)�����?�-������'�������<������������'��������������-�����'���������������������'�������������#��'���������+������,������-�������@&������$A�������
Page 38
�����
����������
����������
���������
���������������������������������� ���������������������������� ����������� �����!���"�#�$%����&���
����������
����������
����������
�������������'������������������������������ ����
����������
�'��������
'�������������������������������������������� ����
���������
(������������������)������������
����������
����������
����������
*���)����+)���,����"�����
-������.������/���������������� ������
*���)������������"�������������
012�%���3�����4.��������
��������������������������
5��� �� 67 ���%������� 67 � �1����/���� 67 ��'5���������8 67 ��9����: 67 ��;���� 67 ��<�� ���.�� 67 �'=))���.�:�� 67 ��
9������)��� ��+������1��&�"���))���� �� ��)���������+������1��&�"���!� ��������� ��/������������5���<�>���"?��1������"+�����@�/������)"�� ���=��� ��������)��������������/�����)"�� �������"���������)�������������&��)���������-������.������/�������A(���������������
Page 39
1
2 34
56
78
9
10
11
12
13
14
Neighbourhood Net Units Delivered
2016-2026
1 Town Centre 271
2 Upperton 32
3 Seaside 38
4Old Town, Downside & Cherry
Gardens10
5 Ocklynge & Rodmill 8
6 Roselands & Bridgemere 56
7Hampden Park, The Hydneye
& Willingdon Trees 118
8Langney Village, Langney Rise
& West Langney 313*
9 Shinewater & North Langney 14
10 Summerdown & Saffrons 206
11 Meads & Lower Meads 24
12 Ratton & Willingdon 5
13 St Anthony’s & Langney Point 9
14 Sovereign 150
TOTAL 1254
* The creation of a Sustainable Centre will be at Langney Shopping Centre, not across the whole neighbourhood
Sovereign Harbour (Sites 6 and 7)
Town Centre Expansion
Densification of Industrial Estates(Birch Road)
Sovereign Harbour Retail Park
Langney Shopping Centre Redevelopment
Dental Practice Board Redevelopment
Densification of Industrial Estates(Highfield North)
Densification of Industrial Estates(Part Hammonds Drive)
This map is based upon Ordnance Survey material with the permission of Ordnance Survey on behalf of the Controller of her Majesty’s Stationery Office (C) Crown copyright. Unauthorised reproduction infringes Crown copyright and may lead to prosecution or civil proceedings.
Eastbourne Borough CouncilLA100025879 2008
KEY
Focus for housing growth
Medium levels of housing growth
Low levels of housing growth
Lowest levels of housing growth
Creation of Sustainable Centre
Employment Sites
TRANSPORT OPTIONS - SCENARIO ONE2016 - 2026
Page 40

Neighbourhood Net Units Delivered
2016-2026
1 Town Centre 271
2 Upperton 57
3 Seaside 80
4Old Town, Downside & Cherry
Gardens19
5 Ocklynge & Rodmill 8
6 Roselands & Bridgemere 56
7Hampden Park, The Hydneye
& Willingdon Trees 118
8Langney Village, Langney Rise
& West Langney 159
9 Shinewater & North Langney 14
10 Summerdown & Saffrons 206
11 Meads & Lower Meads 47
12 Ratton & Willingdon 5
13 St Anthony’s & Langney Point 9
14 Sovereign 0
TOTAL 1049
1
2 34
56
78
9
10
11
12
13
14
Sovereign Harbour (Sites 6 and 7)
Town Centre Expansion
Densification of Industrial Estates(Birch Road)
Sovereign Harbour Retail Park
Dental Practice Board Redevelopment
Densification of Industrial Estates(Highfield North)
Densification of Industrial Estates(Part Hammonds Drive)
This map is based upon Ordnance Survey material with the permission of Ordnance Survey on behalf of the Controller of her Majesty’s Stationery Office (C) Crown copyright. Unauthorised reproduction infringes Crown copyright and may lead to prosecution or civil proceedings.
Eastbourne Borough CouncilLA100025879 2008
KEY
Focus for housing growth
Medium levels of housing growth
Low levels of housing growth
Lowest levels of housing growth
Sustainable Neighbourhoods
Employment Sites
TRANSPORT OPTIONS - SCENARIO TWO2016 - 2026
Page 41
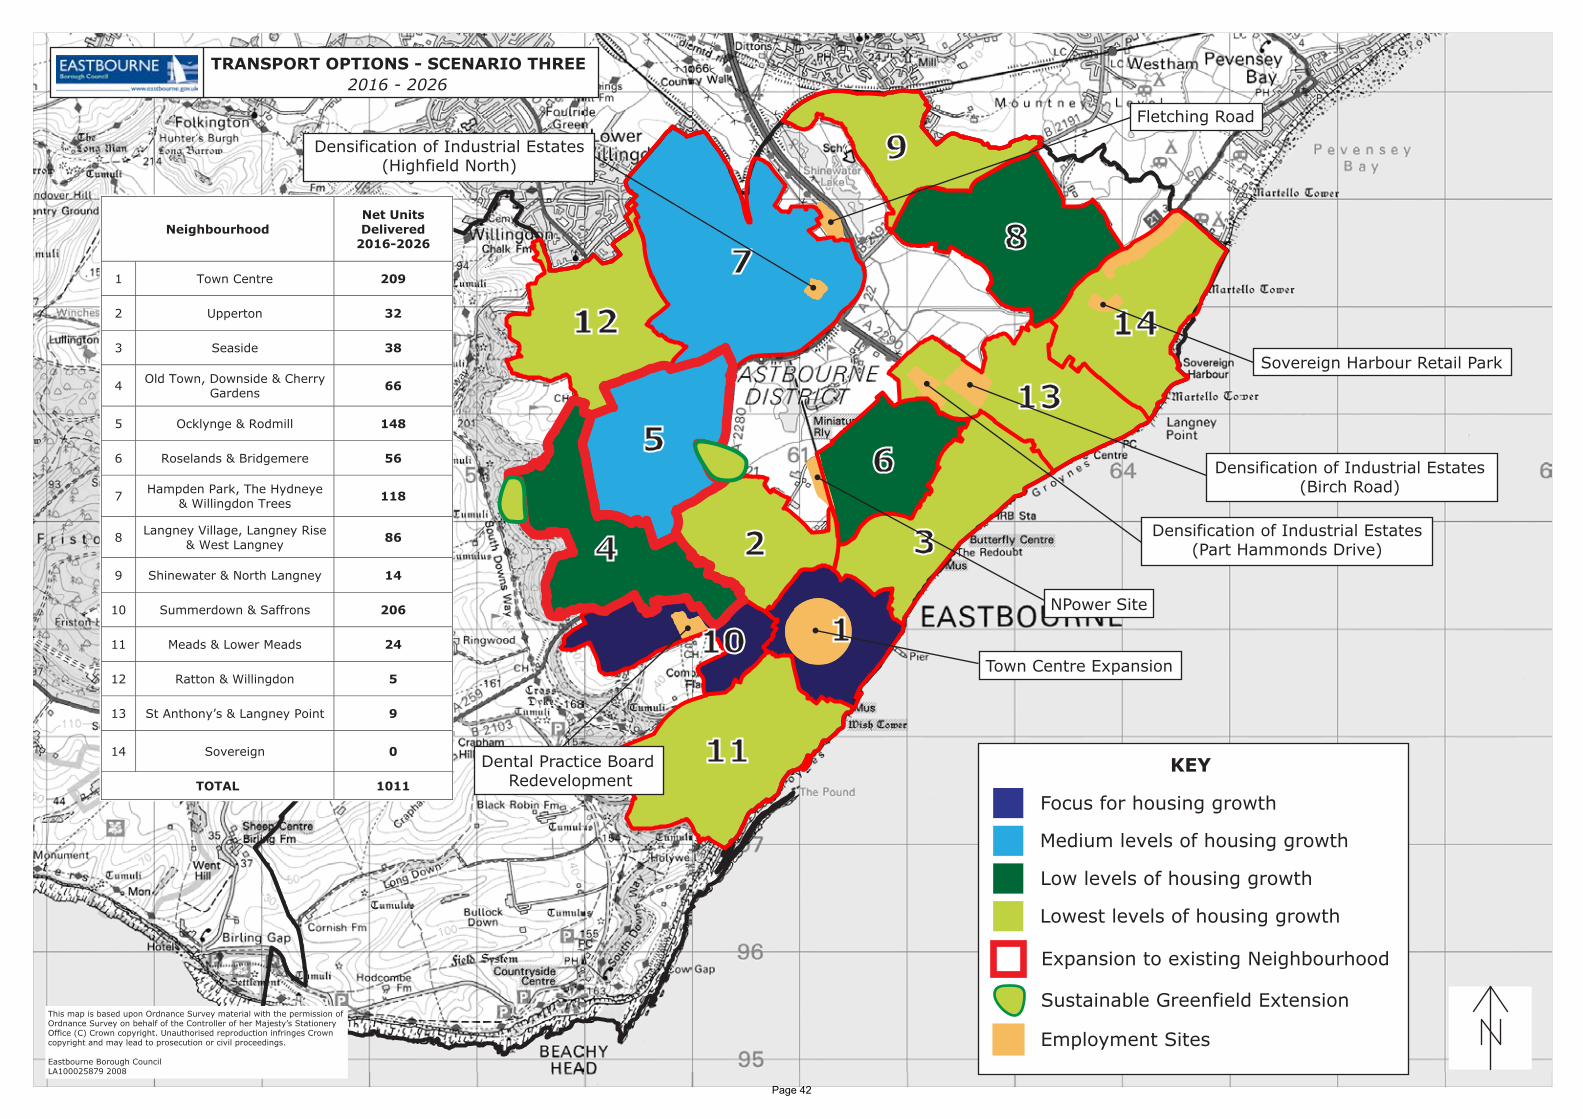
Neighbourhood Net Units Delivered
2016-2026
1 Town Centre 209
2 Upperton 32
3 Seaside 38
4Old Town, Downside & Cherry
Gardens66
5 Ocklynge & Rodmill 148
6 Roselands & Bridgemere 56
7Hampden Park, The Hydneye
& Willingdon Trees 118
8Langney Village, Langney Rise
& West Langney 86
9 Shinewater & North Langney 14
10 Summerdown & Saffrons 206
11 Meads & Lower Meads 24
12 Ratton & Willingdon 5
13 St Anthony’s & Langney Point 9
14 Sovereign 0
TOTAL 1011
1
2 34
56
78
9
10
11
12
13
14
Fletching Road
Town Centre Expansion
Densification of Industrial Estates(Birch Road)
Sovereign Harbour Retail Park
Dental Practice Board Redevelopment
Densification of Industrial Estates(Highfield North)
Densification of Industrial Estates(Part Hammonds Drive)
NPower Site
This map is based upon Ordnance Survey material with the permission of Ordnance Survey on behalf of the Controller of her Majesty’s Stationery Office (C) Crown copyright. Unauthorised reproduction infringes Crown copyright and may lead to prosecution or civil proceedings.
Eastbourne Borough CouncilLA100025879 2008
KEY
Focus for housing growth
Medium levels of housing growth
Low levels of housing growth
Lowest levels of housing growth
Expansion to existing Neighbourhood
Employment Sites
Sustainable Greenfield Extension
TRANSPORT OPTIONS - SCENARIO THREE2016 - 2026
Page 42
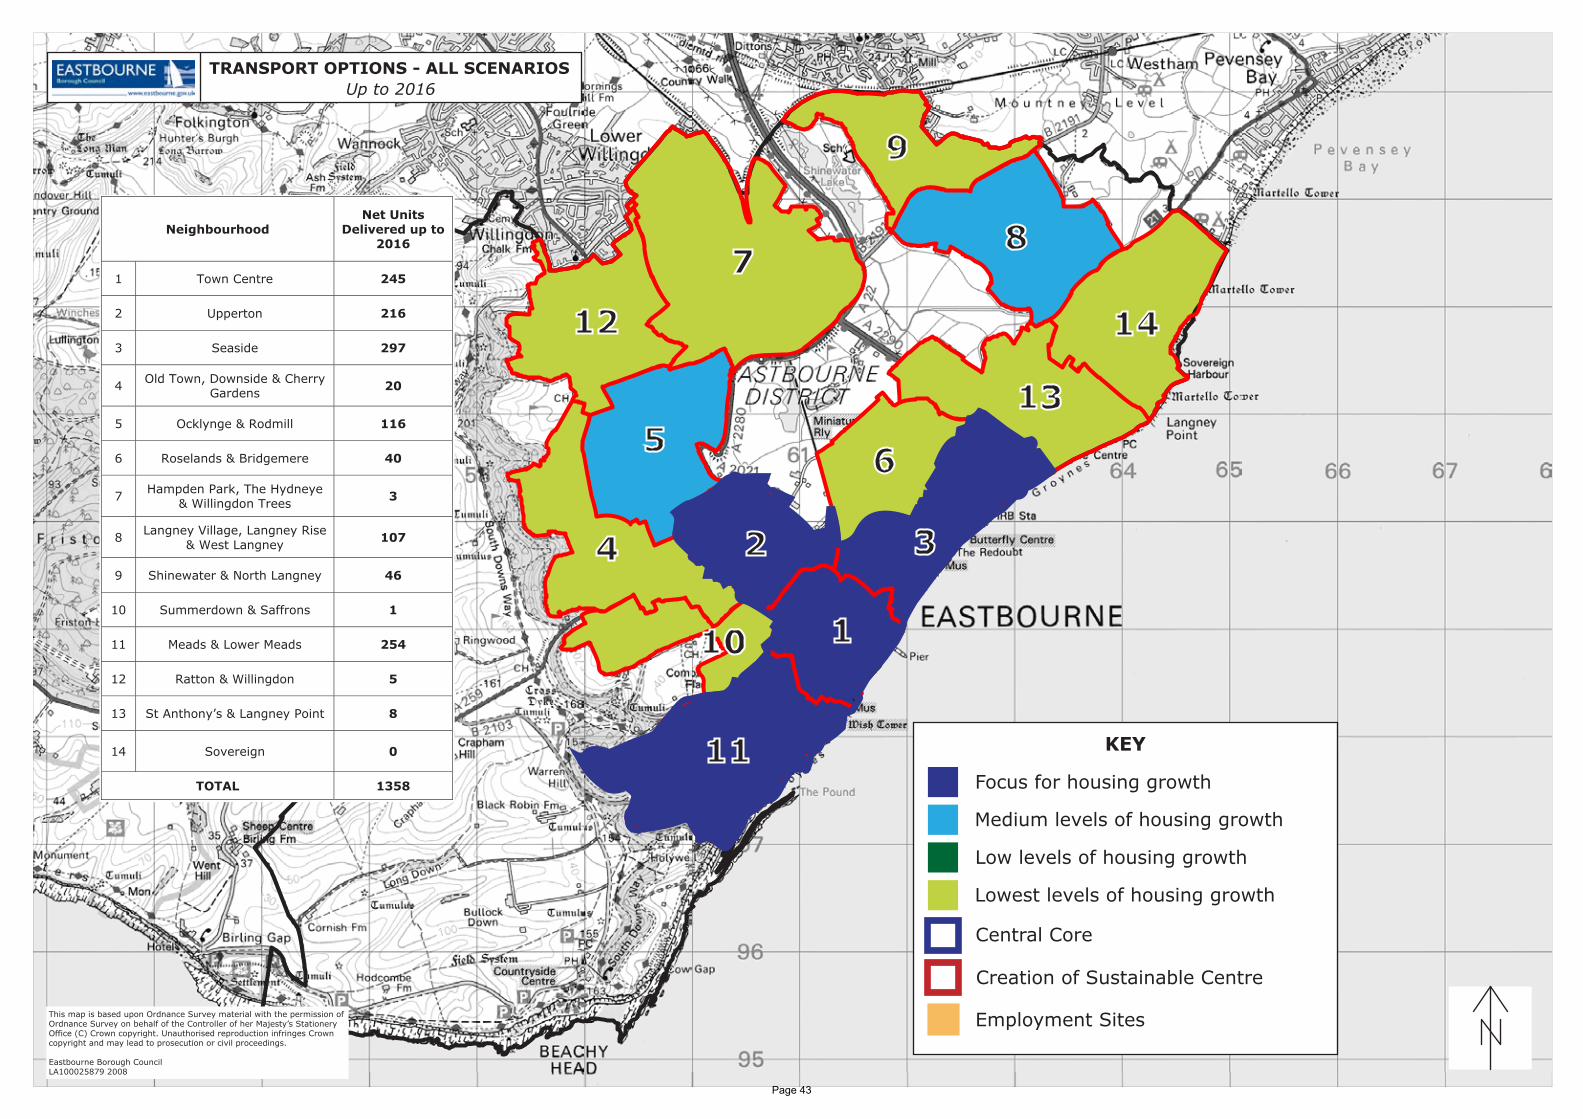
1
2 34
56
78
9
10
11
12
13
14
Neighbourhood Net Units
Delivered up to 2016
1 Town Centre 245
2 Upperton 216
3 Seaside 297
4Old Town, Downside & Cherry
Gardens20
5 Ocklynge & Rodmill 116
6 Roselands & Bridgemere 40
7Hampden Park, The Hydneye
& Willingdon Trees 3
8Langney Village, Langney Rise
& West Langney 107
9 Shinewater & North Langney 46
10 Summerdown & Saffrons 1
11 Meads & Lower Meads 254
12 Ratton & Willingdon 5
13 St Anthony’s & Langney Point 8
14 Sovereign 0
TOTAL 1358
This map is based upon Ordnance Survey material with the permission of Ordnance Survey on behalf of the Controller of her Majesty’s Stationery Office (C) Crown copyright. Unauthorised reproduction infringes Crown copyright and may lead to prosecution or civil proceedings.
Eastbourne Borough CouncilLA100025879 2008
KEY
Focus for housing growth
Medium levels of housing growth
Low levels of housing growth
Lowest levels of housing growth
Central Core
Creation of Sustainable Centre
Employment Sites
TRANSPORT OPTIONS - ALL SCENARIOSUp to 2016
Page 43

South Wealden and Eastbourne Transport Study (SWETS) November 2010
Page 44 18/11/2010
Appendix 3 Calibration accuracy
Trip O-D Information
The trip O-D information on which the multi-modal model is based is fairly outdated. Roadside interview O-D surveys for the highway model were undertaken in 2003 at only four locations. These do not provide a ‘watertight’ cordon or screen-line of all trip movements entering and leaving, or crossing, the study area. The household interview surveys completed in 2004 do give a reasonable picture of home-based trips, but do not cover trips entering the study area from outside or journeys made on employer’s business (e.g. road freight movements). Census data from 2001 give a reasonable indication of journey to work trips but excludes journeys for other purposes. Public Transport trip O-D data is very sparse, being taken from a small sample in the household interview surveys (2004). Additional part-trip public transport data (i.e. start and end stops for surveyed passengers) would enhance the trip matrices.
Traffic Count Information
Highway vehicle flow data for model calibration were adequate in number and spread across the study area, and sufficiently recent. However, passenger flow data for bus and rail were sparse. New bus boarding and alighting surveys were therefore undertaken in 2010 at nine locations, for each direction of travel. These were invaluable in calibrating the PT model, but more such data spread over considerably more locations would improve model accuracy. Rail passenger counts were undertaken at Eastbourne station in 2004 and are therefore somewhat dated.
Journey Time Information
Highway route journey time surveys were undertaken on seven routes in Eastbourne in 2003 and on four routes in Hailsham in 2008. The Eastbourne surveys are therefore somewhat dated.
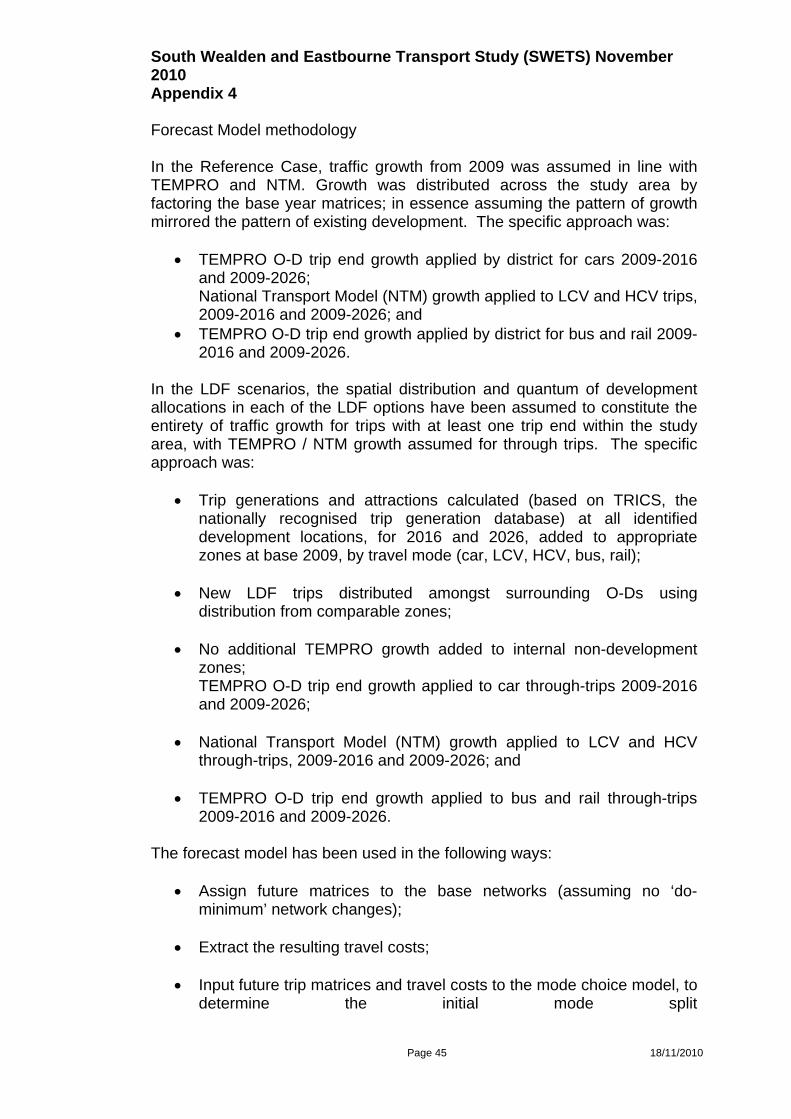
South Wealden and Eastbourne Transport Study (SWETS) November 2010
Page 45 18/11/2010
Appendix 4 Forecast Model methodology In the Reference Case, traffic growth from 2009 was assumed in line with TEMPRO and NTM. Growth was distributed across the study area by factoring the base year matrices; in essence assuming the pattern of growth mirrored the pattern of existing development. The specific approach was:
TEMPRO O-D trip end growth applied by district for cars 2009-2016
and 2009-2026; National Transport Model (NTM) growth applied to LCV and HCV trips, 2009-2016 and 2009-2026; and
TEMPRO O-D trip end growth applied by district for bus and rail 2009-2016 and 2009-2026.
In the LDF scenarios, the spatial distribution and quantum of development allocations in each of the LDF options have been assumed to constitute the entirety of traffic growth for trips with at least one trip end within the study area, with TEMPRO / NTM growth assumed for through trips. The specific approach was:
Trip generations and attractions calculated (based on TRICS, the nationally recognised trip generation database) at all identified development locations, for 2016 and 2026, added to appropriate zones at base 2009, by travel mode (car, LCV, HCV, bus, rail);
New LDF trips distributed amongst surrounding O-Ds using distribution from comparable zones;
No additional TEMPRO growth added to internal non-development
zones; TEMPRO O-D trip end growth applied to car through-trips 2009-2016 and 2009-2026;
National Transport Model (NTM) growth applied to LCV and HCV
through-trips, 2009-2016 and 2009-2026; and TEMPRO O-D trip end growth applied to bus and rail through-trips
2009-2016 and 2009-2026. The forecast model has been used in the following ways:
Assign future matrices to the base networks (assuming no ‘do-minimum’ network changes);
Extract the resulting travel costs;
Input future trip matrices and travel costs to the mode choice model, to
determine the initial mode split

South Wealden and Eastbourne Transport Study (SWETS) November 2010
Page 46 18/11/2010
Assign the mode-split matrices to the base network;
Extract relevant network outputs to identify key impacts upon the existing transport infrastructure;
Devise packages of appropriate transport interventions that will help to
mitigate adverse impacts;
Re-run with improved networks and new mode-split; and
Extract relevant network outputs to identify key impacts upon the improved transport infrastructure.

South Wealden and Eastbourne Transport Study (SWETS) November 2010
Page 47 18/11/2010
APPENDIX 5 TRANSPORT IMPACTS – SUMMARY RESULTS
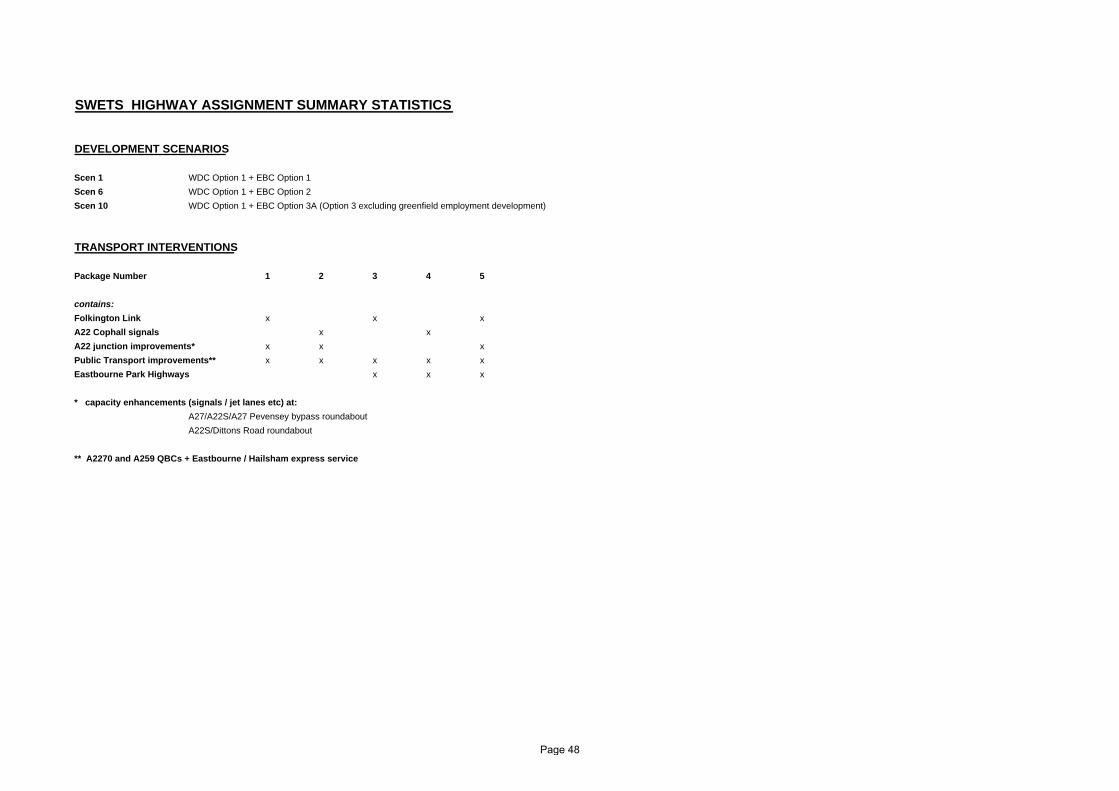
SWETS HIGHWAY ASSIGNMENT SUMMARY STATISTICS
DEVELOPMENT SCENARIOS
Scen 1 WDC Option 1 + EBC Option 1
Scen 6 WDC Option 1 + EBC Option 2
Scen 10 WDC Option 1 + EBC Option 3A (Option 3 excluding greenfield employment development)
TRANSPORT INTERVENTIONS
Package Number 1 2 3 4 5
contains:
Folkington Link x x x
A22 Cophall signals x x
A22 junction improvements* x x x
Public Transport improvements** x x x x x
Eastbourne Park Highways x x x
* capacity enhancements (signals / jet lanes etc) at:
A27/A22S/A27 Pevensey bypass roundabout
A22S/Dittons Road roundabout
** A2270 and A259 QBCs + Eastbourne / Hailsham express service
Page 48

EASTBOURNE AM PEAK
Year 2009 2016 2016 2016 2026 2026 2026 2026 2026 2026 2026 2026 2026 2026 2026Development Base year Ref Case Scen 1 Scen 1 Ref Case Scen 1 Scen 1 Scen 1 Scen 1 Scen 6 Scen 6 Scen 10 Scen 10 Scen 10 Scen 10Transport Package Int 1 Int 1 Int 1 - 10% Int 2 Int 1 Int 3 Int 4 Int 5
Matrix
SWETS area total 21665 23510 23218 25400 29842 29469% Growth v 2009 base 8.5 7.2 17.2 37.7 36.0
Network statistics
Total time 2140.7 2377.5 2296.4 2355.6 2703.6 3641.2 3587.6 2988.0 3765.6 3525.9 3550.4 3580.1 3252.2 3425.1 3532.5(pcu/hr)Total distance 81595.6 87952.4 86094.9 86493.0 94518.5 103160.3 108961.7 101769.7 107979.5 100135.3 108363.4 102771.7 102611.1 103600.4 107827.8(pcu kms / hr)Average Speed 38.1 37.0 37.5 36.7 35.0 28.3 30.4 34.1 28.7 28.4 30.5 28.7 31.6 30.2 30.5(kph)Total fuel consumption 6907.7 7646.6 7397.9 7493.8 8522.1 10401.5 10575.3 9273.5 10769 10005.0 10471.2 10259.1 9782.3 10133.6 10486.2(litres / hr)
Network performance
% Key jncs > 85% RFC 19 23 20 14 37 47 38 32 43 46 40 46 38 38 36
% Increase / reductionin traffic by routev. 2009 base year
A2270 6 4 -3 12 47 16 10 34 43 13 42 14 32 14A2021 7 5 6 15 39 35 20 44 38 32 40 2 6 11A2040 10 6 4 21 47 63 47 56 45 61 47 47 26 55A22S 12 11 4 22 7 65 43 49 9 58 10 58 26 58A2280 7 4 -3 16 18 29 25 15 17 29 17 33 16 -4A2290 -47 6 3 -50 28 29 22 31 28 32 29 22 23 10A259 9 7 9 18 41 52 31 51 41 44 41 41 31 33B2191 6 5 12 9 52 49 34 42 31 37 30 49 23 27B2103 13 10 7 40 64 46 26 58 69 50 66 36 62 44B2106 7 8 12 17 51 40 29 50 55 47 54 37 51 41average 3 7 5 12 39 43 29 43 38 40 38 34 30 29
Page 49
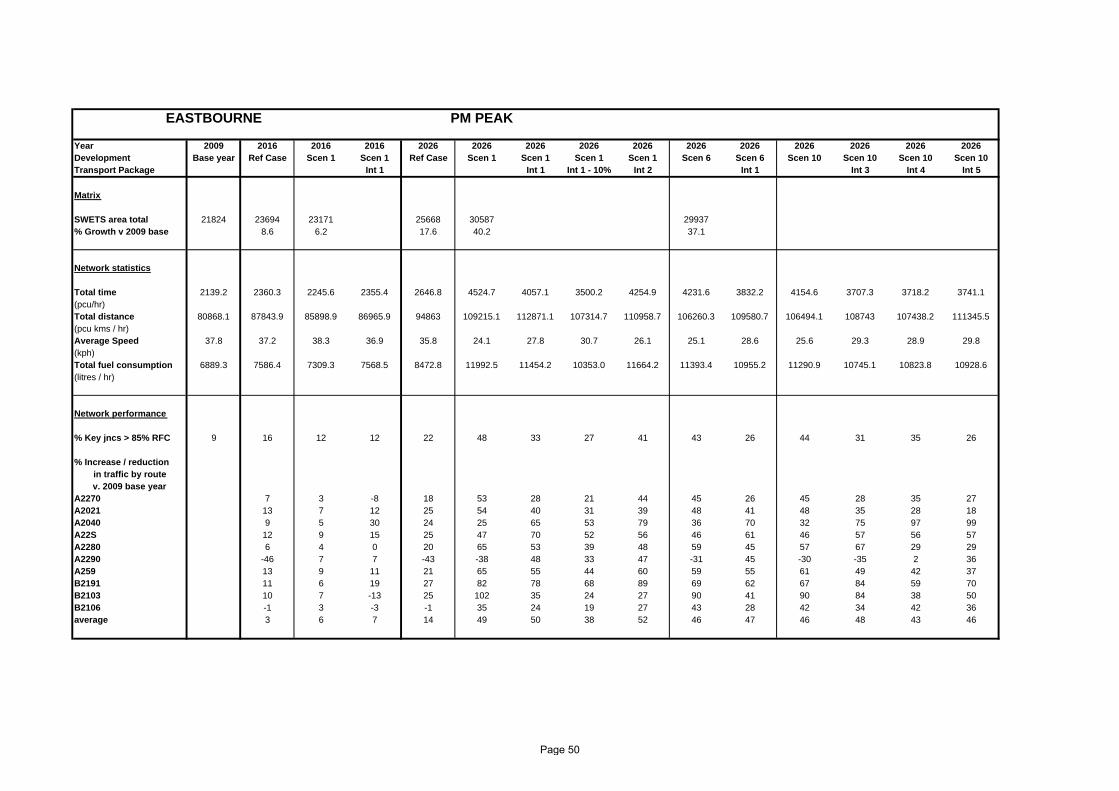
EASTBOURNE PM PEAK
Year 2009 2016 2016 2016 2026 2026 2026 2026 2026 2026 2026 2026 2026 2026 2026Development Base year Ref Case Scen 1 Scen 1 Ref Case Scen 1 Scen 1 Scen 1 Scen 1 Scen 6 Scen 6 Scen 10 Scen 10 Scen 10 Scen 10Transport Package Int 1 Int 1 Int 1 - 10% Int 2 Int 1 Int 3 Int 4 Int 5
Matrix
SWETS area total 21824 23694 23171 25668 30587 29937% Growth v 2009 base 8.6 6.2 17.6 40.2 37.1
Network statistics
Total time 2139.2 2360.3 2245.6 2355.4 2646.8 4524.7 4057.1 3500.2 4254.9 4231.6 3832.2 4154.6 3707.3 3718.2 3741.1(pcu/hr)Total distance 80868.1 87843.9 85898.9 86965.9 94863 109215.1 112871.1 107314.7 110958.7 106260.3 109580.7 106494.1 108743 107438.2 111345.5(pcu kms / hr)Average Speed 37.8 37.2 38.3 36.9 35.8 24.1 27.8 30.7 26.1 25.1 28.6 25.6 29.3 28.9 29.8(kph)Total fuel consumption 6889.3 7586.4 7309.3 7568.5 8472.8 11992.5 11454.2 10353.0 11664.2 11393.4 10955.2 11290.9 10745.1 10823.8 10928.6(litres / hr)
Network performance
% Key jncs > 85% RFC 9 16 12 12 22 48 33 27 41 43 26 44 31 35 26
% Increase / reductionin traffic by routev. 2009 base year
A2270 7 3 -8 18 53 28 21 44 45 26 45 28 35 27A2021 13 7 12 25 54 40 31 39 48 41 48 35 28 18A2040 9 5 30 24 25 65 53 79 36 70 32 75 97 99A22S 12 9 15 25 47 70 52 56 46 61 46 57 56 57A2280 6 4 0 20 65 53 39 48 59 45 57 67 29 29A2290 -46 7 7 -43 -38 48 33 47 -31 45 -30 -35 2 36A259 13 9 11 21 65 55 44 60 59 55 61 49 42 37B2191 11 6 19 27 82 78 68 89 69 62 67 84 59 70B2103 10 7 -13 25 102 35 24 27 90 41 90 84 38 50B2106 -1 3 -3 -1 35 24 19 27 43 28 42 34 42 36average 3 6 7 14 49 50 38 52 46 47 46 48 43 46
Page 50
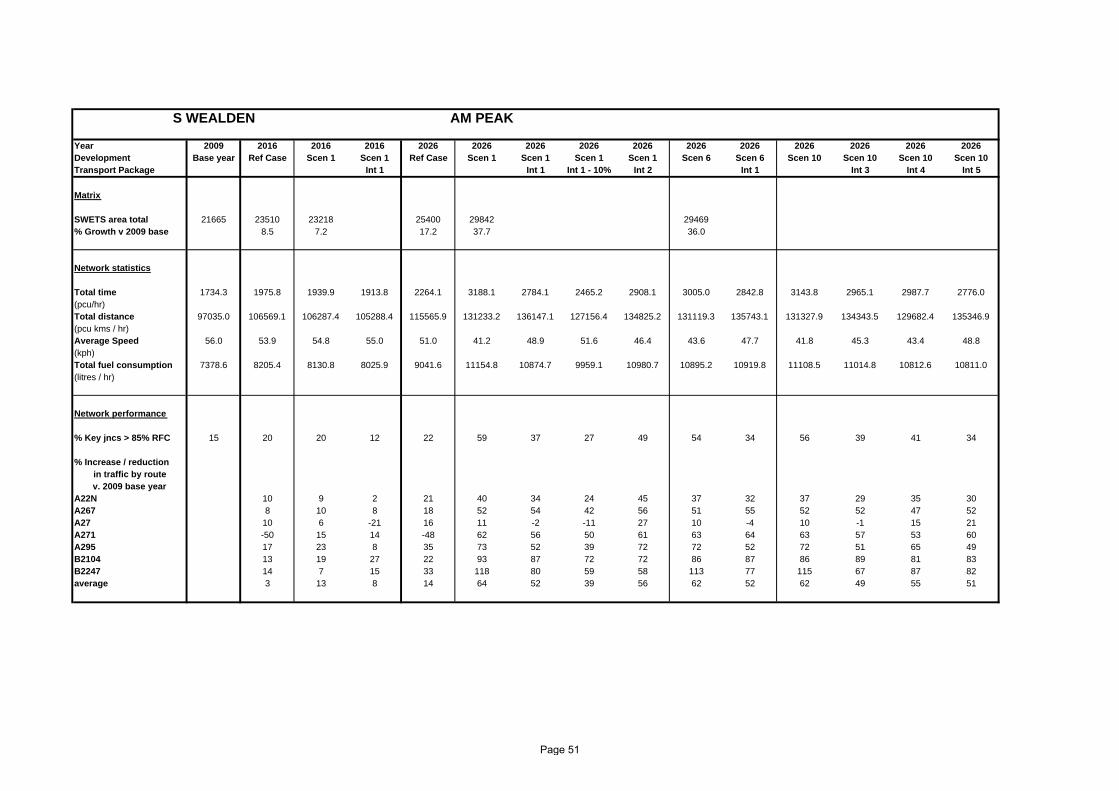
S WEALDEN AM PEAK
Year 2009 2016 2016 2016 2026 2026 2026 2026 2026 2026 2026 2026 2026 2026 2026Development Base year Ref Case Scen 1 Scen 1 Ref Case Scen 1 Scen 1 Scen 1 Scen 1 Scen 6 Scen 6 Scen 10 Scen 10 Scen 10 Scen 10Transport Package Int 1 Int 1 Int 1 - 10% Int 2 Int 1 Int 3 Int 4 Int 5
Matrix
SWETS area total 21665 23510 23218 25400 29842 29469% Growth v 2009 base 8.5 7.2 17.2 37.7 36.0
Network statistics
Total time 1734.3 1975.8 1939.9 1913.8 2264.1 3188.1 2784.1 2465.2 2908.1 3005.0 2842.8 3143.8 2965.1 2987.7 2776.0(pcu/hr)Total distance 97035.0 106569.1 106287.4 105288.4 115565.9 131233.2 136147.1 127156.4 134825.2 131119.3 135743.1 131327.9 134343.5 129682.4 135346.9(pcu kms / hr)Average Speed 56.0 53.9 54.8 55.0 51.0 41.2 48.9 51.6 46.4 43.6 47.7 41.8 45.3 43.4 48.8(kph)Total fuel consumption 7378.6 8205.4 8130.8 8025.9 9041.6 11154.8 10874.7 9959.1 10980.7 10895.2 10919.8 11108.5 11014.8 10812.6 10811.0(litres / hr)
Network performance
% Key jncs > 85% RFC 15 20 20 12 22 59 37 27 49 54 34 56 39 41 34
% Increase / reductionin traffic by routev. 2009 base year
A22N 10 9 2 21 40 34 24 45 37 32 37 29 35 30A267 8 10 8 18 52 54 42 56 51 55 52 52 47 52A27 10 6 -21 16 11 -2 -11 27 10 -4 10 -1 15 21A271 -50 15 14 -48 62 56 50 61 63 64 63 57 53 60A295 17 23 8 35 73 52 39 72 72 52 72 51 65 49B2104 13 19 27 22 93 87 72 72 86 87 86 89 81 83B2247 14 7 15 33 118 80 59 58 113 77 115 67 87 82average 3 13 8 14 64 52 39 56 62 52 62 49 55 51
Page 51
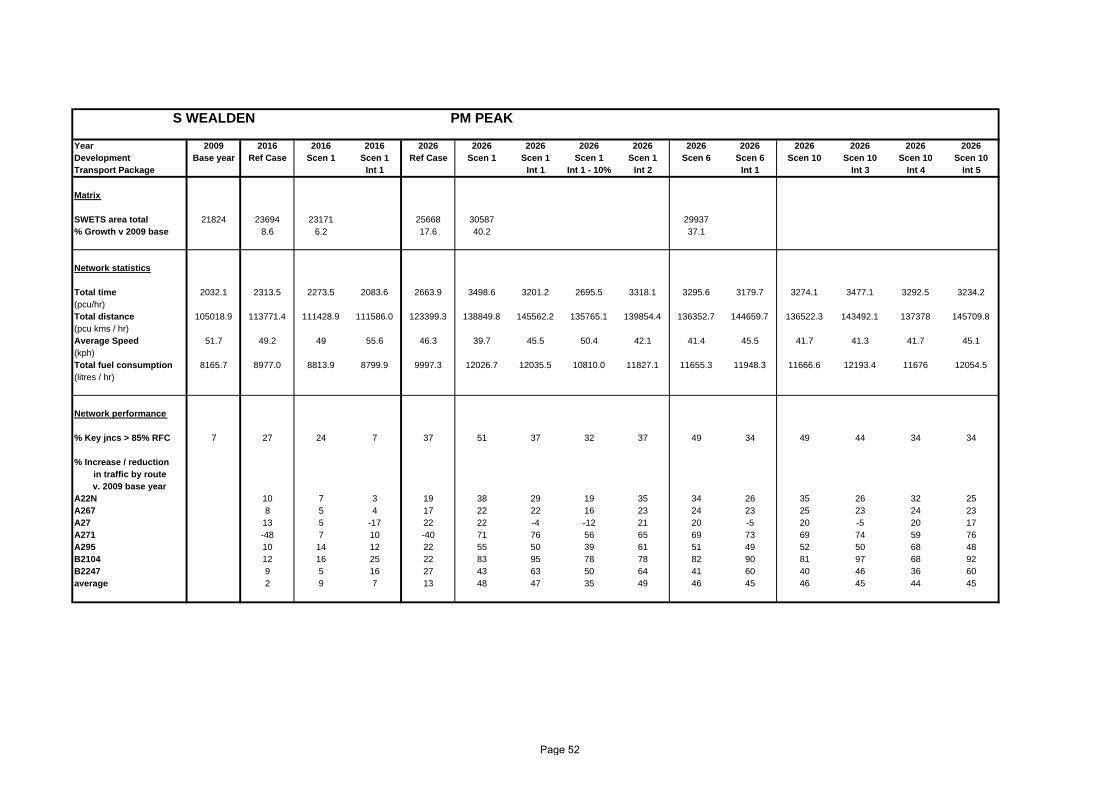
S WEALDEN PM PEAK
Year 2009 2016 2016 2016 2026 2026 2026 2026 2026 2026 2026 2026 2026 2026 2026Development Base year Ref Case Scen 1 Scen 1 Ref Case Scen 1 Scen 1 Scen 1 Scen 1 Scen 6 Scen 6 Scen 10 Scen 10 Scen 10 Scen 10Transport Package Int 1 Int 1 Int 1 - 10% Int 2 Int 1 Int 3 Int 4 Int 5
Matrix
SWETS area total 21824 23694 23171 25668 30587 29937% Growth v 2009 base 8.6 6.2 17.6 40.2 37.1
Network statistics
Total time 2032.1 2313.5 2273.5 2083.6 2663.9 3498.6 3201.2 2695.5 3318.1 3295.6 3179.7 3274.1 3477.1 3292.5 3234.2(pcu/hr)Total distance 105018.9 113771.4 111428.9 111586.0 123399.3 138849.8 145562.2 135765.1 139854.4 136352.7 144659.7 136522.3 143492.1 137378 145709.8(pcu kms / hr)Average Speed 51.7 49.2 49 55.6 46.3 39.7 45.5 50.4 42.1 41.4 45.5 41.7 41.3 41.7 45.1(kph)Total fuel consumption 8165.7 8977.0 8813.9 8799.9 9997.3 12026.7 12035.5 10810.0 11827.1 11655.3 11948.3 11666.6 12193.4 11676 12054.5(litres / hr)
Network performance
% Key jncs > 85% RFC 7 27 24 7 37 51 37 32 37 49 34 49 44 34 34
% Increase / reductionin traffic by routev. 2009 base year
A22N 10 7 3 19 38 29 19 35 34 26 35 26 32 25A267 8 5 4 17 22 22 16 23 24 23 25 23 24 23A27 13 5 -17 22 22 -4 -12 21 20 -5 20 -5 20 17A271 -48 7 10 -40 71 76 56 65 69 73 69 74 59 76A295 10 14 12 22 55 50 39 61 51 49 52 50 68 48B2104 12 16 25 22 83 95 78 78 82 90 81 97 68 92B2247 9 5 16 27 43 63 50 64 41 60 40 46 36 60average 2 9 7 13 48 47 35 49 46 45 46 45 44 45
Page 52
South Wealden and Eastbourne Transport Study (SWETS) November 2010
Page 53 18/11/2010
APPENDIX 6 TRANSPORT IMPACTS – DETAILED JUNCTION OUTPUTS
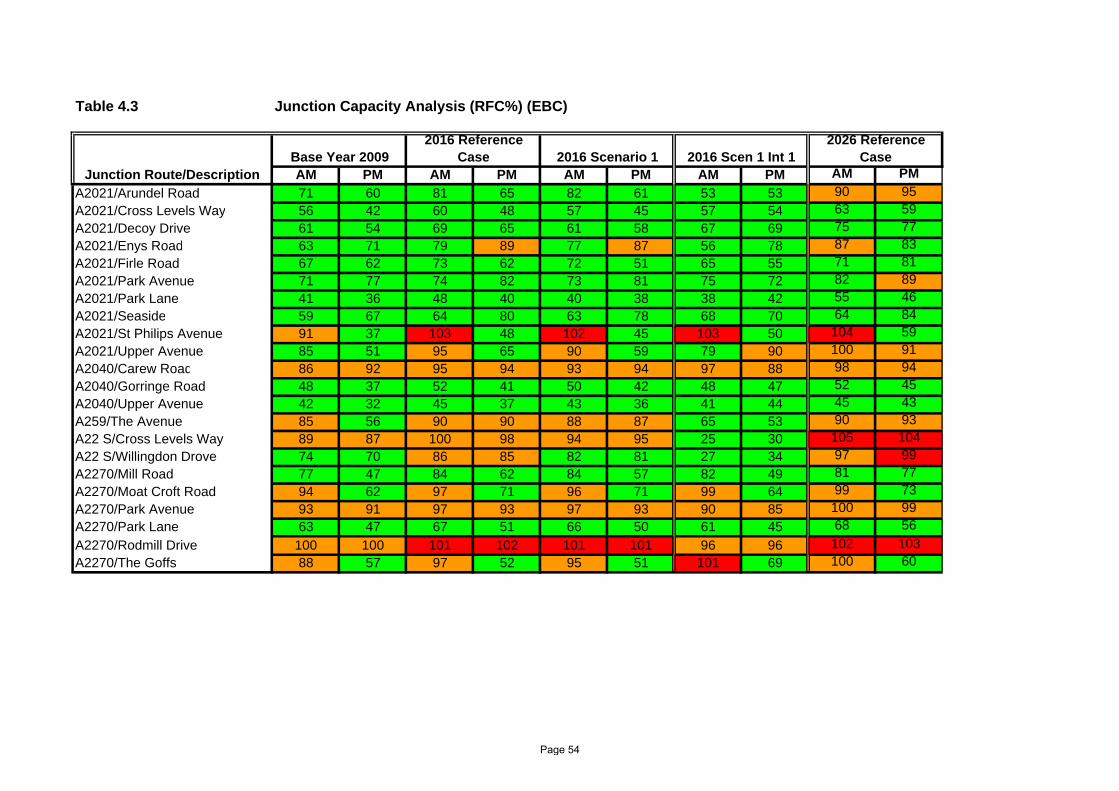
Table 4.3 Junction Capacity Analysis (RFC%) (EBC)
AM PM AM PM AM PM AM PM AM PM
A2021/Arundel Road 71 60 81 65 82 61 53 53 90 95
A2021/Cross Levels Way 56 42 60 48 57 45 57 54 63 59
A2021/Decoy Drive 61 54 69 65 61 58 67 69 75 77
A2021/Enys Road 63 71 79 89 77 87 56 78 87 83
A2021/Firle Road 67 62 73 62 72 51 65 55 71 81
A2021/Park Avenue 71 77 74 82 73 81 75 72 82 89
A2021/Park Lane 41 36 48 40 40 38 38 42 55 46
A2021/Seaside 59 67 64 80 63 78 68 70 64 84
A2021/St Philips Avenue 91 37 103 48 102 45 103 50 104 59
A2021/Upper Avenue 85 51 95 65 90 59 79 90 100 91
A2040/Carew Road 86 92 95 94 93 94 97 88 98 94
A2040/Gorringe Road 48 37 52 41 50 42 48 47 52 45
A2040/Upper Avenue 42 32 45 37 43 36 41 44 45 43
A259/The Avenue 85 56 90 90 88 87 65 53 90 93
A22 S/Cross Levels Way 89 87 100 98 94 95 25 30 105 104
A22 S/Willingdon Drove 74 70 86 85 82 81 27 34 97 99
A2270/Mill Road 77 47 84 62 84 57 82 49 81 77
A2270/Moat Croft Road 94 62 97 71 96 71 99 64 99 73
A2270/Park Avenue 93 91 97 93 97 93 90 85 100 99
A2270/Park Lane 63 47 67 51 66 50 61 45 68 56
A2270/Rodmill Drive 100 100 101 102 101 101 96 96 102 103
A2270/The Goffs 88 57 97 52 95 51 101 69 100 60
2016 Scen 1 Int 12026 Reference
CaseJunction Route/Description
Base Year 20092016 Reference
Case 2016 Scenario 1
Page 54
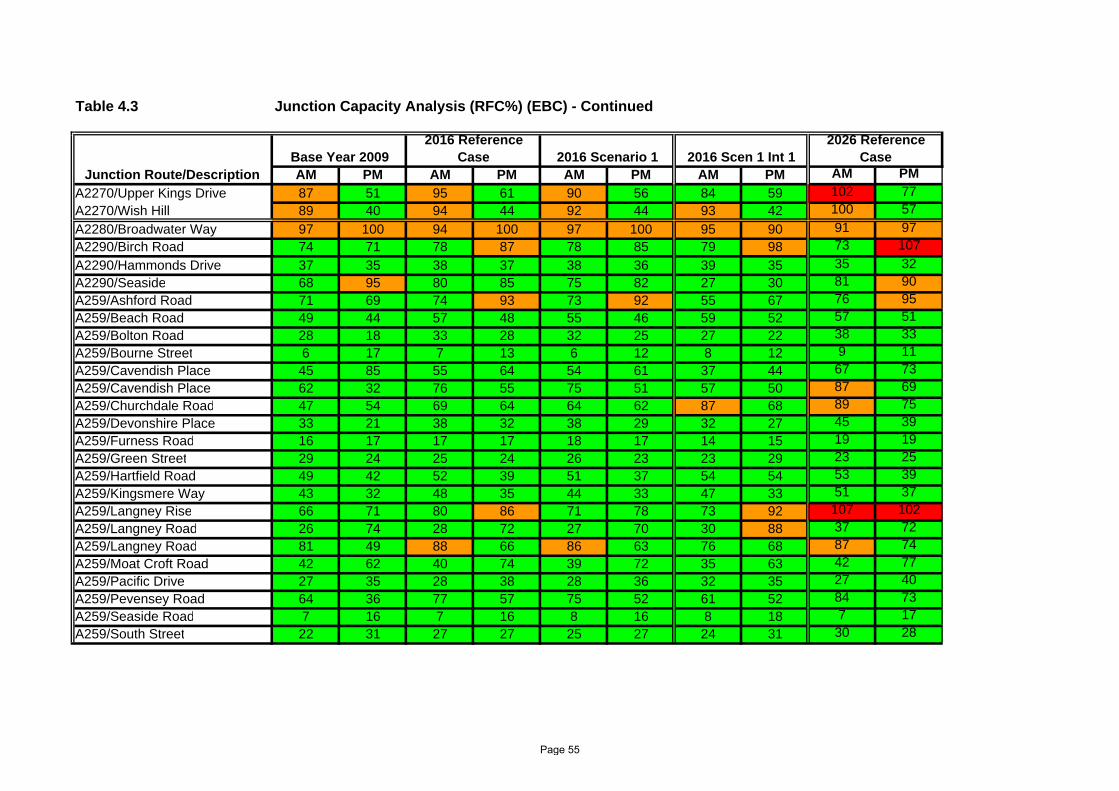
Table 4.3 Junction Capacity Analysis (RFC%) (EBC) - Continued
AM PM AM PM AM PM AM PM AM PM
A2270/Upper Kings Drive 87 51 95 61 90 56 84 59 102 77
A2270/Wish Hill 89 40 94 44 92 44 93 42 100 57
A2280/Broadwater Way 97 100 94 100 97 100 95 90 91 97
A2290/Birch Road 74 71 78 87 78 85 79 98 73 107
A2290/Hammonds Drive 37 35 38 37 38 36 39 35 35 32
A2290/Seaside 68 95 80 85 75 82 27 30 81 90
A259/Ashford Road 71 69 74 93 73 92 55 67 76 95
A259/Beach Road 49 44 57 48 55 46 59 52 57 51
A259/Bolton Road 28 18 33 28 32 25 27 22 38 33
A259/Bourne Street 6 17 7 13 6 12 8 12 9 11
A259/Cavendish Place 45 85 55 64 54 61 37 44 67 73
A259/Cavendish Place 62 32 76 55 75 51 57 50 87 69
A259/Churchdale Road 47 54 69 64 64 62 87 68 89 75
A259/Devonshire Place 33 21 38 32 38 29 32 27 45 39
A259/Furness Road 16 17 17 17 18 17 14 15 19 19
A259/Green Street 29 24 25 24 26 23 23 29 23 25
A259/Hartfield Road 49 42 52 39 51 37 54 54 53 39
A259/Kingsmere Way 43 32 48 35 44 33 47 33 51 37
A259/Langney Rise 66 71 80 86 71 78 73 92 107 102
A259/Langney Road 26 74 28 72 27 70 30 88 37 72
A259/Langney Road 81 49 88 66 86 63 76 68 87 74
A259/Moat Croft Road 42 62 40 74 39 72 35 63 42 77
A259/Pacific Drive 27 35 28 38 28 36 32 35 27 40
A259/Pevensey Road 64 36 77 57 75 52 61 52 84 73
A259/Seaside Road 7 16 7 16 8 16 8 18 7 17
A259/South Street 22 31 27 27 25 27 24 31 30 28
2016 Scen 1 Int 12026 Reference
CaseJunction Route/Description
Base Year 20092016 Reference
Case 2016 Scenario 1
Page 55

Table 4.3 Junction Capacity Analysis (RFC%) (EBC) - Continued
AM PM AM PM AM PM AM PM AM PM
A259/Southbourne Road 66 55 76 65 71 63 84 67 85 73
A259/Southfields Road 81 75 83 80 81 76 84 83 94 87
A259/Sovereign Harbour 35 53 36 57 35 54 40 55 38 60
A259/Spencer Road 14 11 16 10 16 10 15 8 18 12
A259/Susans Road 58 23 64 31 59 30 51 24 73 35
A259/Terminus Road 40 38 43 32 42 32 45 34 44 33
A259/Victoria Drive 91 80 94 69 92 68 84 82 96 81
A259/Warren Hill 67 44 78 59 74 55 74 40 93 67
A259/Woodgate Road 49 44 56 48 54 47 57 52 55 51
B2103/Beachy Head Road 16 10 19 14 18 13 17 7 23 15
B2103/Carlisle Road 21 15 24 10 23 14 21 10 27 10
B2103/Chesterfield Road 6 6 7 9 7 9 7 3 9 10
B2103/Chiswick Place 23 34 22 45 22 42 33 41 25 45
B2103/Devonshire Place 64 26 66 27 65 26 67 27 69 28
B2103/Holywell Road 6 7 8 11 8 11 8 4 12 13
B2104/Hide Hollow 66 42 92 49 80 47 62 54 104 65
B2104/Larkspur Drive 63 48 76 63 69 63 59 54 82 75
B2104/Pembury Road 95 87 100 96 97 98 97 96 106 99
B2104/Pennine Way 29 29 63 32 31 31 33 31 98 35
B2104/Priory Road 51 79 60 81 55 83 59 80 109 81
B2104/Sevenoaks Road 53 50 62 56 57 54 54 61 74 62
B2104/The Rising 86 64 87 82 83 79 79 81 112 70
B2104/Willingdon Drove 49 38 77 43 57 42 56 48 97 56
B2106/Beach Road 9 12 10 16 11 14 10 16 8 27
B2106/Beamsley Road 80 84 81 89 80 87 77 88 82 90
B2106/Cavendish Place 88 37 95 47 94 43 89 45 97 57
2016 Scen 1 Int 12026 Reference
CaseJunction Route/Description
Base Year 20092016 Reference
Case 2016 Scenario 1
Page 56
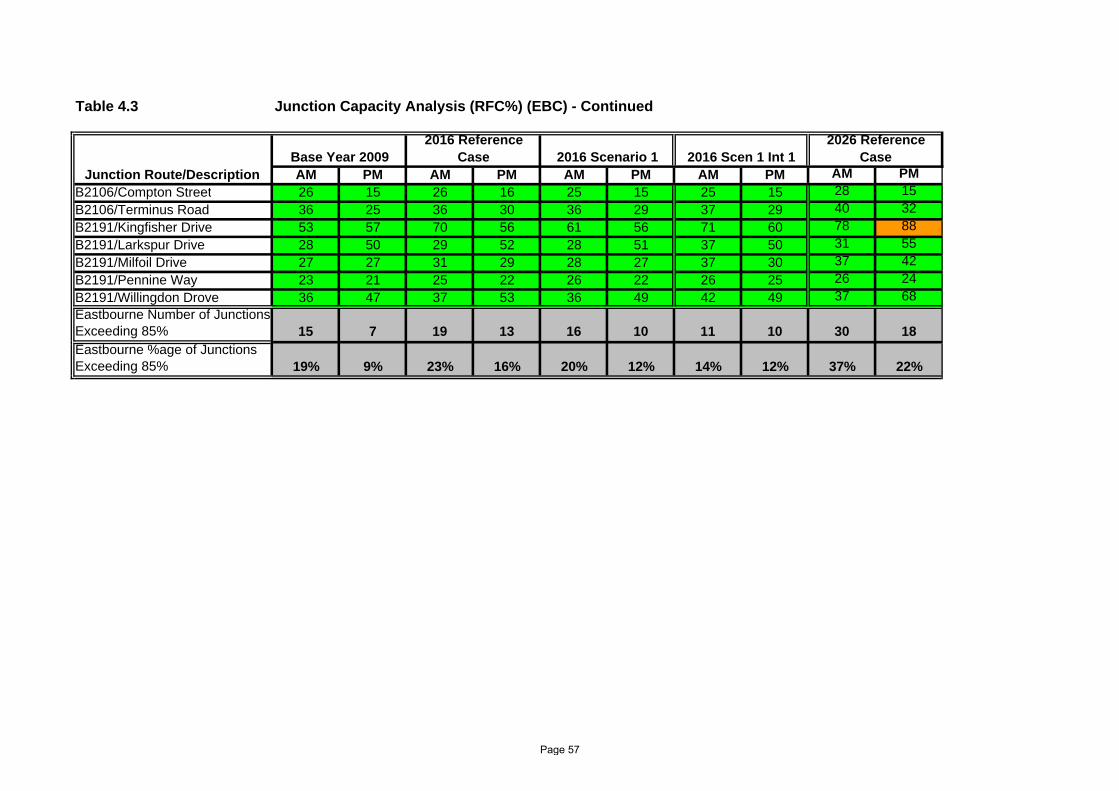
Table 4.3 Junction Capacity Analysis (RFC%) (EBC) - Continued
AM PM AM PM AM PM AM PM AM PM
B2106/Compton Street 26 15 26 16 25 15 25 15 28 15
B2106/Terminus Road 36 25 36 30 36 29 37 29 40 32
B2191/Kingfisher Drive 53 57 70 56 61 56 71 60 78 88
B2191/Larkspur Drive 28 50 29 52 28 51 37 50 31 55
B2191/Milfoil Drive 27 27 31 29 28 27 37 30 37 42
B2191/Pennine Way 23 21 25 22 26 22 26 25 26 24
B2191/Willingdon Drove 36 47 37 53 36 49 42 49 37 68Eastbourne Number of Junctions Exceeding 85% 15 7 19 13 16 10 11 10 30 18Eastbourne %age of Junctions Exceeding 85% 19% 9% 23% 16% 20% 12% 14% 12% 37% 22%
2016 Scen 1 Int 12026 Reference
CaseJunction Route/Description
Base Year 20092016 Reference
Case 2016 Scenario 1
Page 57
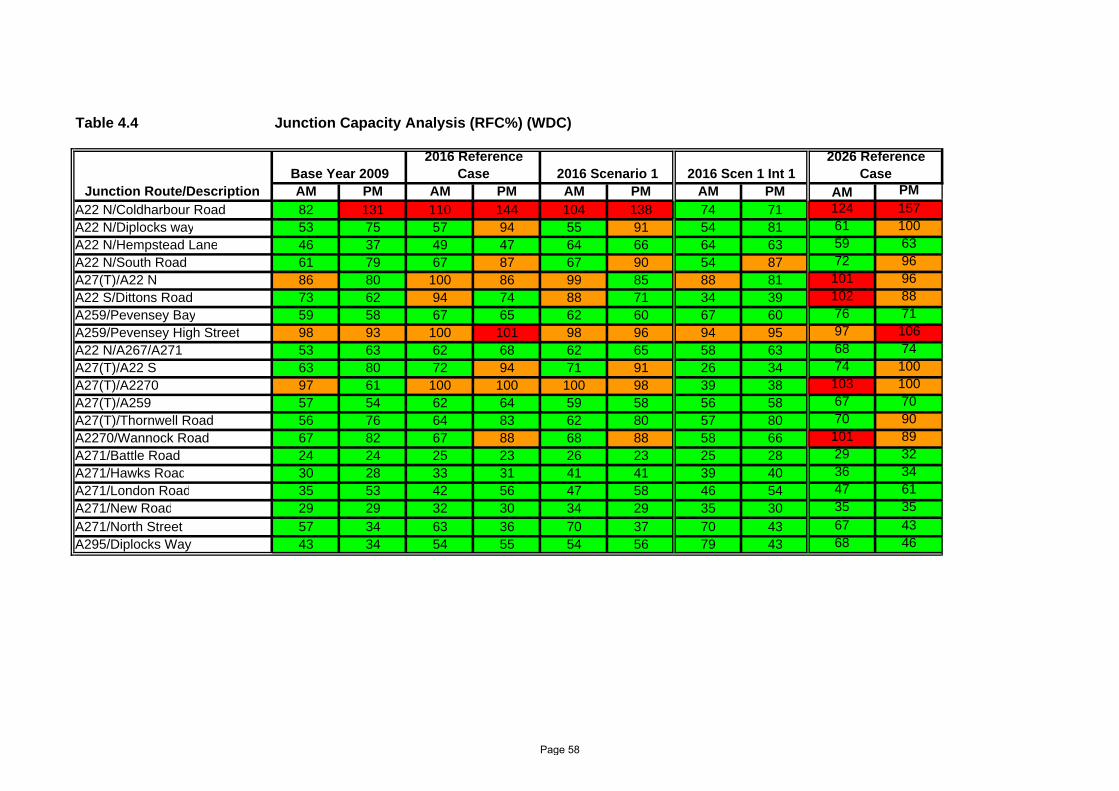
Table 4.4 Junction Capacity Analysis (RFC%) (WDC)
AM PM AM PM AM PM AM PM AM PM
A22 N/Coldharbour Road 82 131 110 144 104 138 74 71 124 157
A22 N/Diplocks way 53 75 57 94 55 91 54 81 61 100
A22 N/Hempstead Lane 46 37 49 47 64 66 64 63 59 63
A22 N/South Road 61 79 67 87 67 90 54 87 72 96
A27(T)/A22 N 86 80 100 86 99 85 88 81 101 96
A22 S/Dittons Road 73 62 94 74 88 71 34 39 102 88
A259/Pevensey Bay 59 58 67 65 62 60 67 60 76 71
A259/Pevensey High Street 98 93 100 101 98 96 94 95 97 106
A22 N/A267/A271 53 63 62 68 62 65 58 63 68 74
A27(T)/A22 S 63 80 72 94 71 91 26 34 74 100
A27(T)/A2270 97 61 100 100 100 98 39 38 103 100
A27(T)/A259 57 54 62 64 59 58 56 58 67 70
A27(T)/Thornwell Road 56 76 64 83 62 80 57 80 70 90
A2270/Wannock Road 67 82 67 88 68 88 58 66 101 89
A271/Battle Road 24 24 25 23 26 23 25 28 29 32
A271/Hawks Road 30 28 33 31 41 41 39 40 36 34
A271/London Road 35 53 42 56 47 58 46 54 47 61
A271/New Road 29 29 32 30 34 29 35 30 35 35
A271/North Street 57 34 63 36 70 37 70 43 67 43
A295/Diplocks Way 43 34 54 55 54 56 79 43 68 46
2016 Scen 1 Int 12026 Reference
Case2016 Reference
Case 2016 Scenario 1Junction Route/Description
Base Year 2009
Page 58

Table 4.4 Junction Capacity Analysis (RFC%) (WDC) - Continued
AM PM AM PM AM PM AM PM AM PM
A295/Ersham Road 35 40 42 46 44 51 75 55 46 50
A295/Harebeating Drive 27 21 29 22 34 25 31 25 32 25
A295/Harmers Hay Road 20 16 22 16 22 16 22 20 24 20
A295/Hawthylands Road 19 19 22 19 27 20 25 23 25 24
A295/High Street 53 40 55 43 54 40 52 43 58 51
A295/London Road 57 70 61 64 63 63 63 69 66 91
A295/North Street 81 46 85 89 83 89 43 38 88 89
A295/Station Road 24 31 26 41 27 42 26 32 27 42
A295/Tesco 25 31 28 35 28 34 27 33 30 39
A295/Western Road 45 42 48 73 52 77 47 54 52 95
B2104/A267 24 26 27 28 32 28 31 28 30 30
B2104/Church Road 12 8 13 8 19 9 18 9 14 9
B2104/Dittons Road 88 77 96 89 94 85 104 98 96 100
B2104/Hawks Road 35 43 35 43 45 53 47 65 38 52
B2104/London Road 22 37 24 45 36 56 33 58 31 56
B2191/Rattle Road 18 17 20 20 19 18 26 25 25 22
B2247/High Street 29 29 31 28 31 27 40 42 43 33
A2270/Broad Road 47 62 46 60 47 60 44 52 61 60
A2270/Church Street 69 57 72 61 71 58 65 63 73 68
A2270/Huggetts Lane 100 101 102 101 102 100 87 79 106 102
A2270/The Triangle 87 75 85 75 85 73 91 83 82 67South Wealden Number of Junctions Exceeding 85% 6 3 8 11 8 10 5 3 9 15South Wealden %age of Junctions Exceeding 85% 15% 7% 20% 27% 20% 24% 12% 7% 22% 37%
2016 Scen 1 Int 12026 Reference
CaseJunction Route/Description
Base Year 20092016 Reference
Case 2016 Scenario 1
Page 59
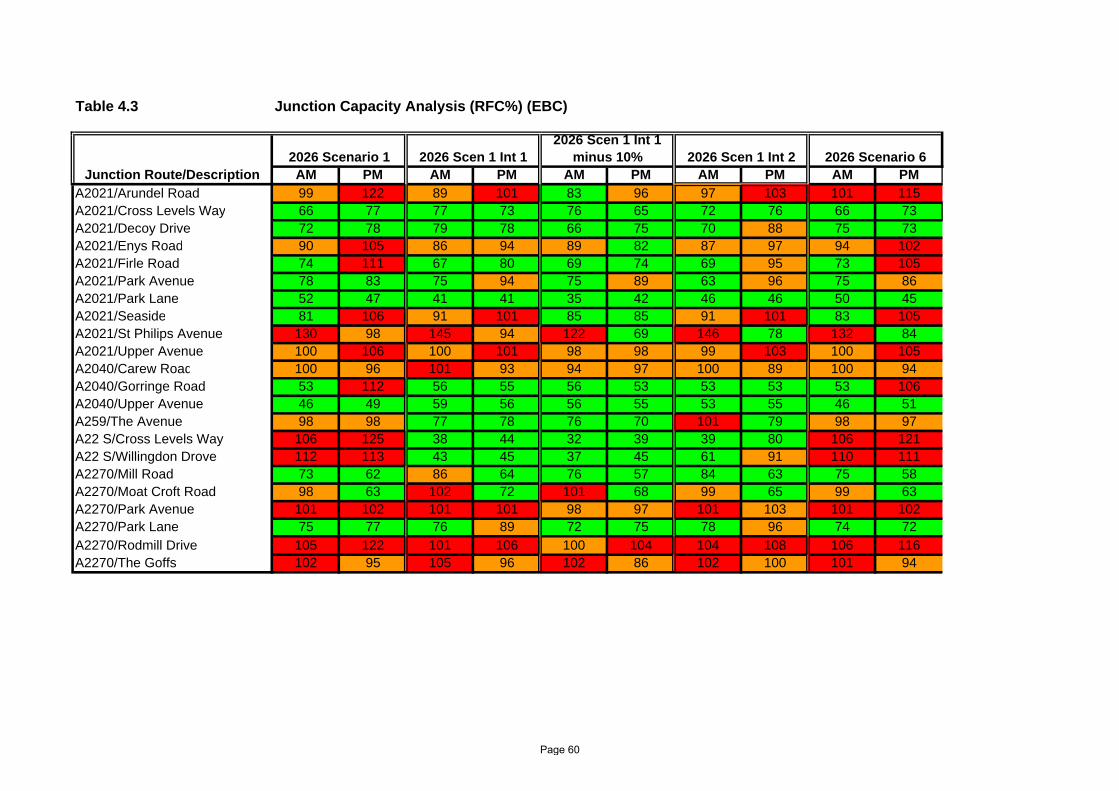
Table 4.3 Junction Capacity Analysis (RFC%) (EBC)
AM PM AM PM AM PM AM PM AM PMA2021/Arundel Road 99 122 89 101 83 96 97 103 101 115A2021/Cross Levels Way 66 77 77 73 76 65 72 76 66 73A2021/Decoy Drive 72 78 79 78 66 75 70 88 75 73A2021/Enys Road 90 105 86 94 89 82 87 97 94 102A2021/Firle Road 74 111 67 80 69 74 69 95 73 105A2021/Park Avenue 78 83 75 94 75 89 63 96 75 86A2021/Park Lane 52 47 41 41 35 42 46 46 50 45A2021/Seaside 81 106 91 101 85 85 91 101 83 105A2021/St Philips Avenue 130 98 145 94 122 69 146 78 132 84A2021/Upper Avenue 100 106 100 101 98 98 99 103 100 105A2040/Carew Road 100 96 101 93 94 97 100 89 100 94A2040/Gorringe Road 53 112 56 55 56 53 53 53 53 106A2040/Upper Avenue 46 49 59 56 56 55 53 55 46 51A259/The Avenue 98 98 77 78 76 70 101 79 98 97A22 S/Cross Levels Way 106 125 38 44 32 39 39 80 106 121A22 S/Willingdon Drove 112 113 43 45 37 45 61 91 110 111A2270/Mill Road 73 62 86 64 76 57 84 63 75 58A2270/Moat Croft Road 98 63 102 72 101 68 99 65 99 63A2270/Park Avenue 101 102 101 101 98 97 101 103 101 102A2270/Park Lane 75 77 76 89 72 75 78 96 74 72A2270/Rodmill Drive 105 122 101 106 100 104 104 108 106 116A2270/The Goffs 102 95 105 96 102 86 102 100 101 94
2026 Scen 1 Int 1 2026 Scen 1 Int 22026 Scen 1 Int 1
minus 10% 2026 Scenario 62026 Scenario 1Junction Route/Description
Page 60

Table 4.3 Junction Capacity Analysis (RFC%) (EBC) - Continued
AM PM AM PM AM PM AM PM AM PMA2270/Upper Kings Drive 105 97 103 89 92 88 103 102 104 90A2270/Wish Hill 108 74 101 74 99 67 105 63 106 66A2280/Broadwater Way 86 95 104 95 99 94 104 95 86 95A2290/Birch Road 86 53 106 161 100 131 106 159 87 56A2290/Hammonds Drive 37 26 48 45 47 43 48 45 38 27A2290/Seaside 93 116 33 38 33 37 41 48 91 115A259/Ashford Road 96 101 84 93 75 88 96 90 95 100A259/Beach Road 62 68 66 73 66 66 66 69 62 63A259/Bolton Road 38 47 36 37 35 35 41 49 39 47A259/Bourne Street 12 78 11 18 10 8 30 20 14 52A259/Cavendish Place 79 68 48 65 41 68 81 88 80 71A259/Cavendish Place 93 91 82 72 82 67 95 94 93 92A259/Churchdale Road 122 82 145 88 114 87 147 86 125 77A259/Devonshire Place 45 57 42 45 41 42 48 58 46 56A259/Furness Road 24 18 26 27 25 26 29 25 24 19A259/Green Street 21 26 23 26 23 25 23 26 21 25A259/Hartfield Road 53 47 58 48 56 47 63 47 53 48A259/Kingsmere Way 53 35 51 39 48 38 50 40 53 36A259/Langney Rise 118 121 105 105 88 103 106 108 112 114A259/Langney Road 52 107 88 104 85 103 50 110 52 108A259/Langney Road 91 93 90 89 89 89 92 89 91 93A259/Moat Croft Road 42 76 46 78 38 76 46 75 40 79A259/Pacific Drive 36 43 31 39 32 39 34 40 37 40A259/Pevensey Road 89 105 84 96 83 93 98 101 89 104A259/Seaside Road 10 19 10 34 9 35 10 18 10 18A259/South Street 41 35 50 48 48 46 38 50 41 35
2026 Scen 1 Int 1 2026 Scen 1 Int 22026 Scen 1 Int 1
minus 10% 2026 Scenario 62026 Scenario 1Junction Route/Description
Page 61
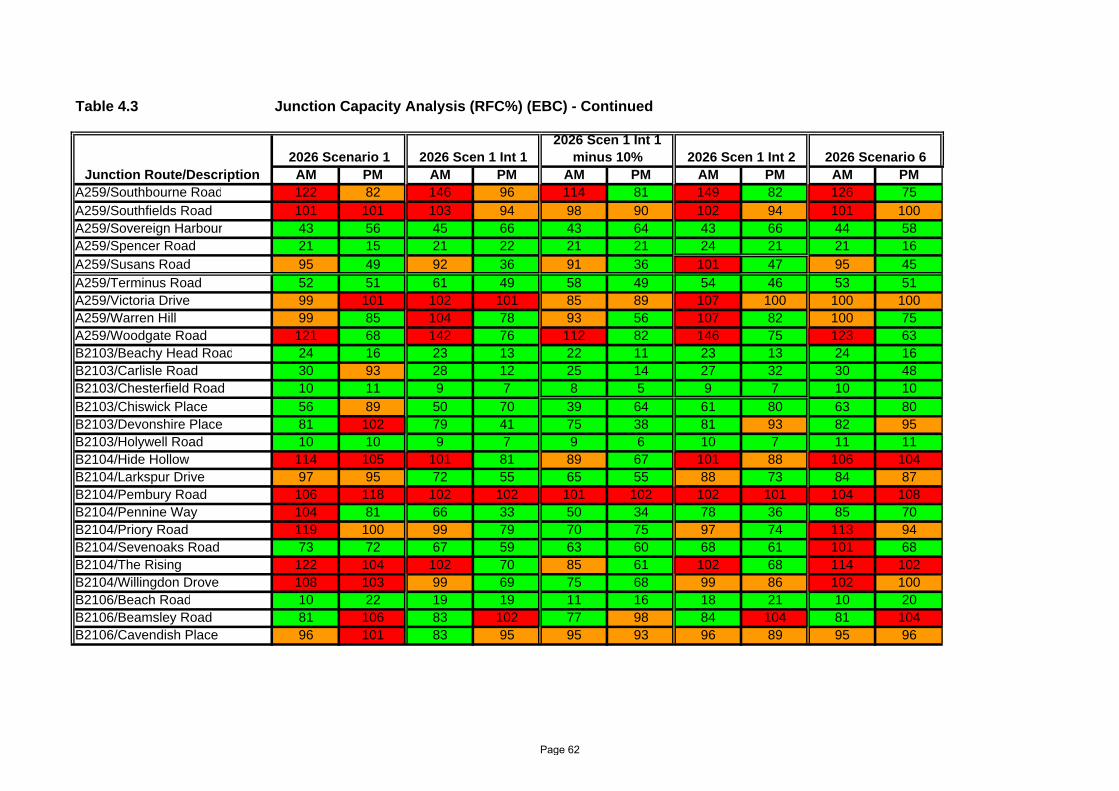
Table 4.3 Junction Capacity Analysis (RFC%) (EBC) - Continued
AM PM AM PM AM PM AM PM AM PMA259/Southbourne Road 122 82 146 96 114 81 149 82 126 75A259/Southfields Road 101 101 103 94 98 90 102 94 101 100A259/Sovereign Harbour 43 56 45 66 43 64 43 66 44 58A259/Spencer Road 21 15 21 22 21 21 24 21 21 16A259/Susans Road 95 49 92 36 91 36 101 47 95 45A259/Terminus Road 52 51 61 49 58 49 54 46 53 51A259/Victoria Drive 99 101 102 101 85 89 107 100 100 100A259/Warren Hill 99 85 104 78 93 56 107 82 100 75A259/Woodgate Road 121 68 142 76 112 82 146 75 123 63B2103/Beachy Head Road 24 16 23 13 22 11 23 13 24 16B2103/Carlisle Road 30 93 28 12 25 14 27 32 30 48B2103/Chesterfield Road 10 11 9 7 8 5 9 7 10 10B2103/Chiswick Place 56 89 50 70 39 64 61 80 63 80B2103/Devonshire Place 81 102 79 41 75 38 81 93 82 95B2103/Holywell Road 10 10 9 7 9 6 10 7 11 11B2104/Hide Hollow 114 105 101 81 89 67 101 88 106 104B2104/Larkspur Drive 97 95 72 55 65 55 88 73 84 87B2104/Pembury Road 106 118 102 102 101 102 102 101 104 108B2104/Pennine Way 104 81 66 33 50 34 78 36 85 70B2104/Priory Road 119 100 99 79 70 75 97 74 113 94B2104/Sevenoaks Road 73 72 67 59 63 60 68 61 101 68B2104/The Rising 122 104 102 70 85 61 102 68 114 102B2104/Willingdon Drove 108 103 99 69 75 68 99 86 102 100B2106/Beach Road 10 22 19 19 11 16 18 21 10 20B2106/Beamsley Road 81 106 83 102 77 98 84 104 81 104B2106/Cavendish Place 96 101 83 95 95 93 96 89 95 96
2026 Scen 1 Int 1 2026 Scen 1 Int 22026 Scen 1 Int 1
minus 10% 2026 Scenario 62026 Scenario 1Junction Route/Description
Page 62
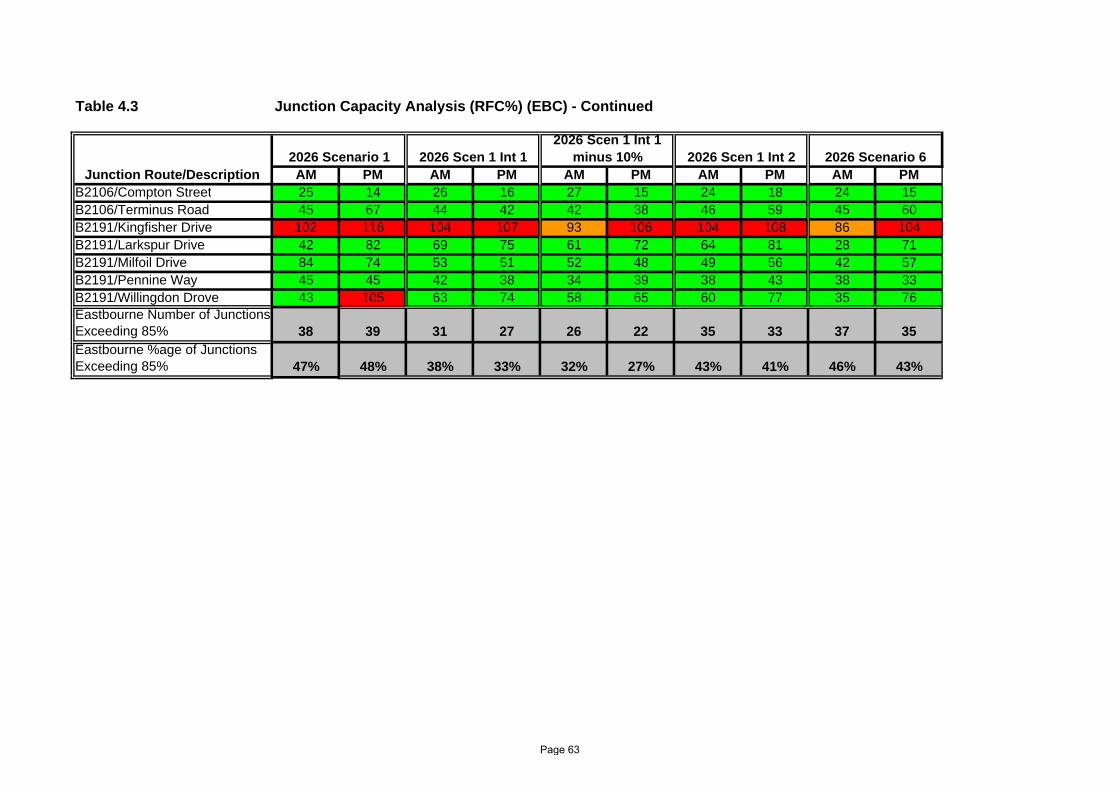
Table 4.3 Junction Capacity Analysis (RFC%) (EBC) - Continued
AM PM AM PM AM PM AM PM AM PMB2106/Compton Street 25 14 26 16 27 15 24 18 24 15B2106/Terminus Road 45 67 44 42 42 38 46 59 45 60B2191/Kingfisher Drive 102 116 104 107 93 106 104 108 86 104B2191/Larkspur Drive 42 82 69 75 61 72 64 81 28 71B2191/Milfoil Drive 84 74 53 51 52 48 49 56 42 57B2191/Pennine Way 45 45 42 38 34 39 38 43 38 33B2191/Willingdon Drove 43 105 63 74 58 65 60 77 35 76Eastbourne Number of Junctions Exceeding 85% 38 39 31 27 26 22 35 33 37 35Eastbourne %age of Junctions Exceeding 85% 47% 48% 38% 33% 32% 27% 43% 41% 46% 43%
2026 Scenario 62026 Scen 1 Int 1 2026 Scen 1 Int 22026 Scen 1 Int 1
minus 10%2026 Scenario 1Junction Route/Description
Page 63

Table 4.4 Junction Capacity Analysis (RFC%) (WDC)
AM PM AM PM AM PM AM PM AM PMA22 N/Coldharbour Road 127 164 80 85 77 79 130 167 126 163A22 N/Diplocks way 97 104 101 99 90 100 91 103 93 103A22 N/Hempstead Lane 105 84 102 96 98 92 103 95 104 83A22 N/South Road 87 104 81 91 72 94 95 105 86 103A27(T)/A22 N 107 97 97 85 90 82 75 70 106 99A22 S/Dittons Road 121 90 52 52 48 47 82 100 118 90A259/Pevensey Bay 79 59 82 65 69 62 84 66 80 60A259/Pevensey High Street 110 112 95 104 100 102 99 105 112 111A22 N/A267/A271 97 101 98 100 84 87 97 98 90 100A27(T)/A22 S 47 103 39 43 33 38 46 43 47 103A27(T)/A2270 94 92 43 44 42 43 100 63 88 94A27(T)/A259 68 67 73 61 58 65 86 73 69 68A27(T)/Thornwell Road 83 102 75 119 72 95 86 104 80 103A2270/Wannock Road 112 92 74 77 67 72 103 102 108 91A271/Battle Road 33 38 32 50 30 39 31 39 33 37A271/Hawks Road 97 96 95 97 90 97 89 97 95 95A271/London Road 97 77 96 78 87 71 86 84 96 79A271/New Road 47 36 43 42 40 34 42 35 45 36A271/North Street 96 69 96 70 94 66 95 70 96 68A295/Diplocks Way 96 78 89 63 87 54 88 66 96 68
2026 Scen 1 Int 22026 Scen 1 Int 1Junction Route/Description
2026 Scen 1 Int 1 minus 10% 2026 Scenario 62026 Scenario 1
Page 64

Table 4.4 Junction Capacity Analysis (RFC%) (WDC) - Continued
AM PM AM PM AM PM AM PM AM PMA295/Ersham Road 95 79 110 104 104 96 75 82 90 79A295/Harebeating Drive 45 48 39 40 38 35 44 38 44 48A295/Harmers Hay Road 30 25 29 31 26 28 30 28 30 25A295/Hawthylands Road 53 31 48 38 43 34 52 34 52 31A295/High Street 65 108 62 55 58 58 65 58 64 108A295/London Road 88 113 83 101 77 94 87 105 87 113A295/North Street 88 114 46 48 44 43 89 53 88 114A295/Station Road 34 115 33 42 31 35 34 43 33 115A295/Tesco 37 50 32 48 30 44 36 48 37 50A295/Western Road 102 104 95 94 83 83 101 100 96 104B2104/A267 44 34 44 34 40 31 41 34 45 34B2104/Church Road 87 12 86 16 81 30 82 21 84 18B2104/Dittons Road 104 118 112 124 110 107 103 105 105 119B2104/Hawks Road 62 66 60 84 58 86 56 80 62 67B2104/London Road 61 81 55 93 53 95 54 91 59 81B2191/Rattle Road 38 31 42 40 35 40 38 41 35 31B2247/High Street 114 43 58 50 50 47 57 57 110 44A2270/Broad Road 102 95 60 85 50 75 83 94 97 95A2270/Church Street 76 73 93 71 72 72 88 69 76 70A2270/Huggetts Lane 115 117 100 100 95 96 112 107 113 117A2270/The Triangle 93 100 77 71 81 72 79 78 80 74South Wealden Number of Junctions Exceeding 85% 24 21 15 15 11 13 20 15 22 20South Wealden %age of Junctions Exceeding 85% 59% 51% 37% 37% 27% 32% 49% 37% 54% 49%
2026 Scen 1 Int 22026 Scen 1 Int 1
minus 10%2026 Scen 1 Int 1Junction Route/Description
2026 Scenario 62026 Scenario 1
Page 65
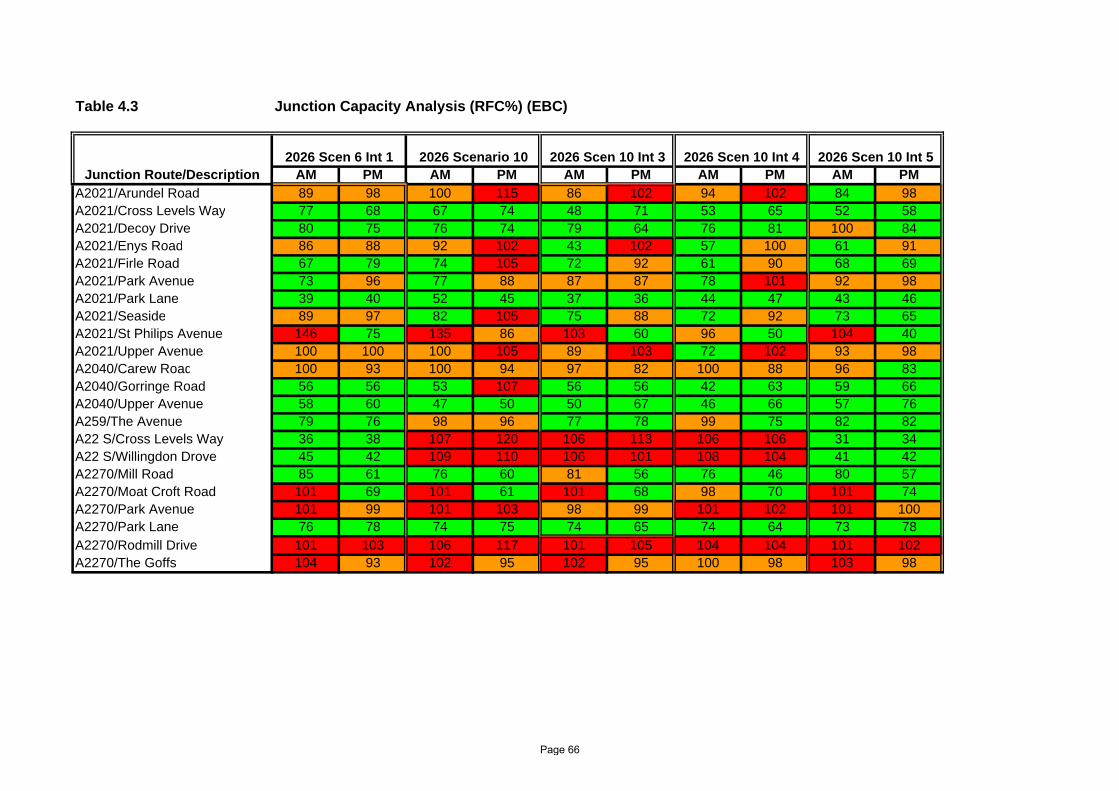
Table 4.3 Junction Capacity Analysis (RFC%) (EBC)
AM PM AM PM AM PM AM PM AM PMA2021/Arundel Road 89 98 100 115 86 102 94 102 84 98A2021/Cross Levels Way 77 68 67 74 48 71 53 65 52 58A2021/Decoy Drive 80 75 76 74 79 64 76 81 100 84A2021/Enys Road 86 88 92 102 43 102 57 100 61 91A2021/Firle Road 67 79 74 105 72 92 61 90 68 69A2021/Park Avenue 73 96 77 88 87 87 78 101 92 98A2021/Park Lane 39 40 52 45 37 36 44 47 43 46A2021/Seaside 89 97 82 105 75 88 72 92 73 65A2021/St Philips Avenue 146 75 135 86 103 60 96 50 104 40A2021/Upper Avenue 100 100 100 105 89 103 72 102 93 98A2040/Carew Road 100 93 100 94 97 82 100 88 96 83A2040/Gorringe Road 56 56 53 107 56 56 42 63 59 66A2040/Upper Avenue 58 60 47 50 50 67 46 66 57 76A259/The Avenue 79 76 98 96 77 78 99 75 82 82A22 S/Cross Levels Way 36 38 107 120 106 113 106 106 31 34A22 S/Willingdon Drove 45 42 109 110 106 101 108 104 41 42A2270/Mill Road 85 61 76 60 81 56 76 46 80 57A2270/Moat Croft Road 101 69 101 61 101 68 98 70 101 74A2270/Park Avenue 101 99 101 103 98 99 101 102 101 100A2270/Park Lane 76 78 74 75 74 65 74 64 73 78A2270/Rodmill Drive 101 103 106 117 101 105 104 104 101 102A2270/The Goffs 104 93 102 95 102 95 100 98 103 98
Junction Route/Description2026 Scen 10 Int 52026 Scen 10 Int 42026 Scen 10 Int 32026 Scen 6 Int 1 2026 Scenario 10
Page 66

Table 4.3 Junction Capacity Analysis (RFC%) (EBC) - Continued
AM PM AM PM AM PM AM PM AM PMA2270/Upper Kings Drive 101 89 104 91 105 76 97 87 106 83A2270/Wish Hill 101 72 106 67 95 71 101 67 100 77A2280/Broadwater Way 102 96 87 96 86 97 90 97 91 97A2290/Birch Road 104 158 87 57 82 78 82 102 81 121A2290/Hammonds Drive 48 44 38 28 40 22 38 30 100 49A2290/Seaside 33 39 92 115 87 110 80 95 29 33A259/Ashford Road 86 94 95 100 85 98 98 91 83 99A259/Beach Road 69 71 63 64 61 71 53 54 58 53A259/Bolton Road 35 34 39 47 35 32 39 44 37 35A259/Bourne Street 11 24 13 60 10 29 7 10 10 9A259/Cavendish Place 48 67 78 66 46 58 79 90 47 87A259/Cavendish Place 82 68 92 91 83 73 97 92 84 75A259/Churchdale Road 149 83 126 79 87 72 81 73 95 75A259/Devonshire Place 41 41 46 56 41 38 46 52 43 41A259/Furness Road 26 28 24 21 26 27 25 25 24 26A259/Green Street 24 26 21 26 24 25 21 26 22 24A259/Hartfield Road 56 46 53 48 57 50 53 57 56 51A259/Kingsmere Way 53 39 53 35 54 36 53 38 53 38A259/Langney Rise 102 103 112 113 119 110 111 109 109 108A259/Langney Road 90 104 52 108 84 105 51 111 66 105A259/Langney Road 91 87 91 94 89 85 91 85 89 87A259/Moat Croft Road 45 74 42 77 41 70 46 77 43 81A259/Pacific Drive 32 40 37 41 36 38 38 39 37 40A259/Pevensey Road 84 97 89 103 83 93 94 87 87 101A259/Seaside Road 10 42 10 18 10 49 10 18 10 47A259/South Street 50 47 40 35 53 49 42 53 51 54
2026 Scenario 10 2026 Scen 10 Int 3 2026 Scen 10 Int 4 2026 Scen 10 Int 5Junction Route/Description
2026 Scen 6 Int 1
Page 67
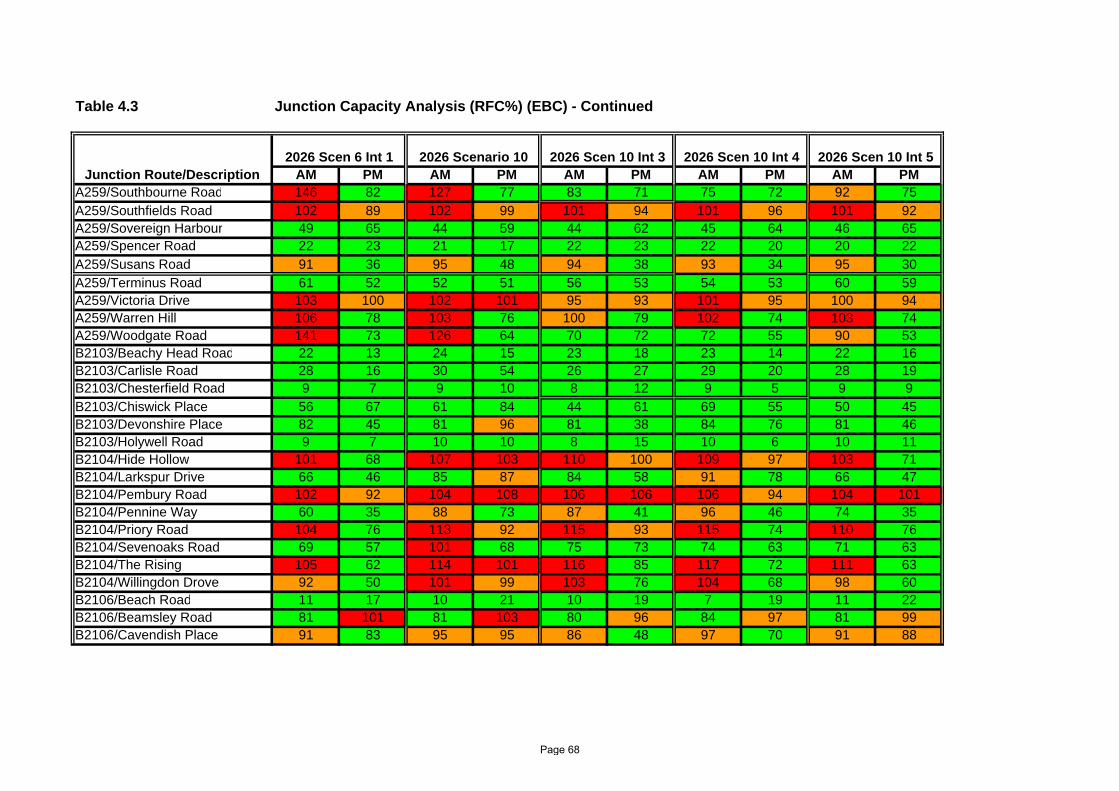
Table 4.3 Junction Capacity Analysis (RFC%) (EBC) - Continued
AM PM AM PM AM PM AM PM AM PMA259/Southbourne Road 146 82 127 77 83 71 75 72 92 75A259/Southfields Road 102 89 102 99 101 94 101 96 101 92A259/Sovereign Harbour 49 65 44 59 44 62 45 64 46 65A259/Spencer Road 22 23 21 17 22 23 22 20 20 22A259/Susans Road 91 36 95 48 94 38 93 34 95 30A259/Terminus Road 61 52 52 51 56 53 54 53 60 59A259/Victoria Drive 103 100 102 101 95 93 101 95 100 94A259/Warren Hill 106 78 103 76 100 79 102 74 103 74A259/Woodgate Road 141 73 126 64 70 72 72 55 90 53B2103/Beachy Head Road 22 13 24 15 23 18 23 14 22 16B2103/Carlisle Road 28 16 30 54 26 27 29 20 28 19B2103/Chesterfield Road 9 7 9 10 8 12 9 5 9 9B2103/Chiswick Place 56 67 61 84 44 61 69 55 50 45B2103/Devonshire Place 82 45 81 96 81 38 84 76 81 46B2103/Holywell Road 9 7 10 10 8 15 10 6 10 11B2104/Hide Hollow 101 68 107 103 110 100 109 97 103 71B2104/Larkspur Drive 66 46 85 87 84 58 91 78 66 47B2104/Pembury Road 102 92 104 108 106 106 106 94 104 101B2104/Pennine Way 60 35 88 73 87 41 96 46 74 35B2104/Priory Road 104 76 113 92 115 93 115 74 110 76B2104/Sevenoaks Road 69 57 101 68 75 73 74 63 71 63B2104/The Rising 105 62 114 101 116 85 117 72 111 63B2104/Willingdon Drove 92 50 101 99 103 76 104 68 98 60B2106/Beach Road 11 17 10 21 10 19 7 19 11 22B2106/Beamsley Road 81 101 81 103 80 96 84 97 81 99B2106/Cavendish Place 91 83 95 95 86 48 97 70 91 88
2026 Scen 10 Int 52026 Scen 6 Int 1 2026 Scen 10 Int 42026 Scen 10 Int 3Junction Route/Description
2026 Scenario 10
Page 68

Table 4.3 Junction Capacity Analysis (RFC%) (EBC) - Continued
AM PM AM PM AM PM AM PM AM PMB2106/Compton Street 26 17 24 15 29 18 25 21 26 18B2106/Terminus Road 46 40 45 61 45 38 49 49 45 34B2191/Kingfisher Drive 85 70 83 103 99 103 96 97 78 105B2191/Larkspur Drive 52 58 28 70 28 56 31 52 32 57B2191/Milfoil Drive 41 34 40 57 59 58 55 49 33 46B2191/Pennine Way 40 37 36 32 53 38 32 32 44 39B2191/Willingdon Drove 53 58 35 74 35 69 33 68 40 57Eastbourne Number of Junctions Exceeding 85% 32 21 37 36 31 25 31 28 29 21Eastbourne %age of Junctions Exceeding 85% 40% 26% 46% 44% 38% 31% 38% 35% 36% 26%
Junction Route/Description2026 Scen 10 Int 4 2026 Scen 10 Int 52026 Scen 6 Int 1 2026 Scen 10 Int 32026 Scenario 10
Page 69

Table 4.4 Junction Capacity Analysis (RFC%) (WDC)
AM PM AM PM AM PM AM PM AM PMA22 N/Coldharbour Road 82 83 126 164 85 84 128 165 80 84A22 N/Diplocks way 100 99 93 104 87 99 85 101 98 99A22 N/Hempstead Lane 101 95 104 83 100 95 100 83 101 88A22 N/South Road 75 91 87 103 68 93 89 105 75 87A27(T)/A22 N 102 84 105 99 102 92 70 62 98 81A22 S/Dittons Road 55 51 117 90 120 106 116 101 54 48A259/Pevensey Bay 79 65 79 60 82 66 79 64 81 65A259/Pevensey High Street 99 103 110 111 104 108 112 105 100 103A22 N/A267/A271 95 99 91 100 91 99 88 96 94 99A27(T)/A22 S 39 40 48 103 90 129 53 104 39 37A27(T)/A2270 40 44 88 94 42 43 100 59 44 48A27(T)/A259 68 60 68 67 64 62 73 64 67 62A27(T)/Thornwell Road 77 118 80 103 99 119 80 102 75 128A2270/Wannock Road 71 77 108 92 80 79 106 80 70 77A271/Battle Road 34 49 33 37 33 49 29 43 33 50A271/Hawks Road 100 97 95 95 98 97 85 92 100 96A271/London Road 101 76 96 79 100 76 87 73 101 77A271/New Road 50 42 45 35 46 43 39 38 46 43A271/North Street 96 70 96 68 95 70 95 64 96 72A295/Diplocks Way 92 63 96 68 87 63 92 79 92 61
2026 Scen 10 Int 52026 Scen 10 Int 42026 Scen 10 Int 32026 Scen 6 Int 1Junction Route/Description
2026 Scenario 10
Page 70
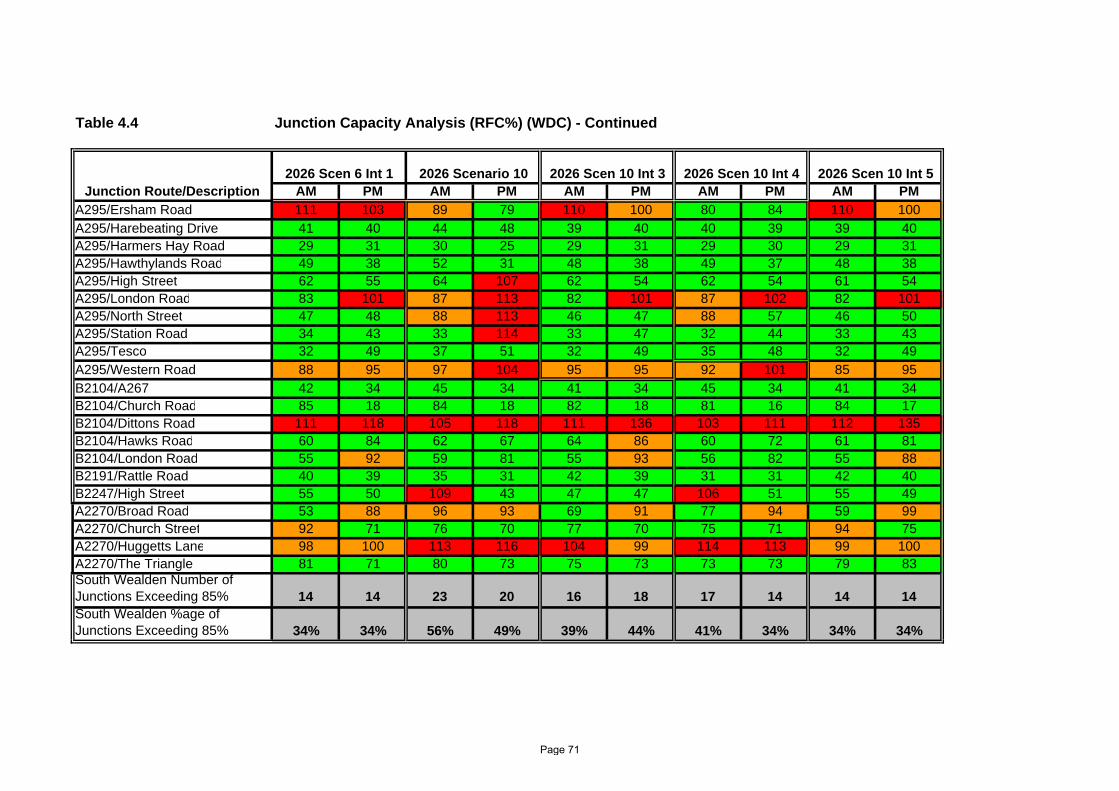
Table 4.4 Junction Capacity Analysis (RFC%) (WDC) - Continued
AM PM AM PM AM PM AM PM AM PMA295/Ersham Road 111 103 89 79 110 100 80 84 110 100A295/Harebeating Drive 41 40 44 48 39 40 40 39 39 40A295/Harmers Hay Road 29 31 30 25 29 31 29 30 29 31A295/Hawthylands Road 49 38 52 31 48 38 49 37 48 38A295/High Street 62 55 64 107 62 54 62 54 61 54A295/London Road 83 101 87 113 82 101 87 102 82 101A295/North Street 47 48 88 113 46 47 88 57 46 50A295/Station Road 34 43 33 114 33 47 32 44 33 43A295/Tesco 32 49 37 51 32 49 35 48 32 49A295/Western Road 88 95 97 104 95 95 92 101 85 95B2104/A267 42 34 45 34 41 34 45 34 41 34B2104/Church Road 85 18 84 18 82 18 81 16 84 17B2104/Dittons Road 111 118 105 118 111 136 103 111 112 135B2104/Hawks Road 60 84 62 67 64 86 60 72 61 81B2104/London Road 55 92 59 81 55 93 56 82 55 88B2191/Rattle Road 40 39 35 31 42 39 31 31 42 40B2247/High Street 55 50 109 43 47 47 106 51 55 49A2270/Broad Road 53 88 96 93 69 91 77 94 59 99A2270/Church Street 92 71 76 70 77 70 75 71 94 75A2270/Huggetts Lane 98 100 113 116 104 99 114 113 99 100A2270/The Triangle 81 71 80 73 75 73 73 73 79 83South Wealden Number of Junctions Exceeding 85% 14 14 23 20 16 18 17 14 14 14South Wealden %age of Junctions Exceeding 85% 34% 34% 56% 49% 39% 44% 41% 34% 34% 34%
Junction Route/Description2026 Scen 10 Int 3 2026 Scen 10 Int 4 2026 Scen 10 Int 52026 Scen 6 Int 1 2026 Scenario 10
Page 71
South Wealden and Eastbourne Transport Study (SWETS) November 2010
Page 72 18/11/2010
APPENDIX 7 TRANSPORT IMPACTS – DOT DIAGRAMS
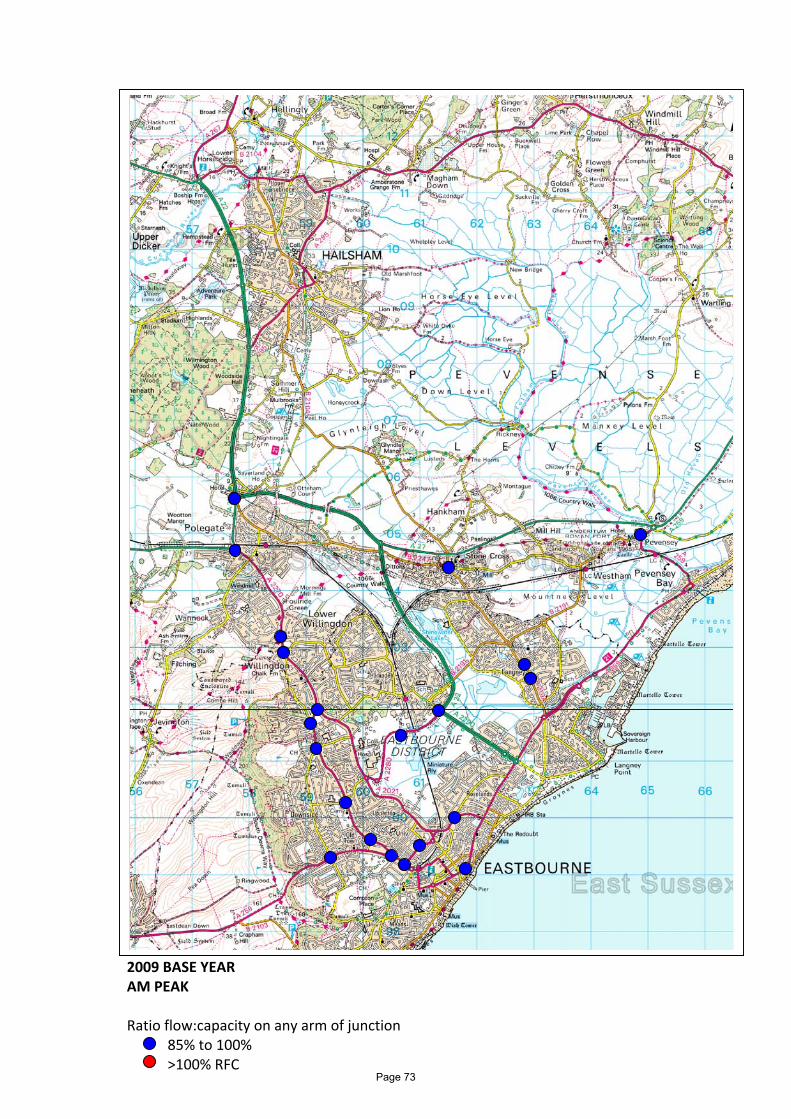
2009 BASE YEAR AM PEAK Ratio flow:capacity on any arm of junction
85% to 100% >100% RFC
Page 73

2009 BASE YEAR PM PEAK Ratio flow:capacity on any arm of junction
85% to 100% >100%
Page 74

2016 REFERENCE CASE AM PEAK Ratio flow:capacity on any arm of junction
85% to 100% >100%
Page 75
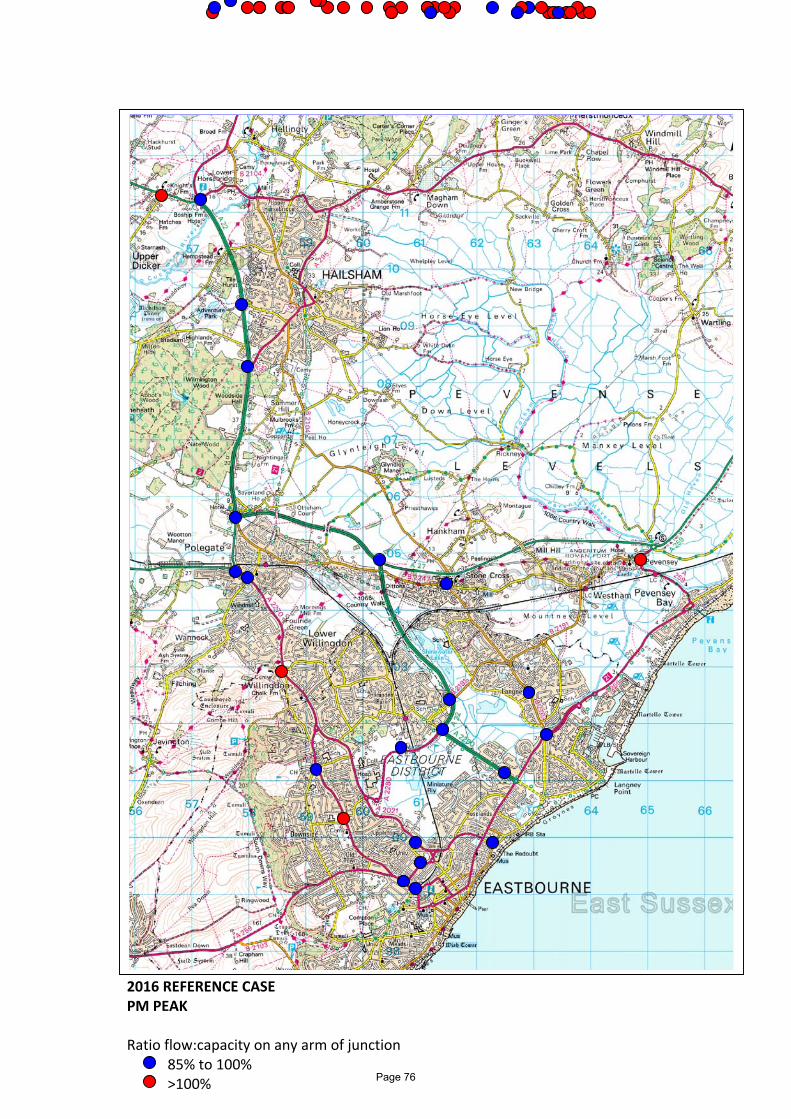
2016 REFERENCE CASE PM PEAK Ratio flow:capacity on any arm of junction
85% to 100% >100%
Page 76
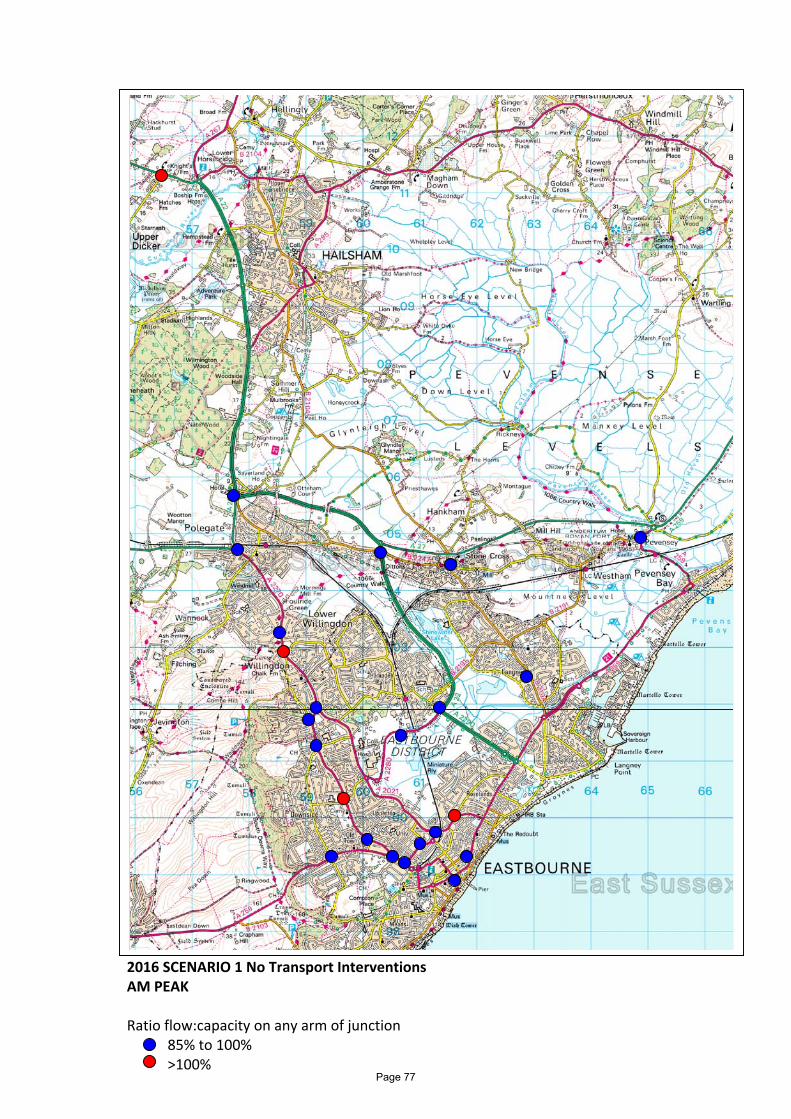
2016 SCENARIO 1 No Transport Interventions AM PEAK Ratio flow:capacity on any arm of junction
85% to 100% >100%
Page 77

2016 SCENARIO 1 No Transport Interventions PM PEAK Ratio flow:capacity on any arm of junction
85% to 100% >100%
Page 78

2016 SCENARIO 1 Transport Intervention 1 AM PEAK Ratio flow:capacity on any arm of junction
85% to 100% >100%
Page 79

2016 SCENARIO 1 Transport Intervention 1 PM PEAK Ratio flow:capacity on any arm of junction
85% to 100% >100%
Page 80

2026 REFERENCE CASE AM PEAK Ratio flow:capacity on any arm of junction
85% to 100% >100%
Page 81

2026 REFERENCE CASE PM PEAK Ratio flow:capacity on any arm of junction
85% to 100% >100%
Page 82

2026 SCENARIO 1 Transport Intervention 1 – 10% AM PEAK Ratio flow:capacity on any arm of junction
85% to 100% >100%
Page 83

2026 SCENARIO 1 Transport Intervention 1 ‐10% PM PEAK Ratio flow:capacity on any arm of junction
85% to 100% >100%
Page 84
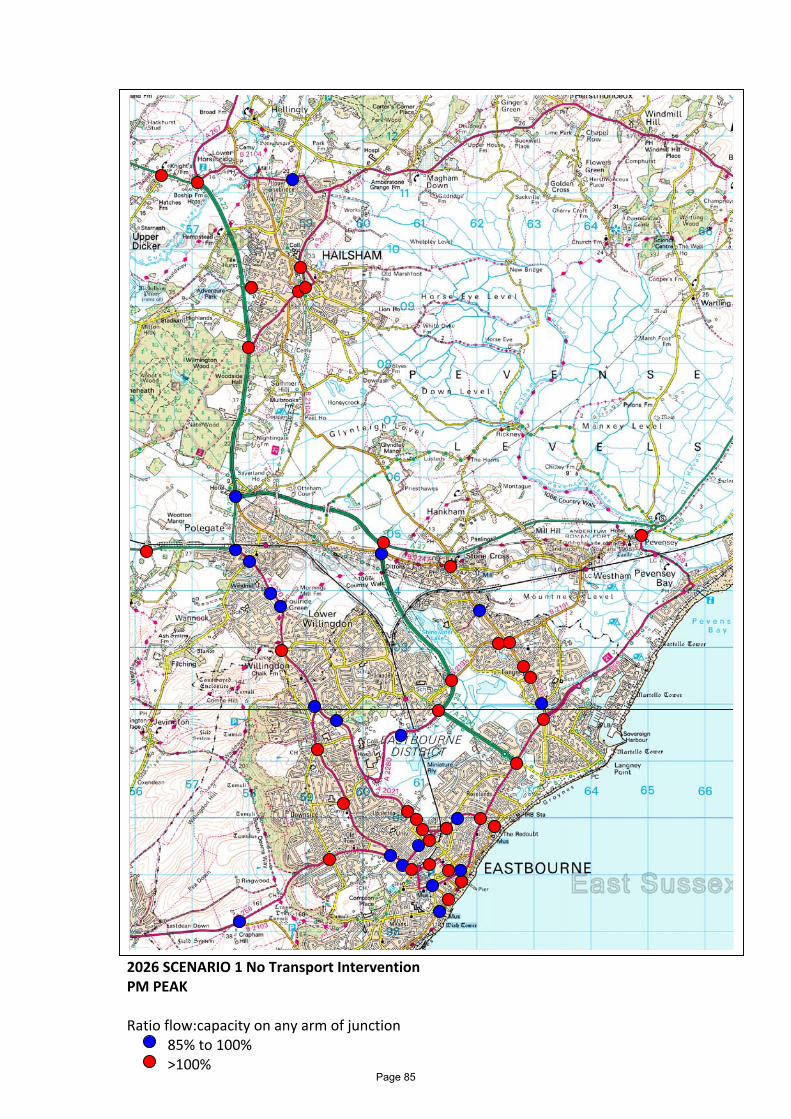
2026 SCENARIO 1 No Transport Intervention PM PEAK Ratio flow:capacity on any arm of junction
85% to 100% >100%
Page 85

2026 SCENARIO 1 No Transport Intervention AM PEAK Ratio flow:capacity on any arm of junction
85% to 100% >100%
Page 86

2026 SCENARIO 1 Transport Intervention 1 AM PEAK Ratio flow:capacity on any arm of junction
85% to 100% >100%
Page 87
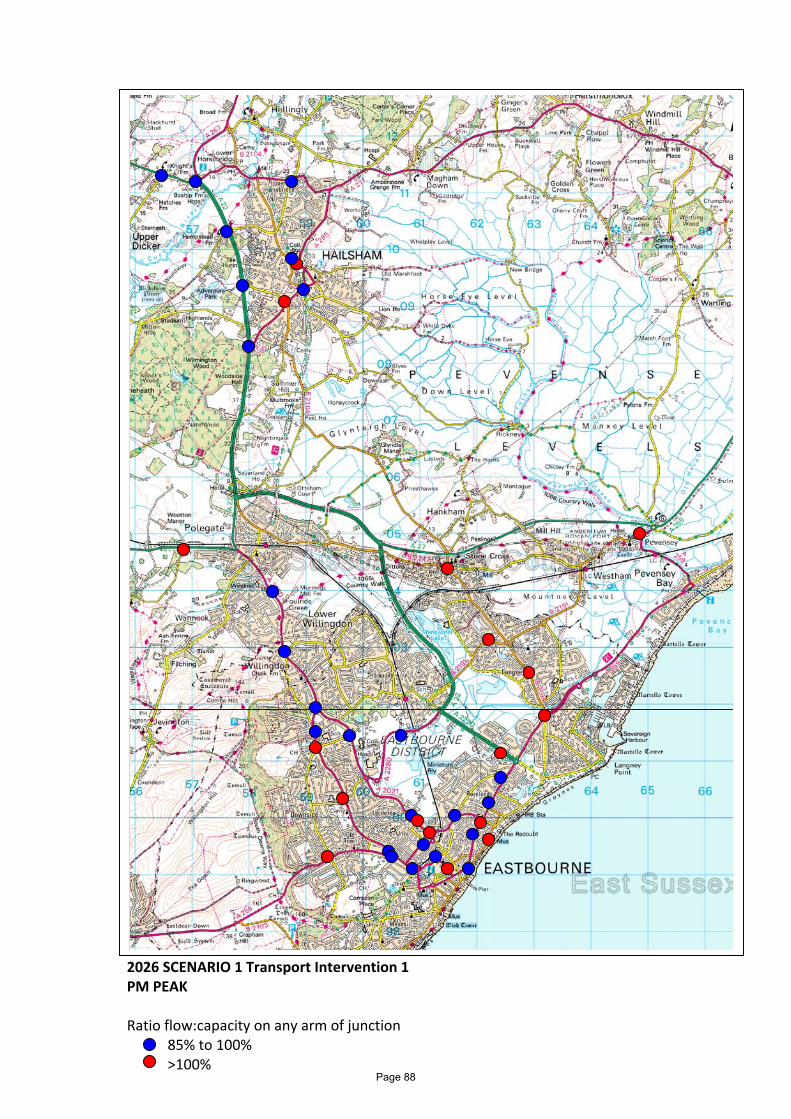
2026 SCENARIO 1 Transport Intervention 1 PM PEAK Ratio flow:capacity on any arm of junction
85% to 100% >100%
Page 88

2026 SCENARIO 1 Transport Intervention 2 AM PEAK Ratio flow:capacity on any arm of junction
85% to 100% >100%
Page 89

2026 SCENARIO 1 Transport Intervention 2 PM PEAK Ratio flow:capacity on any arm of junction
85% to 100% >100%
Page 90

2026 SCENARIO 6 No Transport Intervention AM PEAK Ratio flow:capacity on any arm of junction
85% to 100% >100%
Page 91

2026 SCENARIO 6 No Transport Intervention PM PEAK Ratio flow:capacity on any arm of junction
85% to 100% >100%
Page 92

2026 SCENARIO 6 Transport Intervention 1 AM PEAK Ratio flow:capacity on any arm of junction
85% to 100% >100%
Page 93

2026 SCENARIO 6 Transport Intervention 1 PM PEAK Ratio flow:capacity on any arm of junction
85% to 100% >100%
Page 94

2026 SCENARIO 10 No Transport Intervention AM PEAK Ratio flow:capacity on any arm of junction
85% to 100% >100%
Page 95

2026 SCENARIO 10 No Transport Intervention PM PEAK Ratio flow:capacity on any arm of junction
85% to 100% >100%
Page 96

2026 SCENARIO 10 Transport Intervention 3 AM PEAK Ratio flow:capacity on any arm of junction
85% to 100% >100%
Page 97

2026 SCENARIO 10 Transport Intervention 3 PM PEAK Ratio flow:capacity on any arm of junction
85% to 100% >100%
Page 98
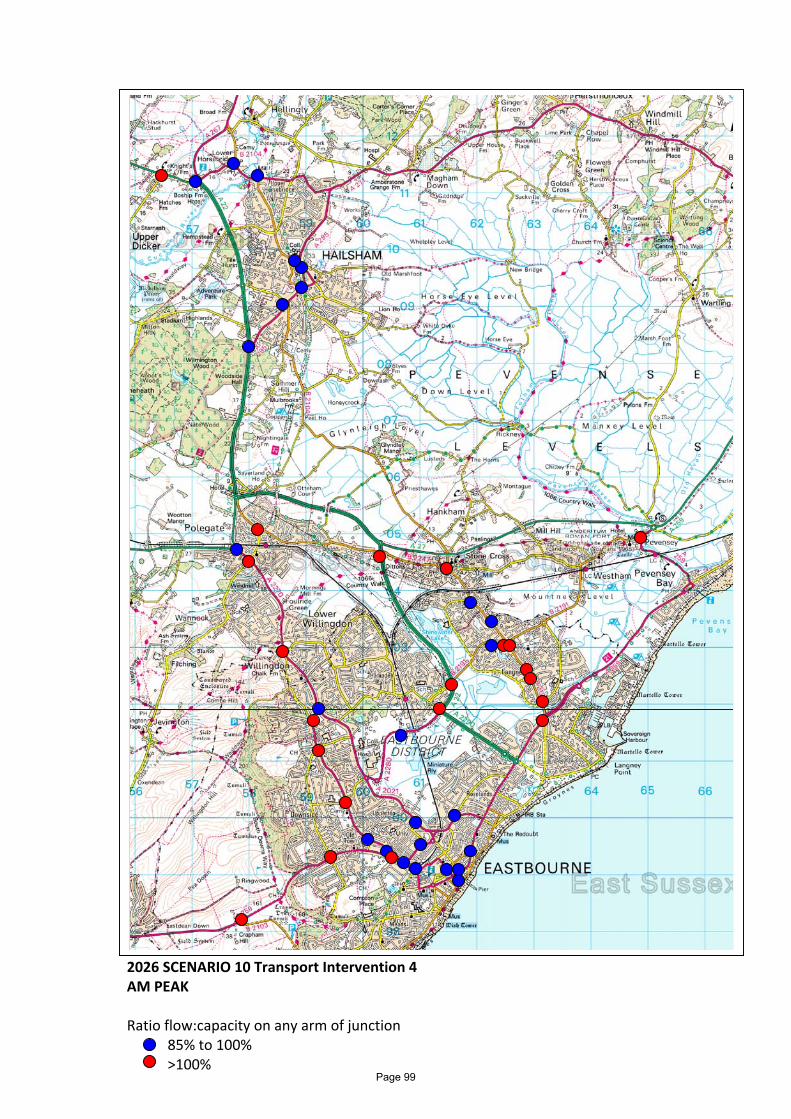
2026 SCENARIO 10 Transport Intervention 4 AM PEAK Ratio flow:capacity on any arm of junction
85% to 100% >100%
Page 99

2026 SCENARIO 10 Transport Intervention 4 PM PEAK Ratio flow:capacity on any arm of junction
85% to 100% >100%
Page 100

2026 SCENARIO 10 Transport Intervention 5 AM PEAK Ratio flow:capacity on any arm of junction
85% to 100% >100%
Page 101
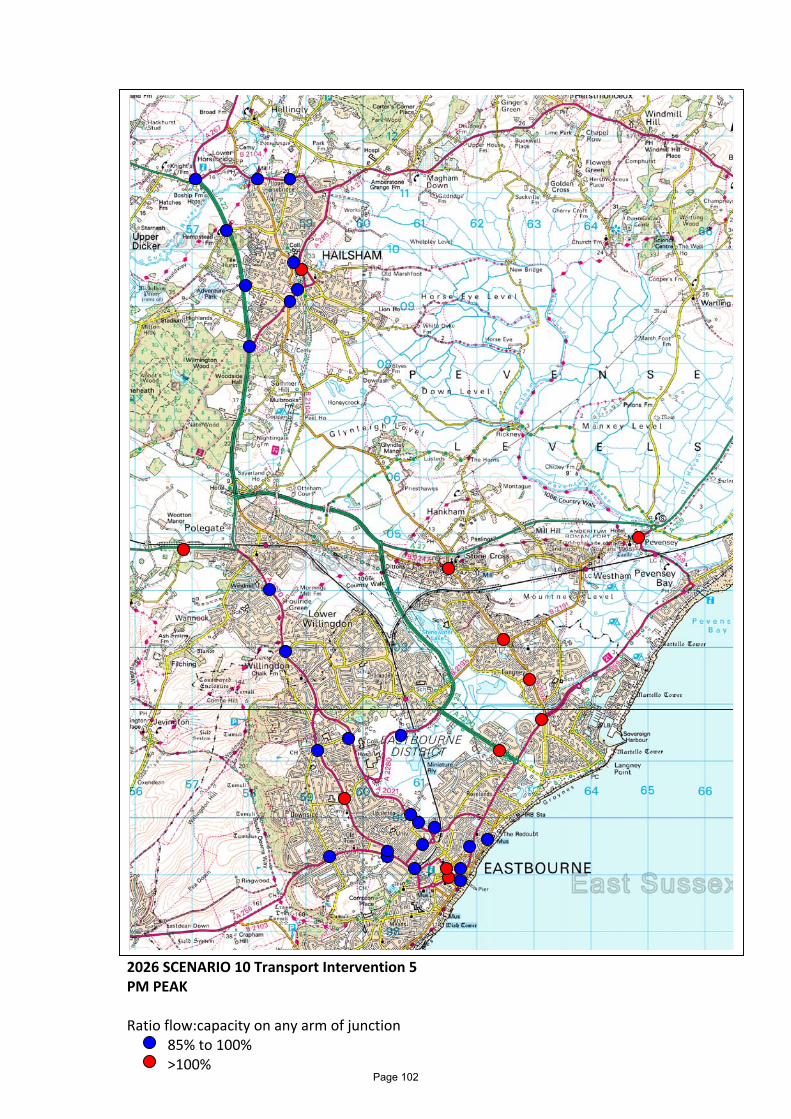
2026 SCENARIO 10 Transport Intervention 5 PM PEAK Ratio flow:capacity on any arm of junction
85% to 100% >100%
Page 102

South Wealden and Eastbourne Transport Study (SWETS) November 2010
Page 103 18/11/2010
APPENDIX 8 THE SPATIAL DISTRIBUTION AND QUANTUM OF GROWTH FOR BOTH EASTBOURNE AND WEALDEN

�����
�����������
���������
���������������������������������������������������������� ���
����������
���������
! ���������
!"�����������������������#��
!"���������
$������������������%�#�������������%��
&��#������#��������'����!� �������
(������)�#��#�*�%�������������� ������
+���,(-.,�'%�'�����������������������������
������ !"!
����#��%'�#��!��/
#�$�������
0������ 12 "��������#� 12 !"�,#���*���� 12 ! �0���#����%3 12 �4����5�,#�#� 12 �6���� 12 ���7''���)�5�� 12 ��
4�����%'��#���8������,%� �����''���#��#���'���������8������,%� ����������������#���*�#����������0���9�:��#�;��,#�#����8�����<�*������'����#��7�%#���������'���%�#��������*�����'����#�������������#��'�����%#������ ��'���������(������)�#��#�*�%�����=&�����$>/!��!���
Page 104

�����
�����������
� ���������
� �������������������������������������������������������� ���
����������
���������
! ���������
"���������������#�������������$������������%������! ���������������&�%�������������&��
"��������������!�����������������������&�%�������������&��
��$����������������&�%�������������&��
'��%������%��������#����!� �������
(������)�%��%�*�&�������������� ������
+���,(-.,�#&�#�����������������������������
������ !"!
����%��&#�%��/�/"
#�$�������
0������ 12 �� �������%� 12 "��,%���*���� 12 ! �0���%����&3 12 � �4����5�,%�%� 12 �6���� 12 ���7##���)�5�� 12 ��
4�����&#��%���8������,&� �����##���%��%���#���������8������,&� ����������������%���*�%����������0���9�:��%�;��,%�%����8�����<�*������#����%��7�&%���������#���&�%��������*�����#����%�������������%��#�����&%������ ��#���������(������)�%��%�*�&�����='������!>/��/���
Page 105
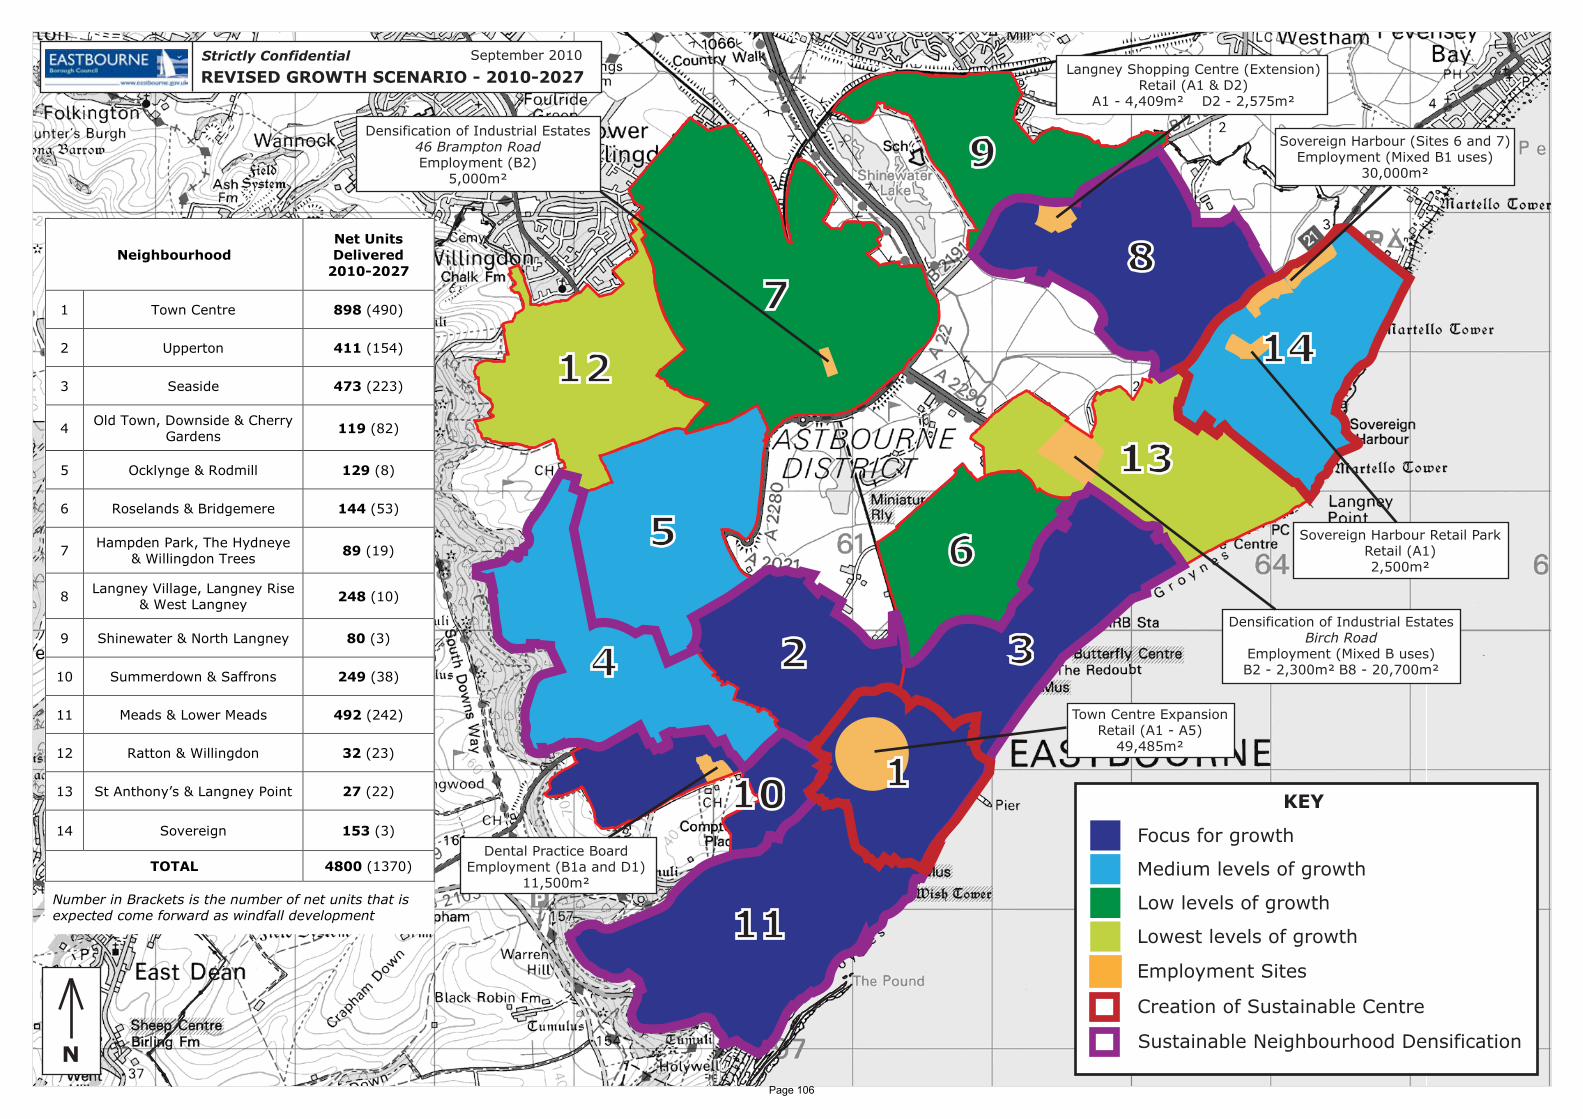
N
1
2 34
5 6
78
9
10
11
12
13
14
Langney Shopping Centre (Extension)Retail (A1 & D2)
A1 - 4,409m² D2 - 2,575m²
Town Centre ExpansionRetail (A1 - A5)
49,485m²
Densification of Industrial EstatesBirch Road
Employment (Mixed B uses)B2 - 2,300m² B8 - 20,700m²
Sovereign Harbour Retail ParkRetail (A1)2,500m²
Densification of Industrial Estates46 Brampton RoadEmployment (B2)
5,000m²
Sovereign Harbour (Sites 6 and 7)Employment (Mixed B1 uses)
30,000m²
Dental Practice BoardEmployment (B1a and D1)
11,500m²
KEY
Focus for growth
Medium levels of growth
Low levels of growth
Lowest levels of growth
Sustainable Neighbourhood Densification
Creation of Sustainable Centre
Employment Sites
Neighbourhood Net Units Delivered
2010-2027
1 Town Centre 898 (490)
2 Upperton 411 (154)
3 Seaside 473 (223)
4 Old Town, Downside & Cherry
Gardens 119 (82)
5 Ocklynge & Rodmill 129 (8)
6 Roselands & Bridgemere 144 (53)
7 Hampden Park, The Hydneye
& Willingdon Trees 89 (19)
8 Langney Village, Langney Rise
& West Langney 248 (10)
9 Shinewater & North Langney 80 (3)
10 Summerdown & Saffrons 249 (38)
11 Meads & Lower Meads 492 (242)
12 Ratton & Willingdon 32 (23)
13 St Anthony’s & Langney Point 27 (22)
14 Sovereign 153 (3)
TOTAL 4800 (1370)
Number in Brackets is the number of net units that is expected come forward as windfall development
REVISED GROWTH SCENARIO - 2010-2027Strictly Confidential September 2010
Page 106

N
1
2 34
5 6
78
9
10
11
12
13
14
Langney Shopping Centre (Extension)Retail (A1 & D2)
A1 - 4,409m² D2 - 2,575m²
Town Centre ExpansionRetail (A1 - A5)
49,485m²
Densification of Industrial EstatesBirch Road
Employment (Mixed B uses)B2 - 2,300m² B8 - 20,700m²
Sovereign Harbour Retail ParkRetail (A1)2,500m²
Densification of Industrial Estates46 Brampton RoadEmployment (B2)
5,000m²
Sovereign Harbour (Sites 6 and 7)Employment (Mixed B1 uses)
15,000m²
Dental Practice BoardEmployment (B1a and D1)
11,500m²
KEY
Focus for growth
Medium levels of growth
Low levels of growth
Lowest levels of growth
Sustainable Neighbourhood Densification
Creation of Sustainable Centre
Employment Sites
Neighbourhood Net Units Delivered
2010-2019
1 Town Centre 394
2 Upperton 257
3 Seaside 250
4 Old Town, Downside & Cherry
Gardens 37
5 Ocklynge & Rodmill 121
6 Roselands & Bridgemere 91
7 Hampden Park, The Hydneye
& Willingdon Trees 55
8 Langney Village, Langney Rise
& West Langney 211
9 Shinewater & North Langney 69
10 Summerdown & Saffrons 205
11 Meads & Lower Meads 230
12 Ratton & Willingdon 7
13 St Anthony’s & Langney Point 4
14 Sovereign 150
TOTAL 2081
REVISED GROWTH SCENARIO - Up to 2019Strictly Confidential September 2010
Page 107