south sudan - action against hunger · south sudan nutritional ... addition coping mechanisms seem...
TRANSCRIPT

1
South Sudan
NUTRITIONAL ANTHROPOMETRIC SURVEY
CHILDREN UNDER 5 YEARS OLD MAYIANDIT PAYAM, MAYIANDIT COUNTY, WESTERN UPPER NILE
August 19th to September 8th, 2004
Onesmus Muinde - Nutritionist
Joy Karimi - Nutritionist Deborah Morris - Nutrition Survey Program Officer
(ACF-USA)
2
TABLE OF CONTENTS SUMMARY .................................................................................................................................................... 3 ACKNOWLEDGEMENTS .......................................................................................................................... 7 INTRODUCTION.......................................................................................................................................... 8 METHODOLOGY ...................................................................................................................................... 11 1. Type of survey and sample size ............................................................................................................................... 11 2. Sampling methodology ............................................................................................................................................. 11 3. Data Collection.......................................................................................................................................................... 11 4. Indicators, guidelines and formulas used ............................................................................................................... 12
4.1. Acute Malnutrition ........................................................................................................................................... 12 4.2. Mortality ............................................................................................................................................................ 12
5. Field work.................................................................................................................................................................. 13 6. Data analysis ............................................................................................................................................................. 13 RESULTS ..................................................................................................................................................... 14 1. Distribution by age and sex...................................................................................................................................... 14 2. Anthropometric analysis .......................................................................................................................................... 15
2.1. Acute malnutrition............................................................................................................................................ 15 2.2. Risk of mortality: children’s MUAC............................................................................................................... 18
3. Measles vaccination coverage .................................................................................................................................. 19 4. Household status ....................................................................................................................................................... 19 5. Mortality rate............................................................................................................................................................ 19 6. Causes of mortality................................................................................................................................................... 20 DISCUSSION ............................................................................................................................................... 20 RECOMMENDATIONS............................................................................................................................. 22 APPENDIXES.............................................................................................................................................. 23 Appendix 1. Villages within a radius of 3 hours walk from Mayiandit airstrip, August 2004 .............................. 23 Appendix 2. Anthropometric survey questionnaire................................................................................................... 24 Appendix 3. Calendar of events Mayiandit – August 2004 ....................................................................................... 25 Appendix 4. Mortality survey questionnaire.............................................................................................................. 26 Appendix 5. Map of the location ......................................................................................Error! Bookmark not defined.
3
SUMMARY Mayiandit Payam is located in Mayiandit County, in Western Upper Nile. The payam consists of 4 bomas, namely Mal, Dhorgapni, Dhorthier and Padeah. The inhabitants of the payam belong to the Kuey Nuer clan. The population is agro-pastoralist with emphasis on cattle keeping. The area is characterized by flat black cotton soil and the Niang River runs across the payam. The location, controlled by the SPLA/M, experienced the last insecurity incident in July 2004, related to fighting in a cattle camp. According to the SRRC Secretary, the population of the payam was estimated at 6,226 persons. Only a few organizations are intervening in the location on a permanent basis: ACROSS (Association Christian Relief Organization Serving Sudan) provides health services and VSF-Suisse (Veterinaires Sans Frontieres) offers animal health services. In addition SCF-UK, OXFAM GB and UNICEF support the community in the fields of food security, water and education respectively. 1. JUSTIFICATION OF THE SURVEY Last year, crops in Mayiandit Payam were destroyed by a combination of grasshoppers, rats and floods, forcing the community to heavily rely on cow milk, fish and sorghum bought in the neighboring county of Leer. The 2003/2004 Annual Needs Assessment conducted by WFP also indicated crop failure in Mayiandit County due to floods and locust invasion. The location was classified as severely food insecure and WFP dropped food in January and April 2004. In the course of this year the food security situation has deteriorated: the area has experienced late and heavy rains that have affected the cultivation and destroyed most of the crops planted. In addition, the food drop planned for last July was postponed because of fighting in the location (only oil had been delivered). Because of the concern regarding the severe food insecurity, ACF-USA decided to conduct a nutritional survey in Mayiandit Payam in order to assess the nutritional situation. 2. OBJECTIVES
To evaluate the nutritional status of the children aged 6 to 59 months To estimate the measles immunization coverage of the children aged 9 to 59 months To identify groups at higher risk of malnutrition: age group and sex. To estimate the crude mortality rate through a retrospective survey To assess the extent of household movements.
4
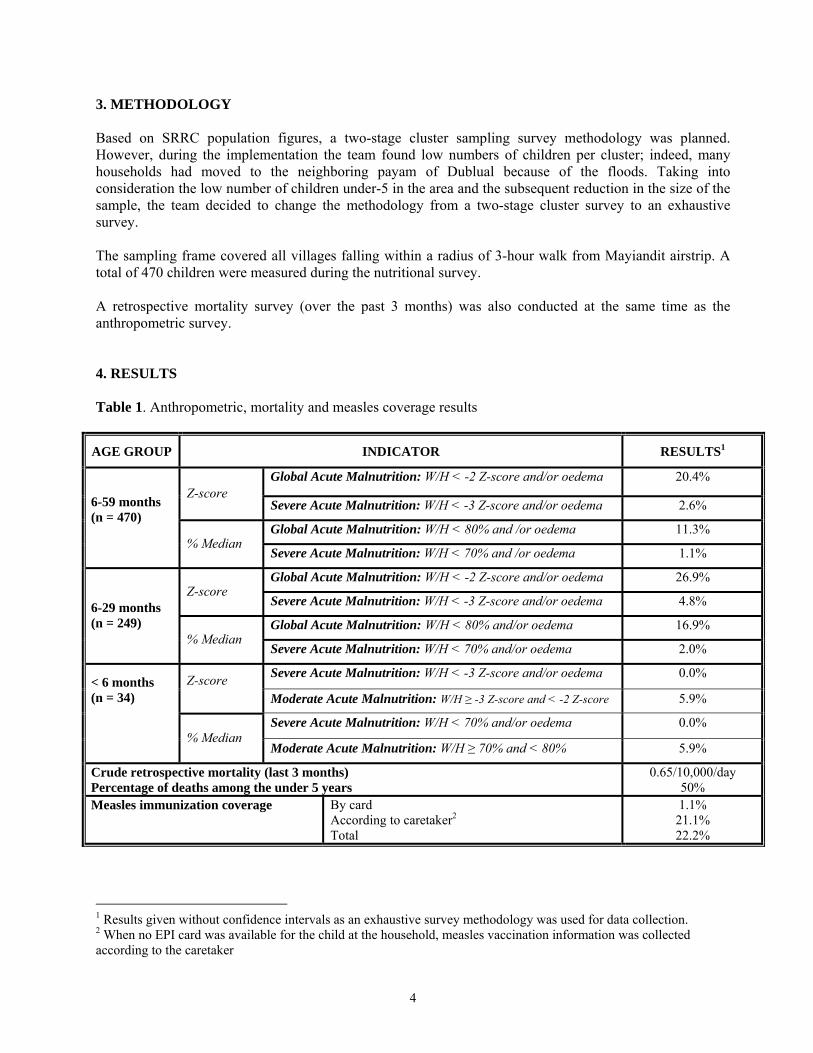
3. METHODOLOGY Based on SRRC population figures, a two-stage cluster sampling survey methodology was planned. However, during the implementation the team found low numbers of children per cluster; indeed, many households had moved to the neighboring payam of Dublual because of the floods. Taking into consideration the low number of children under-5 in the area and the subsequent reduction in the size of the sample, the team decided to change the methodology from a two-stage cluster survey to an exhaustive survey. The sampling frame covered all villages falling within a radius of 3-hour walk from Mayiandit airstrip. A total of 470 children were measured during the nutritional survey. A retrospective mortality survey (over the past 3 months) was also conducted at the same time as the anthropometric survey. 4. RESULTS Table 1. Anthropometric, mortality and measles coverage results
AGE GROUP INDICATOR RESULTS1
Global Acute Malnutrition: W/H < -2 Z-score and/or oedema 20.4% Z-score
Severe Acute Malnutrition: W/H < -3 Z-score and/or oedema 2.6%
Global Acute Malnutrition: W/H < 80% and /or oedema 11.3%
6-59 months (n = 470)
% Median Severe Acute Malnutrition: W/H < 70% and /or oedema 1.1%
Global Acute Malnutrition: W/H < -2 Z-score and/or oedema 26.9% Z-score
Severe Acute Malnutrition: W/H < -3 Z-score and/or oedema 4.8%
Global Acute Malnutrition: W/H < 80% and/or oedema 16.9% 6-29 months (n = 249)
% Median Severe Acute Malnutrition: W/H < 70% and/or oedema 2.0%
Severe Acute Malnutrition: W/H < -3 Z-score and/or oedema 0.0% Z-score Moderate Acute Malnutrition: W/H ≥ -3 Z-score and < -2 Z-score 5.9%
Severe Acute Malnutrition: W/H < 70% and/or oedema 0.0%
< 6 months (n = 34) % Median
Moderate Acute Malnutrition: W/H ≥ 70% and < 80% 5.9%
Crude retrospective mortality (last 3 months) Percentage of deaths among the under 5 years
0.65/10,000/day 50%
Measles immunization coverage By card According to caretaker2 Total
1.1% 21.1% 22.2%
1 Results given without confidence intervals as an exhaustive survey methodology was used for data collection. 2 When no EPI card was available for the child at the household, measles vaccination information was collected according to the caretaker
5
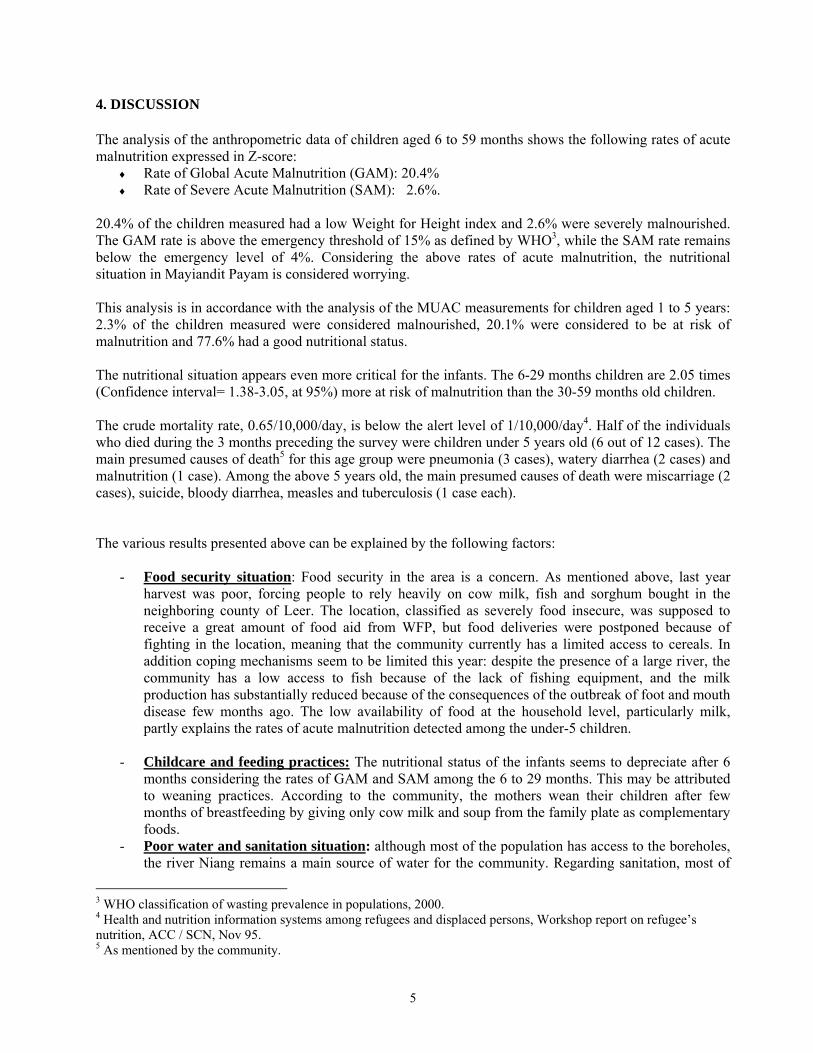
4. DISCUSSION The analysis of the anthropometric data of children aged 6 to 59 months shows the following rates of acute malnutrition expressed in Z-score:
♦ Rate of Global Acute Malnutrition (GAM): 20.4% ♦ Rate of Severe Acute Malnutrition (SAM): 2.6%.
20.4% of the children measured had a low Weight for Height index and 2.6% were severely malnourished. The GAM rate is above the emergency threshold of 15% as defined by WHO3, while the SAM rate remains below the emergency level of 4%. Considering the above rates of acute malnutrition, the nutritional situation in Mayiandit Payam is considered worrying. This analysis is in accordance with the analysis of the MUAC measurements for children aged 1 to 5 years: 2.3% of the children measured were considered malnourished, 20.1% were considered to be at risk of malnutrition and 77.6% had a good nutritional status. The nutritional situation appears even more critical for the infants. The 6-29 months children are 2.05 times (Confidence interval= 1.38-3.05, at 95%) more at risk of malnutrition than the 30-59 months old children. The crude mortality rate, 0.65/10,000/day, is below the alert level of 1/10,000/day4. Half of the individuals who died during the 3 months preceding the survey were children under 5 years old (6 out of 12 cases). The main presumed causes of death5 for this age group were pneumonia (3 cases), watery diarrhea (2 cases) and malnutrition (1 case). Among the above 5 years old, the main presumed causes of death were miscarriage (2 cases), suicide, bloody diarrhea, measles and tuberculosis (1 case each). The various results presented above can be explained by the following factors:
- Food security situation: Food security in the area is a concern. As mentioned above, last year harvest was poor, forcing people to rely heavily on cow milk, fish and sorghum bought in the neighboring county of Leer. The location, classified as severely food insecure, was supposed to receive a great amount of food aid from WFP, but food deliveries were postponed because of fighting in the location, meaning that the community currently has a limited access to cereals. In addition coping mechanisms seem to be limited this year: despite the presence of a large river, the community has a low access to fish because of the lack of fishing equipment, and the milk production has substantially reduced because of the consequences of the outbreak of foot and mouth disease few months ago. The low availability of food at the household level, particularly milk, partly explains the rates of acute malnutrition detected among the under-5 children.
- Childcare and feeding practices: The nutritional status of the infants seems to depreciate after 6
months considering the rates of GAM and SAM among the 6 to 29 months. This may be attributed to weaning practices. According to the community, the mothers wean their children after few months of breastfeeding by giving only cow milk and soup from the family plate as complementary foods.
- Poor water and sanitation situation: although most of the population has access to the boreholes, the river Niang remains a main source of water for the community. Regarding sanitation, most of
3 WHO classification of wasting prevalence in populations, 2000. 4 Health and nutrition information systems among refugees and displaced persons, Workshop report on refugee’s nutrition, ACC / SCN, Nov 95. 5 As mentioned by the community.
6
the people defecate in the open, which contributes to dissemination of germs. Few latrines were seen in the location, some of them having been destroyed because of the floods, increasing the risk of contamination of water sources. This poor environmental sanitation, as well as the poor personal hygiene, contributes to the high incidence of diarrhea, particularly among young children. Considering the close link between sickness and malnutrition6, it can be concluded that the poor sanitation situation in the location has probably contributed to the poor nutritional status of the most vulnerable, i.e. children under-5.
- Access to health services: while the prevalence of diseases like malaria, diarrhea and pneumonia is
high in the area, only one organization provides health services. ACROSS runs one health facility for the whole payam, which remains insufficient to face the medical needs of the population. In addition, because ACROSS is not in a position to ensure the cold chain necessary to implement an EPI program, there are no routine EPI activities in the area, which is a concern knowing that only 1.1% of the children were immunized against measles (according to vaccination cards) and 21.1% according to the mothers and caretakers.
The combination of the various factors mentioned above has contributed to the poor nutritional situation detected in Mayiandit Payam. 5. RECOMMENDATIONS Taking into consideration the analysis of the situation, ACF-USA recommends the following: • ACROSS to continue offering health services in the area. • ACROSS to implement EPI in the location and to improve the coverage of measles vaccination. • ACF-USA and ACROSS to discuss the possibility of treating malnourished children within the health
facility: indeed, although the nutritional situation is poor, the small size of the under-5 population suggests that an integrated approach to treat malnutrition is recommended over an emergency feeding program.
• WFP to assess the food security situation and to provide food accordingly. • SCF-UK/ACF-USA to consider interventions to alleviate the food security problems of the community,
including distribution of fishing equipment. • VSF-Suisse to continue offering veterinary services and to control the outbreak of foot and mouth
disease in the area. • Carter Center to provide water filter cloths to prevent contamination by Guinea worm. • ACF-USA to disseminate the present results and recommendations to the local community
6 Sickness often prevents the proper absorption of the nutrients by the body.
7
ACKNOWLEDGEMENTS ACF-USA acknowledges the invaluable support and assistance of the following:
Sudan Relief and Rehabilitation Commission (SRRC) in Mayiandit
The local survey teams for working tirelessly.
Local authorities, community leaders and mothers /caretakers for their co-operation.
8
INTRODUCTION Mayiandit County, in Western Upper Nile, consists of 6 payams, namely Mayiandit, Paboung, Tharjiethbor, Tutnyang, Dablual and Luom. Mayiandit Payam is bordered by Koch in the north, Leer in the east, Panyijar in the south, Makuac in the west and Maper in the southwest. The payam consists of 4 bomas, namely Mal, Dhorgapni, Dhorthier and Padeah, all included in the nutritional survey. The inhabitants belong to the Kuey Nuer clan. The population is agro-pastoralist with emphasis on cattle keeping. The area is characterized by flat black cotton soil and the Niang River flows across the payam. The location, controlled by the SPLA/M, experienced the last insecurity incident in July 2004, related to fighting in cattle camp. According to the SRRC Secretary, the population in the payam was estimated at 6,226 persons. FOOD SECURITY The community relies on agricultural and pastoral activities. The community grows sorghum, maize and beans. Last year, the community planted only maize because they lacked sorghum seeds.7 From July to September 2003, heavy rains in the region led to floods and locusts attacked the crops. Therefore a very poor harvest was reported by the 2003/2004 Annual Needs Assessment (ANA) conducted by WFP. The location was classified as severely food insecure and considered as a priority area for 2004 food aid. This year, the food security situation worsened as the heavy and late rains affected the cultivation and destroyed crops. The community puts great emphasis on cattle keeping. During the rainy season, the cattle move to the highlands in Dublual in order to avoid cattle diseases associated with floods and to find good pasture. However an outbreak of foot and mouth disease between February and April 2004 killed around 2,000 heads of cattle in Mayiandit Payam8, affecting the milk production in the area. The outbreak persisted until July, but should be contained at the present time. VSF-Suisse offers veterinary services in Mayiandit County with 22 Community Animal Health Workers (CAHWs), 1 Animal Health Worker (AHW) and 1 Deputy Field Veterinarian. The Niang River is a source of fish in the area; however the community lacks fishing equipment; they only fish with spears, which offer low harvesting possibilities. Because of the poor food security situation, WFP have distributed food in the area. Food drops took place in January and April 2004. During the last food distribution, in April 2004, cereals, CSB, and oil at 50% of the full ration were distributed, targeting 9,500 people. In total, the community received 25.9 MT of cereals, 7.15 MT of CSB, and 4.6 MT of oil. The food distribution scheduled for July 2004 was cancelled because of the fighting in the cattle camp and only oil was delivered. 7 The 2003/2004 WFP Annual Needs Assessment report confirmed that SC-UK distributed only maize seeds to the community 8 VSF-Suisse Deputy Field Veterinarian
9
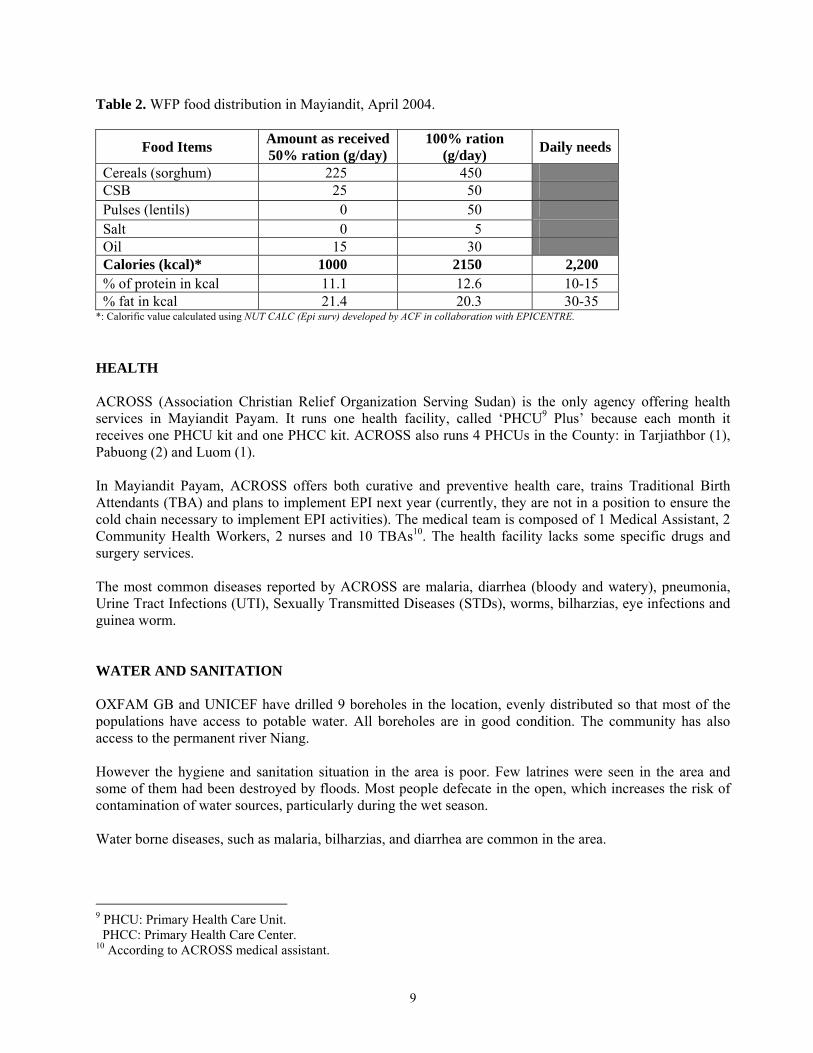
Table 2. WFP food distribution in Mayiandit, April 2004.
Food Items Amount as received50% ration (g/day)
100% ration (g/day) Daily needs
Cereals (sorghum) 225 450 CSB 25 50 Pulses (lentils) 0 50 Salt 0 5 Oil 15 30 Calories (kcal)* 1000 2150 2,200 % of protein in kcal 11.1 12.6 10-15 % fat in kcal 21.4 20.3 30-35
*: Calorific value calculated using NUT CALC (Epi surv) developed by ACF in collaboration with EPICENTRE. HEALTH ACROSS (Association Christian Relief Organization Serving Sudan) is the only agency offering health services in Mayiandit Payam. It runs one health facility, called ‘PHCU9 Plus’ because each month it receives one PHCU kit and one PHCC kit. ACROSS also runs 4 PHCUs in the County: in Tarjiathbor (1), Pabuong (2) and Luom (1). In Mayiandit Payam, ACROSS offers both curative and preventive health care, trains Traditional Birth Attendants (TBA) and plans to implement EPI next year (currently, they are not in a position to ensure the cold chain necessary to implement EPI activities). The medical team is composed of 1 Medical Assistant, 2 Community Health Workers, 2 nurses and 10 TBAs10. The health facility lacks some specific drugs and surgery services. The most common diseases reported by ACROSS are malaria, diarrhea (bloody and watery), pneumonia, Urine Tract Infections (UTI), Sexually Transmitted Diseases (STDs), worms, bilharzias, eye infections and guinea worm. WATER AND SANITATION OXFAM GB and UNICEF have drilled 9 boreholes in the location, evenly distributed so that most of the populations have access to potable water. All boreholes are in good condition. The community has also access to the permanent river Niang. However the hygiene and sanitation situation in the area is poor. Few latrines were seen in the area and some of them had been destroyed by floods. Most people defecate in the open, which increases the risk of contamination of water sources, particularly during the wet season. Water borne diseases, such as malaria, bilharzias, and diarrhea are common in the area.
9 PHCU: Primary Health Care Unit. PHCC: Primary Health Care Center. 10 According to ACROSS medical assistant.

10
EDUCATION In Mayiandit Payam, there is an adult school and a primary school. The adult school, which started in August 200311, has 5 trained teachers and 35 students currently and runs from Primary 1 to Primary 4. The primary school started in 2001 currently has 586 pupils12, 76 of them being girls. The school has 12 untrained teachers of whom 2 are female; it runs from Primary 1 to Primary 6. ACROSS provides in-service training during holidays for the teachers of both the adult and primary schools. UNICEF provided the learning materials for the primary school, but as they are not sufficient for all the pupils, school fees (100 Sudanese Dinners (SD) per term) have been introduced. Because of this measure, many pupils have stopped going to school. The adult school is not supported for learning materials. AGENCIES INTERVENING IN THE AREA The agencies intervening in the area are mentioned in the table below:
Table 3. Organizations intervening in Mayiandit Payam and their activities
Agency Activities ACROSS • Health: ‘PHCU plus’
• Capacity building (training of CHWs and TBAs, and of teachers). • Health education.
OXFAM-GB • Drilling and maintenance of boreholes. • Distribution of mosquito nets.
SCK-UK • Food security monitoring. • Distribution of seeds.
VSF-Suisse • Veterinary services. UNICEF • Drilling of boreholes.
• Provision of education kits for primary school. WFP • Targeted Food Aid distribution and monitoring
IDPS AND RETURNEES MOVEMENT The SRRC in Mayiandit Payam reported 387 returnees from Bentiu, Rubkona and Yoahnyang, and no Internally Displaced Persons, although 4 households declared to be IDP during the survey. JUSTIFICATION OF THE NUTRITION SURVEY As mentioned previously, the limited cereal resources of the community, added to the reduced milk production and the delay in the food aid deliveries, have put the population of Mayiandit Payam in situation of food insecurity. There was great concern regarding the nutritional status of the population, particularly the most vulnerable, i.e. children under-5 years old. Therefore, ACF-USA decided to implement an anthropometric nutrition survey in that location. CONSTRAINTS ENCOUNTERED DURING THE IMPLEMENTATION Because of the recent floods in Mayiandit Payam, many people had moved to Dublual Payam. Therefore, the team found far less people than expected in the location.
11 According to the adult school head teacher. 12 According to the Primary School head teacher.
11
METHODOLOGY The survey was conducted from 19th August to 8th September 2004 in Mayiandit Payam, Mayiandit County, Western Upper Nile. According to the SRRC secretary, the population figures were estimated at 6,226 persons; the number of children under 5 years was estimated at 1,245 (20% of the entire population). 1. Type of survey and sample size Based on the SRRC Secretary population figures, a two-stage cluster sampling survey was planned. However, during the implementation of the survey, the team found smaller numbers of children per cluster. Indeed lot of households had moved to the neighboring payam of Dublual because of the floods. Taking into consideration the small number of under-5 children in the area and the subsequent reduction in the size of the sample, the team decided to change the methodology from a two-stage cluster survey to an exhaustive survey. The sampling frame covered all villages falling within a radius of 3-hour walk from Mayiandit airstrip (See appendix 1 for village list and estimated population). A retrospective mortality survey (over the past 3 months) was also conducted alongside the anthropometric exhaustive survey. 2. Sampling methodology An exhaustive survey was conducted, meaning that all the children aged 6-59 months encountered in the villages were included in the survey. A total of 470 children were measured during the survey. 3. Data Collection During the anthropometric survey, for each selected child aged 6 to 59 months, the following information was recorded (See appendix 2 for anthropometric questionnaire):
♦ Age: recorded with the help of a local calendar of events (See appendix 3 for calendar of events) ♦ Sex: male or female ♦ Weight: children were weighed without clothes, with a SALTER balance of 25 kg (precision of
100g). ♦ Height: children were measured on a measuring board (precision of 0.1 cm). Children less than
85 cm were measured lying down, while those greater than or equal to 85 cm were measured standing up.
♦ Mid-Upper Arm Circumference: MUAC was measured at mid-point of left upper arm for measured children (precision of 0.1 cm).
♦ Bilateral oedema: assessed by the application of normal thumb pressure for at least 3 seconds to both feet.
♦ Measles vaccination: assessed by checking for measles vaccination on EPI cards and asking caretakers.
♦ Household status: for the surveyed children, households were asked if they were permanent residents, temporarily in the area, or displaced.

12
During the retrospective mortality survey, in all the visited households (including where there were no children under-5), teams asked for the number of household members alive per specified age groups, the number of people present within the recall period, the number of deaths over the last 3 months, and if any, the presumed cause of death. (See appendix 4 for mortality questionnaire). 4. Indicators, guidelines and formulas used 4.1. Acute Malnutrition
• Weight-for-Height Index For the children, acute malnutrition rates were estimated from the weight for height (WFH) index values combined with the presence of oedema. The WFH indices are compared with NCHS13 references. WFH indices were expressed both in Z-score and percentage of the median. The expression in Z-score has true statistical meaning and allows inter-study comparison. The percentage of the median on the other hand is commonly used to identify eligible children for feeding programs. Guidelines for the results expressed in Z-score: • Severe malnutrition is defined by WFH < -3 SD and/or existing bilateral oedema on the lower limbs of
the child • Moderate malnutrition is defined by WFH < -2 SD and ≥ -3 SD and no oedema. • Global acute malnutrition is defined by WFH < -2 SD and/or existing bilateral oedema Guidelines for the results expressed in percentage according to the median of reference: • Severe malnutrition is defined by WFH < 70 % and/or existing bilateral oedema on the lower limbs • Moderate malnutrition is defined by WFH < 80 % and ≥ 70 % and no oedema. • Global acute malnutrition is defined by WFH <80% and/or existing bilateral oedema
• Children’s Mid-Upper Arm Circumference (MUAC) The weight for height index is the most appropriate index to quantify wasting in a population in emergency situations where acute forms of malnutrition are the predominant pattern. However the mid-upper arm circumference (MUAC) is a useful tool for rapid screening of children at a higher risk of mortality. The MUAC is only taken for children with a height of 75 cm and more. The guidelines are as follows: MUAC < 110 mm severe malnutrition and high risk of mortality MUAC ≥ 110 mm and <120 mm moderate malnutrition and moderate risk of mortality MUAC ≥ 120 mm and <125 mm high risk of malnutrition MUAC ≥ 125 mm and <135 mm moderate risk of malnutrition MUAC ≥ 135 mm ‘adequate’ nutritional status 4.2. Mortality The crude mortality rate (CMR) is determined for the entire population surveyed for a given period. The CMR is calculated from the death rate for the entire population (DR). The formulas are as follows:
13 NCHS: National Center for Health Statistics (1977) NCHS growth curves for children birth-18 years. United States. Vital Health Statistics. 165, 11-74.
13
Death Rate (DR) = n / [((n+M1) + M2) / 2] Where n = number of deaths within a given period M1 = number of persons alive over a given period M2 = number of persons alive at the time of the survey Crude Mortality Rate (CMR) = (DR x 10,000) / number of days in the period. The period corresponds to 3 months (90 days) preceding the survey. Therefore, CMR = (DR x 10,000) /90. It is expressed per 10,000-people / day. The thresholds are defined as follows14: Alert level: 1/10,000 people/day Emergency level: 2/10,000 people/day The proportion of deaths within the past 3 months among the under 5 years old is also calculated. 5. Field work All the surveyors participating in the survey underwent a 4-day training, which included a pilot survey. Five teams of three surveyors each executed the fieldwork. ACF-USA staff supervised all the teams in the villages. The survey (including training) lasted for a period of 19 days. 6. Data analysis Data processing and analysis were carried out using EPI-INFO 5.0 software and EPINUT 2.2 program.
14 Health and nutrition information systems among refugees and displaced persons, Workshop report on refugee’s nutrition, ACC / SCN, Nov 95.

14
RESULTS 1. Distribution by age and sex
Table 4. Distribution of the sample by age and sex
BOYS GIRLS TOTAL AGE (In months) N % N % N %
Sex Ratio
06 – 17 72 58.1% 52 41.9% 124 26.4% 1.38 18 – 29 62 49.6% 63 50.4% 125 26.6% 0.98 30 – 41 41 47.1% 46 52.9% 87 18.5% 0.89 42 – 53 43 51.8% 40 48.2% 83 17.7% 1.07 54 – 59 24 47.1% 27 52.9% 51 10.9% 0.89 Total 242 51.5% 228 48.5% 470 100% 1.06 The distribution of the sample by sex shows a slight imbalance with more boys than girls. However, the sex ratio, equals to 1.06, indicates the random selection of the sample. Figure 1. Distribution of the sample by age and sex
The results show a slight imbalance in age distribution. The age groups 6-17 months and 18-29 months are slightly over-represented, probably due to an overestimation of the age. Indeed, often mothers do not know the exact date of birth of their children; the nutrition survey teams use a calendar of events in order to help mothers to determine the age, but this tool cannot totally prevent bias.
-60% -40% -20% 0% 20% 40% 60%Percentage
06-17
18-29
30-41
42-52
54-59
Age
in m
onth
s
Distribution by Age and Sex, Mayiandit August 2004
BoysGirls

15
2. Anthropometric analysis 2.1. Acute malnutrition
♦ Distribution of malnutrition in Z-score The distribution of acute malnutrition in Z-score showed that the global acute malnutrition is equal to 20.4% with 2.6% of the children being severely malnourished and 17.9% moderately malnourished.
Table 5. Weight For Height Distribution by age in Z-score
AGE
(In months) Total < -3 SD ≥ -3 SD & < - 2 SD ≥ -2 SD Oedema
N N % N % N % N % 06-17 124 5 4.0% 31 25.0% 88 71.0% 0 0.0% 18-29 125 6 4.8% 24 19.2% 94 75.2% 1 0.8% 30-41 87 0 0.0% 6 6.9% 81 93.1% 0 0.0% 42-53 83 0 0.0% 12 14.5% 71 85.5% 0 0.0% 54-59 51 0 0.0% 11 21.6% 40 78.4% 0 0.0% TOTAL 470 11 2.3% 84 17.9% 374 79.6% 1 0.2%
Table 6. Weight for Height vs. oedema in Z-score
Presence of oedema < -2 SD ≥ -2 SD Marasmus/Kwashiorkor Kwashiorkor YES 0 0.0% 1 0.2% Marasmus Normal NO 95 20.2% 374 79.6%
One case of oedema was found, meaning that there was one case of Kwashiorkor in the sample.
16
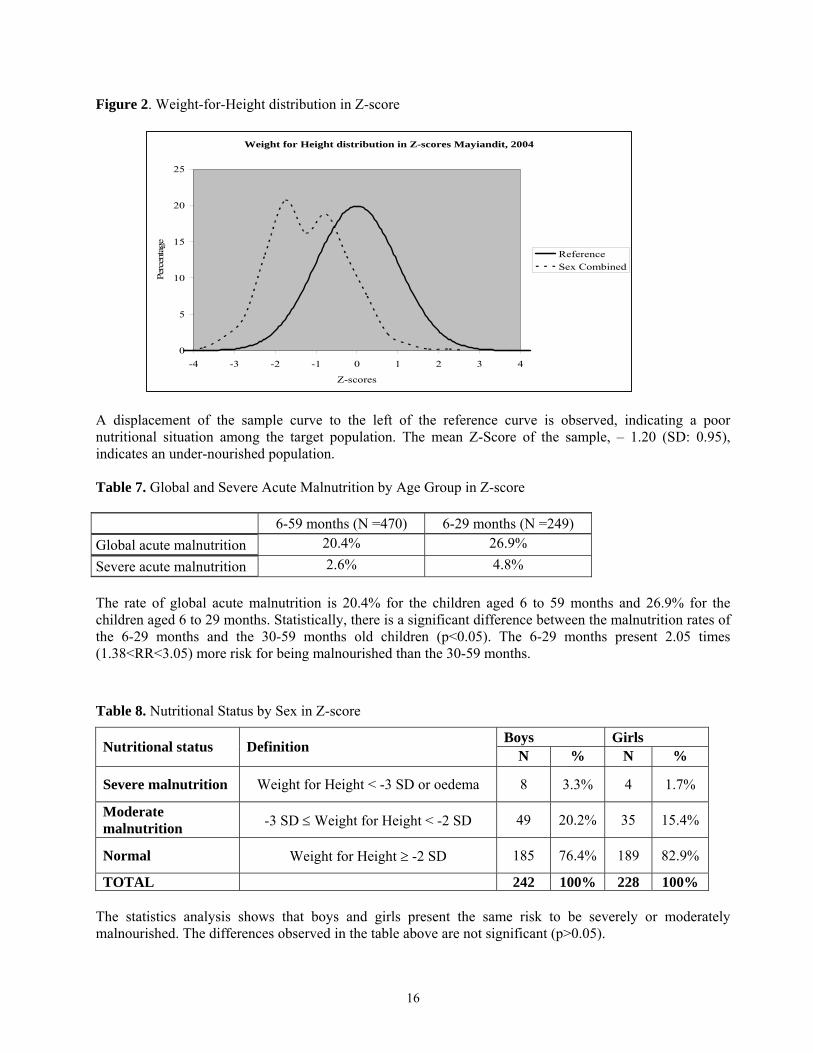
Figure 2. Weight-for-Height distribution in Z-score
Weight for Height distribution in Z-scores Mayiandit, 2004
0
5
10
15
20
25
-4 -3 -2 -1 0 1 2 3 4
Z-scores
Perc
enta
ge
ReferenceSex Combined
A displacement of the sample curve to the left of the reference curve is observed, indicating a poor nutritional situation among the target population. The mean Z-Score of the sample, – 1.20 (SD: 0.95), indicates an under-nourished population. Table 7. Global and Severe Acute Malnutrition by Age Group in Z-score
6-59 months (N =470) 6-29 months (N =249) Global acute malnutrition 20.4% 26.9% Severe acute malnutrition 2.6% 4.8% The rate of global acute malnutrition is 20.4% for the children aged 6 to 59 months and 26.9% for the children aged 6 to 29 months. Statistically, there is a significant difference between the malnutrition rates of the 6-29 months and the 30-59 months old children (p<0.05). The 6-29 months present 2.05 times (1.38<RR<3.05) more risk for being malnourished than the 30-59 months.
Table 8. Nutritional Status by Sex in Z-score
Boys Girls Nutritional status Definition N % N %
Severe malnutrition Weight for Height < -3 SD or oedema 8 3.3% 4 1.7%
Moderate malnutrition -3 SD ≤ Weight for Height < -2 SD 49 20.2% 35 15.4%
Normal Weight for Height ≥ -2 SD 185 76.4% 189 82.9%
TOTAL 242 100% 228 100% The statistics analysis shows that boys and girls present the same risk to be severely or moderately malnourished. The differences observed in the table above are not significant (p>0.05).

17
♦ Distribution of malnutrition in percentage of the median
The distribution of acute malnutrition in percentage of the median reveals a global acute malnutrition rate of 11.3%. 1.1% of the children are severely malnourished and 10.2% are moderately malnourished.
Table 9. Weight/Height: Distribution by Age in percentage of median
AGE (In months) < 70% ≥ 70% & < 80% ≥ 80% Oedema
N N % N % N % N % 06-17 124 2 1.6% 20 16.1% 102 82.3% 0 0.0% 18-29 125 2 1.6% 17 13.6% 105 84.0% 1 0.8% 30-41 87 0 0.0% 2 2.3% 85 97.7% 0 0.0% 42-53 83 0 0.0% 6 7.2% 77 92.8% 0 0.0% 54-59 51 0 0.0% 3 5.9% 48 94.1% 0 0.0% TOTAL 470 4 0.9 48 10.2% 417 88.7% 1 0.2%
Table 10. Weight for Height vs. oedema in percentage of median
Presence of oedema < -2 SD ≥ -2 SD Marasmus/Kwashiorkor Kwashiorkor YES 0 0.0% 1 0.2% Marasmus Normal NO 52 11.1% 417 88.7%
One case of Kwashiorkor was detected in the sample.
Table 11. Global and Severe Acute Malnutrition by Age Group in Percentage of Median
6-59 months (n =470) 6-29 months (n =249) Global Acute Malnutrition (GAM 11.3% 16.9%
Severe Acute Malnutrition (SAM) 1.1% 2.0% As observed is the Z-score analysis, there is a significant difference in the nutritional status between the 6-29 months and the 30-59 months old children (p<0.05). Taking into consideration the percentage of the median, the 6-29 months are 3.39 times (1.79<RR<6.42) more at risk of malnutrition than 30-59 months.
Table 12. Nutritional Status by sex in percentage of median
Boys Girls Nutritional status Definition N % N % Severe malnutrition Weight for Height < 70% or oedema 2 0.8 3 1.3 Moderate malnutrition 70% ≤ Weight for Height < 80% 27 11.2 21 9.2 Normal Weight for Height ≥80% 213 88.0 204 89.5 TOTAL 242 100% 228 100%

18
The statistics analysis shows, as previously, that boys and girls have the same risk of malnutrition. There is no significant difference between girls and boys in regards to malnutrition (p>0.05).
♦ Nutritional status of the children below 6 months 34 children aged below 6 months, present in the households at the time of the survey, were measured in order to determine their nutritional status. Among the under 6 months, 52.9% (18) were boys and 47.1% (16) were girls. No child under 2 months was included in the sample since mothers are often reluctant to have their newborns measured. Table 13. Age distribution of the under 6 months
Age in month N % 0 - - 1 - - 2 7 20.6 3 8 23.5 4 8 23.5 5 11 32.4
Total 34 100 No child below 49 cm height was found, so all the records were analyzed with the NCSH reference tables. According to the Weight for Height index in Z-score and in percentage of median, there were no severely malnourished infants. Out of the 34 children, 2 (5.9%) children were moderately malnourished and the rest of the children (94.1%) had a good nutritional status. 2.2. Risk of mortality: children’s MUAC As MUAC overestimates the level of under nutrition in children less than 1 year old, the analysis refers only to children having height equal to or greater than 75 cm. A total of 393 children have therefore been included in the analysis.
Table 14. MUAC distribution according to nutritional status
Total 75 - 90 cm height ≥ 90 cm height Criteria Nutritional status N % N % N %
< 110 mm Severe malnutrition 1 0.3% 1 0.6% 0 0.0%
110 mm ≥ MUAC < 120 mm Moderate malnutrition 8 2.0% 7 4.0% 1 0.5%
120 mm ≥ MUAC < 135 mm At risk of malnutrition 79 20.1% 51 29.1% 28 12.8%
MUAC ≥ 135 Normal 305 77.6% 116 66.3% 189 86.7%
TOTAL 393 100% 175 100% 218 100%

19
MUAC measurements revealed that 0.3% of the measured children were severely malnourished, i.e. at high risk of mortality, while 2.0% were moderately malnourished and 20.1% at risk of malnutrition. 77.6% had a good nutritional status. The results show that most of the malnourished children were found in the height group 75-90 cm, which corresponds to the children aged 1 to 3 years. 3. Measles vaccination coverage Measles vaccination is done from the age of 9 months; therefore only the children aged 9-59 months (437 children) were included in this analysis.
Table 15. Measles vaccination coverage
Measles Vaccination N % According to the EPI card 5 1.1% According to the caretaker 92 21.1% Not covered 340 77.8% Total 437 100%
Measles vaccination coverage is very low in the area. It should be improved to prevent eventual outbreak. 4. Household status The residential status information was collected from 310 mothers and caretakers during the anthropometric survey. 98.7% of the households were resident while 1.3% were internally displaced. The average number of children under 5 years per household was 1.49 (SD 0.82), and 4.29 (SD 2.21) for the above 5 years old.
Table 16. Household status
Residential status N % Residents 306 98.7% Internally Displaced 4 1.3% Total 310 100%
5. Mortality rate Crude mortality rate The crude mortality was calculated from the figures collected from all visited households, whether or not they had under-5 children. There were 531 children under 5 years old alive at the time of the survey, as well as 1,526 above 5 years. The total of people alive in the households is 2,057. The under five represent 25.8% of the population. A total of 12 deaths were reported within the last 3 months, among who 6 (50%) were below 5 years old. Death Rate (DR) = 12/[((2057+12)+2057)/2] = 0.00581818 Crude Mortality Rate (CMR) = [0.00581818 x 10,000]/90 people/day = 0.65 According to the above formula, the crude mortality rate is 0.65/10,000/day.

20
6. Causes of mortality The main presumed causes of death15 among the children under 5 years old were pneumonia (3 cases) and watery diarrhea (2 cases).
Table 17. Causes of death
Under 5 Above 5 Cause of Death N % N % Watery diarrhea 2 33.3 - - Bloody diarrhea - - 1 16.7
Measles - - 1 16.7 Pneumonia 3 50.0 - -
Tuberculosis - - 1 16.7 Malnutrition 1 16.7 - - Miscarriage 2 33.3
Suicide - - 1 16.7 Total 6 100 6 100
DISCUSSION The analysis of the anthropometric data of children aged 6 to 59 months shows the following rates of acute malnutrition expressed in Z-score:
♦ Rate of Global Acute Malnutrition (GAM): 20.4% ♦ Rate of Severe Acute Malnutrition (SAM): 2.6%.
20.4% of the children measured had a low Weight for Height index and 2.6% were severely malnourished. The GAM rate is above the emergency threshold of 15% as defined by WHO16, while the SAM rate remains below the emergency level of 4%. Considering the above rates of acute malnutrition, the nutritional situation in Mayiandit Payam is considered worrying. This analysis is in accordance with the analysis of the MUAC measurements for children aged 1 to 5 years: 2.3% of the children measured were considered malnourished, 20.1% were considered to be at risk of malnutrition and 77.6% had a good nutritional status. The nutritional situation appears even more critical for the infants. The 6-29 months children are 2.05 times (1.38<Relative Risk<3.05) more at risk of malnutrition than the 30-59 months old children. The crude mortality rate, 0.65/10,000/day, is below the alert level of 1/10,000/day17. Half of the individuals who died during the 3 months preceding the survey were children under 5 years old (6 out of 12 cases). The
15 As mentioned by the community. 16 WHO classification of wasting prevalence in populations, 2000. 17 Health and nutrition information systems among refugees and displaced persons, Workshop report on refugee’s nutrition, ACC / SCN, Nov 95.
21
main presumed causes of death18 for this age group were pneumonia (3 cases), watery diarrhea (2 cases) and malnutrition (1 case). Among the above 5 years old, the main presumed causes of death were miscarriage (2 cases), suicide, bloody diarrhea, measles and tuberculosis (1 case each). The various results presented above can be explained by the following factors:
- Food security situation: Food security in the area is a concern. As mentioned above, last year harvest was poor, forcing people to rely heavily on cow milk, fish and sorghum bought in the neighboring county of Leer. The location, classified as severely food insecure, was supposed to receive a great amount of food aid from WFP, but food deliveries were postponed because of fighting in the location, meaning that the community currently has a limited access to cereals. In addition coping mechanisms seem to be limited this year: despite the presence of a large river, the community has a low access to fish because of the lack of fishing equipment, and the milk production has substantially reduced because of the consequences of the outbreak of foot and mouth disease few months ago. The low availability of food at the household level, particularly milk, partly explains the rates of acute malnutrition detected among the under-5 children.
- Childcare and feeding practices: The nutritional status of the infants seems to depreciate after 6
months considering the rates of GAM and SAM among the 6 to 29 months. This may be attributed to weaning practices. According to the community, the mothers wean their children after few months of breastfeeding by giving only cow milk and soup from the family plate as complementary foods.
- Poor water and sanitation situation: although most of the population has access to the boreholes,
the river Niang remains a main source of water for the community. Regarding sanitation, most of the people defecate in the open, which contributes to dissemination of germs. Few latrines were seen in the location, some of them having been destroyed because of the floods, increasing the risk of contamination of water sources. This poor environmental sanitation, as well as the poor personal hygiene, contributes to the high incidence of diarrhea, particularly among young children. Considering the close link between sickness and malnutrition19, it can be concluded that the poor sanitation situation in the location has probably contributed to the poor nutritional status of the most vulnerable, i.e. children under-5.
- Access to health services: while the prevalence of diseases like malaria, diarrhea and pneumonia is
high in the area, only one organization provides health services. ACROSS runs one health facility for the whole payam, which remains insufficient to face the medical needs of the population. In addition, because ACROSS is not in a position to ensure the cold chain necessary to implement an EPI program, there are no routine EPI activities in the area, which is a concern knowing that only 1.1% of the children were immunized against measles (according to vaccination cards) and 21.1% according to the mothers and caretakers.
The combination of the various factors mentioned above has contributed to the poor nutritional situation detected in Mayiandit Payam. 18 As mentioned by the community. 19 Sickness often prevents the proper absorption of the nutrients by the body.
22
RECOMMENDATIONS • ACROSS to continue offering health services in the area. • ACROSS to implement EPI in the location and to improve the coverage of measles vaccination. • ACF-USA and ACROSS to discuss the possibility of treating malnourished children within the health
facility: indeed, although the nutritional situation is poor, the small size of the under-5 population suggests that an integrated approach to treat malnutrition is recommended over an emergency feeding program.
• WFP to assess the food security situation and to provide food accordingly. • SCF-UK/ACF-USA to consider interventions to alleviate the food security problems of the community,
including distribution of fishing equipment. • VSF-Suisse to continue offering veterinary services and to control the outbreak of foot and mouth
disease in the area. • Carter Center to provide water filter cloths to prevent contamination by Guinea worm. • ACF-USA to disseminate the present results and recommendations to the local community

23
APPENDIXES Appendix 1. Villages within a radius of 3 hours walk from Mayiandit airstrip, August 2004
VILLAGES DISTANCE FROM MAYIANDIT CENTRE
TOTAL POPULATION
ESTIMATED TARGET
POPULATION Chortchar 1 hour 115 23Dhorkewni 1 hour 205 41Dhorthier 1 hour 30 minutes 210 42Kapiny 1 hours 110 22Dhorkewna 15 minutes 280 56Gezira 2 hours 125 25Lonnyier 2 hours 245 49Rietgok 2 hours 60 12Malkuer 3 hours 375 75Letwech 30 minutes 75 15Padeah 30 minutes 140 28Thorkuok 45 minutes 155 31Dhorgapni 7 minutes 215 43
24
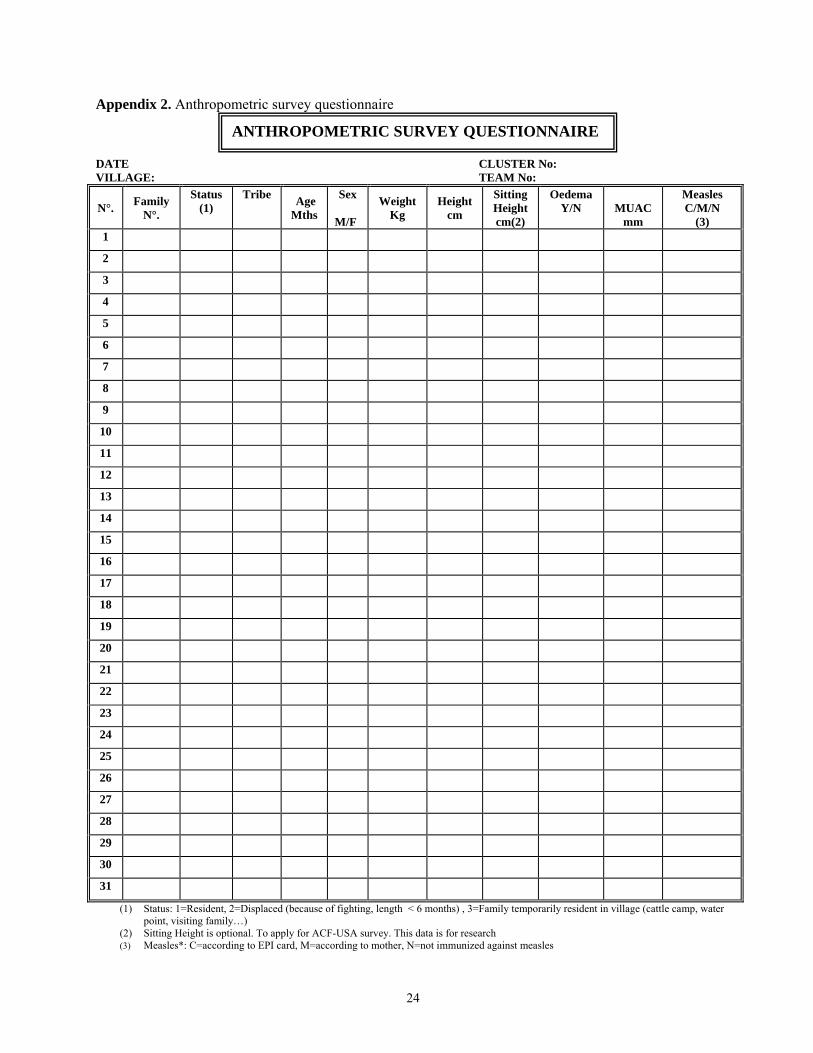
Appendix 2. Anthropometric survey questionnaire DATE CLUSTER No: VILLAGE: TEAM No:
N°. Family N°.
Status (1)
Tribe Age Mths
Sex M/F
Weight Kg
Height cm
Sitting Height cm(2)
Oedema Y/N
MUAC
mm
Measles C/M/N
(3) 1
2
3
4
5
6
7
8
9
10
11
12
13
14
15
16
17
18
19
20
21
22
23
24
25
26
27
28
29
30
31
(1) Status: 1=Resident, 2=Displaced (because of fighting, length < 6 months) , 3=Family temporarily resident in village (cattle camp, water point, visiting family…)
(2) Sitting Height is optional. To apply for ACF-USA survey. This data is for research (3) Measles*: C=according to EPI card, M=according to mother, N=not immunized against measles
ANTHROPOMETRIC SURVEY QUESTIONNAIRE
25
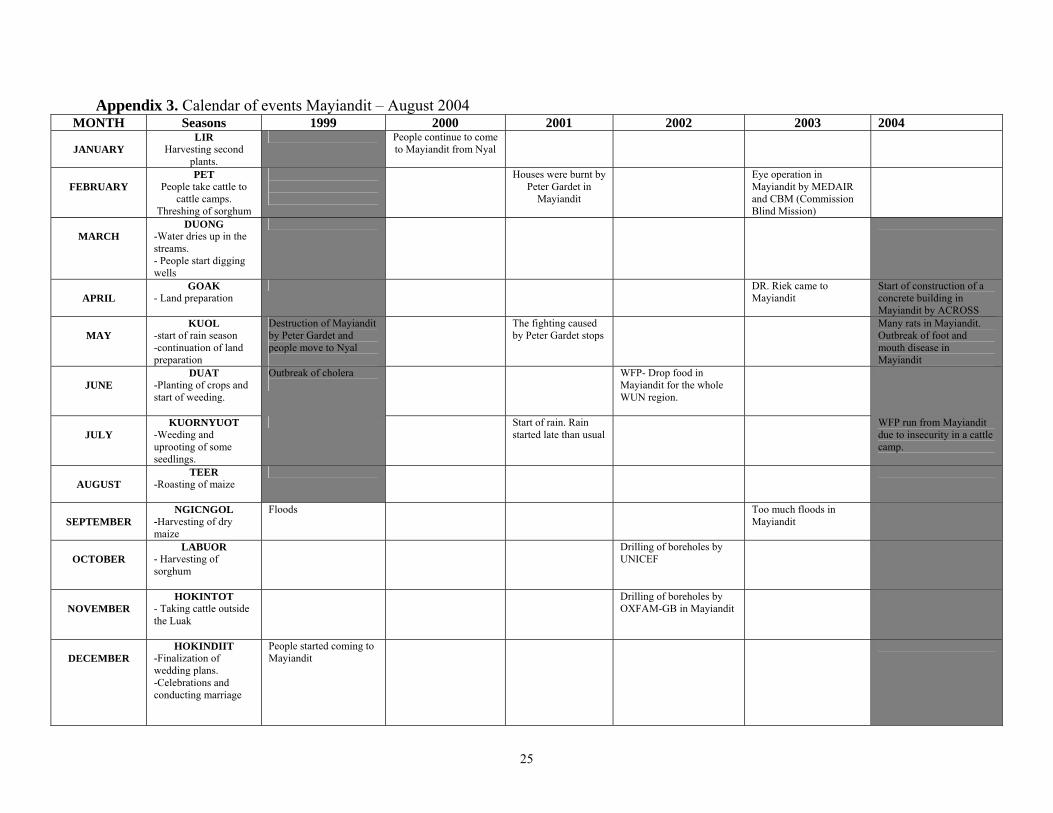
Appendix 3. Calendar of events Mayiandit – August 2004 MONTH Seasons 1999 2000 2001 2002 2003 2004
JANUARY
LIR Harvesting second
plants.
People continue to come to Mayiandit from Nyal
FEBRUARY
PET People take cattle to
cattle camps. Threshing of sorghum
Houses were burnt by Peter Gardet in
Mayiandit
Eye operation in Mayiandit by MEDAIR and CBM (Commission Blind Mission)
MARCH
DUONG -Water dries up in the streams. - People start digging wells
APRIL
GOAK - Land preparation
DR. Riek came to Mayiandit
Start of construction of a concrete building in Mayiandit by ACROSS
MAY
KUOL -start of rain season -continuation of land preparation
Destruction of Mayiandit by Peter Gardet and people move to Nyal
The fighting caused by Peter Gardet stops
Many rats in Mayiandit. Outbreak of foot and mouth disease in Mayiandit
JUNE
DUAT -Planting of crops and start of weeding.
Outbreak of cholera
WFP- Drop food in Mayiandit for the whole WUN region.
JULY
KUORNYUOT -Weeding and uprooting of some seedlings.
Start of rain. Rain started late than usual
WFP run from Mayiandit due to insecurity in a cattle camp.
AUGUST
TEER -Roasting of maize
SEPTEMBER
NGICNGOL -Harvesting of dry maize
Floods
Too much floods in Mayiandit
OCTOBER
LABUOR - Harvesting of sorghum
Drilling of boreholes by UNICEF
NOVEMBER
HOKINTOT - Taking cattle outside the Luak
Drilling of boreholes by OXFAM-GB in Mayiandit
DECEMBER
HOKINDIIT -Finalization of wedding plans. -Celebrations and conducting marriage
People started coming to Mayiandit
26
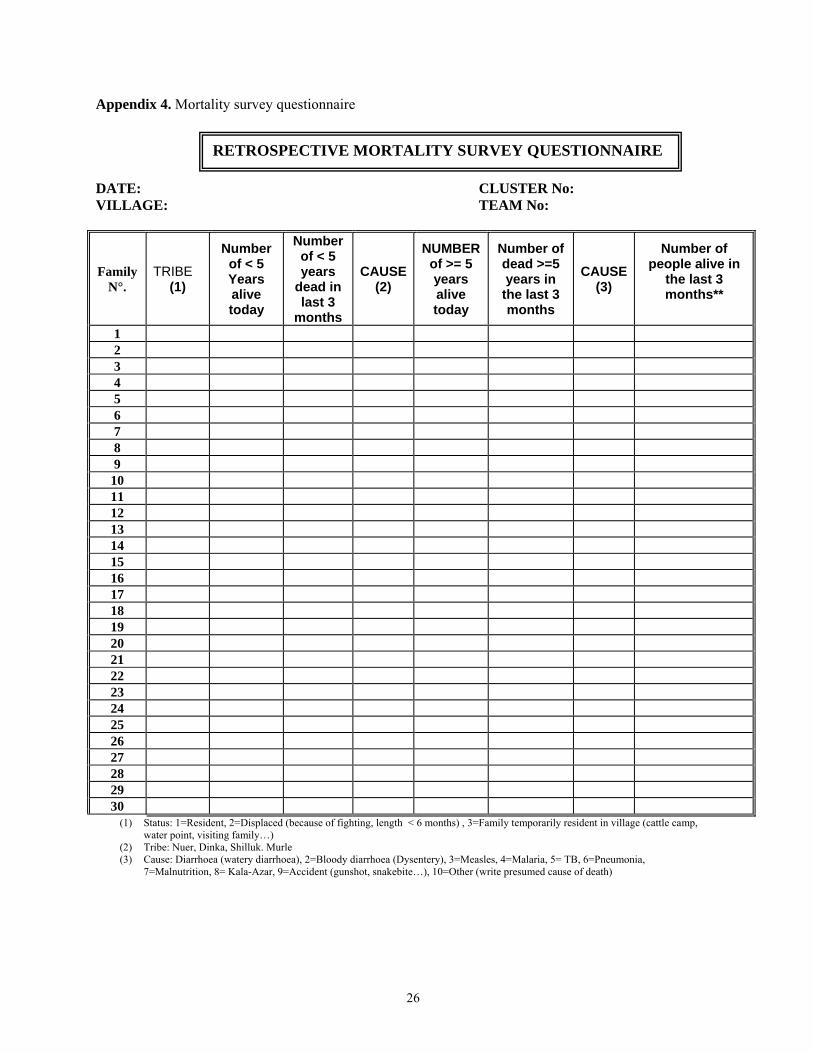
Appendix 4. Mortality survey questionnaire DATE: CLUSTER No: VILLAGE: TEAM No:
Family N°.
TRIBE (1)
Number of < 5 Years alive today
Number of < 5 years
dead in last 3
months
CAUSE(2)
NUMBER of >= 5 years alive today
Number of dead >=5 years in
the last 3 months
CAUSE (3)
Number of people alive in
the last 3 months**
1 2 3 4 5 6 7 8 9
10 11 12 13 14 15 16 17 18 19 20 21 22 23 24 25 26 27 28 29 30
(1) Status: 1=Resident, 2=Displaced (because of fighting, length < 6 months) , 3=Family temporarily resident in village (cattle camp, water point, visiting family…)
(2) Tribe: Nuer, Dinka, Shilluk. Murle (3) Cause: Diarrhoea (watery diarrhoea), 2=Bloody diarrhoea (Dysentery), 3=Measles, 4=Malaria, 5= TB, 6=Pneumonia,
7=Malnutrition, 8= Kala-Azar, 9=Accident (gunshot, snakebite…), 10=Other (write presumed cause of death)
RETROSPECTIVE MORTALITY SURVEY QUESTIONNAIRE