south kordofan interagency rapid food security assessment presentation of findings
TRANSCRIPT

South Kordofan Interagency Rapid Food Security Assessment
Presentation of findings

Structure of the presentation
1. Assessment process
2. General findings
3. Who and how many are food insecure (and secure)?
4. Where are the food insecure?
5. Response options and recommendations

Sampling and methodology
• Assessing food security of flood affected communities in South Kordofan
• Flood impact: 34 communities (176, 881 persons)– Sampling universe reduced to 21 communities
(84,761 persons) due to insecurity
• Two stage random sampling (15 clusters and 20 households per cluster)
• Total sample 300 households• Household and community questionnaires plus
focus group discussions

Assessment process
• Questionnaire design in Khartoum• Training of team leaders and enumerators in
Kadugli• Two field teams• Two weeks of field work between 5 – 16 March• Data entry in Kadugli• Data analysis in Khartoum (quantitative and
qualitative)• Presentation of findings in Kadugli and
Khartoum


Participating Agencies and Authorities
• WFP• HAC-SRRC• FAO• Norwegian Refugee Council• Save the Children US• Care International• State Ministry of Agriculture• SAAR• State Ministry of Health• RRR

Market findings

Prices and terms of trade
• Average cereal prices – Cereal prices rose by 76% for sorghum and 47% for
millet compared last year
• Average livestock prices – Livestock prices dropped by 31% for cattle and 37%
for sheep and goats compared to last year
• Terms of Trade – Terms of trade for pastoralists and wage laborers has
declined substantially since last year

Findings in the general population

Basic demographics
Mean
Number of household members 7.3
Number of dependents in household 3.60
Number of independents in household 3.72
Dependency ratio (higher number implies less proportion of productive household members)
1.26

Resident groups
• Most households are residents
•Very few internally displaced persons and nomads sampled

Sex of household head
• Almost one third of households are headed by women
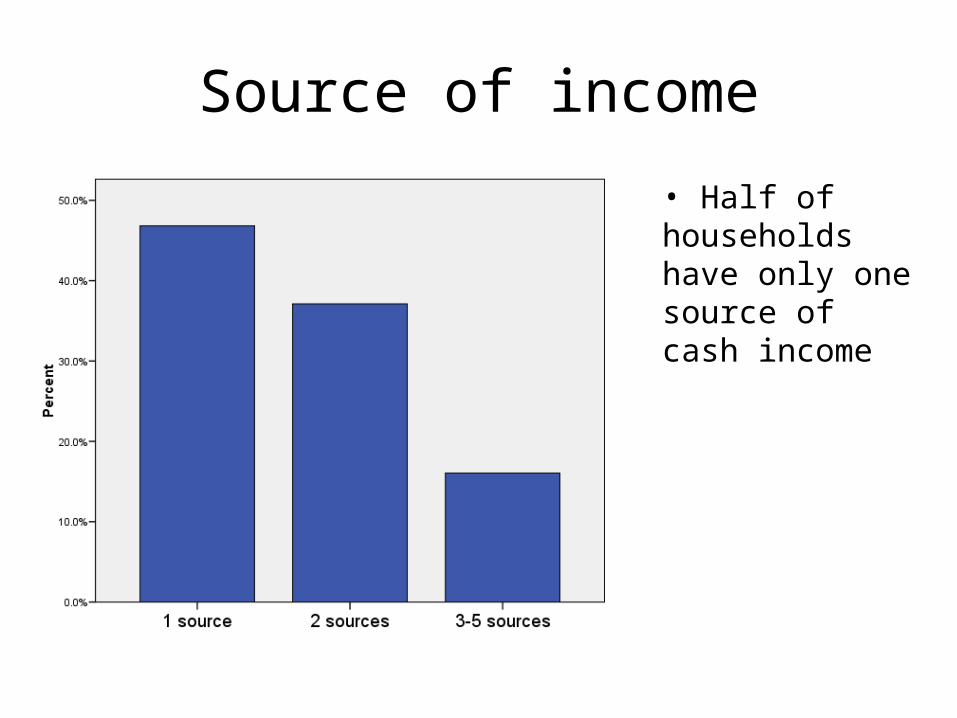
Source of income
• Half of households have only one source of cash income

Land ownership
• Access to land is very high

Cereal production
• Average cereal production dropped by almost 50 percent
Cereal is sorghum, millet and maize
Y axis measurement is kg/household member

Tropical Livestock Unit (TLU)
1.25donkeys
1.25cattle
1horse
1camel= =
10sheep
10goats= =
1TLU =
=

Livestock ownership
• Most households own no or little livestock
• Mean tropical livestock unit: 1.51
Thresholds:1) No or little: 0 - 0.5 TLU2) Medium: 0.5 - 2.5 TLU3) Large: 2.5 TLU -

Access to credit
• A majority of households have no access to credit

Use of credit
• Buying food is by far the most common use of credit

Remittances
• About one out of five households receive remittances

Food shortage and coping
• Eating less quantities and getting food on credit are the most common coping strategies

Short-term priorities
• Food aid is the highest priority for most households, in the short run
•Cash assistance is the second highest

Long-term priorities
• Agricultural inputs is the most common priority, in the long run
• Health services and cash assistance comes next

Food security

Key concepts
• Food securityFood security = Food consumption + Food access
• Food consumptionSeven day food consumption
• Food accessAbsolute food expenditureRelative food expenditureCereal production

Food consumption• Majority of households have acceptable food consumption
Thresholds:1) 0 - 21 (sorghum daily, pulses twice a week, vegetables once)
2) 21 - 353) 35 -

Absolute food expenditure
Mean absolute food expenditure per capita: 6.7 SDG
• Half of households have acceptable absolute expenditure on food
Thresholds:1) 0 – 2 SDG (median of the two bottom quintiles)
2) 2 – 4.6 SDG (median of the distribution)
3) 4.6 -

Relative food expenditure
Mean relative food expenditure: 55%
• Almost a third of households spend more than half of their income on food
Thresholds:1) 0% - 50%2) 50% - 65%3) 65% -

Cereal production
Mean cereal production per capita: 38 kg/person
• The vast majority of households produce less than half of their requirement
Thresholds:1) 0 – 73 kg/person2) 73 - 146 kg/person3) 146 kg/person -

Food securitySeverely food
insecure: 34,022 persons
Moderately food insecure:
44,490 persons
Food secure:17,665 persons

Who are the food insecure?
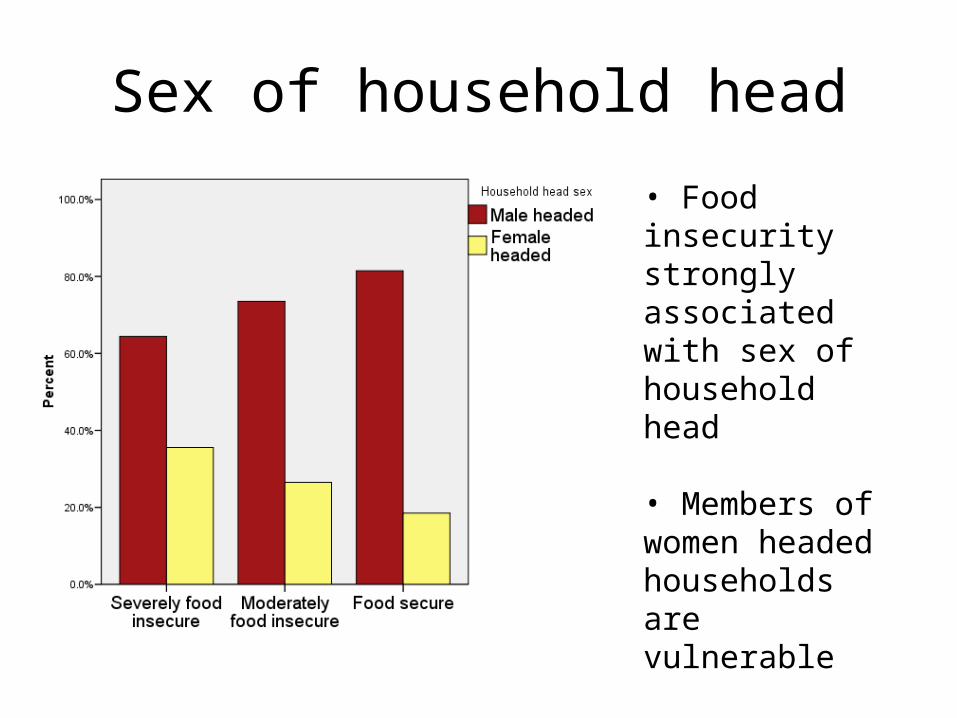
Sex of household head
• Food insecurity strongly associated with sex of household head
• Members of women headed households are vulnerable

Cereal production
• Dramatic harvest decline 2006-2007
• Decline in harvest hitting severely and moderately food insecure disproportionately

Livestock ownership
• Food insecure households tend to hold less livestock
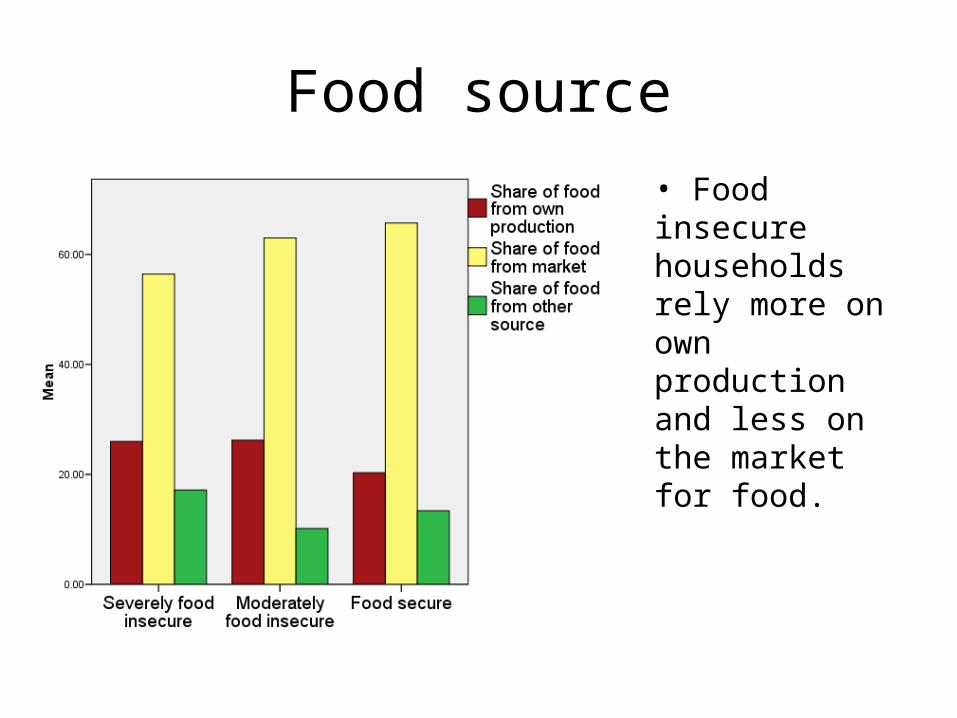
Food source
• Food insecure households rely more on own production and less on the market for food.

Food shortage and coping
• Severely food insecure households experience more food shortage
• About 60% of severely food insecure households eat less than normal (or less preferred food)

Where are the food insecure?Zoning: highlands and lowlands


Food security
• More severely food insecure live in the highlands
• More food secure live in the lowlands

Sex of household head
• More female headed households live in the highlands

Main income source – past 6 months • Non agricultural
labour is dominant in the lowlands
• Sale of firewood, charcoal and grass is important in both areas
• Livestock sale is important for the highlands
• Remittances are more important in the highlands

Cultivation
• More households did not cultivate in the lowlands

Cereal production
• Both areas produced less in 2007 compared to 2006
• Highlands produced less than lowlands in both agricultural seasons

Livestock ownership
• Households in the highlands in average tend to own more livestock than households on the lowlands

Food source• Household in the highlands rely more on own production and from other sources
• Household in the lowlands tend to rely mainly on the market
• Lowlands’ economies tend to be more cash-based

Assets
• Households in the lowlands tend to have in average more assets

Access to credit
• Household in the highlands have less opportunities to access credit

Short-term priorities
• Food aid for both areas nut higher for highlands
• Cash assistance requested especially in the lowlands

Long-term priorities
• Agricultural inputs felt as important
• Drinking water in the highlands

Food aid
• Households in the highlands tend to be recipient of food aid

Response options and recommendations

Points to consider
• Reduced food production
• Food access problem at household level
• Lean season is about to start
• Market accessibility (areas cut-off)
• Unsustainable sources of income (charcoal production)
• Zones (highlands and lowlands)

Points to consider (continued)
Chronic food insecurity• Very low production, few assets, few animals,
poor or borderline food consumption, reliance or casual labour and other sources of income and food (sustainability issue)
Transitory food insecurity• Reduction in cereal production compensated by
alternative sources of income and food (resilience/sustainability)

Conclusions• About 29,300 people (35% of sampled
population) are severely food insecure: produce insufficient food, own little livestock and assets, they are currently reducing their food quantities consumed, rely on migration and casual labour coupled with collection of wild products
• Female headed households tend to be more vulnerable to food insecurity

Conclusions (continued)
• Highlands tend to be more vulnerable to food insecurity due to chronic and transitory factors
• About 18,000 people (42% of highlands sampled population) are severely food insecure and 19,700 (46%) are moderately food insecure

Conclusions (continued)
• Lowlands suffered the impact of the shock on cereal production but economic opportunities mitigated the adverse effects (resilience/sustainability)
• About 11,300 people are severely food insecure (27% of the sampled population in the lowlands) while 19,700 (47%) are moderately food insecure.

Food for work / assets / recoveryStrengths Weaknesses Opportunities Threats
•Supports livelihoods (assets creation, rehabilitation)•Self-targeting
•Not feasible during the agricultural season and harvest
•Implemented in the dry season•Aimed at improving roads•Potential to support traditional collective work systems
•Migration during dry season

Cash for work
Strengths Weaknesses Opportunities Threats
•Supports livelihoods (assets creation, rehabilitation)•Works well cash based and market integrated economy
•Not feasible during the agricultural season and harvest•Lack of market integration, high prices
•Implemented in the dry season•Aimed at improving roads
•Migration during dry season•High food prices•Lack of cash transfer network/ institutions

Training on skills, income generation activities
Strengths Weaknesses Opportunities Threats
•Increase income generation opportunities
•Time for implementation and need for skilled staff
•Build on local skills •Cash /market based economy
•Lack of partners•Weak project design / targeting

General food distribution
Strengths Weaknesses Opportunities Threats
•Life saving in areas cut off from markets
•Not suitable in market integrated areas•Logistics constraints
•Quick response to food gap during the lean season
•Dependency (free hand-out)•Poor targeting

Cash / vouchers distribution
Strengths Weaknesses Opportunities Threats
•Works well in areas where markets are integrated•Flexible for household
•Not suitable in areas cut-off from markets or not integrated
•Supports cash and market based economy•Attracts traders
•Lack of adequate cash transfer system or retailers
•Dependency (free hand-out)
•Poor targeting
•High prices
Other livelihoods interventions
• Seeds, tools
• Livestock services
• Water points
• Rural credit schemes

Recommendations• One-off general food distribution in areas with
high food insecurity and likely to be isolated from markets (generally highlands)
• Food vouchers in areas where markets are accessible all year and with relatively stable prices (generally lowlands)
• Livelihood interventions to support cultivation (seeds and tools)
• Plan rural assets/infrastructure creation/rehabilitation (dry season)
• Skills/income generation training for rural areas

South Kordofan Interagency Rapid Food Security
Assessment
Fabrizio Andreuzzi
Anders PeterssonVulnerability Analysis and Mapping Unit
World Food Programme
Khartoum Sudan