south florida water management district -...
TRANSCRIPT

PREPARED FOR:
South Florida Water Management District
PREPARED BY:
and
DECEMBER 2008
Gary Goforth, Inc.
WB0
80800
820
000
2DFBBFBBB

2008 Report on the Long-Term Plan for Achieving Water Quality Goals for the Everglades Protection Area Tributary Basins
December 2008 i
EXECUTIVE SUMMARY The long-term Everglades water quality objective is to implement the optimal combination of
source controls, Stormwater Treatment Areas (STAs), Advanced Treatment Technologies, and/or
regulatory programs to ensure that all waters in the Everglades Protection Area (EPA) meet water
quality standards, including compliance with the phosphorus criterion established in Rule 62-
302.540 of the Florida Administrative Code (F.A.C.), consistent with the requirements of
Florida’s 1994 Everglades Forever Act (EFA, Section 373.4592 Florida Statutes). The October
27, 2003 Everglades Protection Area Tributary Basins, Long-Term Plan for Achieving Water
Quality Goals (Burns & McDonnell 2003) (Long-Term Plan) sets forth a recommended plan and
strategy for achieving that objective allowing the State of Florida and the South Florida Water
Management District (District) to fulfill their obligations under both the EFA and the federal
Everglades Settlement Agreement (Case No. 88-1886-CIV-MORENO). This document provides
the first 5-year report on the Long-Term Plan and is to be submitted no later than December 31,
2008, to the Governor and the Legislature.
Substantial progress towards reducing phosphorus levels discharged into the EPA has been made
by the State of Florida and other stakeholders. The combined performance of the regulatory
program in the Everglades Agricultural Area (EAA) and the STAs constructed under the 1994
Everglades Construction Project, both mandated by the EFA, has exceeded initial expectations.
Since the inception, the EAA best management practices (BMPs) and the ECP STAs have
collectively removed more than 2,848 metric tons of TP that otherwise would have entered the
Everglades.
As originally envisioned, the Everglades Construction Project was to consist of approximately 40,000 acres of effective treatment area1 of constructed wetlands distributed among six discrete STAs. The ECP has been expanded to a total of slightly more than 45,000 acres in recent years, and further expansion of the ECP is underway with the increased footprint being implemented expected to be approximately 56,500 acres of effective treatment area. Outflow total phosphorus (TP) concentrations from the STAs continue to improve following enhancements and recovery from the 2004-2005 hurricanes, averaging 26 ppb for Water Year 2008 (WY2008) (SFER 2009, in press). As a direct result of these significant water quality improvement strategies, TP loads to

2008 Report on the Long-Term Plan for Achieving Water Quality Goals for the Everglades Protection Area Tributary Basins
December 2008 ii
the EPA from the ECP Basins over the last five years have decreased 70% from the WY1979-1988 base period (SFER 2009, in press)2. In part due to the regional drought, WY2008 TP loads from the ECP Basins exhibited an 86% reduction from the WY1979-1988 base period (SFER 2009, in press). Since 1994, over 1,050 metric tons of TP have been removed by the STAs that otherwise would have entered the EPA.
A combination of phosphorus source controls, local government and private water control and
conservation programs, and integration with Comprehensive Everglades Restoration Plan (CERP)
projects form the foundation for water quality improvements in the Non-ECP Basins. TP loads
from the Non-ECP Basins to the EPA over the last five years have decreased 25% from the
WY1979-1988 base period (SFER 2009, in press). In part due to the regional drought, WY2008
TP loads from the Non-ECP Basins exhibited a 74% reduction from the WY1979-1988 base
period (SFER 2009, in press).
Ongoing engineering and scientific investigations by the District and others engaged in
Everglades Restoration since the time of development of the 2003 Long-Term Plan have provided
valuable information which has supported refinements to the estimated performance of the water
quality improvement strategies for both the ECP and non-ECP basins. In many respects, work
conducted over the past 5 years has far exceeded the original expectations. For example, major
increases in the STA system footprint have occurred well in advance of what was originally
viewed as recommended, and conversion of significant portions of the macrophyte-based STAs to
SAV systems has been achieved successfully in spite of the major disturbances of the hurricane
seasons of 2004 and 2005 followed by the severe drought conditions that have prevailed in the
region in 2006, 2007, and much of 2008. This period of STA operations has been extremely
instructive in management of these large systems following significant hurricane disturbances,
and periods of both hydraulic and phosphorus overload and dry out. Considering the range of
operational challenges that have been imposed on the STA system during periods of start up,
recovery, and stabilization, it is significant that the treatment performance of the various STAs
1 A distinction is made between effective treatment area, which equates to acreage of treatment vegetation, and total area which includes canals, levees, control structures and all other areas that are not directly removing TP. Typically, the total area is about 15% larger than the effective treatment area. 2 It should be noted that discharges from the ECP Basins are not comprised entirely of EAA runoff; TP loads to the EPA from the EAA have been reduced by approximately 80% compared to the WY1979-1988 base period.

2008 Report on the Long-Term Plan for Achieving Water Quality Goals for the Everglades Protection Area Tributary Basins
December 2008 iii
appears to be measurably improving with time and as the District learns how to optimize system
operations.
Because there were several events that occurred during the development of this 2008 Report that
could result in additional proposed revisions to the Long-Term Plan, this 2008 Report focuses on
activities and accomplishments to date in the ECP Basins and non-ECP Basins. A future effort is
planned to develop a comprehensive set of Long-Term Plan proposed revisions, once all of the
related projects and activities are better defined. Planning will proceed with reliance on a strategy
of adaptive implementation, in which all scientifically defensible steps are to be expeditiously
implemented with ongoing refinements expected to be necessary. Through a continued
collaborative approach to issues evaluation, the District will continue its leadership role in
implementation of the Long-Term Plan and in achievement of water quality goals for the
Everglades Protection Area.

2008 Report on the Long-Term Plan for Achieving Water Quality Goals for the Everglades Protection Area Tributary Basins
December 2008 iv
TABLE OF CONTENTS EXECUTIVE SUMMARY ............................................................................................................................. i TABLE OF CONTENTS .............................................................................................................................. iv LIST OF TABLES ......................................................................................................................................... v LIST OF FIGURES........................................................................................................................................ v LIST OF ACRONYMS................................................................................................................................. vi 1. INTRODUCTION................................................................................................................................. 1 2. WATER QUALITY IMPROVEMENT STRATEGIES, ECP BASINS............................................... 8
2.1 Phosphorus Source Controls ............................................................................................................. 8 2.1.1 Everglades Agricultural Area ................................................................................................... 8 2.1.2 C-139 Basin .............................................................................................................................. 9 2.1.3 C-139 Annex ............................................................................................................................ 9 2.1.4 Ch. 298 Districts and Closter Farms....................................................................................... 10 2.1.5 Acme Improvement District Basin B (Village of Wellington) ............................................... 11
2.2 STA Enhancements and Expansion................................................................................................. 11 2.2.1 STA-1E................................................................................................................................... 11 2.2.2 STA-1W ................................................................................................................................. 14 2.2.3 STA-2 ..................................................................................................................................... 16 2.2.4 STA-3/4 .................................................................................................................................. 17 2.2.5 STA-5 ..................................................................................................................................... 20 2.2.6 STA-6 ..................................................................................................................................... 21
3. WATER QUALITY IMPROVEMENT STRATEGIES, NON-ECP BASINS ................................... 23 3.1 North Springs Improvement District (NSID) Basin ........................................................................ 25 3.2 North New River Canal (NNRC) Basin .......................................................................................... 29 3.3 C-11 West Basin.............................................................................................................................. 31 3.4 L-28 Basin ....................................................................................................................................... 33 3.5 Feeder Canal Basin.......................................................................................................................... 36
4. PROCESS DEVELOPMENT AND ENGINEERING (PDE)............................................................. 38 4.1 Enhanced Control and Monitoring .................................................................................................. 39 4.2 Improved Analytical and Forecasting Tools ................................................................................... 39 4.3 Optimizing STA Performance......................................................................................................... 40 4.4 Additional Structural and Operational Measures ............................................................................ 41 4.5 Improved Reliability of Inflow Forecasts........................................................................................ 42
5. RECOVERY OF IMPACTED AREAS WITHIN THE EPA ............................................................. 44 5.1 Development of Planning and Analytical Tools.............................................................................. 46 5.2 Hydropattern Restoration Works..................................................................................................... 48
6. SUMMARY ........................................................................................................................................ 49 7. REFERENCES .................................................................................................................................... 50

2008 Report on the Long-Term Plan for Achieving Water Quality Goals for the Everglades Protection Area Tributary Basins
December 2008 v
LIST OF TABLES Table 1-1. Hydrologic Basins and Stormwater Treatment Areas Addressed in the Long-Term Plan ............ 2 Table 1-2. Comparison of Projected and Actual Performance of Pre-2006 Projects in the ECP Basins,
Including Source Controls, for 2007...................................................................................................... 6 Table 1-3. Comparison of Projected and Actual Performance of Pre-2006 Projects in the Non-ECP Basins,
Including Source Controls, for 2007...................................................................................................... 6 Table 3-1. Non-ECP Basins Included in Long-Term Plan ........................................................................... 23 Table 3-2. Comparison of Discharges from the S-9 Complex...................................................................... 33 Table 4-1. Activities Conducted Supporting Enhanced Control and Monitoring of STA Inflows and
Outflows .............................................................................................................................................. 39 Table 4-2. Activities Conducted Supporting Improved Analytical or Forecasting Tools............................. 40 Table 4-3. Activities Conducted Related to Optimizing STA Performance................................................. 41 Table 4-4. Activities Conducted Related to Improved Reliability of Inflow Forecasts................................ 43 Table 5-1. Activities Conducted Related to Development of Planning and Analytical Tools for Evaluating
Accelerated Recovery and/or Hydropattern Restoration Alternatives for the Northern Everglades Protection Area.................................................................................................................................... 47
LIST OF FIGURES Figure 1-1. Locations of the Everglades Protection Area and Tributary Basins............................................. 3 Figure 2-1. Schematic of STA-1E ................................................................................................................ 12 Figure 2-2. Schematic of Existing STA-1W................................................................................................. 14 Figure 2-3. Schematic of Existing STA-2 .................................................................................................... 17 Figure 2-4. Schematic of STA-3/4 ............................................................................................................... 19 Figure 2-5. Schematic of Existing STA-5 .................................................................................................... 21 Figure 2-6. Schematic of STA-6................................................................................................................... 22 Figure 3-1. Non-ECP Basin Locations ......................................................................................................... 24 Figure 3-2. North Springs Improvement District Basin Map ....................................................................... 27 Figure 3-3. North New River Canal Basin Map ........................................................................................... 30 Figure 3-4. C-11W Basin Map .................................................................................................................... 32 Figure 3-5. L-28 Basin Map ........................................................................................................................ 35 Figure 3-6. Feeder Canal Basin Map........................................................................................................... 37

2008 Report on the Long-Term Plan for Achieving Water Quality Goals for the Everglades Protection Area Tributary Basins
December 2008 vi
LIST OF ACRONYMS BCNP - Big Cypress National Preserve BMP - Best Management Practices C-# - Refers to a District canal with its numeric designation CERP - Comprehensive Everglades Restoration Plan DMSTA - Dynamic Model for Stormwater Treatment Areas EAA - Everglades Agricultural Area ECP - Everglades Construction Project EFA - Everglades Forever Act EPA - Everglades Protection Area ERP - Environmental Resource Permit ESP - Everglades Stormwater Program F.A.C. - Florida Administrative Code F.S. - Florida Statutes FY - Fiscal Year G-# - Refers to a District structure with its numeric designation L-# - Refers to a District levee with its numeric designation NNRC - North New River Canal NRCS - Natural Resource Conservation Service NSID - North Springs Improvement District OM&M - Operation, Maintenance and Monitoring PDE - Process Development and Engineering PL - Public Law PSTA - Periphyton-Based Stormwater Treatment Area S-# - Refers to federally constructed District or USACE structure with its
numeric designation SAV - Submerged Aquatic Vegetation SFWMD - South Florida Water Management District SFWMM - South Florida Water Management Model STA - Stormwater Treatment Area STA-# - STA with its numeric designation TP - Total Phosphorus USACE - United States Army Corps of Engineers WCA - Water Conservation Area WCA-# - WCA with its numeric designation WMA - Wildlife Management Area WMP - Water Management Plan

2008 Report on the Long-Term Plan for Achieving Water Quality Goals for the Everglades Protection Area Tributary Basins
December 2008 1
1. INTRODUCTION This document provides the first 5-year report on the October 27, 2003 Everglades Protection
Area Tributary Basins, Long-Term Plan for Achieving Water Quality Goals (Burns & McDonnell
2003). This 2008 report on the Long-Term Plan is to be submitted no later than December 31,
2008, to the Governor and the Legislature. The long-term Everglades water quality objective is
to implement the optimal combination of source controls, Stormwater Treatment Areas (STAs),
Advanced Treatment Technologies, and/or regulatory programs to ensure that all waters in the
Everglades Protection Area (EPA) meet water quality standards, including compliance with the
phosphorus criterion established in Rule 62-302.540 of the Florida Administrative Code (F.A.C.),
consistent with the requirements of Florida’s 1994 Everglades Forever Act (EFA, Section
373.4592 Florida Statutes). The Long-Term Plan sets forth a recommended plan and strategy for
achieving that objective allowing the State of Florida and the South Florida Water Management
District (District) to fulfill their obligations under both the EFA and the federal Everglades
Settlement Agreement (Case No. 88-1886-CIV-MORENO).
The basins and STAs addressed in the Long-Term Plan are identified in Table 1-1; basin and STA
locations are shown in Figure 1-1. The basins are organized into two primary groupings:
1. Those basins addressed through the 1994 Everglades Construction Project (the ECP Basins);
2. Urban and other tributary basins not addressed by the ECP, i.e., the Non-ECP Basins. Two
other basins that are tributaries to the EPA (the C-111 and Boynton Farms Basins) are being
managed through other District and Federal programs, and are not further discussed herein.
Substantial progress towards reducing phosphorus levels discharged into the EPA has been made
by the State of Florida and other stakeholders. The combined performance of the regulatory
program in the Everglades Agricultural Area (EAA) and the STAs constructed under the 1994
Everglades Construction Project, both mandated by the EFA, has exceeded initial expectations.
Since the inception, the EAA best management practices (BMPs) and the ECP STAs have
collectively removed more than 2,848 metric tons of TP that otherwise would have entered the
Everglades.

2008 Report on the Long-Term Plan for Achieving Water Quality Goals for the Everglades Protection Area Tributary Basins
December 2008 2
Table 1-1. Hydrologic Basins and Stormwater Treatment Areas Addressed in the Long-Term Plan
Everglades Construction Project (ECP) Basins
Hydrologic Basin Receiving Stormwater Treatment Area (STA)
C-51 West STA-1E
Acme Improvement District, Basin B STA-1E
S-5A STA-1W, STA-1E
S-6 STA-2
S-7/S-2 STA-3/4
S-8/S-3 STA-3/4, STA-6
C-139 STA-5, STA-3/4
C-139 Annex STA-6
Non-ECP Basins
North Springs Improvement District (NSID)
North New River Canal (NNRC)
C-11 West
L-28
Feeder Canal

2008 Report on the Long-Term Plan for Achieving Water Quality Goals for the Everglades Protection Area Tributary Basins
December 2008 3
Figure 1-1. Locations of the Everglades Protection Area and Tributary Basins

2008 Report on the Long-Term Plan for Achieving Water Quality Goals for the Everglades Protection Area Tributary Basins
December 2008 4
As originally envisioned, the Everglades Construction Project was to consist of approximately 40,000 acres of effective treatment area3 of constructed wetlands distributed among six discrete STAs. The ECP has been expanded to a total of slightly more than 45,000 acres in recent years, and further expansion of the ECP is underway with the increased footprint being implemented expected to be approximately 56,500 acres of effective treatment area. Outflow total phosphorus (TP) concentrations from the STAs continue to improve following enhancements and recovery from the 2004-2005 hurricanes, averaging 26 ppb for Water Year 2008 (WY2008) (SFER 2009, in press). As a direct result of these significant water quality improvement strategies, TP loads to the EPA from the ECP Basins over the last five years have decreased 70% from the WY1979-1988 base period (SFER 2009, in press)4. In part due to the regional drought, WY2008 TP loads from the ECP Basins exhibited an 86% reduction from the WY1979-1988 base period (SFER 2009, in press). Since 1994, over 1,050 metric tons of TP have been removed by the STAs that otherwise would have entered the EPA.
TP loads from other tributary basins not addressed by the ECP (Non-ECP Basins, formerly referred to as the Everglades Stormwater Program) to the EPA over the last five years have decreased 25% from the WY1979-1988 base period (SFER 2009, in press). In part due to the regional drought, WY2008 TP loads from the Non-ECP Basins exhibited a 74% reduction from the WY1979-1988 base period (SFER 2009, in press).
Table 1-2 compares the actual water quality performance with the projected (2003) performance of the Pre-2006 Projects in the ECP Basins. The calendar year 2007 performance results reflect the influence of a number of notable antecedent events and conditions, including:
Regional drought conditions during 2007. During the regional drought it became difficult to find source water to maintain minimum depths in the treatment cells needed to keep the vegetation alive. The District was able to very effectively manage the available water through various operational strategies, however some of the treatment cells dried out. Once water became available and the vegetation was able to re-establish in these cells, they were then able to provide treatment again. The drought conditions also caused a delay in hydrating and bringing on line the initial STA expansion projects which resulted from a major revision to
3 A distinction is made between effective treatment area, which equates to acreage of treatment vegetation, and total area which includes canals, levees, control structures and all other areas that are not directly removing TP. Typically, the total area is about 15% larger than the effective treatment area. 4 It should be noted that discharges from the ECP Basins are not comprised entirely of EAA runoff; TP loads to the EPA from the EAA have been reduced by approximately 80% compared to the WY1979-1988 base period.

2008 Report on the Long-Term Plan for Achieving Water Quality Goals for the Everglades Protection Area Tributary Basins
December 2008 5
the 2003 Long-Term Plan. These additional treatment areas for STA-2 and STA-5, built concurrently with STA-6 Section 2, were flow-capable by December 2006, but start up and flow through of these areas was delayed by the regional drought conditions.
Vegetation conversion activities in 4 of the 6 STAs within the last 2-3 years. Phosphorus reduction may not be fully stabilized until 2-3 years following completion of vegetation conversion activities.
Prolonged impacts of the 2004 and 2005 hurricanes. Hurricane impacts in the fall of 2004
and 2005 substantively affected the vegetative communities and associated treatment
performance, and at least some portions of the STA system are still recovering.
Thus, a direct comparison between the projected performance and the actual performance for 2007
provides limited insight into the efficacy of the Pre-2006 Projects, as the above conditions were not
factors addressed by the analyses producing the projections included in the 2003 Long-Term Plan.
It is noted that design is underway on another 11,600+/- acres of effective treatment area with a
scheduled completion (flow-capable) of December 2010. As the STAs stabilize over time, and as
additional infrastructure modifications and refinements are accomplished, it is anticipated that the
phosphorus concentrations observed in the ECP discharges will continue to be reduced in the future.
Table 1-3 summarizes the comparison of the projected and actual water quality performance of
the Pre-2006 Projects in the Non-ECP Basins. Recognizing the limited timeframe encompassed
by the 2007 actual performance results, overall the actual TP loads from the Non-ECP basins
were slightly less than projected.

2008 Report on the Long-Term Plan for Achieving Water Quality Goals for the Everglades Protection Area Tributary Basins
December 2008 6
Table 1-2. Comparison of Projected and Actual Performance of Pre-2006 Projects in the ECP Basins, Including Source Controls, for 2007
Volume Volume TP Load FWM Volume TP Load FWMac-ft ac-ft metric tons ppb ac-ft metric tons ppb
Inflow 165,424 99,881 13.52 110 -65,543 -9.59 -3Outflow 175,000 3.31 - 5.30 15 - 24 88,720 2.28 21 -86,280 -2.02 1Inflow 160,300 93,718 20.12 174 -66,582 -7.29 35
Outflow 183,300 3.15 - 4.95 14 - 22 89,774 6.44 58 -93,526 2.39 40Inflow 212,400 135,663 17.62 105 -76,737 -8.55 5
Outflow 222,600 4.59 - 7.55 17 - 28 153,293 3.94 21 -69,307 -2.13 -2Inflow 633,700 189,483 18.51 79 -444,217 -42.23 1
Outflow 621,200 10.98 - 16.47 14 - 21 186,234 4.71 21 -434,966 -9.01 3Inflow 144,600 13,917 1.97 115 -130,683 -29.83 -64
Outflow 125,500 3.03 - 4.55 20 - 30 6,387 0.75 95 -119,113 -3.04 70Inflow 57,000 6,376 0.56 71 -50,624 -4.92 -7
Outflow 35,100 0.75 - 1.05 17 - 24 2,458 0.12 38 -32,642 -0.78 18Inflow 1,373,424 539,038 72.29 109 -834,386 -102.40 6
Outflow 1,362,700 25.80 - 39.87 15 - 24 526,865 18.23 28 -835,835 -14.61 9
STA-1E
STA-1W
STA-2
STA-3/4
STA-5
STA-678
60.74
27.40
23.10
26.17
31.80
5.48
ComparisonActual Performance January - December 2007
2003 Long-term Average Annual Projected Performance Beginning
January 1, 2007TP Load Flow-weighted
Mean (ppb)metric tons
STA
Total ECP174.7 103
Inflow or Outflow
113
139
100
78
178
Notes: “Long-term” was taken as that represented by a 31-year geometric mean based on model simulations. As applied in the 2003 Long-Term Plan, the geometric mean is computed as the geometric mean concentration of 7-day flow-weighted mean concentrations. The comparison of TP values is based on the actual 2007 FWM/load minus the average of the range of projected FWM/loads. Projected outflow TP ranges reflect uncertainty of STA performance modeling.
Table 1-3. Comparison of Projected and Actual Performance of Pre-2006 Projects in the Non-ECP Basins, Including Source Controls, for 2007
Volume Volume TP Load FWM Volume TP Load FWMac-ft ac-ft metric tons ppb ac-ft metric tons ppb
Acme Basin B 0 0 0.00 - 0 0.00 -
NSID 6,800 0 0.00 - -6,800 -0.29 -39
NNRC 0 0 0.00 - 0 0.00 0
C-11 West 18,300 124,671 2.50 16 106,371 2.01 -6
L-28 84,000 66,520 3.08 38 -17,480 -0.90 -1
Feeder Canal 77,000 23,700 3.08 105 -53,300 -1.68 55
186,100 214,891 8.67 33 28,791 -0.86 -9
BASIN
Total Non-ECP
TP Load Flow-weightedmetric tons Mean (ppb)
0.293
0.00
0.493
3.982
-
39
-
22
39
0.00
4.76 50
9.53 42
Comparison2003 Long-term Average Annual
Projected Performance Beginning January 1, 2007
Actual Performance January - December 2007
Notes: “Long-term” was taken as that represented by a 31-year geometric mean based on model simulations. “FWM” is the flow-weighted mean concentration of total phosphorus. The comparison of TP values is based on the actual 2007 FWM/load minus the average of the range of projected FWM/loads.

2008 Report on the Long-Term Plan for Achieving Water Quality Goals for the Everglades Protection Area Tributary Basins
December 2008 7
Several events occurred during the course of preparing this report that could impact the strategies
and projected improvements in water quality addressed in the Long-Term Plan, including the
following:
On May 15, 2008, the District Governing Board suspended construction of the EAA Storage
Reservoir due to a legal challenge to the construction permit issued by the U.S. Army Corps
of Engineers to the District under Section 404 of the Clean Water Act.
On June 24, 2008, the District and U.S. Sugar Corporation executed a statement of principles
initiating negotiations pursuant to which the District could acquire as much as 187,000 acres
of agricultural land located in and around the EAA that could be used for Everglades water
storage and water quality projects.
The draft Environmental Impact Statement for the Section 404 constructions permits for
Compartments B and C is undergoing revision based on public and agency comments and, as
a result, the anticipated issuance date is being pushed back.
On July 29, 2008, Judge Gold issued a ruling on the case styled Miccosukee Tribe of Indians
of Florida vs. United Sates of America Case No 04-21448-CIV-GOLD (S.D. Fla.), and an
appeal filed by the intervener is currently pending.
Planning will proceed with reliance on a strategy of adaptive implementation, in which all
scientifically defensible steps are to be expeditiously implemented but with ongoing refinements
expected to be necessary. In keeping with the adaptive implementation approach, future revisions
to the Long-Term Plan may be necessary as a result of the above events.

2008 Report on the Long-Term Plan for Achieving Water Quality Goals for the Everglades Protection Area Tributary Basins
December 2008 8
2. WATER QUALITY IMPROVEMENT STRATEGIES, ECP BASINS The central element of the regional long-term strategy for improving water quality in inflows into
the EPA from the Everglades Agricultural Area and adjoining basins is the design, construction,
and operation of the Everglades Construction Project (ECP), an extensive system of Stormwater
Treatment Areas (STAs) — constructed wetlands designed to reduce phosphorus in agricultural
and urban stormwater, and Lake Okeechobee releases to the south, prior to their entry into the
EPA. This section reports on activities designed to improve the water quality entering the
Everglades Protection Area from the ECP Basins. The following sections report on specific
water quality improvement strategies for the ECP Basins, including:
Phosphorus source control programs in the Everglades Agricultural Area (EAA) and C-139
basins, and
Structural, operational and vegetation management enhancements to the STAs.
2.1 Phosphorus Source Controls The effective control of total phosphorus (TP) loads in the upstream basins has been a
fundamental strategy in the comprehensive program to improve water quality entering the
EPA. The Everglades phosphorus source control program is a strategic priority under the
District’s Everglades Program (Van Horn et al. 2008). The Everglades Forever Act and the
Long-Term Plan outline District responsibilities and schedules to implement basin-specific
solutions to control phosphorus at the source. These solutions are implemented through both
regulatory and non-regulatory efforts in basins within the Everglades Construction Project
(ECP) area and areas outside of the original ECP area, known as non-ECP basins. The overall
source control strategy includes implementation of Best Management Practices (BMPs) for
phosphorus reduction, regulatory programs, voluntary programs, educational programs, and
integration with local and regional projects. The District implements, monitors, optimizes, and
reports on the progress of the source control strategy for each basin on an annual basis, and the
results are presented in the annual South Florida Environmental Report. The following
sections report on the source control programs in the ECP basins.
2.1.1 Everglades Agricultural Area
The EFA mandates specific performance levels for controlling phosphorus in discharges
from the ECP basins, specifically the EAA and C-139 basins (Van Horn et al. 2008). The

2008 Report on the Long-Term Plan for Achieving Water Quality Goals for the Everglades Protection Area Tributary Basins
December 2008 9
EAA and C-139 basins’ success indicators for meeting those performance levels are
outlined in District rules, Chapter 40E-63, F.A.C. For the EAA, the phosphorus load
reduction goal is an average of 25% compared to the base period (WY1980-1988). The
first year of compliance for the EAA was WY1996. The EAA continues to meet the
required performance levels of the EFA as evidenced by an average reduction in TP loads
of 52 percent over the past thirteen years, and maintenance of those historical reduction
levels is critical to continued success. Since WY1996, the BMP phosphorus control
program of the EAA has removed approximately 1,791 metric tons of phosphorus from
waters subsequently delivered to the EPA.
2.1.2 C-139 Basin The goal of the source control program in the C-139 Basin is to maintain TP loads at or
below historical levels (Van Horn et al. 2008). WY2008 marked the first year that the C-
139 Basin met the phosphorus load requirements required by the EFA and Ch. 40E-63,
F.A.C. (Rule 40E-63) since WY2003, the initial compliance year. Source control
activities for the C-139 Basin consist of mandatory BMPs which have been increased on
an annual basis based on achieving compliance with historical, pre-BMP phosphorus
levels (Van Horn et al., 2008). Because of non-compliance in prior years, a revision to
the BMP strategy implemented through the regulatory program prescribed by Rule 40E-
63 was initiated in 2006. The revision is to develop a more effective regulatory/BMP
program for optimization of farm-implemented BMPs using an adaptive implementation
strategy. This will require demonstration of optimized BMP implementation at the farm
level, and expansion of the mandated water quality monitoring program to upstream areas
(sub-regions), in order to determine the most effective BMPs and prioritized
implementation strategy.
2.1.3 C-139 Annex The C-139 Annex presently drains to the L-28 Borrow Canal at the north line of the Big
Cypress Seminole Indian Reservation. In December 2006, the infrastructure to divert all
runoff from the C-139 Annex to the L-3 drainage system for treatment in STA-6 was
completed. District staff continues to coordinate regulatory compliance requirements with
the landowner to implement a phosphorus source control strategy for diversion
discharges.

2008 Report on the Long-Term Plan for Achieving Water Quality Goals for the Everglades Protection Area Tributary Basins
December 2008 10
2.1.4 Ch. 298 Districts and Closter Farms Landowners in the EAA, working in concert with the District and other agencies, have
implemented effective strategies to reduce the discharge of phosphorus to Lake
Okeechobee (Van Horn et al. 2008). Stormwater runoff and seepage from four special
drainage districts established through Ch. 298 of the Florida Statutes (F.S.) and a
3,200(±) acre parcel along the southern rim of Lake Okeechobee historically discharged
directly to Lake Okeechobee. The four special drainage districts are:
1. East Beach Water Control District (EBWCD)
2. East Shore Water Control District (ESWCD)
3. South Shore Drainage District (SSDD)
4. South Florida Conservancy District, Unit 5 (SFCD)
The 3,200(±) acre state-owned parcel, also known as 715 Farms is leased to Closter
Farms, and is located adjacent to EBWCD and ESWCD. Historically, as for the
referenced 298 Districts, stormwaters from this parcel were pumped directly to Lake
Okeechobee.
As required by the Everglades Forever Act, diversion projects were completed between
2001 and 2005 to direct most of the flows from these five basins in the EAA to the south
for treatment in the STAs. The goal of the ECP diversion project for the Ch. 298
Districts/715 Farms was defined in the 1994 Conceptual Design for the Everglades
Protection Project (Burns & McDonnell 1994):
The primary objective of these modifications and improvements is to
reduce total phosphorus loads discharged directly to the Lake from these
areas by not less than 80 percent. … It is our understanding that
conceptual design is developed upon the basic premise that, on a long-
term average basis, 80 percent of the volume (and load) historically
discharged from these areas (after modifications to reflect the
implementation of Best Management Practices) is to be diverted to other
water bodies …

2008 Report on the Long-Term Plan for Achieving Water Quality Goals for the Everglades Protection Area Tributary Basins
December 2008 11
2.1.5 Acme Improvement District Basin B (Village of Wellington) Prior to construction of diversion facilities, stormwater runoff from Basin B of the
Village of Wellington’s Acme Improvement District was pumped directly into WCA-1.
Subsequent to the development of the 2003 Long-Term Plan, the Acme Basin B
Discharge CERP Project was added to the Long-Term Plan through an FDEP approved
revision. Changes to Acme’s internal conveyance system, coupled with the C-1 Canal
improvements and construction of a new pump station (ACME7 Pump Station) made
possible diversion of Basin B flows to STA-1E by way of the C-51 West Canal. These
improvements were completed by December 2006, and direct discharges from Acme
Basin B into WCA-1 have ceased (Van Horn et al. 2008). The water quality
improvement strategy for the Acme basin consists of a combination of ongoing training
and education initiatives, mandatory BMPs required by existing Village BMP ordinances,
additional water quality requirements in stormwater management system permit
conditions, and integration with the Acme Basin B Discharge CERP Project.
2.2 STA Enhancements and Expansion Part 2 of the 2003 Long-Term Plan contained recommended structural, vegetation and
operational enhancements for all six of the ECP STAs. These enhancements were completed
as recommended, and in some cases, further enhancements to the projects contained in the
2003 Long-Term Plan have been implemented. The treatment area of three STAs (STA-2,
STA-5 and STA-6) was expanded by a total of 5,274 acres. Within the treatment areas, STA
optimization efforts are continuing for all 6 STAs, including analyses and interpretation of
performance data, investigations of dry-out on treatment performance, analysis of optimal
depths for SAV, and evaluation of periphyton-based stormwater treatment areas (PSTAs) at
the STA-1E and STA-3/4 demonstration projects. The following sections summarize the
structural, vegetation, and operational enhancements completed in the STAs, and the
expansion of STA-2, STA-5 and STA-6.
2.2.1 STA-1E STA-1E is situated immediately east of the Arthur R. Marshall Loxahatchee National
Wildlife Refuge (WCA-1) and south of the C-51 West Canal. A schematic diagram of
STA-1E is presented in Figure 2-1. The primary source of inflow to this STA is the C-51
West Basin. In December 2006, Acme Basin B runoff was diverted from the
Loxahatchee National Wildlife Refuge to STA-1E.

2008 Report on the Long-Term Plan for Achieving Water Quality Goals for the Everglades Protection Area Tributary Basins
December 2008 12
Figure 2-1. Schematic of STA-1E
Cell 1Cell 5Cell 7
Cell 6
Cell 3
Cell 2Cell 4N
EDC
C-51 Canal
WDC
S-363A-C
S-365A-B
S-375
S-364A-C
S-367A-ES-374A-C S-371A-C
S-366A-ES-370A-CS-373A-B
L-8
Can
al
S-5AES-5A
G-311
S-372A-E
S-319
S-362
S-361
G-300
S-155A
S-376 Seepage Discharge Culvert
L-40 Canal
Cell 4S
S-368A-E
S-369A-D
WCA-1
N
Arthur R. Marshall Loxahatchee National
Wildlife Refuge
Not to Scale and drawings are approximations
Canals
Seepage Canals
Emergent Treatment Cell
SAV Treatment Cell
Upland/Other Area
Boat Ramp
Mixed Marsh
PSTA
Inflow
Treatment Flow
Outflow
Seepage Return Flow
Diversion Flow
Flow
Structures
Remotely Operated
Manually Operated
Pump Station
Features
Cell 1 556
Cell 2 552
Cell 3 589
Cell 4N 645
Cell 4S 752
Cell 5 571
Cell 6 1049
Cell 7 418
Total Eff. Area 5132
Treatment Cell Acreage
S-377 Seepage Divide Culvert
S-5AS
S-5AW
STA-1 Inflow Basin
Runoff from the C-51 West Basin is introduced to STA-1E through Pumping Station S-
319. Another source of inflow is a portion of the runoff from the S-5A Basin which is
introduced to STA-1E through the G-311 gated spillway located on the eastern boundary
of the STA-1 Inflow Basin. An additional source of inflow to STA-1E is runoff from the
Rustic Ranches subdivision; runoff from that area is introduced to STA-1E through
Pumping Station S-361, which also serves to return seepage to the STA. Discharges from
STA-1E are directed to WCA-1 through Pumping Station S-362.
The STA-1 Inflow Basin and associated water control structures permit the diversion and
redirection of inflows between STA-1E, STA-1W, the WCA-1 and the L-8 Canal to the
north. The synchronized operation of STA-1W, STA-1E and the structures in the STA-1
Inflow Basin allows redirection of flows in order to balance the phosphorus loading rate
among the STAs, and also whenever the discharge from Pumping Station S-5A exceeds
the hydraulic capacity of STA-1W. Runoff from the C-51 West Basin can be directed to
STA-1W through G-311 as well.

2008 Report on the Long-Term Plan for Achieving Water Quality Goals for the Everglades Protection Area Tributary Basins
December 2008 13
STA-1E provides a total effective treatment area of 5,132 acres, situated generally
between the C-51 West Canal (on the north) and WCA 1 (in the southwest), and west of
Flying Cow Road. In addition to treating inflows from the C-51 West Canal and the S-
5A Basin, other minor inflows include:
Supplemental water from Lake Okeechobee necessary to prevent dryout of the STA;
and
Runoff from the adjacent L-8 Basin until the L-8 Diversion project is completed.
STA-1E consists of three parallel flow paths, each developed with cells in series,
preceded by distribution cells located along and parallel to the C-51 West Canal. Those
distribution cells encompass 1,046 acres in addition to the 5,132 acres in the STA-1E
treatment cells. Following limited emergency operations associated with the 2004
hurricanes, the Central and Western flow-ways of STA-1E (Cells 3, 4N and 4S; and Cells
7, 5, and 6, respectively) began flow-through operations in September 2005.
The Eastern Flow-way (Cells 1 and 2), representing about 20% of the treatment area, is
on-line but remains under the control of the U. S. Army Corps of Engineers (USACE) for
a periphyton-based STA (PSTA) Demonstration project. The project is currently in the
startup phase and is anticipated to be operated over an 18-month period by the USACE
(T. Brown, pers. comm.). After completion of the PSTA project, test cell levees and
structures will be removed by the USACE to return the Eastern flow-way to full flow
capability. Until the Eastern flow-way has full flow capacity, inflows to STA-1E will be
restricted to avoid hydraulic and phosphorus overload of the remaining flow-ways.
In fulfillment of the public access and recreation requirements of the Everglades Forever
Act, and as further described in Ch. 373.1391(1)(a) and (b), Florida Statutes, recreational
facilities were proposed at each of the STAs. The recreational facilities were designed to
ensure compatibility with the restoration goals of the ECP and the water quality and
hydrological purposes of the STAs. The STA-1E recreational facilities, located along the
northern perimeter adjacent to the C-51 West Canal, are complete and open to the public.

2008 Report on the Long-Term Plan for Achieving Water Quality Goals for the Everglades Protection Area Tributary Basins
December 2008 14
2.2.2 STA-1W STA-1W and STA-1E are hydraulically connected through the STA-1 Inflow Basin,
situated adjacent to the extreme northerly end of the Arthur R. Marshall Loxahatchee
National Wildlife Refuge. As described in the prior section, the STA-1 Inflow Basin and
associated water control structures provide operational flexibility for distributing flows
between STA-1E, STA-1W, and WCA-1.
STA-1W is situated immediately west of the Arthur R. Marshall Loxahatchee National
Wildlife Refuge (WCA-1) and south of the L10/L12 (West Palm Beach) Canal. A
schematic diagram of STA-1W as it currently exists is shown in Figure 2-2. The primary
source of inflow to STA-1W is the S-5A Basin in the Everglades Agricultural Area. Runoff
from the S-5A Basin is lifted by Pumping Station S-5A to the STA-1 Inflow Basin.
Discharges from the Inflow Basin to STA-1W are made through Structure G-302, a gated
spillway in Levee L-7 (which forms the westerly perimeter of WCA-1). Discharges from
STA-1W are directed to WCA-1 through pumping stations G-251 and G-310.
Figure 2-2. Schematic of Existing STA-1W
WCA-1
S-5A
5B
G-327A
1
3
4
G-306A-J
G-308
G-251
G-255
N
Arthur R. Marshall Loxahatchee National
Wildlife RefugeG-259
L-40 Canal
2A
2B
5A
G-304A-J
G-305A
-V
G-248A-D
G-253A-J
1A
1B
G-249A-H
G-258
G-307
G-255
G-301
G-250SG-303
G-302
L-7 Canal
G310
G-300
G-254A-EA1-D1
CanalsSeepage Canals
Emergent Treatment Cell
SAV Treatment Cell
Upland/Other Area
Boat RampLimerock Berm
Inflow
Treatment Flow
Outflow
Seepage Return Flow
Diversion Flow
Flow
Cell 1A 745
Cell 1B 745
Cell 2A 471
Cell 2B 470
Cell 3 1026
Cell 4 358
Cell 5A 562
Cell 5B 2293
Total Eff. Area 6670
Treatment Cell Acreage
Remotely Operated
Manually Operated
Passive
Pump Station
Structures
Features
Not to Scale and drawings are approximations
G-327B
Discharge Canal
G-327C G-327D
G-309
STA-1 Inflow Basin

2008 Report on the Long-Term Plan for Achieving Water Quality Goals for the Everglades Protection Area Tributary Basins
December 2008 15
STA-1W provides a nominal treatment area of 6,670 acres, generally bounded by the
Ocean Canal (on the north) and Water Conservation Area 1 (on the east and south). STA-
1W can receive inflows from a number of tributary basins:
The EAA Basin via the S-5A pump station, including diversions from East Beach
Water Control District.
Outflow from the L-8 Basin that may be routed to the S-5A pump station.
Historically, these L-8 Basin outflows have at times included some Lake Okeechobee
releases during periods of excessively elevated lake stages, or portions of Lake
Okeechobee water supply releases.
The C-51W Basin via the S-319 and G-311 structures, and the STA-1 Inflow Basin,
including diverted waters from Acme Basin B.
STA-1W has three flow paths, each developed with cells in series. The northern path flows
through Cells 5A and 5B in a westerly direction and the eastern and western paths (Cells 1
through 4) flow in a southwesterly direction. Cells 1 through 4 comprise the original
Everglades Nutrient Removal (ENR) project. All cells were originally developed in
emergent vegetation except Cells 4 and 5B, which were developed in submerged aquatic
vegetation (SAV). Long-Term Plan recommended enhancements which have been
completed include compartmentalization of Cells 1 and 2, conversion of vegetation to SAV
in Cells 1B, 2B and 3, improved flow controls through remote operation of water control
structures, and the addition of a public recreation facility along the Ocean Canal and Cell
5B. Revision 2 to the Long-Term Plan included numerous structural improvements beyond
the Pre-2006 activities of the 2003 Long-Term Plan, including replacement of the discharge
structure from Cell 4 with a remotely operable structure, improvement in the canal and
marsh conveyance capacities, addition of remote operations capability at the inflow gates to
Cell 5, and removal of floating vegetative tussocks in Cell 2.
There have been several revisions to the Long-Term Plan consisting of projects designed
to improve the TP removal performance of STA-1W. In particular, one revision included
extensive rehabilitation activities within STA-1W, including drying out the Western flow-
way, removal of approximately 100,000 cubic yards of organic material, re-flooding,
vegetation enhancements, and associated maintenance activities.

2008 Report on the Long-Term Plan for Achieving Water Quality Goals for the Everglades Protection Area Tributary Basins
December 2008 16
2.2.3 STA-2 STA-2 currently provides a total effective treatment area of 8,240 acres (including the
recent expansion described herein), and is situated between the North New River Canal to
the west and Water Conservation Area 2A (WCA-2A) to the east. A schematic of STA-2
as it currently exists is shown in Figure 2-3. Roughly half of STA-2 is situated on the
former Brown’s Farm Wildlife Management Area. This stormwater treatment area treats
inflows from the Hillsboro Canal (via Pumping Station S-6) and an adjacent agricultural
area (via Pumping Station G-328). Those inflows are comprised of contributions from a
number of sources, including:
Agricultural runoff and discharges from the S-6/S-2 Basin;
A partial diversion of runoff from the S-5A Basin via the Ocean and Hillsboro
Canals;
Chapter 298 drainage districts situated on the easterly shore of Lake Okeechobee;
Supplemental (irrigation) water from Lake Okeechobee necessary to prevent dryout
of the STA;
Water supply releases from Lake Okeechobee meant for delivery to the Lower East
Coast.
Revision 2 to the Long-Term Plan included expansion of STA-2 to include Cell 4, with an
effective treatment area of approximately 1,902 acres. Cell 4 was flow-capable by
December 2006, and began flow-through operation in February 2008. With the addition
of Cell 4, STA-2 now contains four parallel flow paths, each with a southerly flow
direction. Cells 1 and 2 are at present populated primarily with emergent macrophytic
vegetative communities; Cells 3 and 4 are primarily submerged aquatic vegetation (SAV),
although there are vestiges of emergent vegetation (former Brown’s Farm Wildlife
Management Area, or WMA, lands) in the southeasterly corner Cell 3.
As recommended in the 2003 Long-Term Plan, a tracer study was conducted in STA-2
Cell 3 to achieve a better understanding of the hydraulics of the cell. The tracer study (DB
Environmental, Inc., 2004) demonstrated efficient hydraulics in STA-2 Cell 3 without
compartmentalization. In addition, the phosphorus removal performance with and without

2008 Report on the Long-Term Plan for Achieving Water Quality Goals for the Everglades Protection Area Tributary Basins
December 2008 17
Cell 3 compartmentalization was evaluated using DMSTA2 and the modeling results
indicated no improved phosphorus removal performance with the levee compared to
without the levee. For these reasons, and because Cell 3 has consistently been one of the
highest performing treatment cells, Revision 5 to the Long-Term Plan included approval to
not construct the internal levee in Cell 3.
Figure 2-3. Schematic of Existing STA-2
Cell 3 Cell 2 Cell 1
WCA-2A
G-330E-A
G-333E-A G-331G-A G-329D-A
G-332
S-6
G-339
G-337
G-336G
G-338
Hillsboro Canal
G-335
Canals
Seepage Canals
Emergent Treatment Cell
SAV Treatment Cell
Upland/Other Area
Boat Ramp
Flow
Structures
Remotely Operated
Manually Operated
Passive
Pump Station
Features
Inflow
Treatment Flow
Outflow
Seepage Return Flow
Diversion Flow
N
Not to Scale and drawings are approximations
Cell 1 1798
Cell 2 2270
Cell 3 2270
Cell 4 1902
Total Eff. Area 8240
Treatment Cell Acreage
G-328
G-334
Cell 4
G-367F-A
G-337A
G-3
36A
-F
L-6 Canal
G-368
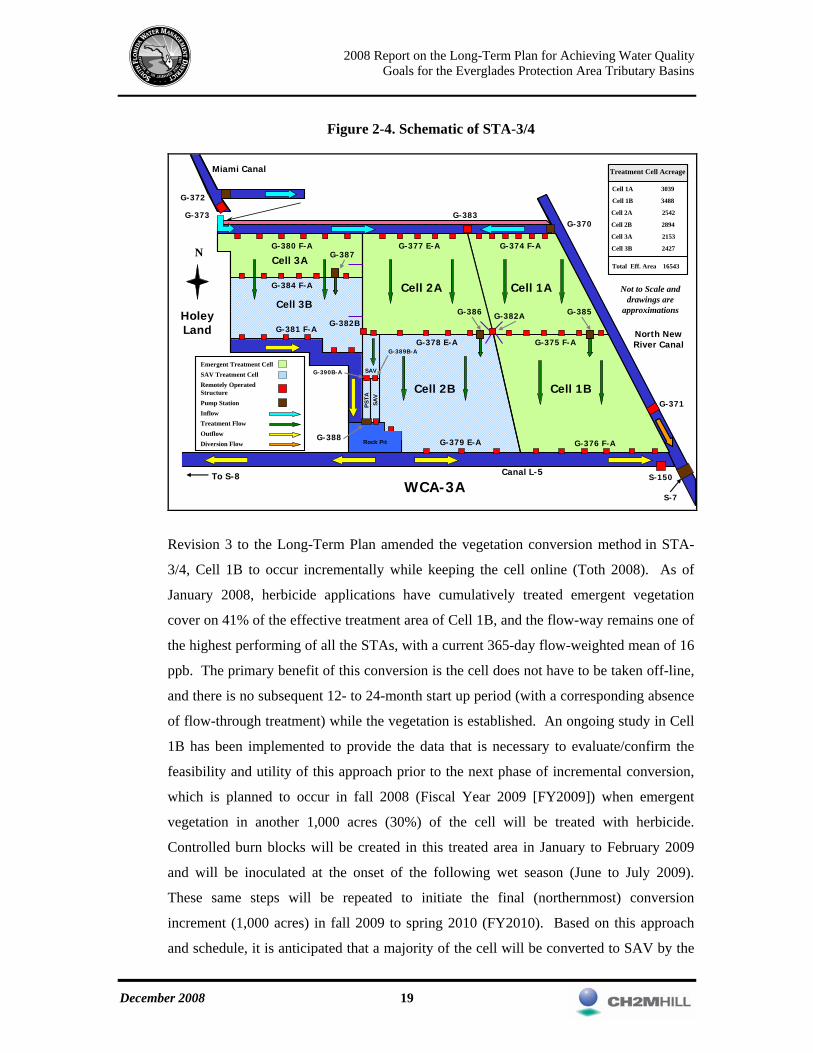
2.2.4 STA-3/4 STA-3/4 provides a total effective treatment area of 16,543 acres, situated generally
between U.S. Highway 27 (on the east) and the Holey Land Wildlife Management Area
(on the west), lying immediately north of the L-5 Borrow Canal. A schematic of STA-
3/4 is shown in Figure 2-4. The inflows to this STA are comprised of contributions from
a number of sources, including:
Agricultural runoff and discharges from the North New River Canal Basin (S-7/S-2
Basin) via Pump Station G370;

2008 Report on the Long-Term Plan for Achieving Water Quality Goals for the Everglades Protection Area Tributary Basins
December 2008 18
Agricultural runoff and discharges from the Miami Canal Basin (S-8/S-3 Basin) via
Pump Station G-372;
Lake Okeechobee. Anticipated inflows from Lake Okeechobee include:
• Regulatory releases to both the Miami Canal and North New River Canal;
• Best Management Practice (BMP) makeup water for both the Miami Canal and
North New River Canal basins;
• Supplemental (irrigation) water necessary to prevent dryout of the STA
(considered as delivered to the Miami Canal).
Agricultural runoff and discharges from the C-139 Basin (episodic inflows through
Structure G-136 and the L-1E Canal to the Miami Canal);
Pumping Station S-236 discharges to be diverted from Lake Okeechobee to the
Miami Canal for delivery to STA-3/4;
Storm runoff and discharges from the South Shore Drainage District, to be diverted
from Lake Okeechobee to the Miami Canal for delivery to STA-3/4.
STA-3/4 consists of three parallel flow paths. The most easterly flow path (Cells 1A and
1B in series) generally treats inflows from the North New River Canal. The two westerly
flow paths (Cells 2A and 2B in series, Cell 3A and 3B in series) generally treat inflows
from the Miami Canal.
STA-3/4 was originally developed in emergent macrophyte vegetation throughout its
effective treatment area. The construction sequence and methods employed during
construction of STA-3/4 were structured to promote maximum possible vegetative grow-
in and maturation as early as possible. STA enhancement activities recommended in the
2003 Long-Term Plan and now complete include compartmentalization of the western
flow-way, conversion of vegetation to SAV in two of the downstream cells (Cells 2B and
3B), installation of water supply pumps, and the addition of two public recreation
facilities.
2008 Report on the Long-Term Plan for Achieving Water Quality Goals for the Everglades Protection Area Tributary Basins
December 2008 19
Figure 2-4. Schematic of STA-3/4
Cell 3BCell 2A Cell 1A
Cell 2B Cell 1B
To S-8
Holey Land
G-374 F-A
G-375 F-A
G-377 E-A
G-378 E-A
G-376 F-AG-379 E-A
S-7WCA-3A
G-371
North New River Canal
G-380 F-A
G-381 F-A
G-370
G-372
G-382AG-382B
G-383
Canal L-5
Miami Canal
NCell 3A
G-384 F-A
SAVP
STA
SAV
Rock Pit
G-373
G-386 G-385
G-387
Cell 1A 3039
Cell 1B 3488
Cell 2A 2542
Cell 2B 2894
Cell 3A 2153
Cell 3B 2427
Total Eff. Area 16543
Treatment Cell Acreage
Emergent Treatment CellSAV Treatment CellRemotely Operated StructurePump StationInflowTreatment FlowOutflowDiversion Flow
S-150
G-388
G-389B-A
G-390B-A
Not to Scale and drawings are
approximations
Revision 3 to the Long-Term Plan amended the vegetation conversion method in STA-
3/4, Cell 1B to occur incrementally while keeping the cell online (Toth 2008). As of
January 2008, herbicide applications have cumulatively treated emergent vegetation
cover on 41% of the effective treatment area of Cell 1B, and the flow-way remains one of
the highest performing of all the STAs, with a current 365-day flow-weighted mean of 16
ppb. The primary benefit of this conversion is the cell does not have to be taken off-line,
and there is no subsequent 12- to 24-month start up period (with a corresponding absence
of flow-through treatment) while the vegetation is established. An ongoing study in Cell
1B has been implemented to provide the data that is necessary to evaluate/confirm the
feasibility and utility of this approach prior to the next phase of incremental conversion,
which is planned to occur in fall 2008 (Fiscal Year 2009 [FY2009]) when emergent
vegetation in another 1,000 acres (30%) of the cell will be treated with herbicide.
Controlled burn blocks will be created in this treated area in January to February 2009
and will be inoculated at the onset of the following wet season (June to July 2009).
These same steps will be repeated to initiate the final (northernmost) conversion
increment (1,000 acres) in fall 2009 to spring 2010 (FY2010). Based on this approach
and schedule, it is anticipated that a majority of the cell will be converted to SAV by the

2008 Report on the Long-Term Plan for Achieving Water Quality Goals for the Everglades Protection Area Tributary Basins
December 2008 20
end of 2011. The PSTA demonstration project was also constructed in Cell 2B as
recommended in the 2003 Long-Term Plan.
2.2.5 STA-5 STA-5 provides a total effective treatment area of 6,095 acres, situated generally on lands
between the L-2 Borrow Canal (on the west) and Rotenberger Wildlife Management Area
(on the east), immediately northeast of the confluence of the Deer Fence Canal with the
L-2/L-3 Borrow Canal. A schematic diagram of STA-5 as it currently exists is presented
in Figure 2-5. This stormwater treatment area is intended to treat inflows from the L-2/L-
3 Borrow Canal (via the G-342 structures). These inflows are comprised of contributions
from the following:
Agricultural runoff and discharges from the C-139 Basin (partial, see STA-6
discussion);
Supplemental (irrigation) water from Lake Okeechobee necessary to prevent
dryout of the STA.
Discharges to STA-5 may be directed either to the Miami Canal (through the STA-5
Discharge Canal along the north line of the Rotenberger Wildlife Management Area
[WMA]) or to the Rotenberger WMA itself. Discharges to the Rotenberger WMA via
Pump Station G-410 are for the purpose of hydrologic restoration of the (approx.)
29,000-acre WMA.
Long-Term Plan enhancements which have been completed include grading in the
northern two flow-ways to remove flow restrictions, conversion of vegetation to SAV in
the downstream Cell 2B, replacement and remote operation of water control structures
along the intermediate levees, and construction of an additional seepage return pump
station along the northern seepage canal. Revision 2 to the Long-Term Plan included the
addition of a third flow-way to STA-5 (Cells 3A and 3B consist of 1,985 acres of
effective treatment area) which is now complete and started flow-through operation in
August 2008. With the completion of the new third flow-way, STA-5 has three parallel
flow paths, each developed with two cells in series, and each with an easterly flow
direction. In 2008, the District conducted sediment removal in two miles of the L-2/L-3

2008 Report on the Long-Term Plan for Achieving Water Quality Goals for the Everglades Protection Area Tributary Basins
December 2008 21
Canal upstream of the inflow to STA-5, and in an additional 4.2 miles of inflow
distribution canals within the STA.
Figure 2-5. Schematic of Existing STA-5
Canal L-2
Deer Fence Canal
1A 1B
2A 2B
G-343A
G-343B
G-343C
G-343D
G-343E
G-343F
G-343G
G-343H
G-344B
G-344A
G-344C
G-344D
G-360B
G-342D
G-342C
G-342B
G-342A G-349A
G-410
G-349B
G-348
G-350B
G-406
To Miami
Canal
Inflow Treatment Flow Outflow Seepage Return
Rotenberger WMA
NG-507
G-345
3A 3BG-342E
G-342F G-344F
G-344E
Canal L-3
G-343I
G-343J
G-349C
Cell 1A 835
Cell 1B 1220
Cell 2A 835
Cell 2B 1220
Cell 3A 1002
Cell 3B 983
Total Eff. Area 6095
Treatment Cell Acreage
Emergent Treatment Cell SAV Treatment Cell
Manually Operated Structure
Remotely Operated Single-leaf Structure
Remotely Operated Double-leaf Structure
Pump Station
Not to Scale and drawings are approximations
2.2.6 STA-6
STA-6 currently provides a total effective treatment area of 2,257 acres, situated on lands
between the L-3 Borrow Canal (on the west) and Rotenberger Wildlife Management Area
(on the east), immediately north of the confluence of the L-3 and L-4 Borrow Canals. A
schematic diagram of STA-6 as it currently exists, including both Section 1 (Cells 3 and
5) and Section 2, is presented in Figure 2-6.

2008 Report on the Long-Term Plan for Achieving Water Quality Goals for the Everglades Protection Area Tributary Basins
December 2008 22
Figure 2-6. Schematic of STA-6
*Not to Scale
N
Canal L-4
Cell 3
Cell 5
Section 2
Canal L-3
G-607
G-603
G-393A
G-393B
G-393C
G-354C
G-354A
G-354B
G-407
G-353C
G-353B
G-351
G-396B
G-396A
G-352C
G-352B
G-352A
N
G-396C
G-602
G-601
G-600
USSC Pump
G-353A
Cell 3 245
Cell 5 625
Section 2 1387
Total Eff. Area 2257
Treatment Cell AcreageInflow
Treatment Flow
Outflow
Diversion Flow
Emergent Treatment Cell
SAV Treatment Cell
Remotely Operated Single-leaf Structure
Remotely Operated Double-leaf Structure
Passive Structure
Pump Station
Plug
C-139 Annex
Not to Scale and drawings are
approximations
Inflows to STA-6 are comprised of contributions from a number of sources, including:
Agricultural runoff and discharges from the C-139 Basin;
Stormwater runoff from the fallow lands comprising Compartment C located
between STA-5 and STA-6; and
Upon commencement of discharges, agricultural runoff from the USSC Southern
Division Ranch, Unit 1 (the “C-139 Annex”).
Long-Term Plan enhancements which are now complete include the addition of Section 2
with approximately 1,387 acres of effective treatment area, and improved flow control
with the addition of new inflow gates for Cells 3 and 5.

2008 Report on the Long-Term Plan for Achieving Water Quality Goals for the Everglades Protection Area Tributary Basins
December 2008 23
3. WATER QUALITY IMPROVEMENT STRATEGIES, NON-ECP
BASINS The Non-Everglades Construction Project (Non-ECP) Basins (formerly known as the Everglades
Stormwater Program Basins) are those basins discharging to the Everglades Protection Area from
areas outside of the Everglades Agricultural Area. The Non-ECP Basins currently addressed in
the Long-Term Plan are listed in Table 3-1; the overall boundaries of those basins are shown in
Figure 3-1.
Table 3-1. Non-ECP Basins Included in Long-Term Plan
Hydrologic Basin
North Springs Improvement District
North New River Canal
C-11 West
L-28
Feeder Canal
Since the development of the 2003 Long-Term Plan, Acme Basin B has been moved from the list
of Non-ECP Basins to the list of ECP Basins. Runoff from Acme Basin B was previously
directed to WCA-1. However, as part of Revision 4 to the Long-Term Plan5, diversion facilities
were constructed, such that discharges to WCA-1 were terminated in December 2006. Runoff
from Acme Basin B is now directed to the C-51 West Canal for treatment in STA-1E. The two
remaining Non-ECP Basins, the C-111 Basin and the Boynton Farms Basin, are being addressed
by other District and Federal programs.
5 Copies of all Revisions to the Long-Term Plan are available at the District’s Long-Term Plan website.

2008 Report on the Long-Term Plan for Achieving Water Quality Goals for the Everglades Protection Area Tributary Basins
December 2008 24
Figure 3-1. Non-ECP Basin Locations (Note: With the diversion of its runoff to C-51W, Acme Basin B is now an ECP Basin.)

2008 Report on the Long-Term Plan for Achieving Water Quality Goals for the Everglades Protection Area Tributary Basins
December 2008 25
Each of the Non-ECP basins is scheduled to receive one or more projects under CERP. In
general, the recommended strategy in the Non-ECP basins is to rely upon phosphorus source
controls and full integration with CERP to achieve water quality standards and the water quality
improvement goals of the Everglades Forever Act, to the extent that this is consistent with state
and federal authorization. Additional guidance for implementation of the recommended strategy
was provided by the Florida Legislature in its 2003 amendment of the Everglades Forever Act
(373.4592 F.S.), which states:
(c) It is the intent of the Legislature that implementation of the Long-Term Plan shall be
integrated and consistent with the implementation of the projects and activities in the
Congressionally authorized components of the CERP so that unnecessary and duplicative
costs will be avoided. Nothing in this section shall modify any existing cost share or
responsibility provided for projects listed in s. 528 of the Water Resources Development
Act of 1996 (110 Stat. 3769) or provided for projects listed in section 601 of the Water
Resources Development Act of 2000 (114 Stat. 2572). The Legislature does not intend for
the provisions of this section to diminish commitments made by the State of Florida to
restore and maintain water quality in the Everglades Protection Area, including the
federal lands in the settlement agreement referenced in paragraph (4)(e).
A combination of phosphorus source controls, local government and private water control and
conservation programs, and integration with Comprehensive Everglades Restoration Plan (CERP)
projects form the foundation for water quality improvements in the Non-ECP Basins.
3.1 North Springs Improvement District (NSID) Basin The NSID Basin covers an area of approximately 7,400 acres (11 square miles) in northern
Broward County. The basin is bounded on the north by the Palm Beach County line and on
the west by the L-36 North (L-36N) Borrow Canal and Water Conservation Area (WCA) 2A.
The Sawgrass Expressway (Florida Highway 869) runs in an east-west direction through the
basin, turning south along the basin’s western border as it approaches WCA-2A. The City of
Coral Springs comprises much of the southern half of the basin. The City of Parkland
comprises much of the northern half of the basin. A map illustrating the boundaries of the
NSID Basin is presented in Figure 3-2.

2008 Report on the Long-Term Plan for Achieving Water Quality Goals for the Everglades Protection Area Tributary Basins
December 2008 26
Land use in the NSID Basin consists primarily of urban residential development. Most of the
land in the southern half of the basin is heavily developed with residential subdivisions. The
northern portion of the basin is currently in the process of being converted from agricultural
to urban land use as new residential development continues. It is expected that most of the
remaining undeveloped agricultural land in the basin will be developed into urban residential
land use in the near future.
Drainage from the NSID Basin is managed in a network of interconnected lakes and canals
that are operated by the NSID to provide flood protection throughout the basin. Two
pumping stations, NSID Pump Station No. 1 (NSID1) and NSID Pump Station No. 2
(NSID2), are used to discharge stormwater north through the L-36N Borrow Canal and then
into the Hillsboro Canal through a series of culverts (S-39A). The Hillsboro Canal conveys
stormwater to the east, eventually discharging excess flow to tide. However, when the L-36N
Canal and the Hillsboro Canal are not capable of accepting additional flow, water from the
NSID Basin is discharged into WCA-2A through NSID1. The primary phosphorus reduction
strategy for the NSID is to minimize pumping to the WCA. Starting in WY2001, operation of
the NSID1 structure has adhered to the operational criteria set forth in the NSID
Environmental Resource Permit (ERP). The ERP requires that flows be pumped by NSID1 to
the WCA-2A only when the NSID basin stage reaches a certain elevation or when capacity is
not available in the Hillsboro Canal to discharge to tide. Because of this operational BMP,
the discharge flow volumes at NSID1 to WCA-2A have been significantly reduced since
WY2001, when compared to previous water years. Also, while the land use in the northern
sections of the basin has changed from agricultural to residential land use in the last few
years, TP concentrations have dropped significantly, from a flow-weighted mean of 48 ppb
for WY1995-WY2000 to 18 ppb for the one event that occurred during the period WY2001-
2008.
It should be noted that NSID1 is not under the control of the District and therefore it is not
included in the set of structures that fall under the District’s permitting requirement of the
Everglades Forever Act (Ch. 373.4592(9)(k)). However, the District is utilizing its ERP
program to effect implementation of phosphorus source controls in the NSID Basin.

2008 Report on the Long-Term Plan for Achieving Water Quality Goals for the Everglades Protection Area Tributary Basins
December 2008 27
Figure 3-2. North Springs Improvement District Basin Map

2008 Report on the Long-Term Plan for Achieving Water Quality Goals for the Everglades Protection Area Tributary Basins
December 2008 28
As recommended in the 2003 Long-Term Plan, the District assisted Broward County in
coordinating a county-wide working group to develop a comprehensive pollution prevention
plan with specific water quality goals and milestones. This group, called the Broward
Everglades Working Group (BEWG) includes the District, Broward County, the Cities of
Pembroke Pines, Cooper City, Sunrise, Weston Plantation, Parkland and Coral Springs,
the Towns of Davie and Southwest Ranches, the South Broward Drainage District the
Central Broward Water Control District, the Indian Trace Development District, the
Bonaventure Development District, the North Springs Improvement District, the
Plantation Acres Improvement District, and the Old Plantation Water Control District, the
Florida Department of Agriculture and Consumer Services, the Broward Farm Bureau,
the Florida Nurseries, Growers and Landscapers Association, the equine community,
Miccosukee Tribe of Indians of Florida, and Broward Audubon. The working group has
met at least twelve times over the past four years. NSID Basin stakeholders participate in this
working group and the ERP process will require the development of a comprehensive
pollution prevention plan for this basin.
The January 3, 2007, Long-Term Plan Revision provided additional source control funding
through FY 2010 for this basin. The District has been using these funds for educational
activities to ensure awareness and proper implementation of pollutant source control practices
and to provide public outreach in partnership with Broward County.
Also as recommended in the 2003 Long-Term Plan, the District hired a consultant to perform
a hydraulic evaluation of storm events in the basin to determine if there would be any
negative impacts from redirecting water currently discharged to WCA-2A to the Hillsboro
Canal east of S-39. This evaluation was completed in July 2004. In formulating the
assumptions for the evaluation, it was determined through coordination with the CERP
project delivery team that the Site 1 Impoundment (aka Fran Reich Preserve) CERP Project’s
design does not include impoundment storage capacity reserved for storm event flows from
NSID, and therefore cannot be depended on for flood protection purposes. The
hydraulic/hydrologic evaluation, based on a single event analysis, therefore excluded flow
into the impoundment and predicted the water elevations in the Hillsboro Canal would
increase under these circumstances during large storm events.

2008 Report on the Long-Term Plan for Achieving Water Quality Goals for the Everglades Protection Area Tributary Basins
December 2008 29
The District performed further analysis through a second consultant contract to evaluate
potential mitigation measures and to estimate the 50-year present value cost associated with
such alternatives. This evaluation, completed in October 2005, estimated conceptual costs in
2006 dollars for improvements for conveyance to the canals and the G-56 tidal structure at
almost $17 million. Alternatively, costs for an impoundment site were estimated to be
between $57 million and $133 million depending largely on land acquisition costs. The
expenditure for these mitigation measures is considered to be infeasible and impractical
considering the relatively small TP load estimated to be diverted from the EPA. During a
large storm event, the existing NSID system may be required to discharge to the EPA to
avoid flooding impacts in the Hillsboro Canal basin.
3.2 North New River Canal (NNRC) Basin The North New River Canal Basin (NNRC Basin) covers an area of approximately
19,000 acres (30 square miles) in eastern Broward County. The basin is located southeast of
WCA-2B, west of the Florida Turnpike and north of Interstate 595. The NNRC Basin is
located immediately to the north of the C-11 West Basin, separated from that basin by the
North New River Canal which runs generally east-west along the southern boundary of the
basin. A map of the NNRC Basin is presented in Figure 3-3.
Land use in the NNRC Basin is almost entirely urban residential and commercial
development. Portions of the Cities of Sunrise and Plantation comprise the area of the basin
north of the North New River Canal. Bonaventure, a densely developed commercial and
residential area, makes up the small area located south of the North New River Canal. Small
amounts of agricultural and undeveloped land still exist. Land values in the basin continue to
rise as development continues. The G-123 structure, located at SR 27 and I-595, discharges
water from this basin to WCA-3A. This structure is mainly used for water supply to WCA-
3A and is not intended to be used for flood control. However, during large storm events,
when storage is available in the water conservation areas, G-123 may be turned on to provide
some relief. For flood control purposes, this basin is primarily served by the G-54 structure
located just west of the turnpike. This structure allows stormwater outflows from the basin to
the east for subsequent discharge to tide.

2008 Report on the Long-Term Plan for Achieving Water Quality Goals for the Everglades Protection Area Tributary Basins
December 2008 30
Figure 3-3. North New River Canal Basin Map
NNRC Basin stakeholders have participated in the Broward Everglades Working Group
described in the previous section. The District has worked cooperatively with all local water
control districts in this basin to implement operational changes that either reduce their
discharges or provide additional water quality treatment prior to discharge. In addition, the
District and Broward County have implemented public outreach and education activities in
this basin targeting pollutant reduction at the source.
The January 3, 2007, Long-Term Plan Revision (Revision 6) provided additional source
control funding, through FY 2010, for this basin. The District has been using these funds for
educational activities to ensure awareness and proper implementation of pollutant source
control practices and to provide public outreach in partnership with Broward County.

2008 Report on the Long-Term Plan for Achieving Water Quality Goals for the Everglades Protection Area Tributary Basins
December 2008 31
Revision 6 also recommended to include in ERP requirements the implementation of
appropriate source control programs (i.e., Best Management Practices or BMPs) to achieve
water quality goals.
Revision 6 also included revision of the operational strategy for this basin. The strategy
approved by FDEP in Revision 6 was to discontinue the use of G-123, other than as may be
absolutely necessary for water supply or flood protection emergencies, until completion of
the WCA-2 and WCA-3 Diversion CERP Project. The revised operating strategy has been
highly effective, with only one year that required discharge since WY2003, resulting in a
decrease in the average annual TP load from 375 kg/yr for WY1995-WY2002 to 8 kg/yr for
WY2003-WY2008.
3.3 C-11 West Basin The C-11 West Basin covers an area of approximately 46,000 acres (72 square miles) in
south-central Broward County. Current water management activities in the basin provide
flood protection, drainage, water supply, protection from saltwater intrusion and seepage
collection from WCA-3A. The four primary canals in the basin are the C-11 West, the C-11
South, the L-37 Borrow Canal, and the section of the L-33 Borrow Canal between the C-11
West Canal and Pines Boulevard. A map of the C-11 West Basin is presented in Figure 3-4.
Currently, stormwater runoff from the C-11 West Basin is pumped into WCA-3A through the
District’s S-9 pump station. Seepage flows from WCA-3A historically were also returned
through the S-9 pump station. The S-9A pump structure directly adjacent to S-9 became
operational in early 2003, and a divide structure (S-381) was completed in early 2005 (C-11
West Critical Project). These new facilities allowed improvements to the operation of the
water management system by separating and returning seepage water with less phosphorus to
WCA-3A via S-9A, thereby decreasing the pumping frequency at the larger S-9 structure.
Gated culvert structure 13AW (S-13AW), located at the east end of the C-11 West Canal (or
about 10 miles east of S-9) operates as a basin divide structure and assists in maintaining
optimum water control stages in the C-11 Canal and passes dry season releases to the area
east of the structure (i.e., C-11 East Basin, which drains to tide). The structure is remotely
operated to maintain optimum headwater stages in the C-11 Canal.

2008 Report on the Long-Term Plan for Achieving Water Quality Goals for the Everglades Protection Area Tributary Basins
December 2008 32
Figure 3-4. C-11W Basin Map

2008 Report on the Long-Term Plan for Achieving Water Quality Goals for the Everglades Protection Area Tributary Basins
December 2008 33
There has been extensive water quality monitoring at the original S-9 pump station, the
primary discharge structure from the C-11 West Basin. During the limited period since the S-
9A and S-381 structures have been in place, flows, TP loads, and TP concentrations in
discharges from the S-9 and S-9A structures (also known as the S-9 Complex) to WCA-3A
have been reduced, as shown in Table 3-2.
Table 3-2. Comparison of Discharges from the S-9 Complex
Time Volume TP Load TP ConcPeriod ac-ft kg ppb
WY1995-2003 251,982 5,525 17.8WY2004-2008 172,272 3,493 16.4
Differences -79,710 -2,031 -1.3
The Broward Everglades Working Group (described in the sections above) has developed a
document titled “Broward County C-11 West Basin Pollution Reduction Action Plan” in
April 2006. The District will assist Broward County and all stakeholders in the
implementation of the action plan for the C-11 West Basin.
Revision 6 to the Long-Term Plan, dated January 3, 2007, provided additional source control
funding, through FY 2010, for this basin. The District has been using these funds for
educational activities to ensure awareness and proper implementation of pollutant source
control practices and to provide public outreach in partnership with Broward County. This
Long-Term Plan Revision also recommended including in ERP requirements the
implementation of appropriate source control programs (i.e., BMPs) to achieve water quality
goals.
3.4 L-28 Basin The L-28 Basin covers an area of about 72,000 acres (113 square miles). It is located west of
WCA-3A and south of the Everglades Agricultural Area at the northeast corner of the Big
Cypress National Preserve in Broward, Hendry and Collier Counties. A map of the L-28
Basin is presented in Figure 3-5. The L-28 Basin is entirely occupied by four landowners.
The C-139 Annex (approximately 25% of the basin) is comprised of the U.S. Sugar
Corporation’s Southern Division Ranch, Unit 1. The Seminole Tribe’s Big Cypress
Reservation occupies approximately 34% of the basin. Approximately 28% of the basin is

2008 Report on the Long-Term Plan for Achieving Water Quality Goals for the Everglades Protection Area Tributary Basins
December 2008 34
situated in the Miccosukee Indian Reservation. The remaining 13% of the basin is within the
Big Cypress National Preserve.
The surface water management system in the L-28 Basin provides drainage and flood
protection in addition to providing water to WCA-3A when necessary for water supply
purposes. The L-28 Borrow Canal is the primary drainage canal, running north/south for a
distance of approximately 10 miles along the eastern border of the basin. The L-28 Borrow
Canal conveys stormwater runoff to the S-140 pump station which discharges it directly into
WCA-3A. The S-140 pump station has three pumps with a combined pumping capacity of
1,300 cubic feet per second (cfs). The nominal capacity of S-140 was established to provide
an average removal rate from the L-28 Basin of 7/16 inch per day. The L-28 Interceptor
Canal, which borders the basin on the southwest, conveys discharges from the S-190
Structure (Feeder Canal Basin) to WCA-3A and is separated from the L-28 Basin by a levee.
Wetland and agricultural land uses account for approximately 96 percent of the basin area.
L-28 Basin Demonstration Project. At the request of the Miccosukee Tribe, the District is
funding a demonstration project that will result in reduced drainage of the triangle area of the
L-28 Canal Basin south of I-75. The project is scheduled for construction by the end of 2010.
Diversion of Flows from the C-139 Annex. The C-139 Annex presently drains to the L-28
Borrow Canal at the north line of the Big Cypress Seminole Indian Reservation. In December
2006, the infrastructure to divert all runoff from the C-139 Annex to STA-6 was completed
and once the operation permit is issued, runoff from that area will be diverted to STA-6.
Upon diversion, the total area of the L-28 Basin will be effectively reduced to approximately
53,000 acres.

2008 Report on the Long-Term Plan for Achieving Water Quality Goals for the Everglades Protection Area Tributary Basins
December 2008 35
Figure 3-5. L-28 Basin Map

2008 Report on the Long-Term Plan for Achieving Water Quality Goals for the Everglades Protection Area Tributary Basins
December 2008 36
3.5 Feeder Canal Basin The Feeder Canal Basin covers an area of about 72,000 acres (113 square miles) in
southeastern Hendry County. It is located west of WCA-3A, southwest of the Everglades
Agricultural Area, and north of the Big Cypress National Preserve. A portion of the Big
Cypress Seminole Indian Reservation (approximately 13,500 acres) is located in the southeast
corner of the basin. A map of the Feeder Canal Basin is presented in Figure 3-6. Flow-
weighted mean TP concentrations for this basin (measured at S-190) over the period
encompassing WY1998-WY2008 averaged 117 ppb.
Phosphorus Source Controls. As recommended by the 2003 Long-Term Plan, the District
implemented a BMP grant program, for implementation of source controls, or BMPs, for the
basin in partnership with Natural Resources Conservation Service (NRCS), the Florida
Department of Agriculture and Consumer Services (FDACS), and the Hendry Soil and Water
Conservation District. Approximately $500,000 was awarded by the District to fund projects
within the Feeder Canal Basin. Revisions 6 and 10 of the Long Term Plan (dated January 3
and December 10, 2007, respectively) recommended additional funding in FY 2007 through
FY 2010 for the continued implementation of source controls. Because of the increased
trends in phosphorus in discharges from this basin, the District initiated a regional study that
incorporates an evaluation of water quality and hydrology. These investigations remain
ongoing.
Integrated Permit Compliance Initiative. As recommended by Revision 6 of the Long
Term Plan (dated January 3, 2007), the District initiated an integrated regulatory compliance
program applicable to all landowners throughout the basin. This program includes ensuring
compliance with existing permits including ERPs, Surface Water Management Permits, and
Consumptive Use Permits (CUPs). These permits have the potential to affect water quality
and quantity and compliance with permit conditions is essential for a holistic approach to
reducing phosphorus loads discharging from the basin. This initiative also includes
requirements to implement BMPs to reduce phosphorus in discharges.

2008 Report on the Long-Term Plan for Achieving Water Quality Goals for the Everglades Protection Area Tributary Basins
December 2008 37
Figure 3-6. Feeder Canal Basin Map

2008 Report on the Long-Term Plan for Achieving Water Quality Goals for the Everglades Protection Area Tributary Basins
December 2008 38
4. PROCESS DEVELOPMENT AND ENGINEERING (PDE) The Process Development and Engineering (PDE) component of the Long-Term Plan is a central
element of the overall strategy for achieving water quality goals for the Everglades Protection
Area. It is founded on the following premises:
Achieving long-term water quality goals will involve an adaptive management approach,
whereby the best available information is used to develop and implement incremental
improvement measures
Continued engineering evaluations are necessary to increase certainty in the predicted
benefits of implementing refined stormwater BMPs and/or treatment technologies
Significant technical and economic benefits can be realized by integrating Everglades water
quality performance measures with CERP projects, even to the extent that existing schedules
should be re-evaluated in some basins and synchronized with CERP project schedules.
Ongoing engineering and scientific investigations by the District and others engaged in
Everglades Restoration since the time of development of the 2003 Long-Term Plan have provided
valuable information which has supported refinements to the estimated performance of the water
quality improvement strategies for both the ECP and non-ECP basins. In the 2003 Long-Term
Plan, substantive focus regarding the ECP Basins was directed toward understanding the
ramifications of converting portions of the macrophyte-based STAs to SAV-based systems; many
of the PDE elements were directed toward SAV-related issues and included:
Enhancing the control and monitoring of water quality improvement measures now in place;
Continuing improvement in analytical and forecasting tools used to project treatment
performance;
Identifying specific methods to optimize SAV performance; and
Improving the reliability of treatment facility inflow volumes and pollutant loads.
The following report sections provide brief overviews of progress made under each of these
major activity categories.

2008 Report on the Long-Term Plan for Achieving Water Quality Goals for the Everglades Protection Area Tributary Basins
December 2008 39
4.1 Enhanced Control and Monitoring In the 2003 Long-Term Plan, commitment was made to conduct activities needed to improve
upon the District’s ability to quantify inflows and phosphorus loadings to the STAs in the
Everglades Agricultural Area. Activities conducted are summarized in Table 4-1.
Table 4-1. Activities Conducted Supporting Enhanced Control and Monitoring of STA Inflows and Outflows
Activity Work Completed
Acquisition of Survey Data Collection of additional topographic surveys within the STAs to more clearly delineate ground surface elevations between interior levees and control structures, and to confirm gage datum elevations at flow measurement stations.
Additional Flow and Water Quality Monitoring Stations
Installation of new flow and water quality monitoring stations for some STAs to provide supplemental data supporting STA performance evaluations and optimization planning.
Review/Correction of Flow Measurement Anomalies
Loading calculation accuracy is dependent on good flow measurements. Over the past 5 years, inflow and outflow measurement sites were checked to confirm accuracy.
Analysis and Interpretation Adaptive implementation of monitoring and analysis activities supporting interpretation of STA performance has occurred, and several modifications to the originally proposed monitoring programs have been approved by the FDEP through Revisions to the Long-Term Plan.
Update/Maintenance of Hydraulic Models
Two-dimensional hydraulic models of the various STAs have been developed and maintained using Long-Term Plan funding.
STA Operations Optimization Tools A set of worksheet-based tools are being used on a week to week basis to support guidance recommendations to Operations staff regarding STA inflows (hydraulic and phosphorus loadings) to each cell in each STA.
4.2 Improved Analytical and Forecasting Tools Among the process development and engineering elements of the Long-Term Plan, one of the
most critically needed activities has been continued development and refinement of the
analytical tools necessary for increased confidence in:

2008 Report on the Long-Term Plan for Achieving Water Quality Goals for the Everglades Protection Area Tributary Basins
December 2008 40
Predicting the water quality improvement performance of the STAs.
Predicting the influence of upstream storage reservoirs (in particular, the EAA Storage
Reservoirs) on water quality in reservoir discharges, particularly to the STAs.
Activities conducted since 2003 under this activity category are summarized in Table 4-2.
Table 4-2. Activities Conducted Supporting Improved Analytical or Forecasting Tools
Activity Work Completed
Continued Development and Refinement of DMSTA
Refinements to the DMSTA model have been made by Dr. William Walker. District staff have worked closely with Dr. William Walker in compiling technical data needed for model calibrations, refinements, etc.
Water Quality Impacts of Reservoirs District staff assisted in provision of water quality data for lakes and similar water bodies. These data were used by Dr. Walker in calibration of DMSTA to address reservoir effects.
Periphyton-Based Stormwater Treatment Area (PSTA) Investigations
District designed, constructed, and is operating its PSTA demonstration site within the footprint of STA-3/4, Cell 2B.
4.3 Optimizing STA Performance The 2003 Long-Term Plan included a number of PDE activities focused on better
understanding how SAV systems could be used to improve on STA treatment performance.
Evaluations focused on vegetation management issues, and assessment of the potential
benefits of hydraulic improvements through use of internal levees/berms. Additionally,
studies addressing internal measurements of physical, chemical, and biological factors related
to treatment performance were included. The status of each of these activities is briefly
described in Table 4-3. The originally included activities were focused on optimizing SAV
integration into STA-2. However, lessons learned over the past several years have
transcended specific STA boundaries; the notes provided are more broadly focused on these
topics in relation to performance enhancements for any of the applicable STAs.

2008 Report on the Long-Term Plan for Achieving Water Quality Goals for the Everglades Protection Area Tributary Basins
December 2008 41
Table 4-3. Activities Conducted Related to Optimizing STA Performance
Activity Work Completed
Operational Strategy A focused investigation was conducted by the District addressing SAV-based STA treatment performance in relation to operational depths and dry-out conditions. Study results supported development of preliminary operational guidelines for SAV systems.
Strategies for Vegetation Management
Original investigations were focused on managing vegetation systems to achieve the SAV-dominated conditions in selected downstream cells within some STAs. Studies now include methods for controlling non-desirable vegetation and/or animal species as well as implementing and documenting methods for encouraging vegetative community changes to achieve the desired composition.
Hydrologic/Hydraulic Assessment The 2003 Long-Term Plan placed heavy emphasis on evaluating the treatment benefits of STA cell compartmentalization or alternative means of improving hydraulic flow through these constructed wetlands. Tracer studies were performed in two STAs. One key study confirmed that STA-2, Cell 3 did not require compartmentalization; good sheet flow existed. Good treatment performance in STA-2, Cell 1, also indicates that the originally proposed internal levee is not needed.
Internal Measurements Over the past 5 years, the District has conducted supplemental internal measurements of flow, water quality, sediment conditions, or biological conditions during the course of performing other routine monitoring or special studies.
Comparative Analysis This analysis was intended to address the pre- vs. post-levee installation treatment performance in STA-2. In that the internal levee for Cell 3 is not needed, no before and after comparative analysis of the tracer study data is needed.
4.4 Additional Structural and Operational Measures In the 2003 Long-Term Plan, investigations were described of additional structural and
operational measures that could theoretically improve the treatment performance of the STAs
within their existing or currently proposed footprints. At the time, investigations were
focused on the relative merits of addition of limerock berms within STA cells as a means of
providing intermediate hydraulic flow equilibration and also achieving some phosphorus
removal. The results of those investigations were inconclusive. Some water quality

2008 Report on the Long-Term Plan for Achieving Water Quality Goals for the Everglades Protection Area Tributary Basins
December 2008 42
improvements were suggested by the monitoring records, but a clear cause and effect
relationship was not evident. The berm construction materials and methods led to subsequent
hydraulic problems that subsequently required berm removal. No definitive benefits were
shown and no further investment toward this form of structural hydraulic modification is
planned.
4.5 Improved Reliability of Inflow Forecasts Treatment performance evaluations are conducted annually as an element of the SFER
preparation process. Clearly, reliability of the inflow information is crucial in terms of
affects on the quality of the evaluations of performance to date as well as projection of future
performance as affected by predicted inflow and phosphorus loading. For these reasons,
periodic re-assessment of inflow information is needed, and this PDE activity has been
maintained since 2003. The status of each of these activities is summarized in Table 4-4.
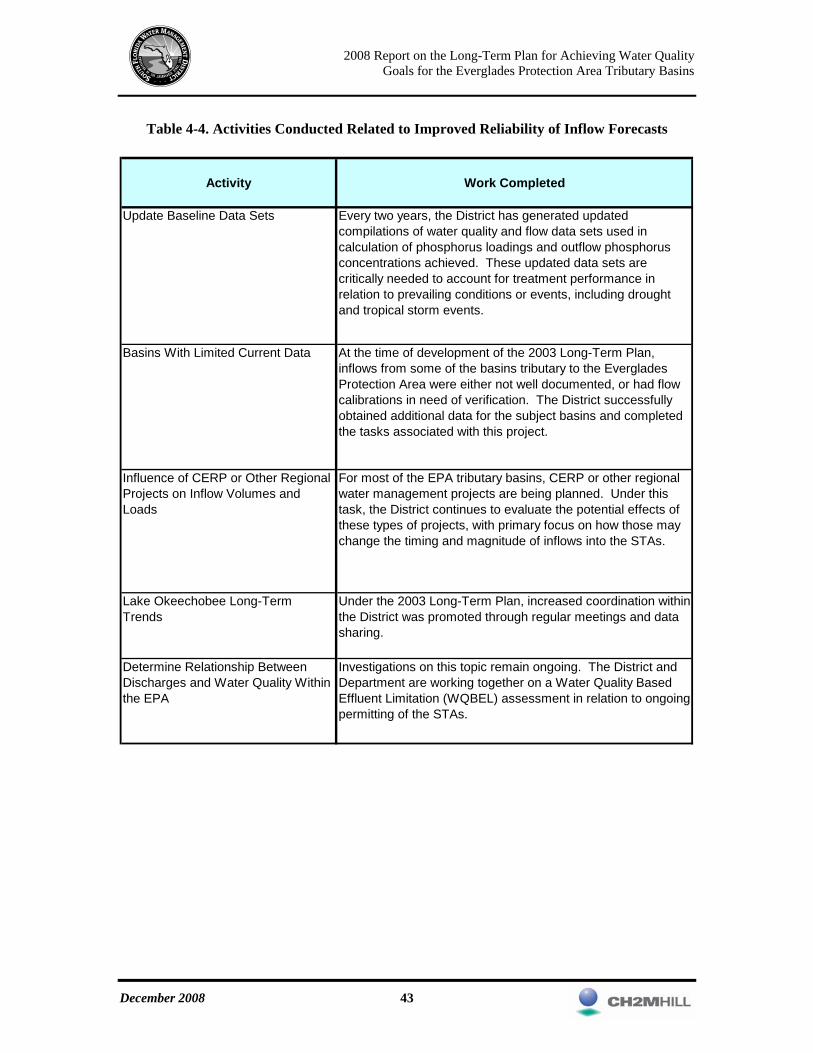
2008 Report on the Long-Term Plan for Achieving Water Quality Goals for the Everglades Protection Area Tributary Basins
December 2008 43
Table 4-4. Activities Conducted Related to Improved Reliability of Inflow Forecasts
Activity Work Completed
Update Baseline Data Sets Every two years, the District has generated updated compilations of water quality and flow data sets used in calculation of phosphorus loadings and outflow phosphorus concentrations achieved. These updated data sets are critically needed to account for treatment performance in relation to prevailing conditions or events, including drought and tropical storm events.
Basins With Limited Current Data At the time of development of the 2003 Long-Term Plan, inflows from some of the basins tributary to the Everglades Protection Area were either not well documented, or had flow calibrations in need of verification. The District successfully obtained additional data for the subject basins and completed the tasks associated with this project.
Influence of CERP or Other Regional Projects on Inflow Volumes and Loads
For most of the EPA tributary basins, CERP or other regional water management projects are being planned. Under this task, the District continues to evaluate the potential effects of these types of projects, with primary focus on how those may change the timing and magnitude of inflows into the STAs.
Lake Okeechobee Long-Term Trends
Under the 2003 Long-Term Plan, increased coordination within the District was promoted through regular meetings and data sharing.
Determine Relationship Between Discharges and Water Quality Within the EPA
Investigations on this topic remain ongoing. The District and Department are working together on a Water Quality Based Effluent Limitation (WQBEL) assessment in relation to ongoing permitting of the STAs.

2008 Report on the Long-Term Plan for Achieving Water Quality Goals for the Everglades Protection Area Tributary Basins
December 2008 44
5. RECOVERY OF IMPACTED AREAS WITHIN THE EPA Hydropattern restoration components for STA outflow distribution along the northern boundaries
of WCA-2A and WCA-3A were included in the original Everglades Construction Project (ECP)
plans developed in the mid 1990s. Those components were to promote recovery of the remnant
Everglades marsh habitats further down gradient within the EPA by installing new infrastructure
that would support broader distribution of inflows along this boundary and restore sheetflow
through more of the wetlands. Additionally, the Everglades Forever Act of 1994 included
provisions that called for use of ECP treated waters to help rehydrate portions of the historical
Everglades system contained within two other state-owned land areas, the Rotenberger Wildlife
Management Area and the Holey Land Wildlife Management Area. The District’s collaborative
efforts with the Florida Department of Environmental Protection (FDEP) and Florida Fish and
Wildlife Conservation Commission (FFWCC) on hydroperiod restoration strategies for these two
areas have spanned over 25 years, and continue now as an element of the Long-Term Plan.
The hydrologic basis of a number of the projects included in the Comprehensive Everglades
Restoration Plan (CERP) is founded on the premise that the ECP infrastructure is complete and
fully operational, and that the District’s source control and BMP efforts in both the ECP and the
Non-ECP basins are effective in achieving water quality goals for the tributary basins. Water
quality improvement measures for the ECP and Non-ECP basins, and hydropattern restoration
measures for the northern EPA must be completed successfully and in a timely fashion in order
for future integration of Long-Term Plan regional water management actions with those to be
planned and implemented in accordance with CERP.
Implementation of hydropattern restoration actions originally envisioned under the ECP thus far
has been limited to discharge of STA-2 outflows to portions of the northwestern boundary of
WCA-2A, and limited use of STA-5 outflows to support hydroperiod management in the
Rotenberger WMA. The FDEP authorized inflows of STA-2 treated waters to areas within
WCA-2A where soil total phosphorus (TP) concentrations exceed the 500 mg/kg guidance value
used by the Department for differentiating impacted vs. unimpacted Everglades wetlands. The
existing STA-2 outflows to WCA-2A were approved by all regulatory and resource management
agencies, and have been ongoing since 2001.
The results of the District’s ecological monitoring activities in the northwestern margin of WCA-
2A in areas believed most influenced by those STA outflows were summarized in Garrett and

2008 Report on the Long-Term Plan for Achieving Water Quality Goals for the Everglades Protection Area Tributary Basins
December 2008 45
Ivanoff (2008). The monitoring results thus far are not considered conclusive, but the preliminary
findings have shown no adverse ecological impacts and in fact indicate that the marsh receiving
these STA outflows has shown slight improvements for several ecological measures.
Indications of improved conditions cited include:
Increased hydroperiod
Decreased surface water phosphorus concentrations
Steady soil TP concentrations
Decreased nutrient content in periphyton tissues
Garrett and Ivanoff (2008) concluded that “These positive trends are numerous and should
outweigh any negative impacts (i.e., potential cattail expansion and increases in SO4 levels within
the discharge area)”. While these results remain preliminary, they are supportive of proceeding
with further planning for future implementation of additional hydropattern restoration
improvements along the northern EPA borders.
With regard to hydroperiod management for the Rotenberger WMA, Pump Station G-410 and a
spreader swale were installed by the District to allow water delivery from the STA-5 outflow
canal to the northwestern margin of the Rotenberger tract if water was needed to hydrate the
wetland system. Four outflow culverts (G-402A-D) installed on the eastern margin of the tract
provide some degree of WMA stage management through release of any excess water to the
Miami Canal. In accordance with provisions of the STA-5 discharge permit (No. 0131842), the
District monitored downstream receiving areas in the Rotenberger WMA in order to assess
ecological effects of STA water discharge.
Pre-discharge monitoring occurred from November 1997 through June 2001 during which the
only water delivery was through direct rainfall. The monitoring records documented the
overdrained condition:
“…the system had no standing water much of the year, resulting in a shortened
hydroperiod that promoted the growth of several species indicative of drier
habitats. Data collected during this period support that the RWMA was an
impacted wetland trending toward an upland area and that changes in operation
and management of this area were needed to ensure the protection of this area’s
natural resource value.” (Newman et al. 2004).

2008 Report on the Long-Term Plan for Achieving Water Quality Goals for the Everglades Protection Area Tributary Basins
December 2008 46
Post-discharge monitoring (July 2001 through June 2003) documented an increase in
hydroperiod, from 3 to 7 months, and a doubling of the mean water depth from 0.4 ft during the
pre-discharge period to 0.8 ft during the post-discharge period. The conclusion was that STA
treated waters supported “…hydropattern restoration, most likely increasing soil moisture and
decreasing the possibility of soil loss through muck fires. Furthermore, this increased
hydroperiod during the post-discharge period resulted in the increase of obligate wetland species
such as cattail (Typha spp.) and sawgrass.” (Newman et al. 2004).
5.1 Development of Planning and Analytical Tools The proposed accelerated recovery or hydropattern restoration works would redistribute flow
to areas along the northern edge of portions of the EPA, some of which have not previously
received surface water inflows bearing phosphorus. Prior to performing detailed planning,
design, and construction of the infrastructure required to accomplish the STA outflow
diversions and inflow distribution systems to support this rehydration or restoration goal, the
following issues need to be fully evaluated:
The degree to which discharges from the stormwater treatment areas comply with water
quality goals;
The potential impact of the relocated discharges on previously impacted or unimpacted
areas (as defined using the 500 mg/kg value defining “impacted areas” in the Everglades
Phosphorus Water Quality Standard (62-302.540 F.S.));
The extent to which modification of the discharge patterns will promote the recovery of
previously impacted areas (e.g., areas downstream of the current point discharges);
The downstream consequences of adding “clean” water to areas that have soil TP levels
in excess of the 500 mg/kg guidance concentration; and
The compatibility of the proposed design and operation with other long-term changes to
the regional hydrography (e.g., CERP).
These information or analytical needs provided the basis for inclusion in the 2003 Long-Term
Plan of the following action items:
Development and calibration of a recovery model

2008 Report on the Long-Term Plan for Achieving Water Quality Goals for the Everglades Protection Area Tributary Basins
December 2008 47
Assessment of the downstream influence of adding “clean” water to previously impacted
areas
Evaluation of options for accelerating the recovery of previously impacted areas
Progress made on these action items is summarized in Table 5-1.
Table 5-1. Activities Conducted Related to Development of Planning and Analytical Tools for Evaluating Accelerated Recovery and/or Hydropattern Restoration Alternatives for the
Northern Everglades Protection Area
Activity Work Completed
Recovery Model Development and Calibration
Long-Term Plan funding has supported development and refinement of the Everglades Landscape Model (ELM) and RSM. Both models continue to undergo refinements and were not available for use at the time of developing this 2008 Report. It is possible that one or both will be used in analysis of the likely response of downstream wetland systems to new inflows of water.
Downstream Influences of Adding Clean Water to Previously Impacted Areas
Studies completed to date have not led to conclusive results. The District is funding a Soil Reflux Study to help address this key issue.
Options for Accelerating Recovery As noted above, model development is not yet complete requiring deferral of detailed evaluation of accelerated recovery options. However, the District has made some progress by facilitating a comprehensive review of accelerated recovery strategies (2005 science and technology workshop). The workshop results helped crystallize a plan of study focused on the potential use of managed fire to promote habitat diversity restoration, and recreation of more natural ecological processes in such managed areas. This Fire Project research remains ongoing.
Alternatives Analysis and Plan Formulation
The analytical tools and research needed to support a quantitative alternatives analysis are not yet available.

2008 Report on the Long-Term Plan for Achieving Water Quality Goals for the Everglades Protection Area Tributary Basins
December 2008 48
5.2 Hydropattern Restoration Works Hydropattern restoration efforts in the form of the following efforts are underway:
STA-2, Cells 1 – 4 Outflow Deliveries to WCA-2A via the G-336 Structures and a
Degraded Section of Levee L-6
STA-5 Outflow Deliveries to the Rotenberger Wildlife Management Area via the G-410
Pump Station
As already detailed above, monitoring studies to date have generally indicated favorable
ecological system responses to these inflows. Detailed investigations remain underway to
continue to monitor these downstream receiving wetland areas.

2008 Report on the Long-Term Plan for Achieving Water Quality Goals for the Everglades Protection Area Tributary Basins
December 2008 49
6. SUMMARY This document summarizes progress achieved in execution of the many activities included in the
2003 Long-Term Plan. In many respects, work conducted over the past 5 years has far exceeded
the original expectations. For example, major increases in STA system footprint have occurred
well in advance of what was originally viewed as recommended, and conversion of significant
portions of the macrophyte-based STAs to SAV systems has been achieved successfully in spite
of the major disturbances of the hurricane seasons of 2004 and 2005 followed by the severe
drought conditions that have prevailed in the region in 2006, 2007, and much of 2008. This
period of STA operations has been extremely instructive in management of these large systems
following significant hurricane disturbances, and periods of both hydraulic and phosphorus
overload and dry out. Considering the range of operational challenges that have been imposed on
the STA system during periods of start up, recovery, and stabilization, it is significant that the
treatment performance of the various STAs appears to be measurably improving with time and as
the District learns how to optimize system operations.
The Long-Term Plan remains a dynamic document likely to require frequent and substantive
updates as new information becomes available. Through a continued collaborative approach to
issues evaluation, the District will continue its leadership role in achievement of water quality
goals for the Everglades Protection Area.

2008 Report on the Long-Term Plan for Achieving Water Quality Goals for the Everglades Protection Area Tributary Basins
December 2008 50
7. REFERENCES Brown, T. 2008. Personal communication; e-mail dated March 3, 2008.
Burns & McDonnell. 1994. Conceptual Design for the Everglades Protection Project.
Prepared for South Florida Water Management District, West Palm Beach, Florida. February
1994.
Burns & McDonnell. 2003. Everglades Protection Area Tributary Basins Long-Term Plan for
Achieving Water Quality Goals. Prepared for South Florida Water Management District, West
Palm Beach, Florida. October 2003.
Garrett, B. and D. Ivanoff. 2008. Hydropattern Restoration in Water Conservation Area 2A.
January 28, 2008.
SFER. 2009 (In press). South Florida Environmental Report, Volume I: The South Florida
Environment. South Florida Water Management District, West Palm Beach, Florida; and Florida
Department of Environmental Protection, Tallahassee, Florida.
Toth, L. 2008. Personal Communication.
Van Horn, S. (editor), C. Adorisio, C. Bedregal, J. Gomez and J. Madden. 2008. Phosphorus
Source Controls for the Basins Tributary to the Everglades Protection Area. Chapter 4 In 2008
South Florida Environmental Report, Volume I: The South Florida Environment. South Florida
Water Management District, West Palm Beach, Florida; and Florida Department of
Environmental Protection, Tallahassee, Florida.