south dakota mathematics standards 9-12doe.sd.gov/contentstandards/documents/math/9-12mat… ·...
TRANSCRIPT

SOUTH DAKOTA MATHEMATICS STANDARDS 9-12
At the high school level, the set of core standards and performance descriptors for each for the five content strands are presented first. These are followed by a separate set of advanced standards for each strand. Advanced standards are indicated by the letter “A” following the standard’s reference number (e.g., 9-12.A.2.1A meaning high school algebra indicator 2 standard 1 advanced). The advanced standards are followed by tables that summarize both the core and advance high school standards for each area. All graduates of South Dakota schools are expected to achieve the core standards. Advanced standards are not intended to apply to all high school students. Advanced standards are intended to apply to students having achieved the core mathematics standards and are more advanced than first-year algebra and basic geometry. Not every student will choose to enroll in advanced mathematics curriculum; some students do not choose to take more than core mathematics requirements. Students who plan to attend post-secondary educational institutions should complete mathematics courses reflected in the advanced standards. Taking rigorous mathematics courses will be important to success in post-secondary educational studies.

Core High School Algebra
Grade Standards, Supporting Skills, and Examples
Indicator 1: Use procedures to transform algebraic expressions.
Bloom’s Taxonomy Level Standard, Supporting Skills, and Examples
(Comprehension)
9-12.A.1.1. Students are able to write equivalent forms of algebraic expressions using properties of the set of real numbers.
Example: Simplify )27(2)5(3 xx −−+
Example: Express as the product of two binomials.
1) 342 ++ xx
2) 92 −x
• Evaluate algebraic expressions.
Example: Evaluate zyx
25 2− when 2=x , 3=y , 4=z .
• Use laws of exponents.
Example: Simplify )4(
])2[(22
3332
zyxzyx .
• Use conventional order of operations, including grouping and exponents.
Example: Simplify 2)2(3 −xx + 25x .
Indicator 2: Use a variety of algebraic concepts and methods to solve equations and inequalities.
Bloom’s Taxonomy Level Standard, Supporting Skills, and Examples
(Comprehension) 9-12.A.2.1. Students are able to use algebraic properties to transform multi-step, single-variable, first-degree equations.
Example: Solve )12(3 +− x = 3)1(2 +−x
(Application)
9-12.A.2.2. Students are able to use algebraic properties to transform multi-step, single-variable, first-degree inequalities and represent solutions using a number line.
Example: Solve and graph the solution 4)23(26 <+− x .

Indicator 3: Interpret and develop mathematical models. Bloom’s Taxonomy
Level Standard, Supporting Skills, and Examples
(Application)
9-12.A.3.1. Students are able to create linear models to represent problem situations.
Example: What equation would model total distance traveled over a period of time at a rate of 60 mph?
• Calculate and interpret slope.
Example: A telephone bill is $10 per month plus $0.30 per minute for long distance calls. Write an equation in slope-intercept form )( bmxy += that expresses the total amount of the phone bill.
(Comprehension)
9-12.A.3.2. Students are able to distinguish between linear and nonlinear models.
Example: Distinguish between td 60= and 2
21 gtd = .
Example: Which model represents a linear relationship?
a) b)
c) d)

Indicator 4: Describe and use properties and behaviors of relations, functions, and inverses.
Bloom’s Taxonomy Level Standard, Supporting Skills, and Examples
(Application)
9-12.A.4.1. Students are able to use graphs, tables, and equations to represent linear functions.
Examples:
1) Create a table from the graph or equation of a line.
2) Graph a linear equation in the form bmxy += .
3) Write an equation of a line that passes through the points (3, 2) and (-1, 5).
Core High School Algebra Performance Descriptors
Advanced
High school students performing at the advanced level: • transform algebraic expressions; • solve quadratic equations; • solve a system of linear equations.
Proficient
High school students performing at the proficient level: • transform polynomial expressions using real number properties; • solve single variable linear equations with integral coefficients; • graph linear equations; • interpret tables, graphs, and charts to solve problems; • create a linear model from a problem context.
Basic
High school students performing at the basic level: • transform linear expressions with integral coefficients using real
number properties; • solve linear equations of the form cbax =+ , where a, b, and c
are integers; • recognize the graph of a linear equation; • graph a line from a table of values.

Core High School Geometry Grade Standards, Supporting Skills, and Examples
Indicator 1: Use deductive and inductive reasoning to recognize and apply properties of geometric figures.
Bloom’s Taxonomy Level Standard, Supporting Skills, and Examples
(Application)
9-12.G.1.1. Students are able to apply the properties of triangles and quadrilaterals to find unknown parts.
Example: If the length of the hypotenuse of a 30°-60°-90° triangle is 10, what is the length of the shorter leg?
Example: Consider the triangle with degree measures shown:
1) Find the value of x. 2) Find the measure of each angle.
Example: Which of the following is not a parallelogram? a) b)
c) d)
4x3x
5x

5 3
7
6
4
8
3.5
7.5
5.5
4.57.5
10.5 7.54
10
(Application)
9-12.G.1.2. Students are able to identify and apply relationships among triangles.
Example: If the ratio of the sides of two similar triangles is 3 to 5, what is the ratio of their areas?
• Definitions and postulates
Example: Which of the following is not an isosceles triangle? a) b)
c) d)
• Similarity theorems
Example: Which triangle is similar to the one with sides 3, 5 and 7?
a) b) c) d)

• Congruence theorems
Example: In the following figure, which triangle congruence theorem can be used to prove the two triangles congruent?
a) SSS b) SAS c) AAS d) ASA e) None of these
Indicator 2: Use properties of geometric figures to solve problems from a variety of perspectives. Bloom’s Taxonomy
Level Standard, Supporting Skills, and Examples
(Analysis)
9-12.G.2.1. Students are able to recognize the relationship between a three-dimensional figure and its two-dimensional representation.
Example: Which of the following will fold into a cube?
a) b) c) d)
Example: Which of the following will not fold into a pyramid?
(Note: All triangles in each net are congruent.)
a) b) c) d)
• Interpret floor plans
• Follow instructions for assembly of a product, e.g., “some assembly required.”

l
(-3, 4)
l
(-1, 4)
l
(3, 4)
l
(5, 4)
l
(1, 6)
(Application)
9-12.G.2.2. Students are able to reflect across vertical or horizontal lines, and translate two-dimensional figures.
Example: Which of the following is the image if the letter K shown in the diagram below is reflected across line l, then translated two units to the right?
Original figure:
(a) (b) (c) (d)

x
y
A
B
C
(image)
(0,0)
(4,3)
(4,0)
4
326 x
12
F
E
C
B DA
• Identify lines of symmetry.
Example: How many lines of symmetry does this rectangle have?
a) 1 b) 2 c) 3 d) 4
• Use the coordinate plane.
Example: Triangle ABC is shown below. What transformation was performed if the pre-image of triangle ABC has coordinates of (0,0), (4,-3), and (4, 0)?
a) rotation about the origin b) reflection across the x-axis c) dilation by a factor of -1 d) reflection across the y-axis
(Application)
9-12.G.2.3. Students are able to use proportions to solve problems.
Example: Using the height and shadow length of a student and the length of a shadow of a building, find the building’s height.
Example: Given triangle ABC is similar to triangle DEF, what is the value of x?
a) 4 b) 9 c)16 d)12

Core High School Geometry Performance Descriptors
Advanced
High school students performing at the advanced level: • translate and reflect a figure using the coordinate plane; • supply a missing reason and/or statement in a deductive proof.
Proficient
High school students performing at the proficient level: • use deductive reasoning and known properties of a geometric
figure to find other properties; • use proportions to solve problems; • translate or reflect a simple figure using the coordinate plane; • match a two-dimensional drawing to its three-dimensional
counterpart.
Basic
High school students performing at the basic level: • identify a translation or reflection; • solve a proportion.

Core High School Measurement Grade Standards, Supporting Skills, and Examples
Indicator 1: Apply measurement concepts in practical applications.
Bloom’s Taxonomy Level Standard, Supporting Skills, and Examples
(Comprehension)
9-12.M.1.1. Students are able to choose appropriate unit label, scale, and precision.
Examples: 1) Which would be the best unit of measure for the volume of a
pitcher - cubic centimeters, cubic yards, or pounds?
2) The radius of a circle is 1.30 cm. Which is the most reasonable approximation for its circumference?
a) 8.2 cm b) 8 cm c) 8.16814 cm d) 8.1610899 cm
3) In determining the area of a flower garden, an unreasonable answer is:
a) 25.8 square feet b) 26 square feet c) 26.5 square feet d) 26.5278394 square feet
• Determine appropriate scales for histograms, scatterplots, and other graphs.
(Comprehension)
9-12.M.1.2. Students are able to use suitable units when describing rate of change.
Examples: 1) Find the average change in temperature in degrees per hour.
2) In 1903, there were 20,000 people in South Dakota. The population of South Dakota today is about 700,000. What units would describe the average rate of change in the population?
(Application)
9-12.M.1.3. Students are able to use formulas to find perimeter, circumference, and area to solve problems involving common geometric figures.
Examples: 1) Find the radius of a circle that has an area of 100 π square units.
2) Given points (3,1), (6,1), and (4,6), sketch the triangle and find its area.
• Use algebraic expressions with geometric formulas.
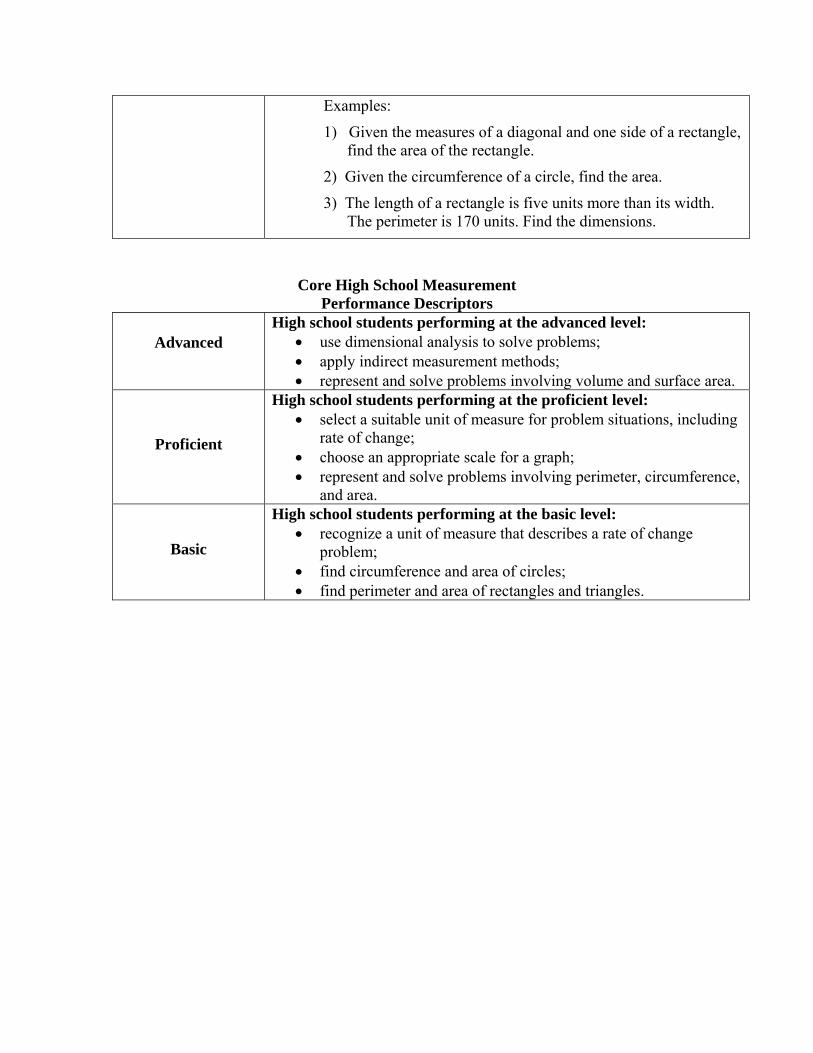
Examples:
1) Given the measures of a diagonal and one side of a rectangle, find the area of the rectangle.
2) Given the circumference of a circle, find the area.
3) The length of a rectangle is five units more than its width. The perimeter is 170 units. Find the dimensions.
Core High School Measurement Performance Descriptors
Advanced
High school students performing at the advanced level: • use dimensional analysis to solve problems; • apply indirect measurement methods; • represent and solve problems involving volume and surface area.
Proficient
High school students performing at the proficient level: • select a suitable unit of measure for problem situations, including
rate of change; • choose an appropriate scale for a graph; • represent and solve problems involving perimeter, circumference,
and area.
Basic
High school students performing at the basic level: • recognize a unit of measure that describes a rate of change
problem; • find circumference and area of circles; • find perimeter and area of rectangles and triangles.

Core High School Number Sense Grade Standards, Supporting Skills, and Examples
Indicator 1: Analyze the structural characteristics of the real number system and its various subsystems. Analyze the concept of value, magnitude, and relative magnitude of real numbers.
Bloom’s Taxonomy Level Standard, Supporting Skills, and Examples
(Comprehension)
9-12.N.1.1. Students are able to identify multiple representations of a real number.
Example: Which of the following does not represent the same number?
a) 44 c) 30
b) 56 − d) 00
• Given a real number identify the subset(s) of real numbers to
which it belongs.
Example: Which of the following is an integer?
a) 74 b)
104 c)
24 d)
34
−
Example: Which of the following is a rational number?
a) 2 2 b) π c) 4 d) 5.121221222 …
• Represent rational and irrational numbers in different forms.
Example: Write the decimal 0.757575… as a fraction in lowest terms.
(Comprehension)
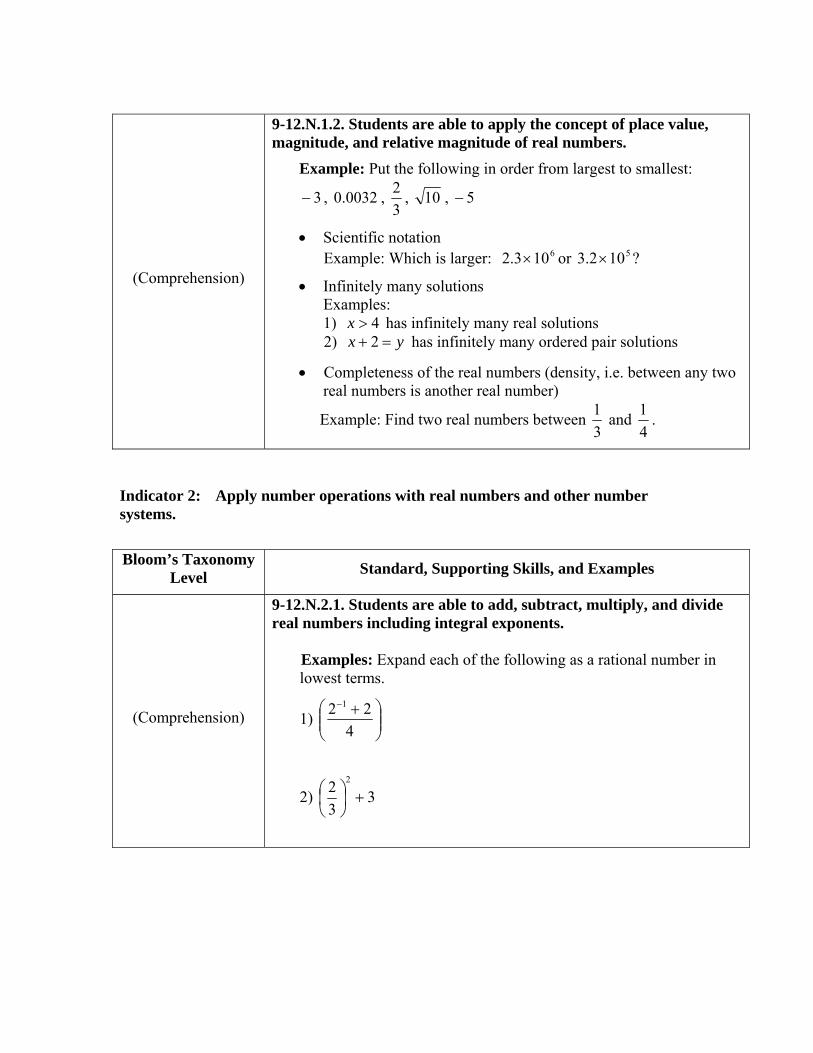
9-12.N.1.2. Students are able to apply the concept of place value, magnitude, and relative magnitude of real numbers.
Example: Put the following in order from largest to smallest:
3− , 0032.0 , 32 , 10 , 5−
• Scientific notation Example: Which is larger: 6103.2 × or 5102.3 × ?
• Infinitely many solutions Examples: 1) 4>x has infinitely many real solutions 2) yx =+ 2 has infinitely many ordered pair solutions
• Completeness of the real numbers (density, i.e. between any two real numbers is another real number)
Example: Find two real numbers between 31 and
41 .
Indicator 2: Apply number operations with real numbers and other number systems.
Bloom’s Taxonomy Level Standard, Supporting Skills, and Examples
(Comprehension)
9-12.N.2.1. Students are able to add, subtract, multiply, and divide real numbers including integral exponents.
Examples: Expand each of the following as a rational number in lowest terms.
1) ⎟⎟⎠
⎞⎜⎜⎝
⎛ +−
422 1
2) 332 2
+⎟⎠⎞
⎜⎝⎛

Indicator 3: Develop conjectures, predictions, or estimations to solve problems and verify or justify the results.
Bloom’s Taxonomy Level Standard, Supporting Skills, and Examples
(Analysis)
9-12.N.3.1. Students are able to use estimation strategies in problem situations to predict results and to check the reasonableness of results.
Examples: 1) When traveling at 72 miles per hour, is it possible to travel 350
miles in 2 hours?
2) At a salary of $210 per month, is the annual income about $24,000?
• Use rounding as an estimation strategy.
Examples: 1) Given the diameter of a circle is 9.8 inches, estimate its
circumference.
2) The cost of shelving is 7 cents per inch. Estimate the cost of 48 inches of shelving.
3) The length of a rectangle is 4.25 cm and the width is 2.95 cm. Approximately what is the perimeter?
• Use non-routine estimation strategies.
Examples: 1) Approximately how many cubic centimeters are in a gallon of
milk? (Students might solve this by guessing how many cubic centimeter cubes would fill the jug or by estimating the cubic centimeters in a quart.)
2) Approximate the area of an irregular shape drawn on a grid by counting the squares.
3) Explain how to find the surface area of your hand.
(Comprehension)
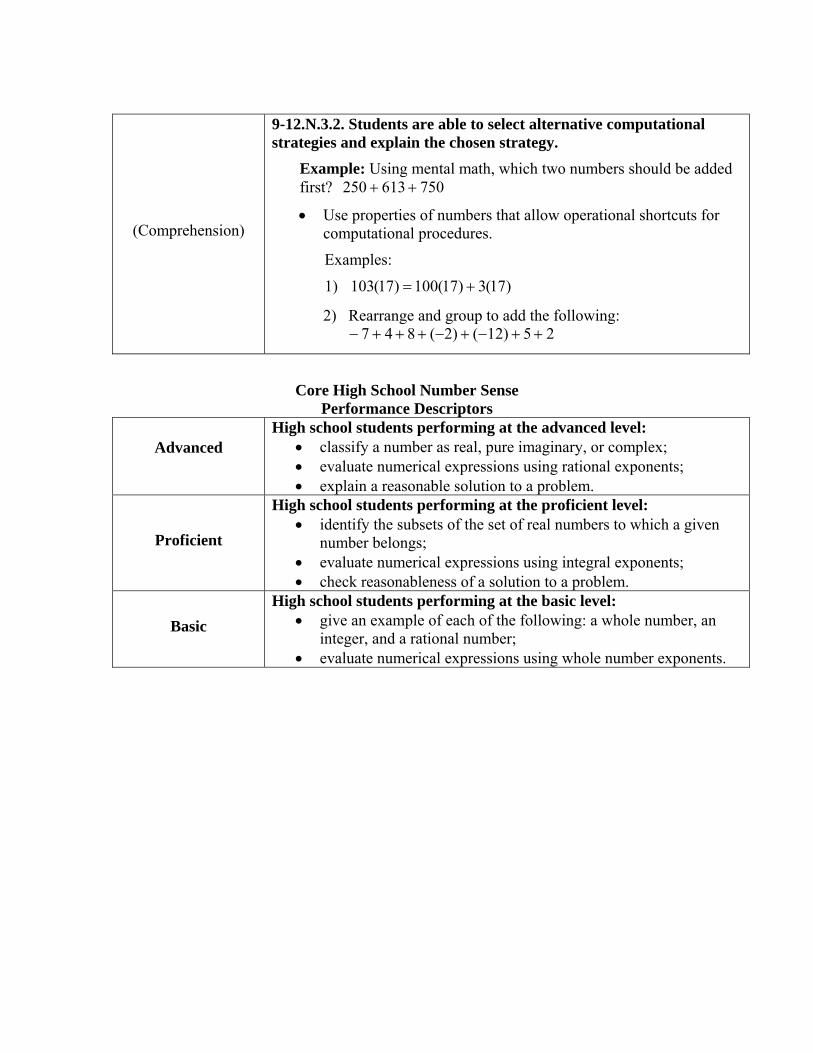
9-12.N.3.2. Students are able to select alternative computational strategies and explain the chosen strategy.
Example: Using mental math, which two numbers should be added first? 750613250 ++
• Use properties of numbers that allow operational shortcuts for computational procedures.
Examples:
1) )17(3)17(100)17(103 +=
2) Rearrange and group to add the following: 25)12()2(847 ++−+−+++−
Core High School Number Sense Performance Descriptors
Advanced
High school students performing at the advanced level: • classify a number as real, pure imaginary, or complex; • evaluate numerical expressions using rational exponents; • explain a reasonable solution to a problem.
Proficient
High school students performing at the proficient level: • identify the subsets of the set of real numbers to which a given
number belongs; • evaluate numerical expressions using integral exponents; • check reasonableness of a solution to a problem.
Basic
High school students performing at the basic level: • give an example of each of the following: a whole number, an
integer, and a rational number; • evaluate numerical expressions using whole number exponents.

Core High School Statistics & Probability Grade Standards, Supporting Skills, and Examples
Indicator 1: Use statistical models to gather, analyze, and display data to draw conclusions.
Bloom’s Taxonomy Level Standard, Supporting Skills, and Examples
(Analysis)
9-12.S.1.1. Students are able to draw conclusions from a set of data. Example: Stacy scored 0, 0, 3, 6, 12, 8, 17, 19, 17, 20, and 36 points in eleven games during the basketball season.
a) Is there an outlier in the data set?
b) Give the five number summary.
c) Is it possible to determine Stacy’s shooting percentage?
d) Can you determine that Stacy’s performance improved?
e) Predict how many points Stacy will score in the next game.
• Determine and use appropriate statistical values. • Determine which questions can or cannot be answered from a
given data set.
(Comprehension)
9-12.S.1.2. Students are able to compare multiple one-variable data sets, using range, interquartile range, mean, mode, and median.
Example: Kim scored 1, 0, 3, 6, 12, 8, 17, 17, 17, 17, and 35 points in eleven games during the basketball season. Pat scored 9, 11, 10, 13, 12, 11, 14, 12, 13, and 15 points in ten games during the basketball season. Who is the more consistent scorer? Why?
(Analysis)
9-12.S.1.3. Represent a set of data in a variety of graphical forms and draw conclusions.
Example: In order to determine the median of a set of data, would you prefer to see a box-and-whisker plot or a histogram? Why?
• Make a scatterplot to draw a regression line and make predictions.
Example: As a group activity, students will plot their wrist measurement and shoe size as ordered pairs. After drawing the line of best fit, students will predict another person’s wrist size based on a given shoe size.

Teens0 10 20 30 40 50 60 70
Sugar Content of Cereals Box Plot
Adults0 10 20 30 40 50 60 70
Sugar Content of Cereals Box Plot
Kids0 10 20 30 40 50 60 70
Sugar Content of Cereals Box Plot
• Make a box-and-whisker plot to model a set of one-variable data.
Example: These box plots show the amount of sugar in cereals preferred by “kids” (ages 12 or younger), “teens” (ages 13 – 19) and “adults” (ages over 19).
1) In general, which group prefers cereal with less sugar? Use
the graphs and summary numbers to explain.
2) For which group do more of those surveyed prefer cereals with similar sugar content? How did you decide this?
• Make a histogram from a frequency distribution.
Indicator 2: Apply the concepts of probability to predict events/outcomes and solve problems.
Bloom’s Taxonomy Level Standard, Supporting Skills, and Examples
(Knowledge)
9-12.S.2.1. Students are able to distinguish between experimental and theoretical probability.
Example: Determine which of the two activities represents experimental probability: a) roll two dice many times, record the sums, and write the probabilities of different sums, or b) create a sample space of all possible outcomes and write the probabilities of different sums.
(Comprehension)
9-12.S.2.2. Students are able to predict outcomes of simple events using given theoretical probabilities.
Example: Given a spinner with unequal regions (50% red, 20% blue, 30% yellow), predict how many of the next 10 spins will be blue.
• Determine the sample space of an experiment.

Core High School Statistics & Probability Performance Descriptors
Advanced
High school students performing at the advanced level: • calculate probability of compound events; • determine correlation coefficient in a data set.
Proficient
High school students performing at the proficient level: • calculate probability of a simple event and make predictions; • answer questions about measures of central tendency and five-
number summary based on a given data set; • draw a regression line for a scatterplot.
Basic
High school students performing at the basic level: • calculate the probability of a simple event; • calculate mean, median, and mode for a data set.

Advanced High School Algebra Grade Standards, Supporting Skills, and Examples
Indicator 1: Use procedures to transform algebraic expressions.
Bloom’s Taxonomy Level Standard, Supporting Skills, and Examples
(Application)
9-12.A.1.1A. Students are able to write equivalent forms of rational algebraic expressions using properties of real numbers.
Example: Perform the indicated operation.
1) 42
2 −−
xx
2) x
xx−
++2
652
3) 1
31
12
−+
+
x
x
(Application)
9-12.A.1.2A. Students are able to extend the use of real number properties to expressions involving complex numbers.
Example: Find the sum, difference, product, and quotient of i32 + and i32 − .

Indicator 2: Use a variety of algebraic concepts and methods to solve equations and inequalities.
Bloom’s Taxonomy Level Standard, Supporting Skills, and Examples
(Analysis)
9-12.A.2.1A. Students are able to determine solutions of quadratic equations.
• Use the quadratic formula. Example: Solve 0532 =++ xx
• Use the discriminant, acb 42 − , to describe the nature of the roots. Example: 1) Describe the nature of the roots a quadratic equation with a
discrimint of -4.
2) Describe the nature of the roots of the equation 05139 2 =+− xx
(Application)
9-12.A.2.2A. Students are able to determine the solution of systems of equations and systems of inequalities.
Examples: Solve each system. 1) 952 =+ yx and 343 =− yx 2) 2522 =+ yx and 8443 22 =+ yx 3) 32 +< xy and 74 −−> xy
(Application) 9-12.A.2.3A. Students are able to determine solutions to absolute value statements.
Example: Solve | 43 +x | 5>

Indicator 3: Interpret and develop mathematical models. Bloom’s Taxonomy
Level Standard, Supporting Skills, and Examples
(Analysis)
9-12.A.3.1A. Students are able to distinguish between linear, quadratic, inverse variation, and exponential models.
Examples:
1) Describe the difference between xy 2= , 2xy = , x
y 2= and
2xy =
2) Which of the following graphs represents inverse variation?
a) b) Illustrations for Example 9-12.A.3.2 a) b)
c) d)

(Synthesis)
9-12.A.3.2A. Students are able to create formulas to model relationships that are algebraic, geometric, trigonometric, and exponential.
Examples: 1) Algebraic: )()()( xCxIxP −=
2) Geometric: 2sA =
3) Trigonometric: DCxBAy +−= )(sin
4) Exponential: nt
nrAtA )1()( 0 +=
(Analysis)
9-12.A.3.3A. Students are able to use sequences and series to model relationships.
Example: A ball is dropped from a height of six feet. Each rebound is half the height of the previous bounce. What is the total vertical distance the ball has traveled on the tenth bounce?
Indicator 4: Describe and use properties and behaviors of relations, functions, and inverses.
Bloom’s Taxonomy Level Standard, Supporting Skills, and Examples
(Analysis)
9-12.A.4.1A. Students are able to determine the domain, range, and intercepts of a function.
Example: Given the function x
xxf )2()( −= , determine each of
the following:
1) domain of f
2) range of f
3) x - intercept
4) y -intercept
5) vertical and horizontal asymptotes

(Analysis)
9-12.A.4.2A. Students are able to describe the behavior of a polynomial, given the leading coefficient, roots, and degree.
Example: Given a third degree polynomial with a double root at 2−=x , a root at 3=x , and a positive coefficient on the term of
highest degree, describe and sketch the graph.
Example: Which of the following depicts the graph of 3xy = ? a) b)
c) d)

(Analysis)
9-12.A.4.3A. Students are able to apply transformations to graphs and describe the results.
• Change coefficients and/or constants.
1) Compare the graphs of 2)( xxf = and 3)1(2)( 2 ++= xxg
2) The graph of )(xfy = is shown below.
“Which of the graph below is the graph of 3[ ( )]y f x= ? a) b)
c) d)
• Graph the inverse of a function.
Examples:
1) Show the reflection of the graph of 32 += xy across the line xy = .
2) Graph the inverse of the function 2xy = .

(Application)
9-12.A.4.4A. Students are able to apply properties and definitions of trigonometric, exponential, and logarithmic expressions.
Examples:
1) Simplify x
x2
2
tancos1−
2) Evaluate log4( 81 )
3) Evaluate eln(e)
4) Prove the identity: )2sin(1)cos(sin 2 xxx −=−
5) Solve for x: xx 22 log4)15(log =+−
(Analysis)
9-12.A.4.5A. Students are able to describe characteristics of nonlinear functions and relations.
• Conic sections Example: Find the vertices, foci, length of major and minor axes and eccentricity of the graph of the ellipse having the equation
1259
22
=+yx .
• Trigonometric functions Example: Find the period, amplitude, vertical and horizontal
shift of 2)3
(2sin3 −+=πxy .
• Exponential and logarithmic functions Examples: 1) Write xy 23= in logarithmic form.
2) Determine the domain and range of xy 23= and )15ln( += xy .
(Application) 9-12.A.4.6A. Students are able to graph solutions to linear inequalities.
Example: Graph the solution of 42 −< xy
17
8
15
A
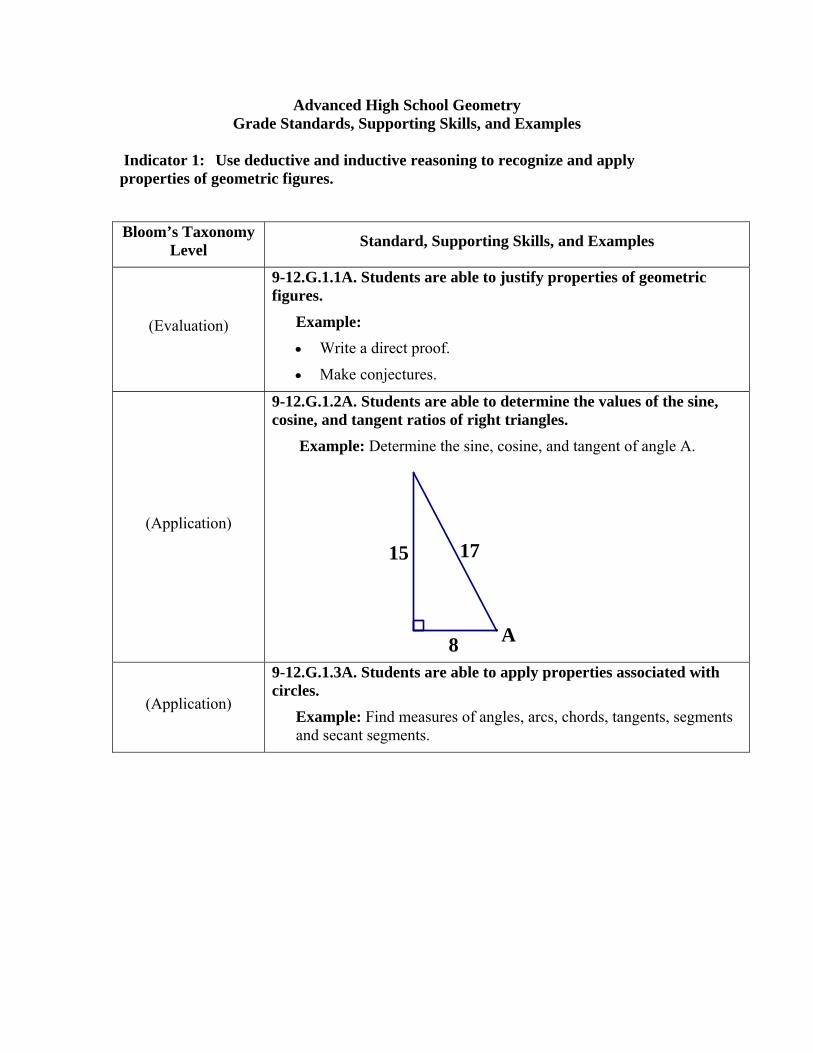
Advanced High School Geometry Grade Standards, Supporting Skills, and Examples
Indicator 1: Use deductive and inductive reasoning to recognize and apply properties of geometric figures.
Bloom’s Taxonomy Level Standard, Supporting Skills, and Examples
(Evaluation)
9-12.G.1.1A. Students are able to justify properties of geometric figures.
Example: • Write a direct proof.
• Make conjectures.
(Application)
9-12.G.1.2A. Students are able to determine the values of the sine, cosine, and tangent ratios of right triangles.
Example: Determine the sine, cosine, and tangent of angle A.
(Application)
9-12.G.1.3A. Students are able to apply properties associated with circles.
Example: Find measures of angles, arcs, chords, tangents, segments and secant segments.

1010
13
(Analysis)
9-12.G.1.4A. Students are able to use formulas for surface area and volume to solve problems involving three-dimensional figures.
Example: Find the total surface area and volume of the regular square pyramid shown.
Indicator 2: Use properties of geometric figures to solve problems from a variety of perspectives.
Bloom’s Taxonomy Level Standard, Supporting Skills, and Examples
(Synthesis)
9-12.G.2.1A. Students are able to use Cartesian coordinates to verify geometric properties.
Example: Prove that ∆ABC is a right triangle, given A(0,0), B(–2,6), and C(3,1).

Advanced High School Measurement Grade Standards, Supporting Skills, and Examples
Indicator 1: Apply measurement concepts in practical applications. Bloom’s Taxonomy
Level Standard, Supporting Skills, and Examples
(Application)
9-12.M.1.1A. Students are able to use dimensional analysis to check answers and determine units of a problem solution.
Example: An interplanetary probe travels 30,400 miles/hour. Express this as meters/second.
(Analysis)
9-12.M.1.2A. Students are able to use indirect measurement in problem situations that defy direct measurement.
Example: An electronic measuring device on the ground 320 feet from the base of the dam at Lake Pactola determines the distance to the top to be 400 feet. How high is the dam?

Advanced High School Number Sense Grade Standards, Supporting Skills, and Examples
Indicator 1: Analyze the structural characteristics of the real number system and its various subsystems. Analyze the concept of value, magnitude, and relative magnitude of real numbers. Bloom’s Taxonomy
Level Standard, Supporting Skills, and Examples
(Comprehension)
9-12.N.1.1A. Students are able to describe the relationship of the real number system to the complex number system.
Example: 1) Identify the imaginary part of i45 + . 2) What is the magnitude of i32 + ?
(Application)
9-12.N.1.2A. Students are able to apply properties and axioms of the real number system to various subsets, e.g., axioms of order, closure.
Examples: 1) Is the set {1, 2, 3} closed under addition?
2) Which of these operations are commutative?
a) addition b) subtraction c) multiplication d) division

Indicator 2: Apply number operations with real numbers and other number systems.
Bloom’s Taxonomy Level Standard, Supporting Skills, and Examples
(Application)
9-12.N.2.1A. Students are able to add, subtract, multiply, and divide real numbers including rational exponents.
Examples: Express as a rational number in lowest terms:
1) 823 − 8
13
⎛
⎝ ⎜ ⎜
⎞
⎠ ⎟ ⎟
3
2) ( )1
123
222
−
−− +
• Simplify numeric expressions with radicals. Example:
1) Perform the indicated operation: 275
−35
2) Is 51
4+
equivalent to 51+− ?
Indicator 3: Develop conjectures, predictions, or estimations to solve problems and verify or justify the results.
Note: Skills for this indicator have been subsumed within applications to advanced skills by the time students reach advanced high school mathematics.

Advanced High School Statistics & Probability Grade Standards, Supporting Skills, and Examples
Indicator 1: Use statistical models to gather, analyze, and display data to draw conclusions.
Bloom’s Taxonomy Level Standard, Supporting Skills, and Examples
(Evaluation)
9-12.S.1.1A. Students are able to analyze and evaluate the design of surveys and experiments.
Examples: 1) Create and administer a survey and identify sources of bias.
2) What type(s) of bias might affect the results of a telephone survey?
3) In an experiment, why is it very important to randomly assign subjects to groups?
(Evaluation)
9-12.S.1.2A. Students are able to analyze and evaluate graphical displays of data.
Example: Find graphical displays of data in a newspaper or magazine and discuss the following:
a) What is the type of data display? b) Is the display a good model for the data? c) What other type of data display(s) could have been used? d) Does the display exhibit any distortions which could be misleading?
(Analysis)
9-12.S.1.3A. Students are able to compare multiple one-variable data sets, using standard deviation and variance.
Example: In her math class, Jane scored 87 on a math test with mean score 80 and standard deviation 5. In another class, Alice scored 85 on a test with mean score 83 and standard deviation 3. Which student has the better score in her class?
• Calculate the standard deviation and variance of a data set.
(Application)
9-12.S.1.4A. Students are able to describe the normal curve and use it to make predictions.
Example: A set of normally distributed data representing the heights of a population of 18-year-old females has mean 65 inches, with standard deviation 2 inches. In a group of one hundred 18-year-old females from this population, approximate the number who are taller than 67 inches.

(Application)
9-12.S.1.5A. Students are able to use scatterplots, best-fit lines, and correlation coefficients to model data and support conclusions.
Example: For a given set of two-variable data:
1) Create a scatterplot and find the least-squares regression line.
2) Interpret the value of the correlation coefficient.
Indicator 2: Apply the concepts of probability to predict events/outcomes and solve problems.
Bloom’s Taxonomy Level Standard, Supporting Skills, and Examples
(Application)
9-12.S.2.1A. Students are able to use probabilities to solve problems.
• Compute combinations, permutations.
• Interpret tables.
Example: Use the data given in the table:
Voters in District 5 Males Females Democrat 30 50 Republican 70 50
1) Find the probability that a voter in District 5 is a male
Democrat. 2) Given that a voter is a Democrat, find the probability that
the voter is female.
• Create and use tree diagrams.
(Application)
9-12.S.2.2A. Students are able to determine probability of compound, complementary, independent, and mutually exclusive events.
Examples: Solve the following: 1) Using a standard deck of cards of 52 cards, find the probability
of drawing a king followed by another king, without replacing the first king back into the deck.
2) Using a standard deck of cards of 52 cards, find the probability of drawing a king followed by another king, with replacing the first king back into the deck.
3) Which of these problem situations represents independent events?

Examples: Solve the following: 1) Find the probability of drawing an ace in a single draw from a
standard deck of 52 cards.
2) Find the probability of drawing a heart in a single draw from a standard deck of 52 cards.
3) Find the probability of drawing the ace of hearts in a single draw from a standard deck of 52 cards.
4) Find the probability of drawing an ace or a heart in a single draw from a standard deck of 52 cards.
5) Explain whether the events “drawing an ace” and “drawing a heart” are mutually exclusive (disjoint)?
6) Describe the complementary event of “drawing a heart.”
(Analysis)
9-12.S.2.3A. Students are able to generate data and use the data to determine empirical (experimental) probabilities.
Example: Toss 20 identical thumbtacks once and record the number that land with the point up. Do this 50 times, recording each result. Use the data to approximate the probability of this type of thumbtack landing point up.

High School Algebra Grade Standards, Supporting Skills, and Examples
Indicator 1: Use procedures to transform algebraic expressions.
Core HS Standards 9-12.A.1.1. (Comprehension)Write equivalent forms of algebraic expressions using properties of the set of real numbers.
Advanced HS Standards 9-12.A.1.1A. (Application) Write equivalent forms of rational algebraic expressions using properties of real numbers. 9-12.A.1.2A. (Application) Extend the use of real number properties to expressions involving complex numbers.
Indicator 2: Use a variety of algebraic concepts and methods to solve equations and inequalities.
Core HS Standards
9-12.A.2.1. (Comprehension) Use algebraic properties to transform multi-step, single variable, and first-degree equations.
9-12.A.2.2. (Application) Use algebraic properties to transform multi-step, single variable, and first-degree inequalities and represent solutions using a number line.
Advanced HS Standards 9-12.A.2.1A. (Analysis) Determine solutions of quadratic equations.
9-12.A.2.2A. (Application) Determine the solution of systems of equations and systems of inequalities. 9-12.A.2.3A. (Application) Determine solutions to absolute value statements.
Indicator 3: Interpret and develop mathematical models.
Core HS Standards 9-12.A.3.1. (Application) Create linear models to represent problem situations. 9-12.A.3.2. (Comprehension) Distinguish between linear and nonlinear models.
Advanced HS Standards 9-12.A.3.1A. (Analysis) Distinguish between linear, quadratic, inverse variations, and exponential models.
9-12.A.3.2A. (Synthesis) Create formulas to model relationships that are algebraic, geometric, trigonometric, and exponential. 9-12.A.3.3A. (Analysis) Use sequences and series to model relationships.

Indicator 4: Describe and use properties and behaviors of relations, functions, and
inverses.
Core HS Standards 9-12.A.4.1. (Application) Use graphs, tables, and equations to represent linear functions.
Advanced HS Standards
9-12.A.4.1A. (Analysis) Determine the domain, range, and intercepts of a function. 9-12.A.4.2A. (Analysis) Describe the behavior of a polynomial, given the leading coefficient, roots, and degree.
9-12.A.4.3A. (Analysis) Apply transformations to graphs and describe the results.
9-12.A.4.4A. (Application) Apply properties and definitions of trigonometric, exponential, and logarithmic expressions. 9-12.A.4.5A. (Analysis) Describe characteristics of nonlinear functions and relations.
9-12.A.4.6A. (Application) Graph solutions to linear inequalities.

High School Geometry
Grade Standards, Supporting Skills, and Examples
Indicator 1: Use deductive and inductive reasoning to recognize and apply properties of geometric figures.
Core HS Standards 9-12.G.1.1. (Application) Apply the properties of triangles and quadrilaterals to find unknown parts.
9-12.G.1.2. (Application) Identify and apply relationships among triangles.
Advanced HS Standards 9-12.G.1.1A. (Evaluation) Justify properties of geometric figures. 9-12.G.1.2A. (Application) Determine the values of the sine, cosine, and tangent ratios of right triangles.
9-12.G.1.3A. (Application) Apply properties associated with circles.
9-12.G.1.4A. (Analysis) Use formulas for surface area and volume to solve problems involving three-dimensional figures.
Indicator 2: Use properties of geometric figures to solve problems from a variety of perspectives.
Core HS Standards 9-12.G.2.1. (Analysis) Recognize the relationship between a three-dimensional figure and its two-dimensional representation.
9-12.G.2.2. (Application) Reflect across vertical or horizontal lines, and translate two-dimensional figures. 9-12.G.2.3. (Application) Use proportions to solve problems.
Advanced HS Standards 9-12.G.2.1A. (Synthesis) Use Cartesian coordinates to verify geometric properties.

High School Measurement
Grade Standards, Supporting Skills, and Examples
Indicator 1: Apply measurement concepts in practical applications.
Core HS Standards 9-12.M.1.1. (Comprehension) Choose appropriate unit label, scale, and precision.
9-12.M.1.2. (Comprehension) Use suitable units when describing rate of change. 9-12.M.1.3. (Application) Use formulas to find perimeter, circumference, and area to solve problems involving common geometric figures.
Advanced HS Standards 9-12.M.1.1A. (Application) Use dimensional analysis to check answers and determine units of a problem solution. 9-12.M.1.2A. (Analysis) Use indirect measurement in problem situations that defy direct measurement.

High School Number Sense
Grade Standards, Supporting Skills, and Examples
Indicator 1: Analyze the structural characteristics of the real number system and its various subsystems. Analyze the concept of value, magnitude, and relative magnitude of real numbers.
Core HS Standards 9-12.N.1.1. (Comprehension) Identify multiple representations of a real number.
9-12.N.1.2. (Comprehension) Apply the concept of place value, magnitude, and relative magnitude of real numbers.
Advanced HS Standards 9-12.N.1.1A. (Comprehension) Describe the relationship of the real number system to the complex number system.
9-12.N.1.2A. (Application) Apply properties and axioms of the real number system to various subsets, e.g., axioms of order, closure.
Indicator 2: Apply operations within the set of real numbers.
Core HS Standards 9-12.N.2.1. (Comprehension) Add, subtract, multiply, and divide real numbers including integral exponents.
Advanced HS Standards 9-12.N.2.1A. (Application) Add, subtract, multiply, and divide real numbers including rational exponents.
Indicator 3: Develop conjectures, predictions, or estimations to solve problems and verify or justify the results.
Core HS Standards 9-12.N.3.1. (Analysis) Use estimation strategies in problem situations to predict results and to check the reasonableness of results.
9-12.N.3.2. (Comprehension) Select alternative computational strategies and explain the chosen strategy.
Advanced HS Standards Note: Skills for this indicator have been subsumed within applications to advanced skills by the time students reach advanced high school mathematics.

High School Statistics & Probability
Grade Standards, Supporting Skills, and Examples
Indicator 1: Use statistical models to gather, analyze, and display data to draw conclusions.
Core HS Standards
9-12.S.1.1. (Analysis) Draw conclusions from a set of data.
9-12.S.1.2. (Comprehension) Compare multiple one-variable data sets, using range, interquartile range, mean, mode, and median. 9-12.S.1.3. (Analysis) Represent a set of data in a variety of graphical forms and draw conclusions.
Advanced HS Standards 9-12.S.1.1A. (Evaluation) Analyze and evaluate the design of surveys and experiments. 9-12.S.1.2A. (Evaluation) Analyze and evaluate graphical displays of data.
9-12.S.1.3A. (Analysis) Compare multiple one-variable data sets, using standard deviation and variance. 9-12.S.1.4A. (Application) Describe the normal curve and use it to make predictions.
9-12.S.1. 5A. (Application) Use scatterplots, best-fit lines, and correlation coefficients to model data and support conclusions.
Indicator 2: Apply the concepts of probability to predict events/outcomes and solve problems.
Core HS Standards 9-12.S.2.1. (Knowledge) Distinguish between experimental and theoretical probability.
9-12.S.2.2. (Comprehension) Predict outcomes of simple events using given theoretical probabilities.
Advanced HS Standards 9-12.S.2.1A. (Application) Use probabilities to solve problems.
9-12.S.2.2A. (Application) Determine probability of compound, complementary, independent, and mutually exclusive events. 9-12.S.2.3A. (Analysis) Generate data and use the data to estimate empirical probabilities.
