south carolina epidemiologic profile 2009
DESCRIPTION
SOUTH CAROLINA EPIDEMIOLOGIC PROFILE 2009. Data available in an Integrated Epidemiologic Profile. Core Epi Section Socio-demographic characteristics of the general population in South Carolina Scope of the HIV/AIDS epidemic Indicators of risk for HIV infection in the population - PowerPoint PPT PresentationTRANSCRIPT
SOUTH CAROLINA EPIDEMIOLOGIC PROFILE
2009

Data available in an Integrated Epidemiologic Profile
Core Epi Section• Socio-demographic characteristics of the general
population in South Carolina• Scope of the HIV/AIDS epidemic• Indicators of risk for HIV infection in the population
Ryan White CARE Act (RWCA) Section • Patterns of service utilization of HIV infected persons in
South Carolina • Number and characteristics of persons who know they
are HIV+ but who are not receiving HIV primary medical care
Question #1:Question #1:
What are the sociodemographic characteristics of the population?
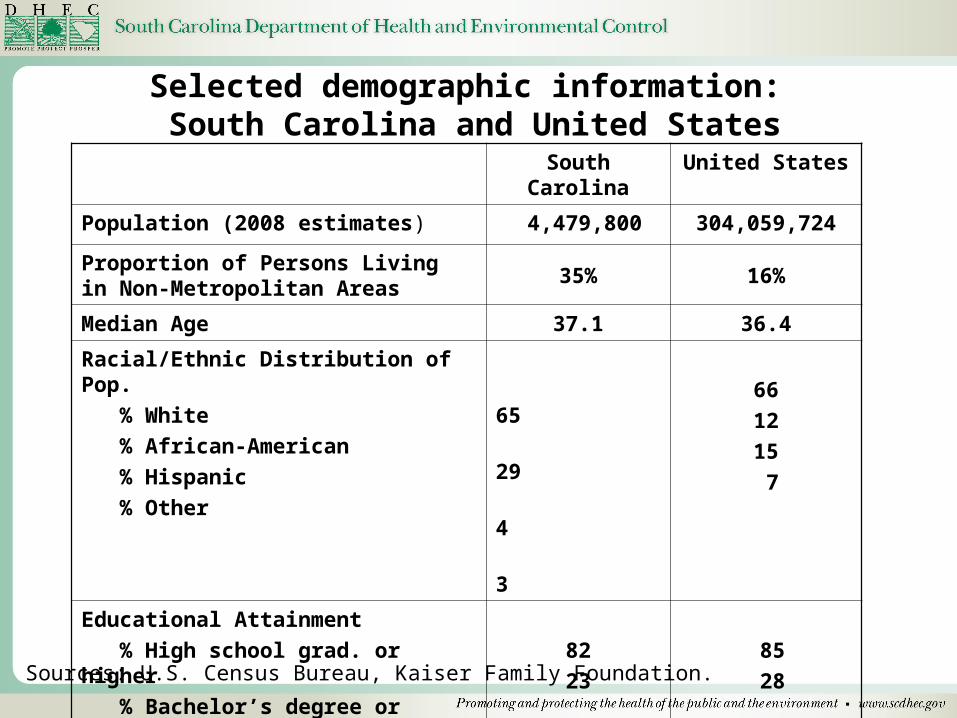
Selected demographic information: South Carolina and United States
South Carolina United States
Population (2008 estimates) 4,479,800 304,059,724
Proportion of Persons Living in Non-Metropolitan Areas
35% 16%
Median Age 37.1 36.4
Racial/Ethnic Distribution of Pop.
% White
% African-American
% Hispanic
% Other
65
29
4
3
66
12
15
7
Educational Attainment
% High school grad. or higher
% Bachelor’s degree or higher
82
23
85
28
Unemployment Rate, 2008 7.8% 6.6%
Median Household Income, 2008 $43,508 $51,233
Sources: U.S. Census Bureau, Kaiser Family Foundation.

Percent of each racial/ethnic pop. living below federal poverty level; S.C., 2008
10%22%
16%29%
White (n=315,248)
Black (n=327,679)
Other (n=15,623)
Hispanic Origin(n=44,074)
POVERTY GAPSPOVERTY GAPS
Source: U.S. Census Bureau
Question #2:Question #2:
What is the impact of HIV/AIDS on the population?

South Carolina HIV/AIDS Rankings
• AIDS cases have been reported in S.C. since 1981 and confirmed cases of HIV infections have been reportable since 1986.
• In 2007, S.C. ranked 8th among all states and District of Columbia in AIDS case rates at 16.8 per 100,000 population.
• In 2007, S.C. ranked 7th among all states and District of Columbia in AIDS case rates among female cases at 13.0 per 100,000 population.
Source: www.statehealthfacts.org

South Carolina HIV/AIDS incidence, prevalence, and deaths
0100020003000400050006000700080009000
100001100012000130001400015000
1990
1991
1992
1993
1994
1995
1996
1997
1998
1999
2000
2001
2002
2003
2004
2005
2006
2007
2008
Year of Diagnosis
IncidencePrevalenceDeaths
Note: Number of cases diagnosed in S.C. only; excludes out of state cases returning to S.C.
Nu
mbe
r of
Cas
es

Disproportionate S.C. HIV impact by gender
SEX
No. (%) S.C.
Total Population
No. (%) of Total Estimated
Living With HIV/AIDS, 2008
No. (%) of Total HIV-Only
Diagnosis, 2007-2008
Male 2,181,663 (49%) 10,105 (69%) 646 (70%)
Female 2,298,173 (51%) 4,539 (31%) 280 (30%)
Total 4,479,800 14,644 (100%) 926 (100%)
Source: U.S. Census Data; S.C. DHEC.
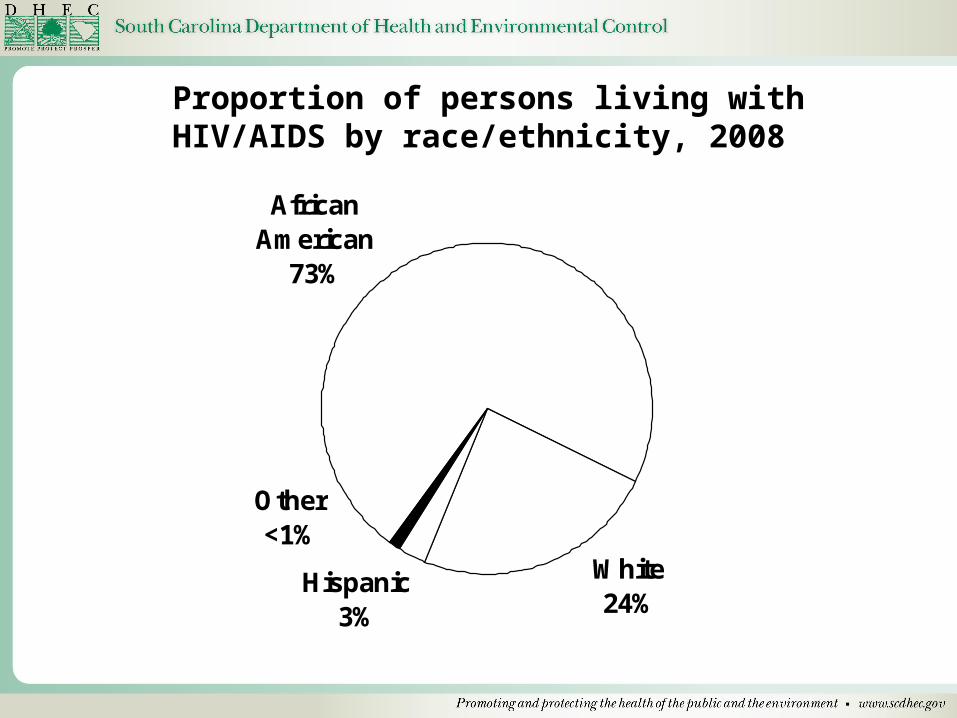
Proportion of persons living with HIV/AIDS by race/ethnicity, 2008
African American
73%
White24%
Other<1%
Hispanic3%

Disproportionate HIV impact by race/ethnicity/gender, S.C.
Gender & Race/Ethnicity
No. (%) SC Total Pop.
No. (%) of Total Persons Living With HIV/AIDS,
2008
No.(%) of Total HIV Only
Diagnosis, 2007-2008
Black Males 603,440 (13%) 6901 (47%) 486 (50%)
Black Females 678,720 (15%) 3752 (26%) 235 (24%)
White Males 1,505,390 (33%) 2851 (19%) 166 (17%)
White Females 1,541,850 (34%) 673 (5%) 50 (5%)
Hispanic Males 95,730 (2%) 311 (2%) 17 (2%)
Hisp. Females 73,190 (2%) 87 (1%) 14 (1%)
Source: U.S. Census Data; S.C. DHEC.

Disproportionate HIV impact by age, S.C.
Age RangeNo. (%) SC Population
No. (%) of Total Persons Living with HIV/AIDS,
2008
No. (%) of Total HIV-Only
Diagnosis, 2007-2008
< 13 Years 724,209 (18%) 44 (<1%) 5 (<1%)
13 – 19 Years 411,579 (10%) 132 (<1%) 73 (8%)
20 – 44 Years 1,467,669 (37%) 7,224 (49%) 641 (69%)
45+ Years 1,408,565 (35%) 7,244 (49%) 209 (23%)
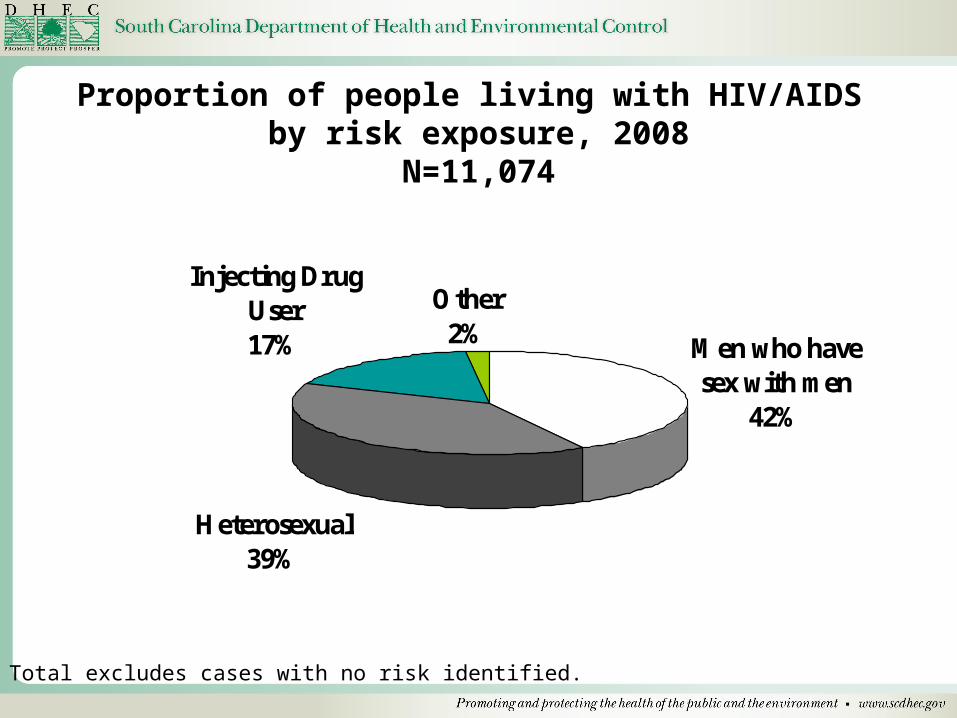
Proportion of people living with HIV/AIDS by risk exposure, 2008
N=11,074
Note: Total excludes cases with no risk identified.
Other2% Men who have
sex with men42%
Injecting Drug User17%
Heterosexual39%

Proportion of HIV/AIDS cases by risk exposure, 2007-2008
N=1,006
Heterosexual39%
Other<1%
Injecting Drug User8%
Men who have sex with men
53%
Note: Total excludes cases with no risk identified.

Proportional distribution of male HIV/AIDS cases by exposure category, diagnosed
1997-2008
0
10
20
30
40
50
60
70
80
1997-1999 2000-2002 2003-2005 2006-2008
Years of Diagnosis
MSMIDUHeteroOther
Per
cent
of
Tot
al C
ases
wit
h R
epor
ted
Ris
k
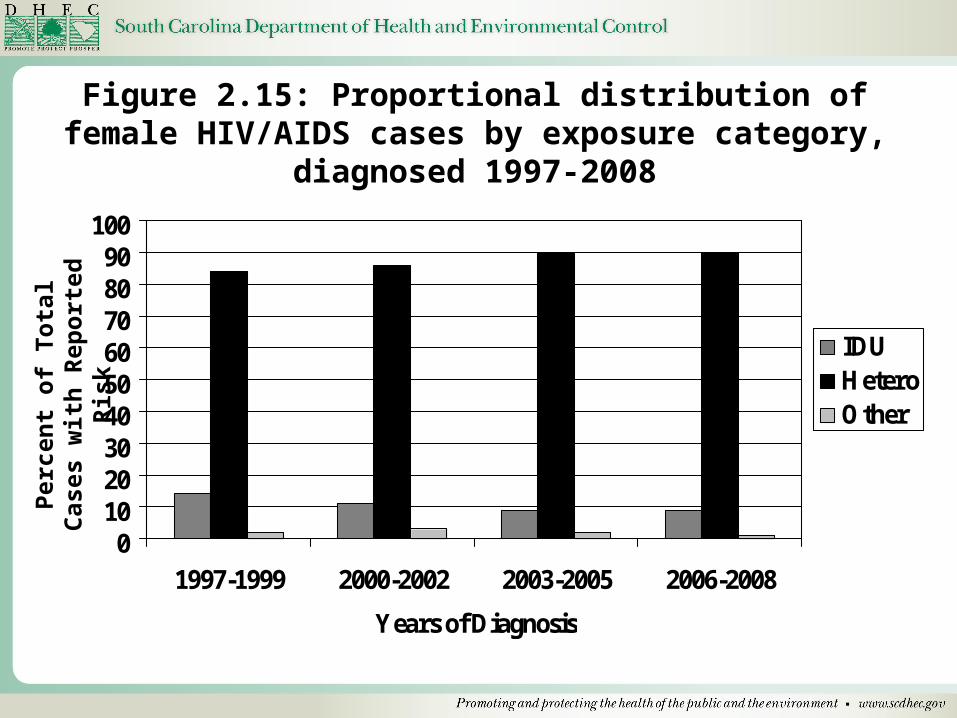
Figure 2.15: Proportional distribution of female HIV/AIDS cases by exposure category,
diagnosed 1997-2008
0102030405060708090
100
1997-1999 2000-2002 2003-2005 2006-2008
Years of Diagnosis
IDUHeteroOther
Per
cent
of
Tot
al C
ases
wit
h R
epor
ted
Ris
k

Deaths among persons with AIDS in South Carolina, 1988-2007
0
100
200
300
400
500
600
Year of Death
Num
ber
of D
eath
s
Source: Vital Records

Question #3:Question #3:
Who is at risk for becoming infected with HIV/AIDS?
Note: Totals Exclude Cases with No Risk Identified; Risk Exposure is self-reported
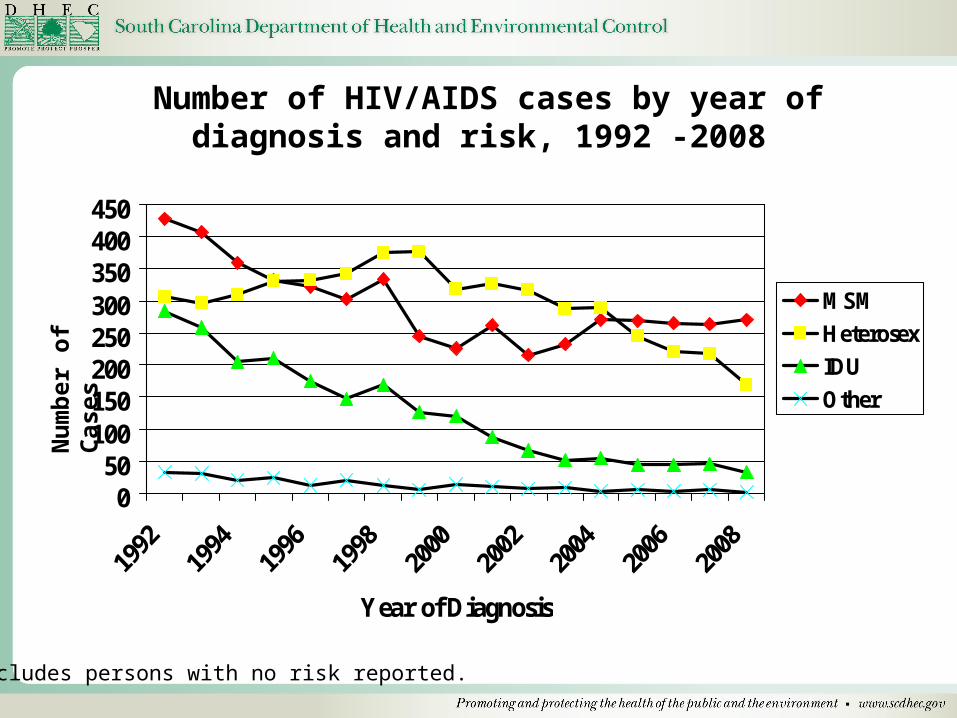
Number of HIV/AIDS cases by year of diagnosis and risk, 1992 -2008
050
100150200250300350400450
Year of Diagnosis
MSM
Heterosex
IDU
Other
Excludes persons with no risk reported.
Nu
mbe
r of
Cas
es

Proportion of men with HIV/AIDS who have sex with men by race/ethnicity, diagnosed 2007-2008
N=534
Hisp/Other5% White
31%
Black64%

Proportion of heterosexual HIV/AIDS cases by race/sex, diagnosed 2007-2008
N=388
WM2%
WF11%
OtherM/F5% BM
33%
BF49%
BM
BF
WM
WF
OtherM/F

Proportion of injecting drug users diagnosed with HIV/AIDS 2007-2008 by race/sex
N=78
BF19%
WF12%
Other6% BM
32%
WM31%
BMBFWMWFOther

Percent of injecting drug users diagnosed with HIV/AIDS 2007-2008 by age group
N=78
30-4438%
45+42%
20-248%
25-2912%
20-2425-2930-4445+

Number of children <13 years old diagnosed with HIV/AIDS in South Carolina,
1993-2008
0
5
10
15
20
25
Year of Diagnosis
Nu
mbe
r of
Cas
es

Other STDs

How S.C. ranks in U.S. for STD rates/100,000 population
#3 for Chlamydia #2 for Gonorrhea #26 for Infectious Syphilis
Source: Centers for Disease Control Updated: Nov. 2008

0
2000
4000
6000
8000
10000
12000
1994
1995
1996
1997
1998
1999
2000
2001
2002
2003
2004
2005
2006
2007
2008
White MaleWhite FemaleBlack MaleBlack Female
Year
Nu
mb
er o
f C
ases
South Carolina reported Chlamydia cases by year of diagnosis, 1994 - 2008

0
1000
2000
3000
4000
5000
6000
7000
8000
1994
1995
1996
1997
1998
1999
2000
2001
2002
2003
2004
2005
2006
2007
2008
White MaleWhite FemaleBlack MaleBlack Female
Year
Nu
mb
er o
f C
ases
South Carolina reported gonorrhea cases by year of diagnosis,
1994 - 2008

South Carolina reported Infectious Syphilis cases by year of diagnosis, 1994-2008
050
100150200250300350400450
1994
1996
1998
2000
2002
2004
2006
2008
Year of Diagnosis
Black FemaleBlack MaleWhite FemaleWhite Male
Nu
mbe
r of
Cas
es

Question #4:Question #4:
What are the patterns of service utilization of persons
living with HIV/AIDS?

Ryan White Part B Clients, N=7,974
Persons Living with HIV/AIDS, N=14,644
Race/Ethnicity
White, not-Hispanic 22% 24%
Black, not-Hispanic 73% 73%
Hispanic 3% 3%
Other 2% <1%
Sex
Male 63% 69%
Female 37% 31%
Transgender <1% ---
Age Group
<13 <1% <1%
13-24 4% 1%
25-44 48% 49%
45+ 48% 49%
Characteristics of Ryan White Part B clients compared to S.C. persons living with HIV/AIDS in 2008

No. of clients receiving service
Avg. no. of visits per
client
Medical Care 4,370 4.8
Medication (ADAP) 2,887 N/A
Oral/Dental Care 943 2.4
Mental Health 591 2.7
Substance Abuse 387 4.0
Case Management 6,434 7.4
South Carolina Ryan White Part B Service Utilization by Service Type, 2008

Question #5:Question #5:
What are the number and characteristics of persons who
know they are HIV+ but who are not receiving HIV primary medical care?

“In Care” and “Not in Care” defined:
• A person was reported as being “in care” if they had at least one CD4 or viral load test report from January 1, 2008 through December 31, 2008
• A person with no CD4 or viral load test report in this time frame would be defined as “not in care”
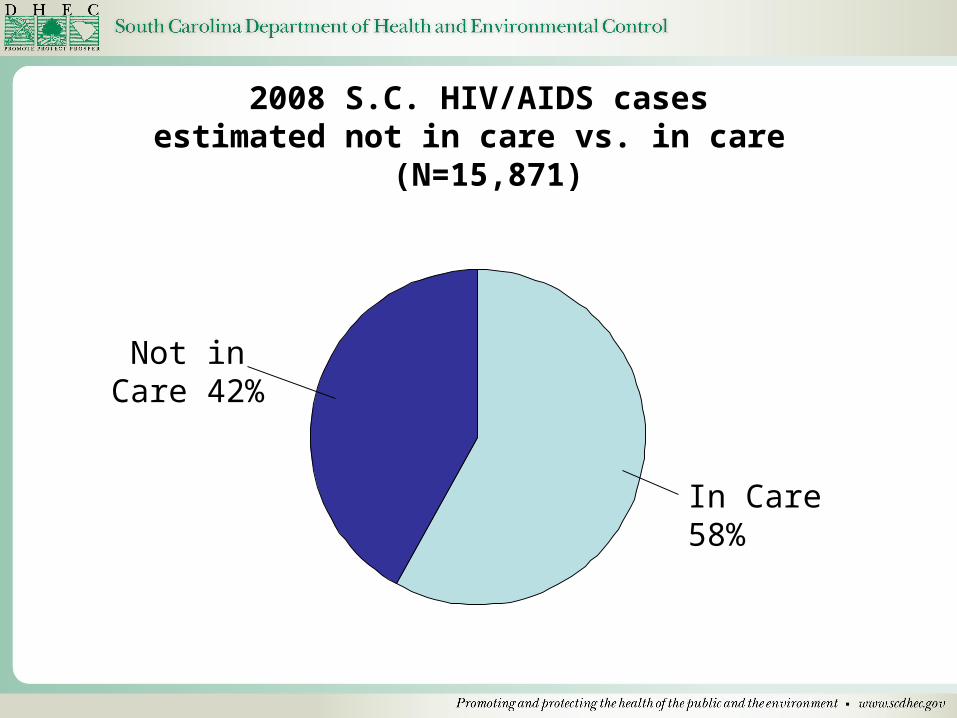
2008 S.C. HIV/AIDS cases estimated not in care vs. in care
(N=15,871)
Not in Care 42%
In Care 58%

S.C. HIV/AIDS cases estimated not in care diagnosed through 2008
HIV-only vs. AIDS (N=6,638)
HIV-only 60%
AIDS 40%

S.C. HIV/AIDS cases diagnosed through 2008, comparison within select demographics
estimated percentage not in care
0
10
20
30
40
50
60
70
80
Female
72
2826
69
4 1
9
22
38
Gender Race Age
%
<1
30
Male
Black
White
Hispan
ic
Other/Unknown
<2020-29
30-3940-49
50+
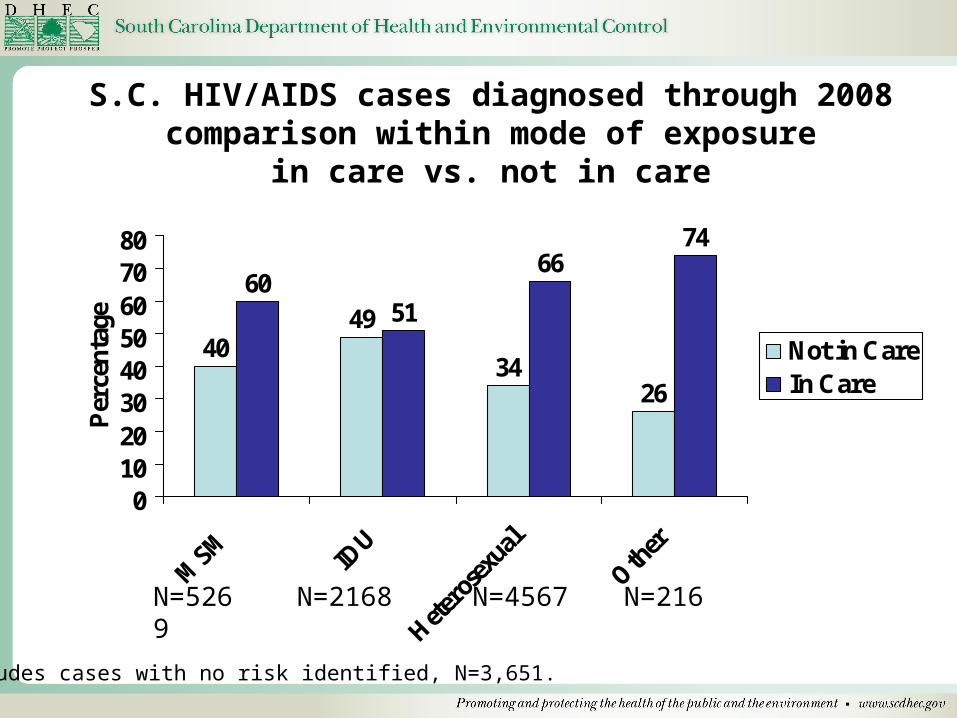
S.C. HIV/AIDS cases diagnosed through 2008 comparison within mode of exposure
in care vs. not in care
4049
3426
6051
6674
01020304050607080
MSM
IDU
Hete
rose
xual
Oth
er
Per
cent
age
Not in CareIn Care
N=5269 N=2168 N=4567 N=216
Excludes cases with no risk identified, N=3,651.
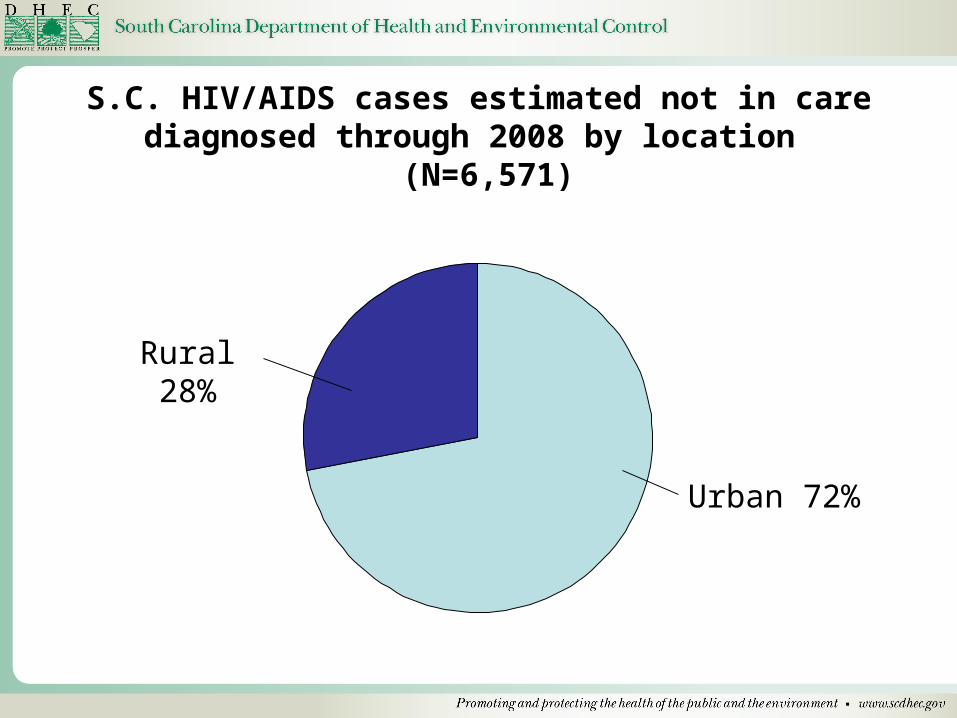
S.C. HIV/AIDS cases estimated not in care diagnosed through 2008 by location
(N=6,571)
Rural 28%
Urban 72%
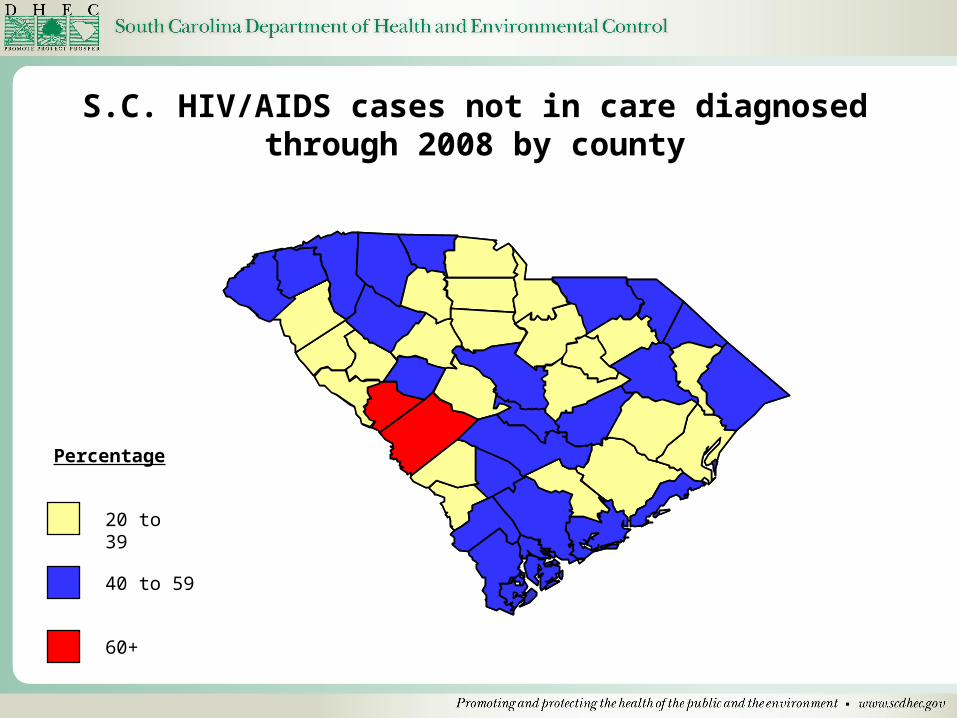
40 to 59
60+
S.C. HIV/AIDS cases not in care diagnosed through 2008 by county
Percentage
20 to 39

• People living with HIV/AIDS
• Men who have Sex with Men (MSM), particularly African-American Males as well as White Males
• High Risk Heterosexuals, primarily African-Americans who account for 8 out of every 10 persons living with HIV/AIDS
Recommendations Based on Epi Data Recommendations Based on Epi Data
Continue to focus prevention efforts on:
