south brighton bridge: lateral spread mitigation using …db.nzsee.org.nz/2014/oral/26_keepa.pdf ·...
TRANSCRIPT

Paper Number O26
South Brighton Bridge: Lateral spread mitigation using jet grout lattice structures
2014 NZSEE Conference
C Keepa, G Saul, A Murashev
Opus International Consultants
J McMillan
McMillan Drilling
ABSTRACT: South Brighton Bridge on the Avon River in Christchurch was severely damaged from strong ground shaking, liquefaction and associated lateral spreading and subsidence during the 4th September 2010 M7.1 Darfield Earthquake and the February 22nd 2011 Port Hills Earthquake.
The 3 span reinforced concrete bridge, constructed in 1980, was still operable after the earthquakes although with reduced load capacity. Following evaluation of several reinstatement options, it was decided to repair and retrofit the bridge to improve its resilience to future earthquakes. The works have included liquefaction mitigation and stabilisation of the river bank slopes at the abutments using underground lattice wall structures built of overlapping jet grout columns.
The cells of the lattice structures constrain and confine the soils contained within their walls, reducing cyclic shear strain induced in the soils with strong earthquake shaking and therefore reducing their potential for liquefaction. The lattice structures effectively acts as large stiff caissons that reduce lateral spreading at the abutments. This paper discusses the damage sustained by the bridge in the Canterbury earthquakes and the design and construction of the jet grout ground improvement structures that are part of the bridge reinstatement scheme.
1 INTRODUCTION
South Brighton Bridge is located near the mouth of the Avon River in Christchurch. The bridge was severely damaged from strong ground shaking, liquefaction and associated lateral spreading and subsidence during the September 2010 M7.1 Darfield Earthquake and the February 2011 M6.3 Port Hills Earthquake.
Works to repair and strengthen the bridge commenced in 2013 and includes stabilisation of the river bank and embankment slopes at the abutments using underground lattice wall structures built of overlapping jet grout columns.
This paper discusses the damage sustained by the bridge in the Canterbury earthquakes and the design and construction of the jet grout ground improvement structures at each of the bridge abutments.
2 GROUND CONDITIONS
Figure 1 shows ground conditions along the centreline of the bridge inferred from borehole, CPT and seismic dilatometer testing carried out at the site. The site is located near the Heathcote – Avon River Eastury and is underlain by approximately 35 m of beach and alluvial sands which overlie dense alluvial gravels. The gravels extend several hundred meters deep and are interbedded with stiff silts and clays. The sands are typically fine and loose up to a depth of 6 m to 10 m and fine to medium coarse and medium dense to dense from the base of the loose sands to a depth of 35 m. Occasional thin layers of firm to stiff silt are interbeded within the sands, particularly in the upper 6 m to 10 m of the ground profile and below 23 m depth. The road embankments that form the approaches to each end of the bridge are constructed of sand and silty sand and are up to 4 m high.

2
Figure 1. Ground profile
3 BRIDGE DESCRIPTION
South Brighton Bridge is constructed of reinforced concrete and has three spans, each approximately 22 m long and is skewed 25° to the river. Figure 2 shows a plan of the bridge (including the proposed reinstatement works). The superstructure is continuous across the piers and is constructed with precast pre-stressed concrete beams with a cast in-situ deck and diaphragms at the piers and abutments. The superstructure is supported on rubber bearers at each support and steel dowels transfer lateral loads between the superstructure and the piers.
Each pier has a single octangular column with a reinforced concrete hammer head and is supported on 12, 450 mm pre-stressed concrete piles. The piles are raked at 1H:4V and driven into medium dense to dense sands about 12.5 m deep. Each abutment has 10 raked precast 450 mm piles in two rows. The abutment piles are founded in the same layer as the pier piles.
Figure 2. Plan – Bridge general arrangement
4 DAMAGE FROM THE 2010 AND 2011 EARTHQUAKES
Peak ground accelerations of 0.23g and 0.59 g were recorded at the nearby Pages Road strong ground motion station during the respective September 4 2010 and February 22nd 2011 earthquakes (Geonet, 2013). Substantial lateral spreading of the river banks and approach embankments occurred at this site in both events. Approximately 100 m south of the bridge site, lateral spreading displacements between 0.79 and 1.05 m were measured after the September 4, 2010, earthquake (Cubrinovski et al, 2014). Lateral ground displacements of 2.9 m were measured approximately 23 m to the south of the bridge’s west abutment following the February 22, 2011 earthquake. Figure 3 shows lateral spread

3
displacements measured following the 22nd February 2011 earthquake.
Figure 3. Lateral spread displacements (Cubrinovski 2012)
Pinning by the bridge piles and propping between the abutments by the stiff superstructure constrained lateral spreading at the abutments. The abutment piles were not able to to fully resist spreading of the banks and the abutment blocks and backwalls rotated back about the lower flange of the bridge beams by approximately 7° - 8°. Lateral displacement of the tops of the piles was in the order of 200 mm (Cubrinovski et al, 2014). Tensile cracking was evident on the river side of the piles along with spalling on the landward side from the combined translation and rotation of the piles heads. Figure 4 depicts spreading-induced damage to the South Brighton Bridge.
Figure 4. Abutment damage
Because of the skew and stiffness of the bridge, the direction of lateral spreading of the approach embankments was biased toward the south at the western abutment and towards the north at the eastern abutment. Differential subsidence between the piled abutments and the approach embankmnets was in the order of a few hundred millimetres.
There was no serious damage to the bridge superstructure. Differential subsidence of the bridge was measured to be up to 315 mm on 23rd December 2011 (SCIRT, 2012). There are no records of the pre-earthquake level of the bridge and we cannot be sure how much differential subsidence can be attributed to the earthquakes. Subsidence was greater at the abutments compared to the piers and the superstructure was hogged following the earthquakes.
In contrast to other bridges near-by (eg Anzac bridge and Ferrymead bridge), there was no evidence of permanent rotation or translation of the piers. The stiffer octagonal arrangement of the pier piles for the South Brighton bridge may be a reason for the better performance of the piers compared with the single row pile arrangements across other bridges. A lower susceptibility to liquefaction at the piers could also have been a factor. Because of the difficult access, the pier piles were not inspected and
4
their fragility is uncertain.
5 BRIDGE REPAIR AND RETROFIT CONCEPT
After considering several options to reinstate South Brighton Bridge, Stronger Christchurch (SCIRT) elected to repair and strengthen the bridge. The reinstatement works involved:
• Ground improvement at each of the abutments to mitigate liquefaction and prevent lateral spreading in future earthquakes.
• Jacking the bridge to reduce stresses in the superstructure caused by differential subsidence following the earthquakes
• Construction of new piled abutments and land spans
• Reconstruction of the slopes at the abutments with geogrid reinforcement.
Four new 1200 mm dia concrete filled steel tube piles will be installed at each abutment. The piles were driven into the dense gravels to a depth of approximately 40 m. The bridge will be jacked level using temporary staging and new reinforced concrete abutment blocks constructed. The fill is excavated behind each abutment to reduce the loads imposed on the super structure if there is some ground displacement in future earthquakes. Land spans are to be installed to bridge the void behind the abutment blocks.
6 GROUND IMPROVEMENT DESIGN
Design and construction of the ground improvement was undertaken by Opus International Consultants, McMillan Drilling and Laynes Geotechnical from the USA.
Inspection of the pier piles that are below water level would have been expensive and the level of damage sustained by the pier piles in the earthquakes is uncertain. Eliminating lateral spreading at the bridge abutments and preventing liquefaction around the pier piles so that the bridge inertia is resisted at the stiffer abutment foundations was important for protecting the potentially fragile pier piles.
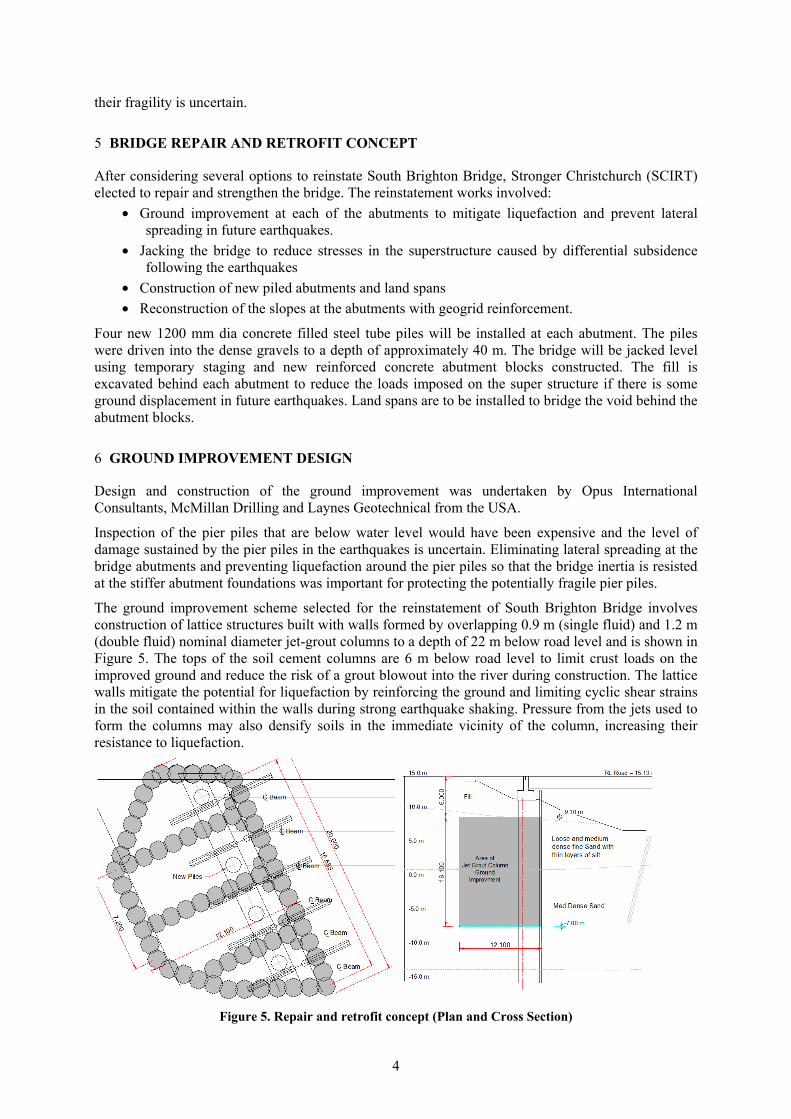
The ground improvement scheme selected for the reinstatement of South Brighton Bridge involves construction of lattice structures built with walls formed by overlapping 0.9 m (single fluid) and 1.2 m (double fluid) nominal diameter jet-grout columns to a depth of 22 m below road level and is shown in Figure 5. The tops of the soil cement columns are 6 m below road level to limit crust loads on the improved ground and reduce the risk of a grout blowout into the river during construction. The lattice walls mitigate the potential for liquefaction by reinforcing the ground and limiting cyclic shear strains in the soil contained within the walls during strong earthquake shaking. Pressure from the jets used to form the columns may also densify soils in the immediate vicinity of the column, increasing their resistance to liquefaction.
Figure 5. Repair and retrofit concept (Plan and Cross Section)

5
Jet grouting was selected for construction of the ground improvement because it offered greater flexibility to work around the existing bridge compared with auger type soil mixing and allowed full encapulation of the abutment piles within the improved ground.
A lattice structure was selected over a grid of individual columns for two reasons; greater stiffness and because the unreinforced individual soil-cement columns are susceptible to brittle flexural failure. The lattice structures are designed so that the entire structure will tend rotate and translate before extensive cracking and brittle failure of the soil-cement walls. Therefore, the overall system behaviour is ductile.
The jet grout walls have been arranged to encourage soil to flow around the blocks of improved ground and to minimise stresses in the walls. The walls have been orientated recognising the skew of the approach embankments to the river and the effect this has on the direction of ground displacements and the orientation of the earth pressures on the lattice structures.
Analysis of the ground improvement was carried out using simplified pseudo-static methods as well as numerical 2D and 3D finite element methods. The 3D numerical modelling was undertaken using Plaxis 3D and included time history effective stress analysis of the ground, ground improvement blocks and the entire bridge structure together. Slump type analyses were used to model the spreading phase. Figure 6 shows the 3D finite element model.
Figure 6. 3D Finite element model
For the time history analysis, both orthogonal components of five earthquake records that are representative of the 1 in 2,500 year seismic hazard at the site were used in the analysis. The records, recorded at rock and stiff soil sites and applied at the base of the model, were scaled so that the geometric mean of the two component pseudo acceleration response spectra are a good fit to the design rock spectra at the site. For simplicity and to reduce the calculation time for each earthquake record, the 2 component acceleration time histories for each earthquake were applied separately in the 3D analysis in the bridge longitudinal direction only rather than applying both components together.
The UBC Sand model, fitted using cyclic triaxial test results, was used to model the cyclic response of the sands during the porewater pressure build up phase. Figure 7 shows the development of porewater pressure (reduction of effective stress) for one of the earthquake records at a depth of 8 m in the loose sands. Over damping was apparent once liquefaction was initiated. To guage the effect of overdamping on the response, some analysis was carried out where the soil model was changed to a linear elastic model with more realistic damping after liquefaction (using rayleigh damping).
Figure 7. Typical porewater pressure response

6
While not commonly done in New Zealand, the 3D analysis provided valuable insight into the behaviour of the overall soil, ground improvement, structure system and allowed the layout of the jet grout columns to be optimised. In particular, the finite element analysis was useful for assessing the:
• stresses within the jet grout walls,
• interaction between the bridge piles and the lattice structure walls,
• level of shear strain reduction in the soil encapsulated within the lattice structure,
• effects of the skew of the bridge to the river on the behaviour of the jet grout structures
• effects of increased ground stiffness on the response of the super structure,
• deformation and failure mechanism of the jet grout structures.
The reduction in lateral spreading at the bridge from the ground improvement and the bridge itself is depicted in Figure 8 which shows typical displacement contours calculated in the 3D FE model following a time history analysis. The effects of the skew of the bridge on the ground displacements is evident in Figure 8a. Although the overall response appears reasonable, with the constraints of having a continuous mesh restricting the potential for the ‘flow’ of soil around the blocks and numerical problems with large strains, the calculated displacements should be viewed with some skepticisim.
a) Plan: surface displacement contours (Contour interval = 40 mm, dark blue = 0 mm disp)
b) Section: Free field displacement contours (without the ground improvement or bridge), peak displacement is 670 mm (red shaded area 640 mm to 680 mm)
c) Section: Displacement contours along bridge centreline
Figure 8. Typical displacement contours along the bridge centreline
The column layout has been designed recognising the variability in strength of the jet grout, its low tension capacity and low ductility, as well as the uncertainty in the stresses imposed on the jet-grout
Direction earthquake was applied

7
walls in future strong earthquakes. Internal walls are orientated perpendicular to the river rather than in line with the embankment as our analysis indicated this to be the optimum orientation for limiting stresses within the jet grout walls. Based on experience and initial laboratory testing, the unconfined compressive strength of the jet grout was anticipated to be between 4 MPa and 15 MPa. An unconfined compressive strength of 2 MPa and a shear strength of 1 MPa were assumed for design. The improved ground has an area replacement ratio of 42% (the plan area of jet grout walls to the total area of the improved ground).
Figure 9 shows the calculated post earthquake deformed shape (exaggerated 50 times) and peak relative shear stresses (shear stress / shear strength) induced in the block for one of the time histories analysed. As can be seen in Figure 9, there is some bending of the front face and high shear stresses are expected near the toe of the blocks. A concentration of shear stress can also be seen approximately a third of the way up the western block at the interface between the loose and medium dense sands. Mean stresses and the minor principal stresses in the bock were also examined to determine peak compressive and tensile stresses in the block.
Figure 9. relative shear stresses and deformed shape of improved ground
7 CONSTRUCTION OF JET GROUT GROUND IMPROVEMENT
Jet grouting is a relatively new technology to New Zealand and equipment including grout mixes, high pressure pumps and an injection rig were brought from the USA for construction of the jet grout columns at South Brighton Bridge. Construction of jet grout columns involves drilling to the base of the column then mixing a cement slurry into the soil insitu with rotating high pressure jets that are located just above the drill head as the drill string is brought to the surface, the process is illustrated in Figure 10. Both single fluid (grout jets only) and double fluid (air and grout jets) have been used at South Brighton Bridge. The double fluid process is capable of producing larger diameter but generally weaker columns compared to the single fluid process.
Bending in front face High shear stress at toe
Deformed Shape (x 50)

8
Figure 10. Jet grouting Process
Before commencing the ground improvement works at the bridge abutments, a trial was carried out to determine additive dosage rates, fluid pressures, jet rotation speeds and step times to create thoroughly mixed, sufficiently strong and columns of sufficient diameter. The upper parts of the walls created in the trial were excavated and examined. Figure 11 shows the rig installing the trial columns and the columns exposed after the first trial. A number of boreholes were drilled in the trial sections to assess the diameter of the columns the amount of overlap, the strength of the grout and consistency of the mixing at depth. Sonic cross-hole testing was also undertaken on one of the columns to assess mixing consistency and the structural integrity of the columns.
Figure 11. Trial column construction
Getting a suitable column diameter and overlap in the medium dense to dense sands in the lower parts of the walls proved challenging. Pre-cutting using bentonite was employed for lower parts of the columns to get a larger diameter and improve overlap between columns in the medium dense to dense sands. Column strengths were higher than expected with 28 day unconfined compressive strengths ranging between 3.5 MPa and 77 MPa with an average strength of 20.0 MPa.
The ground improvement works at each abutment has been undertaken in two halves with one lane of the bridge remaining open during construction.
Single Fluid Double Fluid

9
8 CONCLUSIONS
The South Brighton Bridge in Christchurch was severely damaged by liquefaction and lateral spreading in the 2010 and 2011 Canterbury Earthquake sequence. The bridge is being repaired and retrofitted to restore its traffic carrying capacity and improve its performance in future earthquakes. Repairs include ground improvement at both abutments to protect them from liquefaction and lateral spreading in future earthquakes.
The ground improvement consists of stiff lattice wall structures formed with overlapping jet grout columns. The cells of the lattice structures constrain and confine the soils contained within their walls, reducing cyclic shear strain induced in the soils with strong earthquake shaking and therefore reducing their potential for liquefaction. The lattice structures effectively acts as large stiff caissons that reduce lateral spreading at the abutments.
Layout of the columns has been designed to encourage lateral spreading soil to flow around the ground improvement zones, reducing loads on and stresses within the ground improvement structures. Design of the ground improvement has taken into account the low tension capacity and low ductility of the grout walls and construction uncertainties. The lattice structures are designed so that the entire structure will tend rotate and translate before extensive cracking and brittle failure of the soil-cement walls. Therefore, the overall system behaviour is ductile. Furthermore, conservative grout strengths were assumed in the design and there is some redundancy in the structures.
The seismic performance of the ground, ground improvement and bridge system has been analysed using simplified pseudo static methods along with more advanced 2D and 3D finite element time history analysis. Despite some limitations, the 3D analysis proved a useful tool for understanding the behaviour of the overall soil-ground improvement-structure system, comparing the performance of different ground improvement concepts and optimising the design of the ground improvement.
Construction commenced in 2013 with the ground improvement constructed in stages so that one lane remains in service during construction. Getting suitable diameter and overlap of columns proved challenging during construction and pre-cutting of the columns using bentonite has been undertaken to increase column diameter in the medium dense to dense sands. Extensive quality assurance testing has been undertaken, including pre-construction trials to determine the best construction method. Coring of the columns and column interfaces has been undertaken to assess column diameter and overlap, the consistency of mixing and the strength of the columns. 28 day unconfined compressive strengths range between 3.5 MPa and 77 MPa with an average strength of 20.0 MPa.
REFERENCES
Baez, J. I. and Martin, G. R. 1994. “Advances in the Design of Vibro Systems for the Improvement of Liquefaction Resistance”, The 2nd Seismic Short Course on Evaluation and Mitigation of Earthquake Induced Liquefaction Hazards, Division of Engineering San Francisco State University and Department of Civil Engineering University of Southern California, 1-16.
Bradley, B., Cubrinovski, M., Dhakal, R.P., MacRae G.A., 2010, Probabilistic seismic performance and loss assessment of a bridge–foundation–soil system, Soil Dynamics and Earthquake Engineering 30 p 395–411.
Cubrinovski, M., 2012, Effects of Liquefaction on Bridge Foundations: Key Issues in Analysis and Design, New Zealand Bridges Conference 2012, Wellington
Cubrinovski, M., Haskell, J., Winkley, A., Robinson, K., and Wotherspoon, L. 2014. ”Performance of Bridges in Liquefied Deposits during the 2010–2011 Christchurch, New Zealand, Earthquakes.” J. Perform. Constr. Facil. 28, SPECIAL SECTION: Performance of Bridges under Critical Natural Hazards, 24–39.
Durgunoğlu, H.T. 2006 “Utilization of High Modulus Columns in Foundation Engineering Under Seismic Loadings,” US 8th National Conference on Earthquake Engineering and 100th Anniversary of San Francisco 1906 Earthquake, April 18-22, 2006, San Francisco, Ca., USA
GNS Science 2013, GeoNet http://www.geonet.org.nz/ (Accessed Nov 2013)
Keepa, C. 2012, South Brighton Bridge Jet Grout Ground Improvement Design Statement, Opus International
10
Consultants
Namikawa, T. Koseki, J. and Suzuki, Y 2007. Finite Element Analysis of Lattice Shaped Ground Improvement by Cement-Mixing for Liquefaction Mitigation, Soils and Foundations, Japanese Geotechnical Society, Tokyo, June, P559-576.
Martin, J. R., Mitchell, J. K., Olgun, C. G., Durgunoğlu, H. T., and Emrem, Öge C., 2001 “Performance of Improved Ground During the 1999 Turkey Earthquake,” Geotechnical Special Publ. No.113, Foundation and Ground Improvement, June 9-13, 2001 ASCE-Geo Institute, pp.565-579.
Martin, J. R., Olgun, C. G., Mitchell, J. K., Durgunoğlu, H.T., 2004 “High Modulus Columns for Liquefaction Mitigation”, ASCE, Journal of Geotechnical and Geoenvironmental Engineering, Vol. 130, No.6, June 2004.
Nguyen T. V., Rayamajhi D., Boulanger R. W., Ashford S. A., Lu J., Elgamal A., and Shao L., 2012, Effect of DSM Grids on Shear Stress Distribution in Liquefiable Soil, GeoCongress 2012 ASCE 2012
Olgun, G.C and Martin, J. R II 2008. Numerical Modelling of the Seismic Response of Columnar Reinforced Ground. Geotechnical Earthquake Engineering and Soil Dynamics IV, GSP181, American Society of Civil Engineers.
O.Matsuo, T.Shimazu, Y.Goto, Y.Suzuki, R.Okumura, M.Kuwabara 1996, Deep Mixing Method as a liquefaction prevention method, Grouting and Deep mixing p521
O’Rourke, T.T. and Goh, S.H 1997, Reduction of Liquefaction Hazards by Deep Soil Mixing, Proceedings of the NCEER-INCEDE Workshop, March 10-11, Buffalo, New York.
Porbaha A, Zen K, Kobayashi M, 1999, Deep mixing technology for liquefaction mitigation, Journal of infrastructure systems, p21 – 34
Robinson, K., Bradley, B.A., Cubrinovski, M., 2012, Analysis of Liquefaction-Induced Lateral Spreading Data from the 2010 Darfield and 2011 Christchurch Earthquakes, Proc. NZSEE Conference 2012
SCIRT 2012 Detailled Design Report, Bridge Street Bridge R101, Doc number 10724-DE-ST-RP-0001, Rev 2
Siddharthan R. V., Porbaha A. 2008. Seismic response evaluation of sites improved by deep mixing, Part I: Proposed approach Proceedings of The Ice - Ground Improvement , vol. 161, no. 3, pp. 153-162