south asia drought monitoring system (sadms)
TRANSCRIPT

SOUTH ASIA DROUGHT MONITORING SYSTEM
(SADMS)
Giriraj Amarnath++
Research Group Leader: Water Risks and Disasters (WRD)
International Water Management Institute (IWMI), Sri Lanka
26 September 2017
IWMI, Colombo, Sri Lanka
Ph
oto
: Sam
urd
hi R
anas
ingh
e /
IWM
I

Content
2
1. Problem Statement and History of SADMS
2. Drought and Remote Sensing
3. SADMS Project Approach
4. Case Studies, Applications, Portal
5. Experimental drought forecast, SM drought indices
6. New proposal, Synergies & Interlinkages

2005
South West Asia Drought Monitor
US State Department Regional Environment Office
2014
South Asia Drought Monitor (SADMS) –
IDMP(WMO/GWP), CGIAR CCAFS, WLE, Japan’s MAFF
Late 2016 - Present
Moving from monitoring to management including contingency plans and insurance application
CGIAR WLE, Japan’s MAFF and ICAR-GOI
History of drought programme implemented by IWMI
INDIA
Drought Management Plans
and Policy guidelines

SOUTH ASIA DROUGHT MONITORING SYSTEM (DMS):
OVERVIEW
• Goal - build climate resilience, reduce economic and social losses,
and alleviate poverty in drought - affected regions in SA through an
integrated approach to drought management
• SADMS Integrates remote sensing and ground truth data (vegetation
indices, rainfall data, soil information, hydrological data)
• SADMS supports regionally coordinated drought mitigation efforts that
can be further tailored to national level
• SADMS is a partnership initiative of IWMI, IDMP (WMO / GWP),
CGIAR CRP’s (CCAFS / WLE), Japan’s MAFF and Governments in
SA.

April 2014
SADMS Concept
South Asia Climate Outlook Forum (SACOF-5) Pune, India
April 2015
Prototype SADMS for pilot countries, Validation with DoM, DMC, ID
SACOF-6
Dhaka, Bangladesh
2016
Operational implementation of SADMS, Portal, Outlook issues, experimental drought forecasting
SACOF-7, Colombo, Sri Lanka & IDMP, Geneva
2017
Regional consultative workshop with SA partners; Pilot drought issues with GOI/ICAR; Linking drought contingency plans, CSA and policy guidelines
SADMS support from SA Partners and ICAR-GOI Special project;
SADMS Process and Implementation

Satellite-derived rainfall, temperature,
soil moisture
Satellite Vegetation Condition
Calculate Monitoring Integrated Drought Severity Index (IDSI)
Current Drought Risk
Ensemble predictions of rainfall, soil
moisture, runoff
Satellite-derived rainfall, temperature,
soil moisture
Calculated Forecasted Drought Severity
Future Drought Risk
Collection of socio-economic information
Access to Monitoring and Forecasting
Drought Condition
Smartphone Application
Socioeconomicvulnerability
Visualization and analysis of
monitoring/forecasted drought condition and
socio-economic conditions
IWMI’s Drought Monitoring Framework
SADMS SADEWS Socio-economic Drought
DSS, IoT

Team Members
Giriraj, AmarnathNiranga, AlahacoonKarthikeyan, MatheswaranYoshimoto, ShuheiAlok, SikkaIhalawela, AjanthaSubasinghe, ChandimaSiddiqui, SalmanPeejush, Pani*Gurminder, Bharani*Vladimir, Smakhtin*
IWMI
Birla Institute of Technology (India)C. Jeganathan Saptarshi Mondal
Symbiosis Institute of Geoinformatiics (India)T. P. Singh
CNR-IRPI (Italy)Luca Brocca, Paolo Filippucci, Angelica Tarpanelli, Christian Massari, Luca Ciabbatta
Vienna University of Technology (TU Wien) (Austria)Wolfgang Wagner, Hochstöger Simon, Pfeil Isabella
External partners
*former IWMI Colleagues
We would like to acknowledge: WMO, GWP-CWP, DoM, DoA, MoDM, IARI, MNCFC, NDMC, IDMP for continued support and cooperation.

1. Problem Statement
8

I. Drought
• Deficient precipitation compared to statistical multi-year average conditions (NDMC, 2008)
• significant economic, environmental and social impacts – direct and indirect
• among the most costly of all natural disasters
• ranks first in degree of severity, length of event, total areal extent and social effect when compared to other hazards (Wilhite, 2000, p. 6)
• Since 1980 more than 2.2 billion people were affected by more than 561 drought events accounting 150billion economic damages (EM-DAT, 2017)
• Four types of droughts
• Metorological
• Agricultural
• Hydrological
• Socio-economic
9
Photo: Samurdhi Ranasinghe / IWMI

Tim
e (d
ura
tio
n)
Definition of drought: Four different types

Drought risk assessment
Hazard: Characterization of drought Spatial extent Magnitude / severity Frequency Intensity Duration ...
Photo: Daniel Asaré-Kyei
Vulnerability: Characterization of drought effects The characteristics and circumstances of a
community, system or asset that make it susceptible to the damaging effects of a hazard.
http//badische-zeitung.depiece03b0a89761909143.jpg
Photo: Daniel Asaré-Kyei
Photo: Daniel Asaré-Kyei
11
Source: UN/ISDR http://www.unisdr.org/eng/library/lib-terminology-eng.htm
Photo: Hamish John Appelby / IWMI

2. Drought Monitor using remote sensing
12

II. Drought Indicators and Remote Sensing
Drought Hazard vs. Drought Risk
• Drought Hazard: meteorological parameters (Prec., Temp., PET, SM)
• Palmer Drought Severity Index (PDSI, Palmer 1965)
• Standardized Precipitation Index (SPI; Guttermann, 1998)
• Crop Moisture Index (CMI; Palmer 1968)
• Surface Water Supply Index (Shafer and Dezmann, 1982)
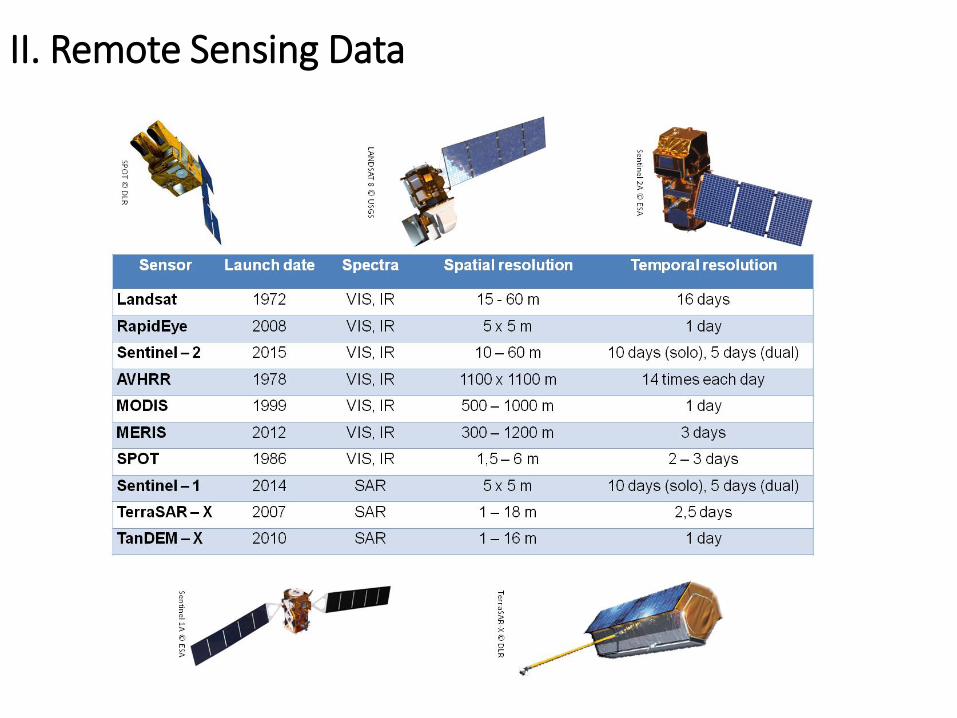
II. Remote Sensing Data

II. Remote Sensing Data

II.Drought Indicators and Remote Sensing
16
Example: Agricultural Stress Index System (ASIS): Global and Country Analysis

3. SADMS approach
17

Development of Integrated Drought Severity Index (IDSI)
Standardized drought index calculation
VCI TCI PCI
MOD11A2(1km Land Surface
Temperature)
LST Bandextraction
TRMM 3B42(27km precipitation
estimates)
8 day accumulation
Lag calculation(previous + current)
Time-Series Precipitation
Map and statistics generation
GLOBELAND (30m)
LULC 2014 (56m)
Waterbody Mask (30m)
Multi-source Merging
Scale and projection matching
Mask of Agriculture and non-agriculture
areas
RedBand
NIRBand
NDVICalculation
MOD09A1(500m Surface Reflectance)
INPUTDATA
DATA PRE-PROCESSING
DROUGHT MONITORING
DROUGHT ASSESSMENT
LST
Composite of long-term stack images
Identification of Long-term anomalies
NDVI LST TRMM
TRMMNDVI
Notes: MOD09A1 – MODIS Surface Reflectance of every 8-Day product at 500m resolution; MOD11A1 – MODIS Land Surface Temperature (LST) daily product at 1,000m resolution; TRMM – Tropical Rainfall Measuring Mission; LULC NRSC – Land Use and Land Cover from National Remote Sensing Centre; Water body mask from Landsat images; NDVI – Normalized Difference Vegetation Index; VCI – Vegetation Condition Index; TCI – Temperature Condition Index (TCI); Precipitation Condition Index (PCI), IDSI – Integrated Drought Severity Index
Ground truth
Historical database and maps
Validation
LST
Time Series creation
NDVI LST
NDVI
Noise reduction & Fourier smoothing
INPUTDATA
DATA PRE-PROCESSING
DROUGHT MONITORING
DROUGHT ASSESSMENT
Drought Monitoring Approach

DMS validation from maps to field scale

Characterizing Drought Severity

Characterizing Drought Severity
Category Description Possible impacts IDSI Ranges
D4 DS Extreme Exceptional and widespread crop/pasture lossesShortages of water in reservoirs, streams, and wells creating water emergencies
< 5 (with very low values of VCI, PCI and TCI)
D3 DS Moderate
Major crop/pasture lossesWidespread water shortages or restrictions
5 – 10 (with low values of VCI, PCI and TCI)
D2 DS Severe Crop or pasture losses likelyWater shortages commonWater restrictions imposed
10 – 15 (with moderate values of VCI,low PCI and TCI)
D1 Stress Some damage to crops, pasturesStreams, reservoirs, or wells low, some water shortages developing or imminentVoluntary water-use restrictions requested
15 – 20 (with moderate VCI, low PCI and moderate TCI)
D0 Watch Going into drought:short-term dryness slowing planting, growth of crops or pasturesComing out of drought:some lingering water deficitspastures or crops not fully recovered
20 – 40 (with moderate values of VCI,PCI and TCI)
Normal Normal >40 (vegetation growth is normal with essential variables with a function of high VCI-TCI-PCI)
Healthy Healthy >60 (vigor vegetation with strong correlation on climate indicators)

Drought Indices between 2001 to 2015 for Yala season
2001 2002 2003 2004 2005
2006 2007 2008 2009 2010
2011 2012 2013 2014 2015

Comparison of Good Year (2003) and Bad year (2014)

2001
2012
2014
Rainfall anomaly DMC Reference MapDrought extent Crop yield anomaly
Links of drought characteristics to agricultural production losses for the Yala seasons (SW Monsoon)

Rajasthan Maize
VCI, PCI and Drought Indices for drought year (2009) and normal year
(2010), Rajasthan
VCI vs. Crop Yield SPI vs. IDSI
YAI vs. IDSI
• Average VCI of rain-fed season was compared with yield of major rain-fed (kharif) crops which reveals that a good agreement
• 3-month SPI also had a good correlation with IDSI for drought year and normal year
• High correlation co-efficient (r) was found to be 0.71, 0.72 and 0.71 (p = 0.05) for sorghum, pearl millet and maize respectively which reveals that there is a strong positive correlation present between VCI and yield of major kharifcrops
Crop type: Maize

SOUTH ASIA DROUGHT MONITOR SYSTEM (SA-DMS)
• First of its kind to establish for entire South Asia using multisource remote sensing observations;
• Historical drought risk mapping and assessment covering SA countries (2000 – Current);
• IDSI allows better understanding on drought frequency, duration over the 16years;
• Products are useful tools in drought mitigation studies and in decision-making process;
2015 field observations in Jalna, Maharashtra

Current status of drought condition over South Asia and Rainfall
distribution over India
• Drought condition over South Asia seems relatively low compare to the previous years of 2012, 2014 and 2016.
• Areas under drought condition includes India(Southern Karnataka, Marathawada, Madhya Maharashtra, East & West MP), Sri Lanka (North Central, northwestern and eastern provinces), parts of Southern Nepal
Source: WMO
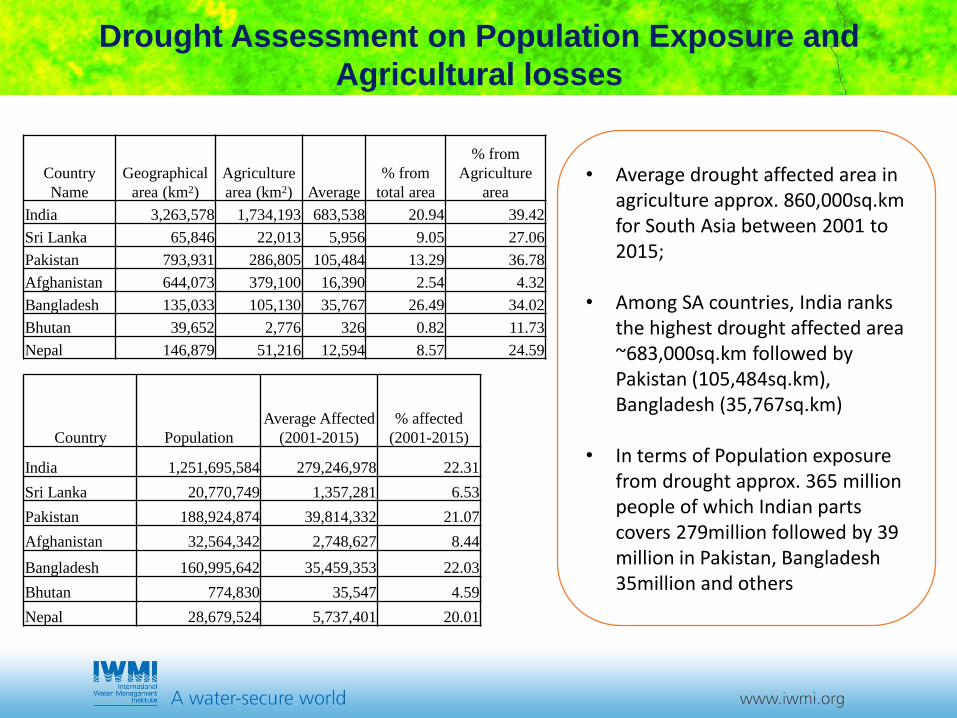
Drought Assessment on Population Exposure and
Agricultural losses
Country Population
Average Affected
(2001-2015)
% affected
(2001-2015)
India 1,251,695,584 279,246,978 22.31
Sri Lanka 20,770,749 1,357,281 6.53
Pakistan 188,924,874 39,814,332 21.07
Afghanistan 32,564,342 2,748,627 8.44
Bangladesh 160,995,642 35,459,353 22.03
Bhutan 774,830 35,547 4.59
Nepal 28,679,524 5,737,401 20.01
Country
Name
Geographical
area (km2)
Agriculture
area (km2) Average
% from
total area
% from
Agriculture
area
India 3,263,578 1,734,193 683,538 20.94 39.42
Sri Lanka 65,846 22,013 5,956 9.05 27.06
Pakistan 793,931 286,805 105,484 13.29 36.78
Afghanistan 644,073 379,100 16,390 2.54 4.32
Bangladesh 135,033 105,130 35,767 26.49 34.02
Bhutan 39,652 2,776 326 0.82 11.73
Nepal 146,879 51,216 12,594 8.57 24.59
• Average drought affected area in agriculture approx. 860,000sq.km for South Asia between 2001 to 2015;
• Among SA countries, India ranks the highest drought affected area ~683,000sq.km followed by Pakistan (105,484sq.km), Bangladesh (35,767sq.km)
• In terms of Population exposure from drought approx. 365 million people of which Indian parts covers 279million followed by 39 million in Pakistan, Bangladesh 35million and others

4. Experimental SADEWS and SM Drought Indices
29

SRI: Hydrological drought severitySSI: Agricultural drought severity
Forecasting impact on agriculture
Near-real-time rainfall estimate
Rainfall forecast by NOAA GCFSand IITM
https://sites.google.com/a/iitgn.ac.in/high_resolution_south_asia_drought_monitor/
South Asia Drought Forecasting and Early Warning
(SADEWS)
Joint Collaboration of IIT-GN in model development and exploring with IITM/IMD to obtain weather forecast data

Current Condition: 10 July 2017
Forecast Period : 17 July and 25 July 2017
Standardized Soil Moisture and Runoff Index
for regional drought and early warning
Disclaimer: The designations employed and the presentation of material in this information product do not imply the expression of any opinion whatsoever on the part of the International Water Management Institute (IWMI) and its partners concerning the legal or development status of any country, territory, city or area or of its authorities, or concerning the delimitation of its frontiers or boundaries. The views expressed in this information product are those of the author(s) and do not necessarily reflect the views or policies of IWMI.
Summary:
The experimental drought forecast products forresearch/scientific use based on 10th July 2017 initialcondition. These forecast products are based on the realtime weekly operational forecast generated by GlobalENSemble (GENS), a weather forecast model made up of21 separate forecasts, or ensemble members developedat The National Centers for Environmental Prediction(NCEP), NOAA.
Drought Forecast Outlook:
• The initial condition has improved over Telangana,Andhra Pradesh, Rajasthan, Western UP and North-eastern states..
• Initial condition on the Soil Runoff Index (SRI) explainssimilar trend to SSI.
• Some level of dryness is expected in the followingweeks over central parts of the region such as MP,eastern Gujarat and Jharkhand.
• The leeward side of the western ghats along thesouthern Maharashtra seems to be progressingtowards dryness.
• In reference to IMD actual rainfall for India, severaleast-central states are in deficit rainfall conditionwhich is affecting the crop productivity and advanceneed for State and Local authorities for betterplanning and coordination on water resourcesmanagement.
The SADEWS is regional scale early warning system developed as a collaborative project between International Water
Management Institute (IWMI) and Indian Institute of Technology – Gandhi Nagar (IIT-GN).
South Asia Drought Early Warning System (SADEWS)

SA-DEWS SWADI IDSI
• South Asia-Drought Early Warning System (SA-DEWS) is an integrated approach based on satellite estimates of rainfall temperature, wind and soil
type utilized in VIC model and the derived outputs namely Standardized Precipitation Index (3-Month), Standardized Soil Moisture Index (SSI) and
Standardized Runoff Index (SRI).
• Soil Water Anomaly Drought Index (SWADI) is derived from satellite based decadal soil moisture product of ASCAT provided by EUMETSAT.
• Integrated Drought Severity Index (IDSI) is an integrated index that has been formulated using VCI, TCI & PCI at 500m resolution for agricultural
land-use over South Asia.
• It can be observed, that during this time period all the three indices shows a close relation between each other. The peninsular India has reviving
well from the drought situation. Parts of Bihar, Jharkhand and UP is facing some scarcity of rainfall which is well reflected in all the three indices.
Some parts of Tamil Nadu is still facing moderate drought like scenario. North and Eastern parts of Sri Lanka is severely facing water stress resulting
into crop damage and shortage of ground water.
SADMS – Drought Forecasting, Early Warning and Now casting

Soil Moisture based Drought Index
• Soil Water Index (SWI), developed by Europe's
Copernicus Programme was used to calculate
Soil Water Anomaly Drought Index (SWADI)
• SWADI involves the use of radar backscatter measurements from the Advanced Scatterometer(ASCAT) aboard the EUMETSAT MetOp satellite.
• Over the last 10 days, soils in parts of the region have been much drier than usual. Nowhere is current soil moisture as abnormally low as in Northern Sri Lanka and India’s Tamil Nadu state.
• Although such conditions are a regular occurrence, the current situation stands out for its intensity and persistence, as was also the case during severe droughts in 2012 and 2014.
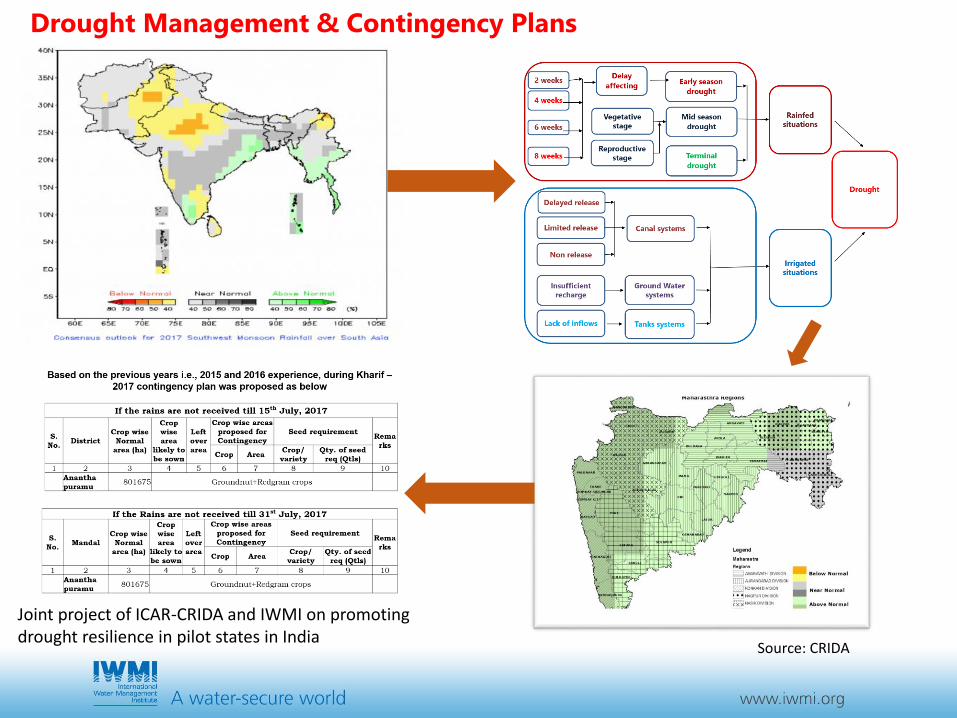
Drought Management & Contingency Plans
Joint project of ICAR-CRIDA and IWMI on promoting drought resilience in pilot states in India
Source: CRIDA

Crop Sensor measuring vegetation index
Stress condition of Foxtail Millet
Drought Management & Contingency Plans

5. SADMS Tools, Portal and Outreach
36

Drought Monitor tool (DMS)
DMS tool was developed using ESRI ArcGIS interface
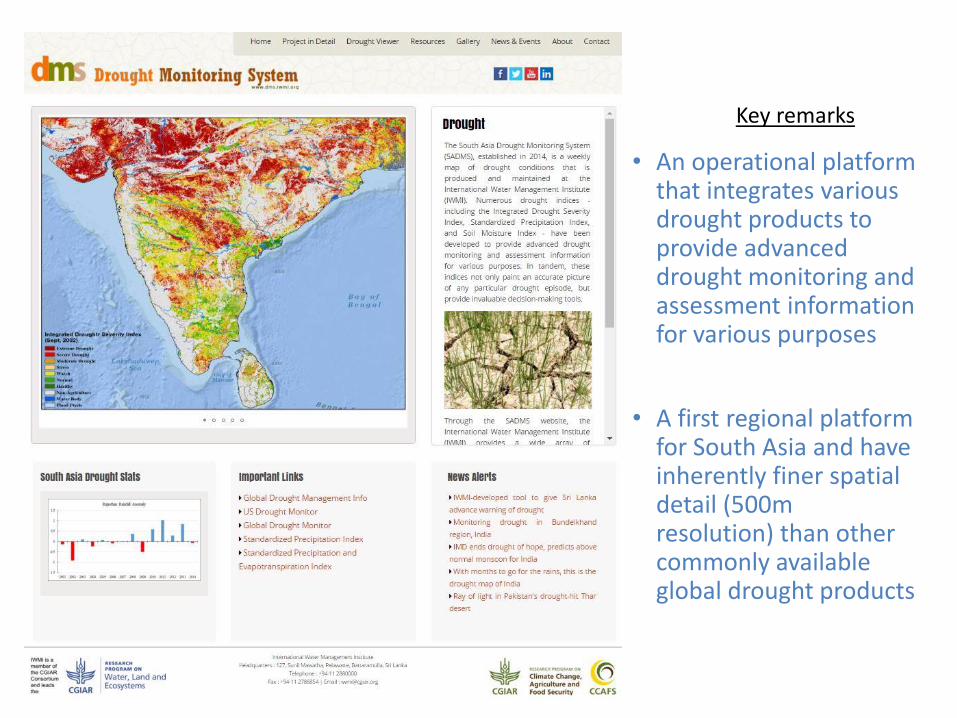
• An operational platform that integrates various drought products to provide advanced drought monitoring and assessment information for various purposes
• A first regional platform for South Asia and have inherently finer spatial detail (500m resolution) than other commonly available global drought products
Key remarks
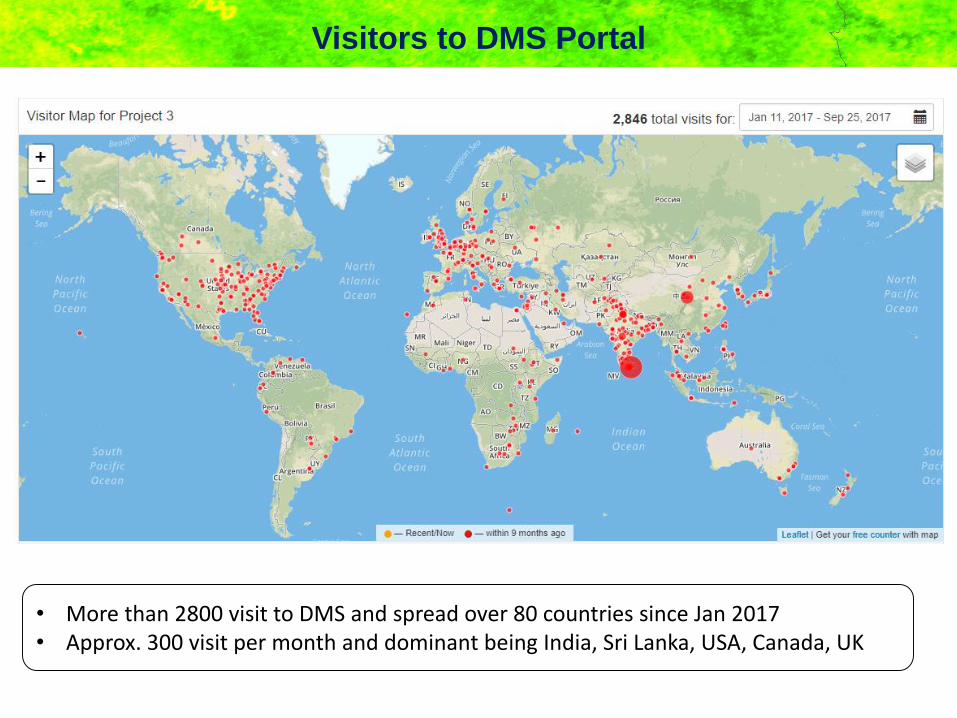
Visitors to DMS Portal
• More than 2800 visit to DMS and spread over 80 countries since Jan 2017• Approx. 300 visit per month and dominant being India, Sri Lanka, USA, Canada, UK

Publications

6. SADMS Synergies and Next Steps
41

Linking SADMS with the national to global indicators

Addressing the SFDRR
43
Understanding drought risk and drought Preparedness;National Targets on indicators;

Sustainable Development Goals: the relevance of space technology
44
SADMS

New ProposalComprehensive Drought Management Plan (CDMP) – Sri Lanka
INTEGRATEDDROUGHT MANAGEMENT
SADMS MONITORING & EARLY WARNING
Drought status
MITIGATION, PREPAREDNESS& RESPONSE
Actions and measures to mitigate drought impacts and prepare to respond to drought emergencies more effectively
VULNERABILITY & IMPACT ASSESSMENT
Who/What is at RISK & Why?
Prioritization/ Ranking
DROUGHT CHARACTERIZATION STUDIES
FEEDBACK
Source: IDMP

Vulnerability and Risk Assessment
Drought vulnerability analysis
Drought risk assessment
Evaluation of indicator
transferability
Derivation of vulnerability indicators, combine information on hazard, exposure and vulnerability to assess overall drought risk and
evaluate transferability of indicators between different countries.
Vulnerability indicators of the social-agricultural
system
Risk of people affected and loss in the
agricultural sector
Unified set of indicators versus country specific
indicators
Linking SDG, SFDRR to national indicators to measure and mitigation drought impacts

Clearinghouse
Evolution of improved
knowledge base
Outcomes
Source: IDMP / IWMI

MONITORING/EARLY WARNINGPlans for 2017-2019
Drought User Service (SL-DMS)
• system which enables more accurate and efficientdrought monitoring for the entire Sri Lanka
Improvement of the drought monitoring
• an innovative tool integrating all available data,including large volume of remote sensing productsand serving the authorities to monitor, forecastand respond during drought development fasterand with higher precision

Plans for 2017-2019
Drought Risk Assessment • State-of-the-art analysis • Common methodology for drought risk assessment• Mapping of risk – regional atlas of drought risk
Drought Impact Assessment • common methodology for near real-time drought impact
assessment (reporters)• common methodology for near real-time drought impact
forecast• establishment of network of reporters as additional source of
information for drought impacts in agriculture
VULNERABILITY & IMPACT ASSESSMENT
Unification of drought impacts and risk assessment

Plans for 2017-2019 MITIGATION & PREPAREDNESS
Overcoming gaps in decision-making processes in drought managementImprove dialogue between the scientific and policy-making communities
Improvements of the drought management cycle – using Guidelines for preparation of the DMP
• update current status in the region
• template for institutional mapping
• techniques for identification of the gaps in the drought management processes
• preparation of the model/scheme on how should drought management in the region (countries) work
National and regional consultations/workshops, etc.
• better understanding and usage of the CDMP SL (and SADMS) products
• demonstrating positive effect of changed behavior (pro-active approach)
