south africa’s current road backlogs · slide 21 strengthening/regravel backlog scenario notes:...
TRANSCRIPT

Slide 1
South Africa’s Current Road Backlogs
SARF/IRF 2014
2 September 2014
L Kannemeyer

Slide 2

Slide 3
South African Road Network - 2014
Un-Proclaimed Roads = Public roads not formally gazetted by any Authority
Authority Paved Gravel Total
SANRAL 21,403 0 21,403
Provinces - 9 47,348 226,273 273,621
Metros - 8 51,682 14,461 66,143
Municipalities 37,691 219,223 256,914
Total 158,124 459,957 618,081
Un-Proclaimed (Estimate) 131,919 131,919
Estimated Total 158,124 591,876 750,000

Slide 4
South Africa has the 10th
Longest Total and 18th
Longest Paved Road
Network in the World
Roads Represents one of
the largest public
infrastructure
investments in most
countries
RSA Road Replacement
Cost
>R2 Trillion
World 64 285 009
1 United States 6 586 610
2 India 4 689 842
3 China 4 237 500
4 Brazil 1 751 868
5 Japan 1 210 251
6 Canada 1 042 300
7 Russia 982 000
8 France 951 200
9 Australia 823 217
10 South Africa 750 000
11 Spain 681 298
12 Germany 644 480
13 Sweden 572 900
14 Italy 487 700
15 Indonesia 437 759
16 Turkey 426 906
… … …
34 Dem Rep of Congo 153 497
45 Zimbabwe 97 267
54 Zambia 91 440
55 Tanzania 91 049
70 Madagascar 65 663
80 Angola 51 429
72 Namibia 64 189
98 Mozambique 30 331
104 Botswana 25 798
122 Malawi 15 451
148 Lesotho 7 438
161 Swaziland 3 594
173 Mauritius 2 066
193 Seychelles 508
1 449 720
Rank Country
Road
length
(km)
SADC Total

Slide 5

Slide 6
Paved Provincial – 2013 Visual Condition Index
Type Year V-Good Good Fair Poor V-Poor
Length (km) 2013 8,104 18,016 25,064 13,946 4,355
% 2013 11.66% 25.93% 36.07% 20.07% 6.27%
Slide 7
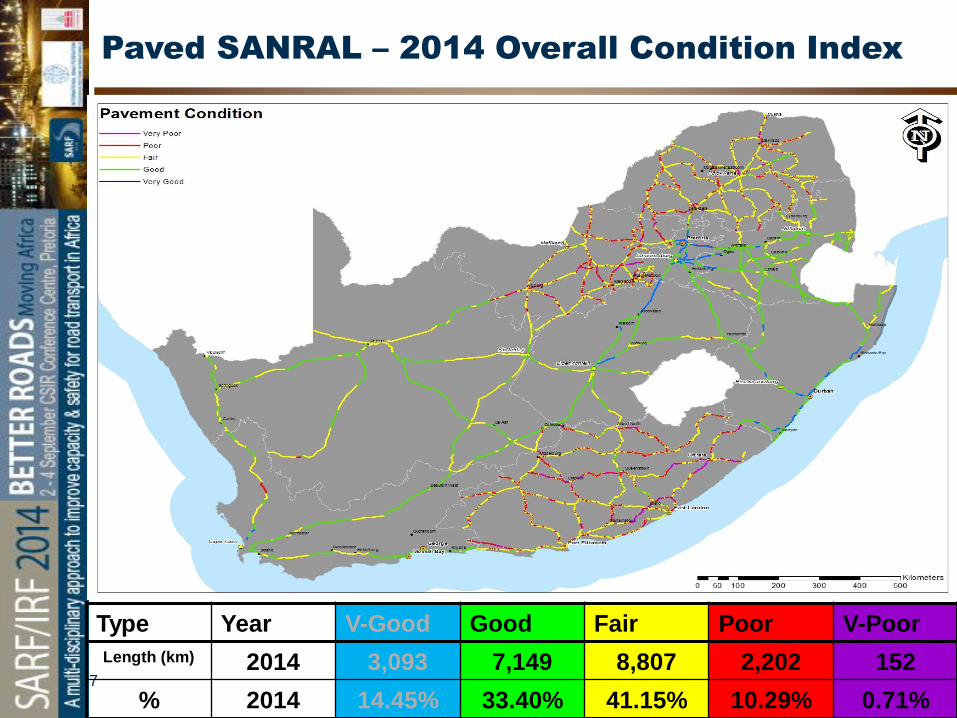
Paved SANRAL – 2014 Overall Condition Index
Type Year V-Good Good Fair Poor V-Poor
Length (km) 2014 3,093 7,149 8,807 2,202 152
% 2014 14.45% 33.40% 41.15% 10.29% 0.71%

Slide 8
0% 20% 40% 60% 80% 100%
SANRAL
EASTERN CAPE
FREESTATE
GAUTENG
KWAZULU NATAL
LIMPOPO
MPUMALANGA
NORTH WEST
NORTHERN CAPE
WESTERN CAPE
Percentage of Network
Au
tho
rit
y
Very Poor (km)
Poor (km)
Fair (km)
Good (km)
Very Good (km)
Paved Network VCI Summary 2009
Slide 9
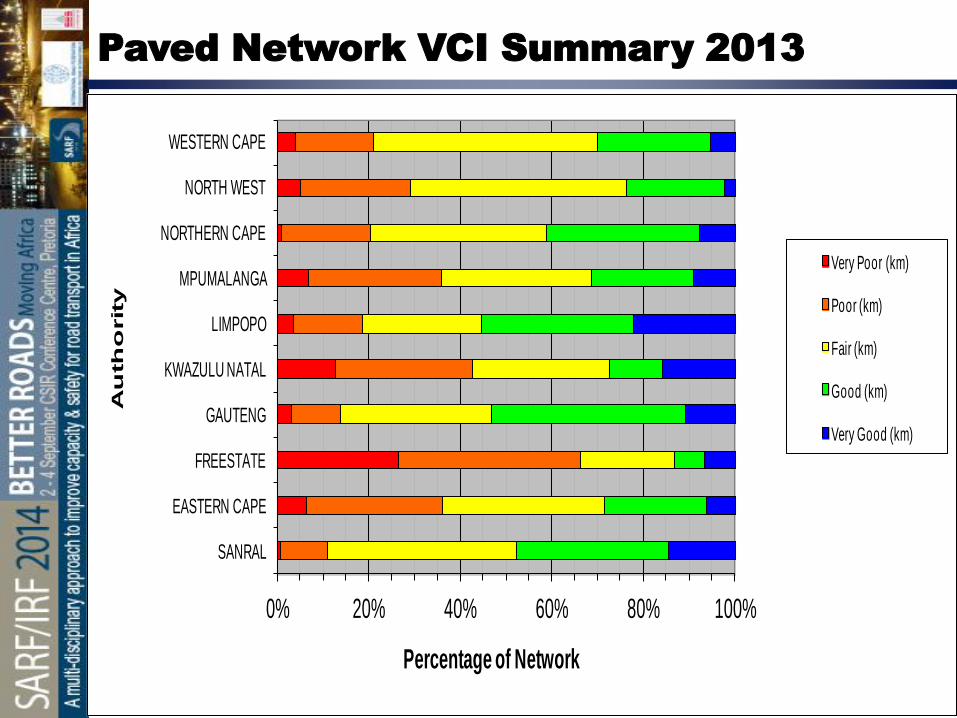
Paved Network VCI Summary 2013
0% 20% 40% 60% 80% 100%
SANRAL
EASTERN CAPE
FREESTATE
GAUTENG
KWAZULU NATAL
LIMPOPO
MPUMALANGA
NORTHERN CAPE
NORTH WEST
WESTERN CAPE
Percentage of Network
Au
th
orit
y
Very Poor (km)
Poor (km)
Fair (km)
Good (km)
Very Good (km)

Slide 10
Gravel – Provincial VGI 2009
Type Year V-Good Good Fair Poor V-Poor
Length 2004-08 1,981 13,863 35,344 33,219 19,327
% 2004-08 1.91% 13.36% 34.07% 32.02% 18.63%

Slide 11
Gravel – Provincial VGI 2013
Type Year V-Good Good Fair Poor V-Poor
Length (km) 2013 1886 9,331 34,993 56,737 37,394
% 2013 1.34% 6.65% 24.93% 40.43% 26.64%

Slide 12
Gravel Network VGI Summary 2009
0% 20% 40% 60% 80% 100%
EASTERN CAPE
FREESTATE
GAUTENG
KWAZULU NATAL
LIMPOPO
MPUMALANGA
NORTH WEST
NORTHERN CAPE
WESTERN CAPE
Percentage of Network
Au
tho
rit
hy
Very Poor (km)
Poor (km)
Fair (km)
Good (km)
Very Good (km)

Slide 13
Gravel Network VGI Summary 2013
0% 20% 40% 60% 80% 100%
EASTERN CAPE
FREESTATE
GAUTENG
KWAZULU NATAL
LIMPOPO
MPUMALANGA
NORTHERN CAPE
NORTH WEST
WESTERN CAPE
Percentage of Network
Au
tho
rit
hy
Very Poor (km)
Poor (km)
Fair (km)
Good (km)
Very Good (km)

Slide 14
Roughness (IRI) – Paved 2013
0% 10% 20% 30% 40% 50% 60% 70% 80% 90% 100%
SANRAL
EASTERN CAPE
FREESTATE
GAUTENG
KWAZULU NATAL
LIMPOPO
MPUMALANGA
NORTHERN CAPE
NORTH WEST
WESTERN CAPE
% of Paved Network
2013 Roughness (IRI)
Very Poor (>4.21 IRI) Poor (3.01-4.2 IRI) Fair (2.21-3.0 IRI) Good (1.51-2.20 IRI) Very Good (<1.5 IRI)

Slide 15
Visual Paved Condition/Traffic Relationship
0
1000
2000
3000
4000
5000
6000
7000
8000
9000
<= 250 251 - 500 501 - 1000 1001 - 2000 2001 - 5000 5001 - 10000 > 10000
Vis
ua
l C
on
dit
ion
In
de
x -
Kil
om
etr
e
Traffic (ADT)
Very Poor (<30) Poor (31-50) Fair (51-70) Good (71-85) Very Good (>85)

Slide 16
Roughness (IRI)/Traffic Relationship
0
1000
2000
3000
4000
5000
6000
7000
8000
9000
<= 250 251 - 500 501 - 1000 1001 - 2000 2001 - 5000 5001 - 10000 > 10000
Inte
rna
tio
na
l R
ou
gh
ne
ss
In
de
x (
IRI)
-K
ilo
me
tre
Traffic (ADT)
Very Poor (>4.21) Poor (3.01-4.2) Fair (2.21-3.0) Good (1.5-2.2) Very Good (<1.5)

Slide 17
Rut Depth/Traffic Relationship
0
1000
2000
3000
4000
5000
6000
7000
8000
9000
<= 250 251 - 500 501 - 1000 1001 - 2000 2001 - 5000 5001 - 10000 > 10000
Ru
t D
ep
th -
Kil
om
etr
e
Traffic (ADT)
Very Poor(>20.01) Poor(15.01-20) Fair (10.01-15) Good (5.01-10) Very Good (<5)

Slide 18
Vehicle km Travel – Paved 2013
0 5 000 000 000 10 000 000 000
EASTERN CAPE
FREESTATE
GAUTENG
KWAZULU NATAL
LIMPOPO
MPUMALANGA
NORTHERN CAPE
NORTH WEST
WESTERN CAPE
Vehicle km Travel per Year
Au
tho
rit
hy
Very Poor (VCI)
Poor (VCI)
Fair (VCI)
Good (VCI)
Very Good (VCI)

Slide 19
0
5 000
10 000
15 000
20 000
25 000
30 000
<= 20 21 - 50 51 - 100 101 - 200 201 - 300 301 - 400 401 - 500 501 - 600 601 - 700 701 - 800 > 800
Vis
ua
l G
rave
l In
de
x -
Kil
om
etr
e
Traffic ADT
Very Poor (<30) Poor (31-50) Fair (51-70) Good (71-85) Very Good (>85)
Visual Gravel Condition/Traffic Relationship

Slide 20
Road Backlogs ?
Which Backlog:
• Routine Maintenance – Potholes, Crack Sealing, Grass Cutting, Drainage ?
• Periodic Maintenance – Reseal/Overlays
• Rehabilitation/Strengthening – Reworking existing layers + new base
• Capacity Expansion – Additional Lanes
• Upgrading – Gravel to Surface Standard
• New – Brown/Green Fields construction
How do you Quantify the Backlog:
• Roads in poor to very poor condition ?
• Using what criteria - VCI, IRI, Rut, Combination ?
• Using which limits – Is IRI > 4.21 not acceptable on surface road carrying < 250
vehicles per day ?

Slide 21
Strengthening/Regravel Backlog Scenario
Notes:
1. Based on actual visual condition data for 2013 for SANRAL and Provinces, and 2009
for Metros and Municipalities.
2. Based on length of roads in Poor to Very Poor Condition base on Visual Condition
Index.
3. The above backlog excludes backlogs related to periodic resurfacing of the network,
upgrade of gravel roads to surfaced standard, addition of additional lanes to alleviate
congestion and construction of new roads.
4. Also assumes that each road in poor to very poor condition will be economically
viable to strengthen / regravel (Traffic).
2013 Estimate (VCI)
% Length Cost % Length Cost Length Cost
SANRAL 11.86% 2 354 R 18 832 000 000 0.00% 0 R 0 2 354 R 18 832 000 000
Provinces - 9 32.51% 15 947 R 127 574 080 000 65.67% 94 131 R 18 826 140 000 110 077 R 146 400 220 000
Metros - 8 4.12% 2 127 R 10 635 000 000 8.48% 1 227 R 245 315 473 3 354 R 10 880 315 473
Municipalities 3.62% 1 363 R 4 089 000 000 28.54% 86 245 R 17 249 009 106 87 608 R 21 338 009 106
Total Backlog 21 791 R 161 130 080 000 181 602 R 36 320 464 579 203 393 R 197 450 544 579
Strengthening/Regravel Backlog: Roads in Poor to Very Poor Condition (2013)
AuthorityTotalGravelPaved

Slide 22
Budget Requirement versus Allocation
Notes:
1. Strengthening Backlog addressed over 5 years, and regravel over 10years.
2. The above budget excludes backlogs related addition of additional lanes to alleviate
congestion and construction of new roads.
3. The above budget excludes un-proclaimed network.
4. Allocations refer to national treasury direct allocations, and do not necessarily
reflects actual expenditure on roads.
5. To close the above gap using the fuel levy, will require an additional R2.15 per
litre of fuel (Current Fuel Levy R2.245/l for petrol and R2.095/l for diesel)
6. To Sustain Only (no backlog) will require additional R1.35 per litre.
2013 Estimate (VCI)
Sustain Backlog Total
SANRAL 21 403 R 12 189 580 000 R 0 R 12 189 580 000 R 11 916 947 000 97.76%
Provinces - 9 190 693 R 19 320 782 880 R 8 079 861 600 R 27 400 644 480 R 9 361 000 000 34.16%
Metros - 8 66 143 R 13 086 160 700 R 2 176 063 095 R 15 262 223 794 R 10 190 000 000 66.77%
Municipalities 339 849 R 14 037 274 500 R 4 267 601 821 R 18 304 876 321 R 2 533 000 000 13.84%
Totals km 618 088 R 58 633 798 080 R 14 523 526 516 R 73 157 324 595 R 34 000 947 000 46.48%
%
Estimated Maintenance Budget Requirement per Year
Authority Total Network Maintenance Budget Per Year for 5 Years
2014/15
Allocation

Slide 23
SANRAL Capacity Expansions/New
Project Initial Capital Costs (R’000 2014R)
GFIP Phase 2 (New Routes) R 25 768 840
GFIP Phase 3 (Upgrades) R 17 655 160
N1/N2 Winelands R 9 316 100
N2 Botrivier to Port Elizabeth R 11 272 540
N2 Wild Coast (Ndwalane to Mtamvuna River) R 7 578 656
N2 Durban South to North R 7 847 000
N2 Richards Bay to Ermelo R 7 284 140
N3 Pietermaritzburg to Durban R 15 777 205
N4/PWV3 extension Pampoen nek R 1 716 900
N12 Johannesburg to Klerksdorp R 2 731 700
N12 Benoni to Witbank R 811 840
R72/N2 Port Elizabeth to East London R 6 301 200
R300 Cape Town Ring Road R 4 861 600
TOTAL R 118 922 881
Per Annum Requirement over 10 years R11 892 288
Note:
We need to increase fuel levy with estimated R0.65 per litre, to deal with just the abovementioned SANRAL
capacity expansion projects.

Slide 24
BUDGET FOR ROADS – 3 YEAR MTEF
Notes:
Current Fuel Levy R2.245/l for petrol and R2.095/l for diesel
* To be confirmed by treasury, no growth allowed due to vehicle technology impact.
** Income not ring fenced for roads only.
*** Excludes indirect allocations made from DORA allocations by authorities or raised through rates and taxes at
municipal level.
No additional budget from Fuel Levy currently, to address backlog (s) will require between
R1.35/l to R2.80/l - Question is What can the economy (man in street) afford ?
National Treasury Direct Allocations (Excludes Equitable Share Allocations)
Description MTEF Period (Rm)
2013/14 2014/15 2015/16 2016/17
Income R 49 470 R 49 770 R 50 070 R 50 070
Fuel Levy (Estimates)* R 43 770 R 43 770 R 43 770 R 43 770
Vehicle Licence Fees (Estimates)** R 5 700 R 6 000 R 6 300 R 6 300
Direct Allocations*** R 43 006 R 45 723 R 47 979 R 50 398
National - SANRAL Non Toll R 10 497 R 11 917 R 12 497 R 13 159
Provincial - Road Maintenance Grant R 9 126 R 9 361 R 9 952 R 10 291
Provincial - Public Transport Operations Grant R 4 783 R 4 832 R 5 052 R 5 317
Provincial - EPWP Integrated Grant for Provinces R 356 R 349 R 357 R 412
Local - General fuel levy sharing with metros R 9 613 R 10 190 R 10 659 R 11 224
Local - Municipal Infrastructure Grant (17.25% Roads) R 2 533 R 2 533 R 2 604 R 2 720
Local - Public transport infrastructure grant R 4 669 R 4 968 R 5 098 R 5 104
Local - Public Transport Network Operations Grant R 745 R 903 R 1 043 R 1 362
Local - Rural roads asset management systems grant R 52 R 75 R 98 R 103
Local - EPWP Integrated Grant for Municipalities R 632 R 595 R 619 R 706
Surplus/Shortfall R 6 464 R 4 047 R 2 091 R -328

Slide 25

Slide 26
Thank you!
SANRAL
48 Tambotie Avenue
Val de Grace
Pretoria
0184
PO Box 415
Pretoria
0001
Telephone: +27 12 8448 000
Fax: +27 12 8448200
FRAUD HOTLINE: 0800 204 558
Website: www.sanral.co.za