south african water quality guidelines - … african water quality guidelines volume 4: agricultural...
TRANSCRIPT

SOUTH AFRICAN WATER QUALITY GUIDELINESVolume 4: Agricultural Water Use: Irrigation
Second Edition, 1996
I would like to receive future versions of this document
(Please supply the information required below in block letters and mail to the given address)
Name:........................................................................................................................Organisation:..............................................................................................................Address:..................................................................................................................... ........................................................................................................................
........................................................................................................................
........................................................................................................................Postal Code:...............................................................................................................Telephone No.:............................................................................................................E -Mail:..........................................................................................................................
Mail reply to: Director: Water Quality ManagementDepartment of Water Affairs & ForestryPrivate Bag X313PRETORIA0001SOUTH AFRICA

South AfricanWater Quality
Guidelines
Volume 4Agricultural Use:
Irrigation
Department of Water Affairs and Forestry
Second Edition1996

Published by
Department of Water Affairs and ForestryPrivate Bag X313
PRETORIA0001
Republic of South AfricaTel: (012) 299-9111
Printed and bound by The Government Printer, Pretoria
ISBN 0-7988-5338-7 (Set)ISBN 0-7988-5342-5 (Volume)
Copyright reserved
No part of this publication may bereproduced in any manner
without full acknowledgementof the source
This report should be cited as:
Department of Water Affairs and Forestry, 1996. South African Water QualityGuidelines (second edition). Volume 4: Agricultural Use: Irrigation.
Edited by S Holmes, CSIR Environmental Services
Produced by:
CSIR Environmental ServicesP O Box 395PRETORIA0001Republic of South Africa

This volume is the fourth in a series of eight volumes comprising the South AfricanWater Quality Guidelines.
Volume 1: South African Water Quality Guidelines -Domestic Water Use
Volume 2: South African Water Quality Guidelines -Recreational Water Use
Volume 3: South African Water Quality Guidelines -Industrial Water Use
Volume 4: South African Water Quality Guidelines -Agricultural Water Use: Irrigation
Volume 5: South African Water Quality Guidelines -Agricultural Water Use: Livestock Watering
Volume 6: South African Water Quality Guidelines -Agricultural Water Use: Aquaculture
Volume 7: South African Water Quality Guidelines -Aquatic Ecosystems
Volume 8: South African Water Quality Guidelines -Field Guide

i
Foreword
The Department of Water Affairs and Forestry is the custodian of South Africa's water resources. Part ofits mission is to ensure that the quality of water resources remains fit for recognised water uses and that theviability of aquatic ecosystems are maintained and protected. These goals are achieved through complexwater quality management systems which involve role players from several tiers of government, from theprivate sector and from civil society.
A common basis from which to derive water quality objectives is an essential requirement that enables allrole players involved in such a complex system to act in harmony in order to achieve the overarching goalof maintaining the fitness of water for specific uses and to protect the health of aquatic ecosystems. Forthese reasons the Department initiated the development of the South African Water Quality Guidelines,of which this is the second edition. The South African Water Quality Guidelines serve as the primarysource of information for determining the water quality requirements of different water uses and for theprotection and maintenance of the health of aquatic ecosystems.
The process that followed and the wide variety of organizations and individuals involved in the developmentof these guidelines ensured the acceptance and use of these guidelines by all significant role players, as theSouth African Water Quality Guidelines. These guidelines are technical documents aimed at users witha basic level of expertise concerning water quality management. However, the role players involved in thedifferent water use sectors are expected to use these guidelines as a basis for developing material to informwater users in specific sectors about water quality and to empower them to effectively participate inprocesses aimed at determining and meeting their water quality requirements. The Department recognises that water quality guidelines are not static and will therefore update and modifythe guidelines on a regular basis, as determined by ongoing research and review of local and internationalinformation on the effects of water quality on water uses and aquatic ecosystems. The process ofdeveloping water quality guidelines, and the involvement of key role players, is a contining one. The secondedition is published in a loose leaf, ring binder format to facilitate the regular updating of the guidelines. Allthose who want to comment on and make suggestions concerning the South African Water QualityGuidelines are invited to do so at any time by contacting the Director: Water Quality Management,Department of Water Affairs and Forestry, Private Bag X313, Pretoria 0001.
Finally I wish to express my sincere appreciation to all those who have been involved in the developmentof these guidelines. I also look forward to their continued involvement in maintaining one of the corner-stones of the water quality management system in South Africa.
Professor Kader Asmal MPMinister Of Water Affairs and Forestry May 1996

iii

iii
Contents
Page
Introduction . . . . . . . . . . . . . . . . . . . . . . . . . . . . . . . . . . . . . . . . . . . . . . . . . . . . . . . . . . . . . . . . . . . . . 1Approach to guideline development . . . . . . . . . . . . . . . . . . . . . . . . . . . . . . . . . . . . . . . . . . . . . . . . . . . 7Characterisation of Irrigation Water Use . . . . . . . . . . . . . . . . . . . . . . . . . . . . . . . . . . . . . . . . . . . . . . 11Information contained in the guidelines . . . . . . . . . . . . . . . . . . . . . . . . . . . . . . . . . . . . . . . . . . . . . . . 13Aluminium . . . . . . . . . . . . . . . . . . . . . . . . . . . . . . . . . . . . . . . . . . . . . . . . . . . . . . . . . . . . . . . . . . . . . 17Arsenic . . . . . . . . . . . . . . . . . . . . . . . . . . . . . . . . . . . . . . . . . . . . . . . . . . . . . . . . . . . . . . . . . . . . . . . . 23Beryllium . . . . . . . . . . . . . . . . . . . . . . . . . . . . . . . . . . . . . . . . . . . . . . . . . . . . . . . . . . . . . . . . . . . . . . 29Boron . . . . . . . . . . . . . . . . . . . . . . . . . . . . . . . . . . . . . . . . . . . . . . . . . . . . . . . . . . . . . . . . . . . . . . . . . 35Cadmium . . . . . . . . . . . . . . . . . . . . . . . . . . . . . . . . . . . . . . . . . . . . . . . . . . . . . . . . . . . . . . . . . . . . . . 45Chloride . . . . . . . . . . . . . . . . . . . . . . . . . . . . . . . . . . . . . . . . . . . . . . . . . . . . . . . . . . . . . . . . . . . . . . . 51Chromium(VI) . . . . . . . . . . . . . . . . . . . . . . . . . . . . . . . . . . . . . . . . . . . . . . . . . . . . . . . . . . . . . . . . . . 59Cobalt . . . . . . . . . . . . . . . . . . . . . . . . . . . . . . . . . . . . . . . . . . . . . . . . . . . . . . . . . . . . . . . . . . . . . . . . . 65Coliforms (Faecal) . . . . . . . . . . . . . . . . . . . . . . . . . . . . . . . . . . . . . . . . . . . . . . . . . . . . . . . . . . . . . . . 71Copper . . . . . . . . . . . . . . . . . . . . . . . . . . . . . . . . . . . . . . . . . . . . . . . . . . . . . . . . . . . . . . . . . . . . . . . . 77Fluoride . . . . . . . . . . . . . . . . . . . . . . . . . . . . . . . . . . . . . . . . . . . . . . . . . . . . . . . . . . . . . . . . . . . . . . . 83Iron . . . . . . . . . . . . . . . . . . . . . . . . . . . . . . . . . . . . . . . . . . . . . . . . . . . . . . . . . . . . . . . . . . . . . . . . . . . 89Lead . . . . . . . . . . . . . . . . . . . . . . . . . . . . . . . . . . . . . . . . . . . . . . . . . . . . . . . . . . . . . . . . . . . . . . . . . . 95Lithium . . . . . . . . . . . . . . . . . . . . . . . . . . . . . . . . . . . . . . . . . . . . . . . . . . . . . . . . . . . . . . . . . . . . . . 101Manganese . . . . . . . . . . . . . . . . . . . . . . . . . . . . . . . . . . . . . . . . . . . . . . . . . . . . . . . . . . . . . . . . . . . . 105Molybdenum . . . . . . . . . . . . . . . . . . . . . . . . . . . . . . . . . . . . . . . . . . . . . . . . . . . . . . . . . . . . . . . . . . 111Nickel . . . . . . . . . . . . . . . . . . . . . . . . . . . . . . . . . . . . . . . . . . . . . . . . . . . . . . . . . . . . . . . . . . . . . . . 115Nitrogen (Inorganic) . . . . . . . . . . . . . . . . . . . . . . . . . . . . . . . . . . . . . . . . . . . . . . . . . . . . . . . . . . . . . 119pH . . . . . . . . . . . . . . . . . . . . . . . . . . . . . . . . . . . . . . . . . . . . . . . . . . . . . . . . . . . . . . . . . . . . . . . . . . . 127Scaling/Corrosion . . . . . . . . . . . . . . . . . . . . . . . . . . . . . . . . . . . . . . . . . . . . . . . . . . . . . . . . . . . . . . . 131Selenium . . . . . . . . . . . . . . . . . . . . . . . . . . . . . . . . . . . . . . . . . . . . . . . . . . . . . . . . . . . . . . . . . . . . . 137Sodium Adsorption Rate . . . . . . . . . . . . . . . . . . . . . . . . . . . . . . . . . . . . . . . . . . . . . . . . . . . . . . . . . 141Sodium . . . . . . . . . . . . . . . . . . . . . . . . . . . . . . . . . . . . . . . . . . . . . . . . . . . . . . . . . . . . . . . . . . . . . . 155Suspended Solids . . . . . . . . . . . . . . . . . . . . . . . . . . . . . . . . . . . . . . . . . . . . . . . . . . . . . . . . . . . . . . . 161Total Dissolved Solids . . . . . . . . . . . . . . . . . . . . . . . . . . . . . . . . . . . . . . . . . . . . . . . . . . . . . . . . . . . 165Uranium . . . . . . . . . . . . . . . . . . . . . . . . . . . . . . . . . . . . . . . . . . . . . . . . . . . . . . . . . . . . . . . . . . . . . . 177Vanadium . . . . . . . . . . . . . . . . . . . . . . . . . . . . . . . . . . . . . . . . . . . . . . . . . . . . . . . . . . . . . . . . . . . . 181Zinc . . . . . . . . . . . . . . . . . . . . . . . . . . . . . . . . . . . . . . . . . . . . . . . . . . . . . . . . . . . . . . . . . . . . . . . . . 187Glossary of terminology . . . . . . . . . . . . . . . . . . . . . . . . . . . . . . . . . . . . . . . . . . . . . . . . . . . . . . . . . . 193Glossary of abbreviations/acronyms . . . . . . . . . . . . . . . . . . . . . . . . . . . . . . . . . . . . . . . . . . . . . . . . 197Glossary of units of measure . . . . . . . . . . . . . . . . . . . . . . . . . . . . . . . . . . . . . . . . . . . . . . . . . . . . . . 199

iv
Acknowledgements
The following individuals and organisations are thanked for their contributions to these guidelines.
EXECUTIVE COMMITTEEMs T Belcher, Institute for Water Quality Studies, Department of Water Affairs and ForestryDr D C Grobler, CSIR Environmental ServicesDr S Holmes, CSIR Environmental ServicesMr J L J van der Westhuizen, Department of Water Affairs and ForestryDr H R van Vliet, Institute for Water Quality Studies, Department of Water Affairs and Forestry
PROJECT TEAMMr H M du Plessis, Water Research CommissionDr P L Kempster, Institute for Water Quality Studies, Department of Water Affairs and ForestryMr H J C Smith, Institute for Soil, Climate and Water, Agricultural Research Council
TECHNICAL REVIEWProf R O Barnard, Faculty of Biological and Agricultural Sciences, University of PretoriaProf J H Moolman, Department of Soil and Agricultural Water Science, University of Stellenbosch
STAKEHOLDER DISTRIBUTION LISTDraft documents were distributed to the following stakeholders, and all comments received have beenincorporated.
Prof A T P Bennie, Department of Soil Science, University of the Orange Free StateMr A F Coertze, Vegetable and Ornamental Plant Institute, Agricultural Research CouncilMr J George, South African Sugar Association Experiment StationDr M A Johnson, Department of Agronomy, University of NatalProf M C Laker, Faculty of Biological and Agricultural Sciences, University of PretoriaMr A A Louw, Irrigation and Soil Conservation Research, Chief Directorate Engineering Research Ms B Njobe-Mbuli, Resource Conservation Directorate, Department of AgricultureDr J G Thompson, Consultant on Water Quality and Effluent Disposal on LandDr A J van der Merwe, Institute for Soil, Climate and Water, Agricultural Research Council We also wish to thank the many people who provided administrative, secretarial and financial supportservices during the development and production of this handbook.

Agricultural Water Use: Irrigation 2nd Edition, 1996 (1st Issue) Introduction: Page 1 of 5
1
Introduction
Scope and Purpose of the Water Quality Guidelines
Scope The South African Water Quality Guidelines for Irrigation Water Use is essentially a userneeds specification of the quality of water required for different irrigation uses. It isintended to provide the information to make judgements on the fitness of water to be usedfor irrigation purposes, primarily for crop production. The guidelines are applicable to anywater that is used for irrigation purposes, irrespective of its source (municipal supply,borehole, river, etc.) or whether or not it has been treated.
Purpose The South African Water Quality Guidelines are used by the Department of Water Affairsand Forestry as its primary source of information and decision-support to judge the fitnessfor use of water and for other water quality management purposes.
The South African Water Quality Guidelines contain similar information to that which isavailable in the international literature. However, the information provided in theseguidelines is more detailed, and not only provides information on the ideal water quality forwater uses, but in addition provides background information to help users of the guidelinesmake informed judgements about the fitness of water for use.
Users of the The South African Water Quality Guidelines are being developed as an importantGuidelines information resource, primarily for water quality managers. Nevertheless, educators and
other interested and affected members of the general public are likely to find them avaluable source of information for many aspects of water quality and its management.
Ongoing Review The South African Water Quality Guidelines will be periodically reviewed. The purposeof the reviews is to:
! Add guidelines for constituents not yet included in the guidelines.
! Update the guidelines for constituents currently included in the guidelines as relevantnew information from international and local sources becomes available on the waterquality or support information for water quality constituents.
The loose leaf/ring binder format of the guidelines, as well as the footnotes at the bottomof each page which clearly indicate the exact version of a guideline, have been designed tofacilitate regular updating of the guidelines.
Overview The South African Water Quality Guidelines for Irrigation Water Use is divided into sixchapters:
! Chapters 1 - 4 provide an introduction to the guidelines, define some important waterquality concepts, explain how irrigation water use was characterised for the purpose ofdeveloping these guidelines, describe how the guidelines were developed and providesome guidance on how they should be used.
! Chapter 5 provides the actual guidelines for the different water quality constituents.
! Chapter 6 consists of appendices which provide additional support information.

Agricultural Water Use: Irrigation 2nd Edition, 1996 (1st Issue) Introduction: Page 2 of 5
2
Water Quality
Introduction To use the South African Water Quality Guidelines correctly, it is important for users ofthe guidelines to understand how water quality and some related concepts were defined.
Definition The term water quality describes the physical, chemical, biological and aesthetic propertiesof water that determine its fitness for a variety of uses and for the protection of aquaticecosystems. Many of these properties are controlled or influenced by constituents whichare either dissolved or suspended in water.
Constituents The term constituent is used generically in this edition of the South African Water QualityGuidelines for any of the properties of water and/or the substances suspended or dissolvedin it. In the international and local literature, several other terms are also used to define theproperties of water or for the substances dissolved or suspended in it, for example waterquality variable; characteristic and determinand; etc.
Examples of constituents which are used to describe water quality are:
! The temperature of the water is 20 EC.! The colour of the water is green.! The concentration of calcium is 60 mg/R.! Thirty percent of the surface of the water body is covered with water hyacinth.
Note that none of the statements of water quality states anything about how desirable oracceptable it is for water to have the properties listed. Therefore, in addition to suchstatements, one also needs to judge how desirable or acceptable water of such a qualitywould be for a particular water use or for maintaining the health of aquatic ecosystemsbefore the fitness of water for use can be determined.
Water Quality Water quality criteria are scientific and technical information provided for a particularCriteria water quality constituent in the form of numerical data and/or narrative descriptions of its
effects on the fitness of water for a particular use or on the health of aquatic ecosystems.
No Effect For each water quality constituent there is a No Effect Range. This is the range ofRange concentrations or levels at which the presence of a particular constituent would have no
known or anticipated adverse effects on the fitness of water for a particular use. Theseranges were determined by assuming long-term continuous use.
Target Water As a matter of policy, the Department of Water Affairs and Forestry (DWAF) strives toQuality Range maintain the quality of South Africa's water resources such that they remain within the No
Effect Range.
The DWAF encourages all stakeholders concerned with the quality of South Africa's waterresources to join forces and aim to maintain water quality within the No Effect Range,where and whenever possible.
For this reason, the No Effect Range in the South African Water Quality Guidelines isreferred to as the Target Water Quality Range (TWQR). It is included, and highlighted assuch, in the water quality criteria provided for each of the constituents dealt with in the

Agricultural Water Use: Irrigation 2nd Edition, 1996 (1st Issue) Introduction: Page 3 of 5
3
guidelines.
Users of the South African Water Quality Guidelines should note that an importantimplication of setting the Target Water Quality Range equal to the No Effect Range is thatit specifies good or ideal water quality, instead of water quality which is merely acceptable.
Water Quality A water quality guideline is a set of information provided for a specific water qualityGuidelines constituent. It consists of the water quality criteria, the Target Water Quality Range, and
support information, such as the occurrence of the constituent in the aquatic environment,the norms used to assess its effects on water uses, how these effects may be mitigated andpossible treatment options.
The South African Water Quality Guidelines consist of the guidelines for domestic,recreational, industrial and agricultural water (irrigation, livestock watering and aquaculture)uses, as well as guidelines for the protection of the health and integrity of aquaticecosystems, and for the protection of the marine environment.
Fitness for use
Introduction The Department of Water Affairs and Forestry is the custodian of South Africa's waterresources. Part of its mission is to maintain the fitness for use of water on a sustainedbasis. The concept of fitness for use is therefore central to water quality management inSouth Africa and to the development and use of these guidelines.
Water Use Four broad categories of water use are recognised in the South African Water Act, namelythe use of water for
! domestic purposes;! industrial purposes;! agricultural purposes; and! recreational purposes.
The DWAF's mandate also requires that the health of aquatic ecosystems be protected.The water quality requirements of these water uses and those for the protection of aquaticecosystems form the basis on which the fitness for use of water is judged.
Characteri- The broad water use categories listed above can each be subdivided into a number ofsation of Water subcategories. The subcategories of a particular water use can have quite different waterUses quality requirements, hence the need to characterise water uses into subcategories or
components and to specify water quality requirements at a subuse level.
The characterisation of water uses involves determining and describing those characteristicswhich will indicate its significance as well as those which dictate its water qualityrequirements, for example:
! The significance of each water use is determined by considering issues such as thevolume of water used, the socio-economic benefits and costs associated with the use;and the nature of the use, i.e. whether it is consumptive or not, or whether it isabstractive or not.
! The water quality requirements of a water use are determined by considering:

Agricultural Water Use: Irrigation 2nd Edition, 1996 (1st Issue) Introduction: Page 4 of 5
4
- Typical water quality problems associated with a particular water use or the role thatwater quality plays in sustaining the use;
- The nature of the effects of poor water quality on the use;- The norms which are commonly used as yardsticks to measure the effect of water
quality on a particular water use;- The water quality constituents which are generally of concern;- Any other site- or case-specific characteristics of the water use which may influence
its water quality requirements.
Fitness For Use The fitness for use of water, is a judgement of how suitable the quality of water is for itsintended use or for protecting aquatic ecosystems.
To be able to make judgements about fitness for use, one needs to:
! characterise the water uses and/or a particular aquatic ecosystem from a water qualityperspective;
! determine the quality requirements of the intended uses and/or that of an aquaticecosystem;
! obtain information on the key constituents which determine the fitness of water forintended uses and/or that affect the integrity of aquatic ecosystems;
! establish how, and how much, the intended use or an aquatic ecosystem will be affectedby the prevailing water quality; and
! determine whether the undesirable effects of water quality on a particular use can bemitigated against.
The fitness for use of water can range from being completely unfit for use to being 100 %or ideally fit for a specific use. Descriptions commonly used to express judgements aboutthe fitness of water for use are:
! ideal; 100 % fit for use; desirable water quality; target water quality range;! acceptable;! tolerable, usually for a limited time period only;! unacceptable for use; and! completely unfit for use.
Effects and Water quality can affect water uses or the health of aquatic ecosystems in many differentNorms ways. For example, it can affect the
! health of an individual drinking the water or swimming in it;! productivity or yield of irrigated crops;! cost of treating water before it can be used in an industrial process;! sophistication of technology required to treat water to adequate quality; and! biodiversity of aquatic ecosystems. It is therefore necessary to use different norms, such as health effects; crop quality; costof treatment; type and level of treatment technology; and the effects on biodiversity, asyardsticks for making judgements about the fitness for use of water.
Sustained use The sustained use of water is an important objective for agricultural development. The long-term sustainability of water uses was an important consideration in the development of theguidelines. For example, the water quality criteria for some constituents for irrigation useare based on the assumptions of water use of a given quality for long-term, intermediate,

Agricultural Water Use: Irrigation 2nd Edition, 1996 (1st Issue) Introduction: Page 5 of 5
5
and short-term periods.
The assumptions underlying the development of the guidelines must be taken into account,particularly when making judgements about the fitness of water required for short-termuse only.

6

Agricultural Water Use: Irrigation 2nd Edition, 1996 (1st Issue) Approach to guideline development: Page 1 of 3
7
Approach to Guideline Development
Rationale, Approach and Methodology
Rationale Many different water quality criteria and guidelines have been published in the internationaland local literature. Different approaches and methodologies have often been used to derivecriteria and guidelines, for example some guidelines specify maximum concentrations forconstituents fit for use, whereas others attempt to define the ideal concentration of aconstituent, often with the inclusion of safety factors. Therefore, depending on whichguidelines or criteria are used to establish water quality requirements, one can arrive atanswers which sometimes differ by a factor of a hundred or more.
The rationale for developing the South African Water Quality Guidelines was to:
! Develop a single set of guidelines and criteria that are appropriate for South Africa, andthat are based on a consensus of South African expertise and other role players in waterquality. One of the intentions of this approach was to limit the confusion that oftenarises from the use of different criteria and guidelines to establish the water qualityrequirements for a particular water use by the stakeholders of water supply andutilization in South Africa;
! Modify international guidelines in the light of local research and experience.
Approach The approach used to develop the South African Water Quality Guidelines for irrigationuse was that the guidelines should as far as is practically possible serve as a stand-alonesource of information and support base for decisions for water resource managers to makejudgements about the fitness for use of water used for different irrigation purposes. It isaccepted that, in many cases, the user will also have to consult different sources or obtainexpert opinion before reaching a final conclusion as to the fitness of water for use.However, the guidelines should in these cases at least indicate to the users what kinds ofinformation to look for.
Therefore, the guidelines developed consist not only of the water quality criteria for aspecific constituent, but also include a substantial amount of information to support the userof the guidelines in making judgements about the fitness of water for irrigation use.
In order to decide what information to include in the South African Water QualityGuidelines an analysis was done of the DWAF's different water quality managementprocesses. Those that required the guidelines to be used as a source of information and/or"decision-support" were identified and their typical information needs determined. Theproduct specification of the South African Water Quality Guidelines, delineating theinformation requirements of the guidelines was provided to the technical teams responsiblefor the development of the guidelines.
Methodology The methods used to develop irrigation water quality guidelines for South Africa consistedof:
! Listing the various purposes for which irrigation water is used;
! Describing, for each water use, the water quality related problems or issues typicallyexperienced in South Africa;

Agricultural Water Use: Irrigation 2nd Edition, 1996 (1st Issue) Approach to guideline development: Page 2 of 3
8
! Determining, for each water quality problem or issue, the appropriate norms to be usedas yardsticks for assessing the effects of water quality on a particular use;
! Determining, for each norm, which water quality constituents in South Africa typically
affect the fitness of water for use, and from this information, developing a list ofconstituents for the irrigation guidelines;
! Accessing international and local sources of information and expertise to develop draftguidelines for each constituent selected;
! Through a process of technical review and stakeholder participation finalise theguidelines as published in this edition.
Tentative The information available on the effects of some constituents on water uses is either veryGuidelines limited and/or unresolved differences in opinion exist on the effects these constituents may
have on water uses. In these cases the guidelines have been included as tentativeguidelines, and are clearly indicated as such.
During the ongoing review of the guidelines, it is intended that the status of the tentativeguidelines eventually be changed to standard guidelines, when either sufficient informationbecomes available or sufficient consensus is reached concerning the effects of theseconstituents on water uses.
Sources of Information Used to Develop the Guidelines
Introduction Because the South African Water Quality Guidelines are primarily aimed at South Africanwater resource managers and water users, a greater emphasis was given to South Africansource documents. Opinions of a wide range of South African experts in water quality andwater treatment, were used to supplement published sources. Due to the paucity of SouthAfrican source documents, for some constituents international literature was also used asbackground and reference material.
Sources of South African experts in water quality and water treatment were consulted during theInformation development of the guidelines. The following criteria and guidelines published in the
international literature were used as background and supplementary information in thedevelopment of the South African Water Quality Guidelines for irrigation use:
! ASCE Publication on Agricultural Salinity Assessment and Management (Tanjii, 1990)
! Australian Water Quality Guidelines for Irrigation Water Supplies (Hart, 1974; Hart etal, 1992)
! Canadian Irrigation Water Guidelines (Canadian Guidelines, 1987)
! FAO's Guide for Evaluating the Suitability of Water for Irrigation (Ayers and Westcott,1985)
! USA Quality Criteria for Irrigation Water (US EPA, 1973)
! USDA Handbook on Diagnosis and Improvement of Saline and Alkali Soils (US SalinityLaboratory Staff, 1954)

Agricultural Water Use: Irrigation 2nd Edition, 1996 (1st Issue) Approach to guideline development: Page 3 of 3
9
The following criteria and guidelines published in the South African literature were used inthe development of the SA Water Quality Guidelines for irrigation use:
! Department of Water Affairs and Forestry Guidelines for Irrigation Water Quality(Department of Water Affairs and Forestry, 1993)

10

Agricultural Water Use: Irrigation 2nd Edition, 1996 (1st Issue) Characterisation of Use: Page 1 of 2
11
Characterisation of Irrigation Water Use
Background Information
Introduction Irrigated agriculture is the largest consumer of available water in South Africa. Itsimportance as a water user has decreased dramatically from 80 % of available waterresources 25 years ago, to the present level of 50 %. This trend will continue in future, andirrigators will experience increasing pressure to use less water. Since many irrigationschemes are situated at the lower end of drainage basins, they are often at the receiving endof upstream water quality degradation activities. It is therefore likely that many irrigationfarmers will, in the future, have to contend with both deteriorating quality and a diminishingsupply of irrigation water. The term irrigation water, as used in these guidelines, refers towater which is used to supply the water requirements of crops and plants which are notprovided for by rain, and refers to all uses water may be put to in this environment. Thisincludes water for
! the production of commercial crops;! irrigation water application and distribution systems;! home gardening;! the production of commercial floricultural crops; and! potted plants.
As irrigation water is used to supply the water requirements of a wide variety of plants,under widely varying degrees of intensification, with a range of different distribution andapplication systems, to a wide range of soils over all climatic ranges in South Africa, a widespectrum of problems may be encountered where water does not meet requirements.
Sources of Water supplies for irrigation may originate from large reservoirs, farm dams, rivers, groundWater water, municipal supplies and industrial effluent. As such, irrigation water supplies span a
wide range. On irrigation schemes, irrigators mostly rely on an adequate supply of fairlygood water quality from untreated water, while home gardeners mostly receive a supply ofconventionally treated water of high quality. The quality and quantity of water from riversis highly variable, and is due to seasonal droughts or floods. The quality of ground wateralso varies greatly.
Water Quality Irrigation water users may experience a range of impacts as a result of changes in waterProblems quality. These may be categorised as follows:
! reduced crop yield (as a result of increased salinity or the presence of constituentsthat are toxic to plants);
! impaired crop quality (this may result in inferior products or pose a health risk toconsumers);
! impairment of soil suitability (as a result of the degradation of soil properties andaccumulation of undesirable constituents or toxic constituents); and
! damage to irrigation equipment (corrosion or encrustation).

Agricultural Water Use: Irrigation 2nd Edition, 1996 (1st Issue) Characterisation of Use: Page 2 of 2
12
Constituents The water quality problems and issues listed above can often be linked to theconstituents that cause them. Some water quality problems are associated not onlywith the presence of a constituent, but with the interactions between constituents, forexample, infiltration of water into the soil which is affected by both the sodiumadsorption ratio and the total dissolved solids of the water.
Agricultural Water Use: Irrigation 2nd Edition, 1996 (1st Issue) Information in the Guidelines: Page 1 of 4
13
Information Contained in the Guidelines
Overview
The information contained in a guideline for a particular constituent is organised in threesections.
! Background information. This section contains most of the support informationrequired to make judgements about the fitness of water for use.
! Information on the effects of the constituent, the criteria, and the conditions formodification of the criteria.
! Information on additional sources of information.
The information in each section of a guideline for a constituent is organised under a seriesof labels in the left hand margin that identifies the type of information, and can assist usersof the guidelines to quickly locate the information required.
Background Information
Introduction The introduction to the guideline for each constituent includes a brief description of theconstituent as well as a brief statement of its significance for irrigation water uses.
Occurrence Information on the fate and occurrence of a constituent in the aquatic environment, as wellas the natural and man-made sources thereof, are provided as background information tohelp the user to determine how widely, in what chemical and physical form and under whatcircumstances the constituent is likely to occur.
Interactions The effects of a water quality constituent on the fitness of water for use can sometimes besignificantly modified by its reaction with the irrigated soil and by synergistic or antagonisticeffects caused by the presence or absence of other constituents in the water. These effectsare described in the guideline and should be considered when making judgements about thefitness of water for use.
Measurement The effect of many constituents on water uses depends on the state (dissolved orparticulate) and the chemical species (oxidised or reduced) in which they occur. It isimportant for users of the guidelines to understand how measurements of the concentrationsof constituents in water are obtained and which methodologies to use.
Data The effects of water quality constituents on water uses vary from acute to chronic. InInterpretation order to make judgements about the fitness of water for use, it is important that the
appropriate statistics, depending on the types of effects that are likely, be estimated fromdata sets.
For example, if the type of effect is acute, then statistics which estimate extreme values,such as maximal values, should be used to compare with the water quality criteria provided.However, if the effects are mostly chronic, then estimates of the average, such as the meanor median value, should be used.
Treatment There are a large variety of options, or combinations of options, to

Agricultural Water Use: Irrigation 2nd Edition, 1996 (1st Issue) Information in the Guidelines: Page 2 of 4
14
Options ! Improve, with the use of various treatments, the quality of raw water supplied to waterusers;
! Improve, with the use of various treatments, the quality of water on site, by the usersthemselves. For example, the filtering of raw water drawn from a river before using itfor drip irrigation.
The information provided in the guidelines on treatment is very general and is simplyprovided to give a first indication of whether management intervention in the form oftreatment is possible. It is expected that, if water treatment is to be pursued, the user willobtain expert advice.
The cost of, and the ease with which management interventions can be implemented areimportant factors which can influence judgements about the fitness of water for use. Thefeasibility of intervention depends on the
! availability of technological solutions;! social acceptance;! scale of the intervention;! availability of institutional capacity to implement and sustain interventions;! availability of suitably qualified people to implement and maintain interventions; and! capital and operating costs of implementing the intervention; these are mostly too high
to treat water intended for irrigation purposes.
The Effects of a Constituent
Norms The norms that were used as yardsticks for assessing the effects of a particular waterquality constituent on the fitness for use are described in this section of the guideline.
Effects Water quality has different types of effects on specific water uses, for example, theseeffects can range from
! acute to chronic;! reversible to irreversible;! recoverable to irrecoverable.
In order to make informed judgements of the fitness of water for use, it is important thatusers of the guidelines take into account the information provided on the types of effectsto be expected.
As a result of the hydrological characteristics of South African rivers, flow and consequentlywater quality, can be highly variable. The effects of water quality on water uses oftendepends on the duration of exposure to water of a given quality. Therefore, users of theguidelines must also consider information on the likely duration of the exposure to water ofparticular quality when judging the fitness of water for use.
Although the importance of soil characteristics (and their interaction with watercharacteristics) in determining the suitability of water for irrigation is recognised, theemphasis in these guidelines is placed on water characteristics. In order to concentratemainly on water characteristics, it is necessary to make the assumption that suitable soilswill be irrigated. The user of this document should therefore account for soil properties thatdetermine sustainable use; as they are major considerations in the assessment of irrigability.For example, adequate internal drainage (natural or artificial), enables the leaching of saltfrom the soil profile and prevents the formation of elevated water tables. It is mostly
Agricultural Water Use: Irrigation 2nd Edition, 1996 (1st Issue) Information in the Guidelines: Page 3 of 4
15
possible (although not necessarily economical) to modify shortcomings of a soil type so thatit can be irrigated on a sustained basis. The question of soil irrigability is thus often reducedprimarily to a question of economic feasibility, that concern the implementation ofmanagement of modifications. Although the guidelines concentrate on water, rather thansoil, characteristics that determine irrigation water quality, they also consider (wherenecessary) the interactions between water and inherent, difficult-to-modify soil properties,such as, texture and clay mineralogy.
Balanced and adequate plant nutrition, pest control and other sound agronomic practicesplay a major role in determining the yield and quality of crops produced under irrigation.Another underlying assumption of the guidelines is that agronomic appropriate practices willbe employed under prevailing conditions.
Climate plays an important role in the effects of irrigation water quality. It determines interalia the crop water demand ( the more water applied during an irrigation season, the soonera dynamic equilibrium between soil and water constituents is established) and the degreeto which irrigation water applications are diluted by rain.
Users of the guidelines need to take account of these environmental factors and interactionswith other constituents when deciding on the fitness of water for use.
Mitigation The undesirable effects of water quality on its fitness for a specific use can often beprevented or mitigated against by on-farm management interventions during use, or at thepoint of use. For example, these interventions may include larger-than-required irrigationapplications to prevent the accumulation of salts in soil or by switching to a crop that ismore tolerant of a particular constituent. The user of the guidelines is provided with relevantinformation on the availability of options for intervention, and the feasibility ofimplementing such interventions for making judgements about the fitness of water for use.
The information on mitigation in the guidelines is very general and is simply provided togive the user of the guidelines a first indication of whether management intervention ispossible. It is expected that, if any options are to be pursued, the user will obtain expertadvice.
Criteria The water quality criteria for most of the constituents are provided in the form of tables,describing the effects of increasing concentrations of the constituents. The No EffectRange, designated in the South African Water Quality Guidelines as the Target WaterQuality Range, is highlighted. It must be remembered that the Target Water Quality Rangedescribes essentially what is considered good or ideal water quality and therefore waterquality outside of this range may, under certain circumstances, still be acceptable.
Modifications There are many site- and case-specific factors which modify the effects of water quality onspecific water uses. Examples of such site- or case-specific factors are
! Soil salinity tolerance of crops; these may vary significantly.
! The limit placed on the heavy metal content of water in order to protect humans andanimals does not apply to the irrigation of ornamental plants.
It is important that the information on site- and case-specific modifications be consideredwhen making judgements about the fitness of water for use.

Agricultural Water Use: Irrigation 2nd Edition, 1996 (1st Issue) Information in the Guidelines: Page 4 of 4
16
The information on modifications provided in the guidelines is very general and is simplyprovided to give the user a first indication of whether the criteria for a constituent may, incertain cases be modified. It is expected that, if the criteria need to be modified, the userof the guidelines obtain expert advice.
Sources of Information
It was simply not possible to either include all the constituents which may possibly affectthe fitness of water for irrigation use, or to include all the relevant information on theconstituents for which guidelines have been developed thus far.
The user is therefore referred to additional sources of information for each constituent.These same sources of information may in some cases also provide information onconstituents which are not yet included in the South African Water Quality Guidelines.
Should the user of the guidelines require additional information it must be remembered that,besides the publications referenced in the guidelines, there is also a wealth of unpublishedinformation available from a number of organisations and individuals in South Africa. Thelist of acknowledgements of people and organisations who participated in the developmentof the guidelines is a good starting point for accessing further information.

Chapter 5
Water QualityConstituents

Agricultural Water Use: Irrigation 2nd Edition, 1996 (1st Issue) Aluminium: Page 2 of 5
17
AluminiumTentative Guideline
Background Information
Introduction Pure aluminium is a silvery-white, soft, light metal, resistant to corrosion by the formationof a thin protective layer of the oxide of aluminium. Aluminium does not appear to be anessential nutrient for humans and is for practical purposes non-toxic.
Occurrence Aluminium is the most common metal in the earth's crust, having an abundance of 81 g/kg.Aluminium does not occur in the elemental form, but its minerals, particularly the silicatesof aluminium, are very widespread. Some important minerals containing aluminium arebauxite (hydrated aluminium oxide), spinel (magnesium aluminium oxide) and the kaolins(various aluminium silicates).
Aluminium occurs in water in two main phases, either as suspended aluminium minerals oras dissolved aluminium species. Aluminium occurs as a hydrated Al(III) cation, ithydrolyses and precipitates as insoluble aluminium hydroxide around neutral pH. Theconcentration of dissolved aluminium in unpolluted water at neutral pH is 0.005 mg/R orless. In acidic waters, or where soluble aluminium complexes are present, the dissolvedaluminium concentration may be significantly higher.
Interactions Aluminium is one of the macro soil constituents. Upon being applied to the soil, thealuminium in the irrigation water mixes with the aluminium in the dissolved phase in the soil,which in turn is in dynamic equilibrium with aluminium in other phases. The concentrationof aluminium in solution is largely determined by soil pH.
As a result of the enhanced solubility of aluminium oxides and the destruction of clayminerals and other aluminium silicates, the concentration of soluble aluminium in the soilsolution increases as soil pH decreases. Consequently, the effect of aluminium on theproductivity of plants is well correlated with soil pH. In acid soils (soil pH (water) less than5.5) crop productivity is low. Aluminium precipitates in more alkaline soils (soil pH (water)higher than 7.0), thereby eliminating its toxic effects on plant productivity.
Freshly precipitated aluminium has a large capacity to fix phosphate fertilizers, renderingthem unavailable to plants; it is one of the major plant nutritional problems experienced withacid ferralitic soils in South Africa.
Measurement The criteria refer to the dissolved aluminium concentration, i.e. aluminium which passesthrough a 0.45 µm membrane filter. The reference method for determining theconcentration of aluminium is atomic absorption spectrometry using a nitrous oxide flameand addition of potassium as an ionisation suppressant. If other methods are used, such ascolorimetric methods, their characteristics relative to the reference method should beknown.
If total aluminium (the dissolved plus suspended fraction) is measured, the sample shouldbe acidified before filtration. A vigorous digestion step is required since the acidificationstep will only dissolve species such as aluminium hydroxide and not aluminium silicateminerals.
Data Since aluminium is one of the macro soil constituents and its concentrations in soil solution

Agricultural Water Use: Irrigation 2nd Edition, 1996 (1st Issue) Aluminium: Page 3 of 5
18
Interpretation are determined primarily by soil pH and soil aeration (determining the oxidation state, andthus solubility, of aluminium), it is uncertain whether its addition through irrigation waterwill have a significant additional effect on crop growth for normal soils. Internationalguidelines for the concentration of aluminium in irrigation water have nonetheless beencalculated in a manner similar to other trace elements.
The arithmetic mean concentration of the applied water (preferably application volumeweighted) is given in the criteria for:
! The aluminium concentration that can be applied to any soil on a continuous basis.This concentration is calculated such that aluminium does not accumulate to phytotoxicconcentrations in a soil that is irrigated continuously for up to 100 years at an irrigationapplication rate of 1 000 mm p.a.
! The aluminium concentration that can be applied to fine textured neutral to alkaline
soils for a period of not more than 20 years at an irrigation application rate of1 000 mm p.a.
Treatment It is highly unlikely that aluminium can be economically removed from water intendedOptions for irrigation use. However, should it be required, the technologies available for removing
aluminium from water include:
! The formation and precipitation of insoluble aluminium salts. Aluminium ions will reactwith alkalinity in the water to form aluminium hydroxide which is insoluble in the pHrange of 6.7 - 7.6. The particles formed are very light and difficult to settle without theaddition of a polyelectrolyte to flocculate and increase the specific gravity of theparticles. An alternative is to dose the water with a phosphate solution and remove thealuminium as insoluble aluminium phosphate. High concentrations of aluminium inwater can be reduced significantly by increasing the pH with a suitable alkali (mostlylime) and removing the aluminium hydroxide precipitate as a sludge.
! Substitution of aluminium with sodium in a cation exchange column along with calciumand magnesium.
! Removal of aluminium together with other dissolved components using desalinationtechniques such as demineralisation by ion exchange, membrane processes or distillationmethods.
All of the methods described require skilled monitoring and control and generate aconcentrated waste stream that may cause disposal difficulties.
The Effects of Aluminium
Norms The different norms used in the guideline to assess the effects of aluminium on irrigationwater use are summarised in the tables that follows.

Agricultural Water Use: Irrigation 2nd Edition, 1996 (1st Issue) Aluminium: Page 4 of 5
19
Irrigation water uses Norms for measuring waterquality effects
Application to commercial crops ! Crop yield as affected by cropsensitivity to aluminium uptakethrough plant roots.
Application to sustain suitability of ! Accumulation in soil to concentrationsirrigated soil where either crop yield or crop quality
is affected.
Maintenance of irrigation equipment ! No known effects
Effects Aluminium is not a plant nutrient. Toxicity of aluminium to plants has been reported forboth acid and alkaline conditions. It is, however, mostly associated with low pH values(less than 5.5) in natural soils. In nutrient solutions toxicities have been reported for anumber of plants at a concentration range of 0.1 - 1.0 mg/R. Aluminium toxicity has beenobserved at concentrations range of 0.1 - 0.5 mg/R in soil solution. These values cannot beextrapolated directly to irrigation waters, because soil chemical interactions modify thealuminium concentration and species found in soil solution.
Mitigation Common on-farm management practices to mitigate against uptake by plants on irrigatedland, are to:
! Apply agricultural lime in order to raise (or maintain) soil pH at neutral to slightlyalkaline values. This reduces aluminium concentrations to levels tolerated by mostplants.
! Ensure that soil is well aerated and not waterlogged (the solubility of aluminiumincreases under reducing conditions such as those found in waterlogged soils).
! Switch to crops that are more tolerant of aluminium.
Criteria Effects of Aluminium on Crop Yield and Quality
Concentration Crop Yield and Crop Quality Range (mg/RR)
Target Water Several crops show aluminium toxicity at concentrations asQuality Range low as 0.1 - 0.5 mg/R in soil solution. Soils have the capacity to
# 5.0 adsorb complex aluminium ions, thereby reducing their toxicityto plants
5 - 20 Maximum acceptable concentration for fine textured, neutral toalkaline soils
> 20 Acceptable for irrigation only over the short term on a site-specific basis

Agricultural Water Use: Irrigation 2nd Edition, 1996 (1st Issue) Aluminium: Page 5 of 5
20
Note:
! The TWQR for relatively unrestricted use on all soils and the concentration rangefor fine textured neutral to alkaline soils are similar to most international criteria.
! The above criteria are based on relatively limited information and should beviewed as tentative.
Modifications ! The criteria given above may not protect commercial floricultural crops grown ingreenhouses without soil (hydroponic or similar methods), because it is assumed thatsoil has a capacity to deactivate aluminium.
! Should the site-specific conditions vary significantly from the assumptions that wereused to derive the criteria, the criteria may need adjustment.
! Potted plants normally receive water applications in excess of the assumptions used toderive the criteria. Since potted plants are grown for only limited periods the criteria forfine-textured neutral to alkaline soils are applicable.

Agricultural Water Use: Irrigation 2nd Edition, 1996 (1st Issue) Aluminium: Page 6 of 5
21
Sources of Information
APHA 1989. Standard Methods for the Examination of Water and Waste Water, 17thEdition. American Public Health Association, American Water Works Association, WaterPollution Control Federation. Published by the American Public Health Association,Washington DC, USA.
AYERS R.S. and D.W. Westcott 1985. Water Quality for Agriculture. FAO Irrigationand Drainage Paper No. 29. FAO Rome, 19.
CANADIAN GUIDELINES 1987. Canadian Water Quality Guidelines. Prepared by theTask Force on Water Quality Guidelines of the Canadian Council of Resource andEnvironment Ministers. Canada.
DEPARTMENT OF WATER AFFAIRS AND FORESTRY 1993. South African WaterQuality Guidelines, Volume 4: Agricultural Use.
HART B.T. 1974. A compilation of Australian Water Quality Criteria. AWRCTechnical Paper No. 7. Australian Government Publishing Service, Canberra.
HART B.T., C. Angehrn-Bettinazzi, I.C. Campbell and M.J. Jones 1992. Draft AustralianWater Quality Guidelines. Australian and New Zealand Environment and ConservationCouncil. January 1992.
PRATT P.F. and D.L. Suarez 1990. Irrigation Water Quality Assessments. In: K.K.Tangii, (Ed.) Agricultural Salinity Assessment and Management. ASCE Manuals andReports on Engineering Practice No. 71. ASCE New York 1990.
UNITED STATES ENVIRONMENTAL PROTECTION AGENCY 1973. ProposedCriteria for Water Quality. US EPA, Washington DC, October 1979.
WEAST R.C. 1979. CRC Handbook of Chemistry and Physics, 60th Edition. CRC PressInc., Boca Raton, Florida, USA.

22

Agricultural Water Use: Irrigation 2nd Edition, 1996 (1st Issue) Arsenic: Page 1 of 5
23
ArsenicTentative Guideline
Background Information
Introduction Arsenic is a greyish semi-metal and occurs in three oxidation states, namely (0), (III) and(V). In solution arsenic can exist as arsenite, As(III); arsenate, As(V); and as variousorganic complexes. Inorganic arsenates form arsenate salts with cations of calcium or iron.Soluble arsenic compounds are readily taken up by living organisms and at elevatedconcentrations can exert toxic effects.
Plants respond to the arsenic concentration in the soil solution. Similar to most traceelements, arsenic is strongly adsorbed by soil. The addition of arsenic to soils in relativelyhigh concentrations over the short-term may not result in reduced crop growth or in itsaccumulation in plant parts to concentrations detrimental to humans or animals. However,continuous applications of arsenic over extended periods results in its accumulation in thesurface soil layer, in practice, the cultivated or plough layer.
Occurrence Arsenic is fairly widespread in the environment, the average concentration in the earth'scrust being approximately 2 mg/kg. It is found as arsenates, with sulphides and inassociation with many other metallic ores and occasionally in the elemental form.
Typically, the concentration of arsenic in fresh water is less than 1 Fg/R and in sea water,approximately 4 Fg/R. Elevated concentrations of arsenic occur where there is pollutionfrom industrial sources, or where geological outcrops of arsenic minerals occur. Forexample, new borehole water supplies in areas where arsenic minerals are known to occurshould be tested for arsenic content.
Arsenic is used in metallurgy, in the manufacture of glassware and ceramics, and as apesticide and wood preservative.
Interactions Elevated concentrations of arsenic can occur in agricultural soils, due to previous use oforgano-arsenic pesticides that persist as long-lasting residues in the soil. Arsenicconcentrations in the soil solution are largely determined by sorption and desorptionreactions with the soil exchange complex, and by coprecipitation with metal oxides.Sorption dominates at the relatively low concentrations that are of concern for water qualitycriteria for irrigation use.
Only a small fraction of the total arsenic present in soil is available to plants. Arsenic ispresent primarily in the arsenate ((As)V) and arsenite ((As)III) forms in soil. Both theseforms are subject to chemically and/or microbiologically mediated oxidation-reduction andmethylation reactions in soil. Soils have a high capacity to reduce the toxicity of dissolvedarsenic through adsorption to clay and through the chemical speciation of arsenic as a resultof reactions with phosphorus. The higher the clay content the more arsenic is adsorbed.
Soil pH affects the concentration of arsenic in the soil solution; solubility decreases withincreasing pH. At high pH values, in the presence of calcium or magnesium, oxy-anionsof arsenic are precipitated from solution.
Implications for irrigation with water containing arsenic, involve the following:

Agricultural Water Use: Irrigation 2nd Edition, 1996 (1st Issue) Arsenic: Page 2 of 5
24
! Arsenic can be expected to be retained in the soil surface layers because of strongsorption by the soil exchange complex; in cultivated land it accumulates in the ploughlayer.
! Significant downward movement to below the plough layer and hence contaminationof ground water with arsenic is unlikely.
! The larger the soil's cation exchange capacity (determined by clay content and claymineral type), the more arsenic can generally be sorbed.
! Soils with a neutral to alkaline pH are able to accept a greater arsenic load than acidicsoils before concentrations in the soil solution become phytotoxic.
Measurement The criteria are given in terms of the total arsenic concentration in units of mg/R. Thereference method for the determination of arsenic is atomic absorption spectrometry withhydride generation. The various forms of arsenic are converted to As(V) in an aciddigestion and then reduced to As(III), prior to the generation of arsine gas with borohydride.If other methods are used to measure arsenic, their characteristics relative to the referencemethod should be known.
Data Because arsenic is retained by soils, it is likely to accumulate to phytotoxic concentrationsInterpretation before equilibrium between sorption and desorption reactions is reached. In order to
prevent its accumulation, the total load applied to soil needs to be limited. Internationalcriteria for the concentration of arsenic in irrigation water have been calculated (usinglimited available information) to ensure that it does not accumulate to either phytotoxiclevels or levels that are toxic to consumers, within a given time period. The calculationsassume that arsenic accumulates within the surface 150 mm of soil. As such, the objectivesof sustained soil suitability for continued use and maintenance of crop yield and quality havebeen accounted for.
The arithmetic mean concentration of the applied water (preferably application volumeweighted) is given in the criteria for:
! the arsenic concentration that can be applied to any soil on a continuous basis. Thisconcentration is calculated such that arsenic does not accumulate to phytotoxicconcentrations in a soil that is irrigated continuously for up to 100 years at an irrigationapplication rate of 1 000 mm p.a.
! the arsenic concentration that can be applied to fine textured, neutral to alkaline soilsfor a period of up to 20 years at an irrigation application rate of 1 000 mm p.a.
Treatment It is highly unlikely that arsenic can be economically removed from water intended forOptions irrigation use. However, should removal of arsenic be required, it can be most effectively
removed in its pentavalent form. Trivalent arsenic is first converted to the pentavalent formusing an appropriate oxidising agent such as chlorine or potassium permanganate.Pentavalent arsenic is effectively removed from water using conventional coagulation andflocculation processes followed by settlement and filtration. Suitable coagulants includealuminium sulphate, ferric salts and lime. The process requires monitoring to ensure thearsenic is effectively removed. The process will also generate a watery sludge rich inarsenic, that may present disposal problems.

Agricultural Water Use: Irrigation 2nd Edition, 1996 (1st Issue) Arsenic: Page 3 of 5
25
The Effects of Arsenic
Norms The different norms used in the guideline to assess the effects of arsenic on irrigation wateruse are summarised below:
Irrigation water uses Norms for measuring waterquality effects
Application to commercial ! Crop yield as affected by crop sensitivity tocrops arsenic element uptake through plant roots
! Crop quality as determined by toxicity toconsumers
Application to sustain ! Accumulation in soil to concentrations wheresuitability of irrigated soil either crop yield or crop quality is affected
Maintenance of irrigation ! No known effectsequipment
Effects Although very low concentrations of arsenic stimulate plant growth, it is not an essentialplant nutrient and crop yields are depressed at high concentrations. The main effect ofarsenic in plants appears to be the destruction of chlorophyll in the foliage, as aconsequence of inhibition of reductase enzymes. Since arsenic is toxic to humans,consumption of edible plant parts containing accumulated arsenic is dangerous.
Nutrient concentrations of 0.5 - 10 mg/R have been found to be toxic to various plantspecies. Potatoes and radishes have been shown to accumulate arsenic. Since plant growthis retarded before significant accumulation may occur, the edible parts of plants do notusually accumulate arsenic to levels dangerous to consumers. Yield decreases and cropfailures are the most common effects of high arsenic concentrations in soils.
Mitigation ! The only effective management practice for soils with toxic concentrations of arsenicis to switch to more tolerant crops.
! A precautionary on-farm practice is to irrigate only soils with a high sorptive capacity(mainly soils with a high clay content). This will not always be feasible, as clay soilsmay not be available and may also have other undesirable characteristics, such as poordrainage.

Agricultural Water Use: Irrigation 2nd Edition, 1996 (1st Issue) Arsenic: Page 4 of 5
26
Criteria Effects of Arsenic on Crop Yield and Quality
Concentration Range Crop Yield Crop Quality(mg/RR)
Target Water Depending on plant Yield reduction andQuality Range species, nutrient solutions crop failure are the
# 0.1 containing 0.5 - 10 mg/R main effects of arseniccan induce arsenic contaminated soils.
toxicity. Only a fraction Generally arsenic doesof the total arsenic in soil not accumulate in
is available to plants edible parts of plants tolevels that aredangerous to consumers(root crops such aspotatoes and radisheshave been shown toconcentrate arsenic)
0.10 - 2.0 Maximum concentration
> 2.0 only over the short term on
acceptable for fine-texturedneutral to alkaline soils
Acceptable for irrigation
a site-specific basis
Note:
! The TWQR and the concentration range given for fine-textured neutral to alkalinesoils is similar to most international criteria.
! The above criteria are based on relatively limited information and should beviewed as tentative.
! The criteria are calculated to ensure soil sustainability for continued cropproduction.
Modifications ! The criteria assume that the soil to be irrigated contains only negligible amounts ofarsenic. Should this not be the case, the period of irrigation needs to be reducedaccordingly.
! The criteria may not protect commercial floricultural crops grown in greenhouseswithout soil (hydroponic or similar methods) because it is assumed that soil has acapacity to deactivate arsenic.
! Should the site-specific conditions vary significantly from the assumptions that wereused to derive the criteria, the criteria may need adjustment.
! Potted plants normally receive water applications in excess of the assumptions used toderive the criteria. Since potted plants are only grown for limited periods, the criteriaapplicable to fine-textured neutral to alkaline soils generally applies.
! Rice on flooded soils is extremely sensitive to small amounts of arsenic. The maximumacceptable limit may be too high.
Sources of Information
APHA 1989. Standard Methods for the Examination of Water and Waste Water, 17th

Agricultural Water Use: Irrigation 2nd Edition, 1996 (1st Issue) Arsenic: Page 5 of 5
27
Edition. American Public Health Association, American Water Works Association,Water Pollution Control Federation. Published by the American Public HealthAssociation, Washington DC, USA.
AYERS R.S. and D.W. Westcott 1985. Water Quality for Agriculture, FAO Irrigationand Drainage Paper No. 29. FAO, Rome.
BERMAN E. 1980. Toxic Metals and Their Analysis. Heyden, London.
BOWMAN H.J.M. 1979. Environmental Chemistry of the Elements. Academis Press,London.
CANADIAN GUIDELINES 1987. Canadian Water Quality Guidelines. Prepared bythe Task Force on Water Quality Guidelines of the Canadian Council of Resource andEnvironment Ministers. Canada.
DEVEREL S.J. and R. Fujii 1990. Chemistry of Trace Elements in Soils and GroundWater. In: Agricultural Salinity Assessment and Management, K.K. Tanjii (Ed.).ASCE Manuals and Reprints on Engineering Practice No. 71. ASCE New York, 1990.
HART B.T. 1974. A Compilation of Australian Water Quality Criteria. AWRCTechnical Paper No. 7.
HART B.T., C. Angehrn-Bettinazzi, I.C. Campbell and M.J. Jones 1992. DraftAustralian Water Quality Guidelines. Australian and new Zealand Environment andConservation Council. January 1992.
McKEE J.E. and H.W. Wolf 1963. Water Quality Criteria, 2nd Edition. CaliforniaState Water Resources Control Board, Publication No. 3-A. California.
PAGE A.L. and A.C. Chang 1990. Deficiencies and Toxicities of Trace Elements, In:Agricultural Salinity Assessment and Management, K.K. Tanjii (Ed.). ASCE Manualsand Reprints on Engineering Practice No. 71. ASCE New York, 1990.
PRATT P.F. and D.L. Suarez 1990. Irrigation Water Quality Assessments. In:Agricultural Salinity Assessment and Management, K.K. Tanjii (Ed.). ASCE Manualsand Reports on Engineering Practice No. 71. ASCE New York, 1990.
UNITED STATES ENVIRONMENTAL PROTECTION AGENCY 1973. ProposedCriteria for Water Quality. US EPA, Washington DC, October 1979.
WEAST R.C. 1979. CRC Handbook of Chemistry and Physics, 60th Edition. CRCPress Inc., Boca Raton, Florida, USA.

28

Agricultural Water Use: Irrigation 2nd Edition, 1996 (1st Issue) Beryllium: Page 1 of 5
29
BerylliumTentative Guideline
Background Information
Introduction Beryllium is a very light, greyish metal. Plants respond to the beryllium concentrationin the soil solution. Similar to most trace elements, beryllium is strongly adsorbed bysoil. Addition to soils in relatively high concentrations, over the short term, may notresult in reduced crop growth, or may not concentrate beryllium in plant parts to a leveldetrimental to human or animal consumption. However, continuous application to thesoil over extended periods results in its accumulation in the surface soil layer, in practice,the cultivated or plough layer.
Occurrence Beryllium is found in various silicate and oxide minerals, the most abundant of which isberyl, a beryllium aluminium silicate. Typically, the beryllium concentration in ! unpolluted waters is around 0.3 µg/R;! in sea water is in the mg/R range; and! in surface waters is in the µg/R range. Higher concentrations can occur in association
with mining or industrial activities. Beryllium silicates and carbonates are insoluble in water and bind to sediments. Thenatural silicate concentration of most waters will tend to limit the beryllium concentrationin solution.
Beryllium metal is used in X-ray equipment. Beryllium salts are used in electricalequipment, in various alloys, in optical glasses, in ceramics, in the nuclear industry andin the plating industry.
Interactions Beryllium concentrations in the soil solution are largely determined by sorption anddesorption reactions with the soil exchange complex. Sorption reactions dominate at therelatively low concentrations that are of concern for water quality criteria for irrigation.
Soil pH affects the concentration of beryllium in the soil solution; solubility decreaseswith increasing pH. Beryllium also associates with silicates and adsorbs onto thealumino-silicates in clay particles.
The implications for irrigation with water containing beryllium include the following:
! Beryllium can be expected to be retained in the soil surface layers because of itsstrong sorption by the soil exchange complex. In cultivated land it accumulates inthe plough layer.
! Significant downward movement to below the plough layer and hence contaminationof ground water with beryllium, is highly unlikely.
! The larger the soil's cation exchange capacity (determined by clay content and claymineral type), the more beryllium can generally be sorbed.
! Soils with a neutral to alkaline pH will be able to accept a greater beryllium load than

Agricultural Water Use: Irrigation 2nd Edition, 1996 (1st Issue) Beryllium: Page 2 of 5
30
acidic soils before concentrations in the soil solution become phytotoxic.
Measurement The criteria are given in terms of the total beryllium concentration, in units of mg/R. Thereference method for the determination of beryllium is inductively-coupled plasma emissionspectrometry. Where other methods are used, their characteristics relative to the referencemethod should be known.
Data Because beryllium is retained strongly by soils, it is likely to accumulate to phytotoxicInterpretation concentrations before equilibrium between sorption and desorption reactions is reached.
In order to prevent its accumulation, the total load applied to soil needs to be limited.International criteria for the concentration of beryllium in irrigation water have beencalculated (using limited available information) to ensure that accumulation to eitherphytotoxic levels or levels toxic to consumers within a given time period does not occur.The calculations assume that beryllium accumulates within the surface 150 mm of soil. Assuch, the objectives of sustained soil suitability for continued use and maintenance of cropyield and quality have been accounted for.
The arithmetic mean concentration of the applied water (preferably application volumeweighted) is given in the criteria for:
! the beryllium concentration that can be applied to any soil on a continuous basis. Thisconcentration is calculated such that beryllium does not accumulate to phytotoxicconcentrations in a soil that is irrigated continuously for up to 100 years at an irrigationapplication rate of 1 000 mm p.a.
! the beryllium concentration that can be applied to fine textured, neutral to alkalinesoils for a period of up to 20 years at an irrigation application rate of 1 000 mm p.a.The arithmetic mean concentration of the applied water (preferably application volumeweighted) is used for this purpose.
Treatment It is highly unlikely that beryllium can be removed economically from water intended forOptions irrigation use. However, should it be required, beryllium is commonly removed from
water using an oxidising process which converts the beryllium into an insoluble oxideremovable by filtration. The reaction is considerably more difficult to achieve than thatwith iron and normally requires the use of a strong oxidising agent. Agents commonly usedinclude
! chlorine! hydrogen peroxide! potassium permanganate! ozone
Where the oxidant used leaves a residue, as is the case with chlorine, the residue should beremoved before the water is used.
Removal of beryllium is difficult to achieve on a small scale, but some removal will beobtained by adding sodium hypochlorite (bleach) to the water. On an industrial scale theprocess usually needs to be closely controlled and monitored, because the consequences ofincomplete treatment may be severe.
The Effects of Beryllium

Agricultural Water Use: Irrigation 2nd Edition, 1996 (1st Issue) Beryllium: Page 3 of 5
31
Norms The different norms used in the guideline to assess the effects of beryllium on irrigationwater use are summarised below.
Irrigation water uses Norms for measuring waterquality effects
Application to commercial ! Crop yield as affected by crop sensitivity tocrops beryllium uptake through plant roots
! Crop quality as determined by beryllium toxicityto consumers
Application to sustain ! Accumulation in soil to concentrations wheresuitability of irrigated soil either crop yield or crop quality is affected
Maintenance of irrigation ! No known effectsequipment
Effects Beryllium is not a plant nutrient and is in fact, even at low concentrations, toxic to bothplants and animals. Its toxicity to plants varies widely, ranging from 0.5 mg/R for bushbeans to 5 mg/R for kale in nutrient solutions. Beryllium is not readily translocated from theroots to the foliage of plants growing in either soil or nutrient solutions. Therefore, itusually does not accumulate to toxic levels in foliage and other plant parts above the ground.
Mitigation Common on-farm management practices to mitigate against beryllium uptake by plants onirrigated land, are to
! apply agricultural lime in order to raise (or maintain) soil pH to neutral to slightlyalkaline, and/or
! switch to a crop that is more tolerant to beryllium.
Criteria Effects of Beryllium on Crop Yield
Concentration Crop Yield and Quality Range (mg/RR)
Target Water Beryllium is toxic to both plants and animals. Its Quality Range toxicity to plants varies greatly. It is not readily
# 0.10 translocated from the roots to foliage
0.10 - 0.5 Maximum of range, acceptable as concentration forfine textured neutral to alkaline soils
> 0.5 Acceptable for irrigation only over the short term on asite-specific basis
Note:
! The TWQR given for relatively unrestricted use on all soils and the concentrationrange for fine textured and neutral to alkaline soils for irrigation periods of up to

Agricultural Water Use: Irrigation 2nd Edition, 1996 (1st Issue) Beryllium: Page 4 of 5
32
20 years, is similar to most international criteria.
! The above criteria are based on relatively limited information and should beviewed as tentative.
! The criteria are calculated to ensure soil sustainability for continued cropproduction.
Modifications ! The criteria were derived with the assumption that the soil to be irrigated contains onlynegligible quantities of beryllium. Should this not be the case, the period of irrigationneeds to be reduced accordingly.
! The above criteria may not protect commercial floricultural crops grown in greenhouseswithout soil (hydroponic or similar methods), because it is assumed that the soil has acapacity to deactivate beryllium.
! Should the site-specific conditions vary significantly from the assumptions that wereused to derive the criteria, the criteria may need adjustment.
! Potted plants normally receive water applications in excess of the assumptions used toderive the criteria. Since potted plants are only grown for limited periods, the criteriaapplicable to fine-textured neutral to alkaline soils can mostly be used.

Agricultural Water Use: Irrigation 2nd Edition, 1996 (1st Issue) Beryllium: Page 5 of 5
33
Sources of Information
APHA 1989. Standard Methods for the Examination of Water and Waste Water, 17thEdition. American Public Health Association, American Water Works Association, WaterPollution Control Federation. Published by the American Public Health Association,Washington DC, USA.
AYERS R.S. and D.W. Westcott 1985. Water Quality for Agriculture, FAO Irrigation andDrainage Paper No. 29. FAO Rome, 19.
BERMAN E. 1980. Toxic Metals and Their Analysis. Heyden, London.
BOWEN H.J.M. 1979. Environmental Chemistry of the Elements. Academic Press,London.
CANADIAN GUIDELINES 1987. Canadian Water Quality Guidelines. Prepared by theTask Force on Water Quality Guidelines of the Canadian Council of Resource andEnvironment Ministers. Canada.
DEPARTMENT OF WATER AFFAIRS AND FORESTRY 1993. South African WaterQuality Guidelines, Volume 4: Agricultural Use.
FORD W.E. and E.S. Dana 1963. A Textbook of Mineralogy, 4th Edition. John Wiley &Sons Inc., New York.
HART B.T. 1974. A compilation of Australian Water Quality Criteria. AWRC TechnicalPaper No. 7.
HART B.T., C. Angehrn-Bettinazzi, I.C. Campbell and M.J. Jones 1992. Draft AustralianWater Quality Guidelines. Australian and New Zealand Environment and ConservationCouncil. January 1992.
PAGE A.L. and A.C. Chang 1990. Deficiencies and Toxicities of Trace Elements. In:Agricultural Salinity Assessment and Management, K.K. Tanjii (Ed.). ASCE Manuals andReprints on Engineering Practice No. 71. ASCE New York 1990.
PRATT P.F. and D.L. Suarez 1990. Irrigation Water Quality Assessments. In:Agricultural Salinity Assessment and Management, K.K. Tanjii (Ed.). ASCE Manuals andReports on Engineering Practice No. 71. ASCE New York 1990.
UNITED STATES ENVIRONMENTAL PROTECTION AGENCY 1973. ProposedCriteria for Water Quality. US EPA, Washington DC, October 1979.
WEAST R.C. 1979. CRC Handbook of Chemistry and Physics, 60th Edition, CRC PressInc., Boca Raton, Florida, USA.

34

Agricultural Water Use: Irrigation 2nd Edition, 1996 (1st Issue) Boron: Page 1 of 9
35
BoronBackground Information
Introduction Amorphous boron is a dark-brown semi-metal and is relatively non-toxic. Its compounds,however, range from being moderately to highly toxic to all living organisms. Althoughboron is an essential plant nutrient, it is toxic to plant growth at very low concentrations.Compounds of boron such as boric acid and sodium borate are of commercial importance.
Occurrence Boron is found in nature in the form of various borates and borosilicate minerals. Commonminerals include borax (Na B O .10H O), found in salt deposits of saline lakes, calcium2 4 7 2
borate (colemanite) and various borosilicate minerals such as tourmaline (an aluminiumborosilicate). Boron tends to occur in association with saline conditions. Typically, theconcentration of boron in
! sea water is 4.6 mg/R; ! fresh water is usually less than 0.1 mg/R; and! surface water can be as high as 1 mg/R or more, especially if in association with arid,
saline conditions.
Once in solution, boron is not easily removed and tends to concentrate in solution onevaporation of water. Hence, the ubiquitous finding of elevated boron concentrations inconjunction with saline hydrogeological conditions. Industrial uses of boron include
! use in metallurgy to harden other metals;! use in semi-conductors; ! use in the nuclear industry, as a neutron absorber;! use of sodium borate (borax) as a preservative, in the manufacture of glasses and
glazes, and in weather-proofing fabrics; ! use of organic complexes of boron as catalysts; synthetic organoboron compounds tend
to be more toxic than the naturally occurring borates; and ! use of boric acid as a general household antiseptic agent.
Its relatively high concentration in sea water is the source of the high content of boron inargillaceous sediments of marine origin. Upon weathering the boron contained in thesesediments is released into the aquatic environment.
Interactions Boron concentrations in the soil solution are largely determined by sorption and desorptionreactions with soil particles. Boron can be specifically adsorbed by different clay minerals,hydroxy oxides of aluminium and iron, and by organic matter. The adsorption reactions arestrongly pH-dependant with maximum adsorption occurring in a pH range of 7 - 11. Dueto these interactions, the boron concentrations in a soil solution are largely buffered againstrapid changes and the implications thereof include the following:
! Boron requires much longer time periods than unreactive ions, such as chloride, toattain equilibrium conditions. The time required to reach steady state concentrationsdepends on the boron load (boron concentration and volume of water applied), theleaching fraction and the sorptive capacity of the soil. The time required to establishequilibrium conditions has been calculated to vary from 3 to 150 years.
Agricultural Water Use: Irrigation 2nd Edition, 1996 (1st Issue) Boron: Page 2 of 9
36
! Relatively longer time periods than for unreactive ions are required for boron toxicityto manifest itself after irrigation with boron-containing water (leaching with low boronwater similarly takes longer to achieve a comparable reduction in the boronconcentration in the soil solution).
! The boron concentration in the soil solution remains relatively constant betweenirrigations compared to the concentration of unreactive ions, such as chloride. (Boronis adsorbed onto soil particles when water uptake by plants reduces the soil watercontent and concentrates the soil solution. Boron is desorbed when the soil watercontent is replenished during irrigation with water of low boron content). Since plantsrespond to the boron concentration in the soil solution, solution and sand culture datacan be used to evaluate the response of plants to boron.
! Similar to salt (see TDS), boron is also concentrated in the soil solution of deeper soillayers. The degree to which it is concentrated depends largely on the leaching fractionwhich is applied. However, most international water quality criteria are derived byassuming that boron concentrations in soil water are approximately equal to those in theirrigation water. This assumption, which was used in deriving the criteria, means thatthe criteria are only applicable under conditions where high leaching fractions exist.Where low leaching fractions exist, the boron criteria given are too high.
Measurement The criteria are given in terms of the total dissolved boron concentration, in units of mg/R.The reference method for the determination of boron is by curcumin colorimetry. Whereother methods are used, their characteristics relative to the reference method should beknown.
Data Plants respond to root uptake of boron and are not sensitive to short-term variations in theInterpretation concentration of boron in irrigation water. However, they are very dependent on the boron-
supplying capacity of the soil, which, in turn, is largely determined by soil properties andprevious boron applications. Two indices to interpret the effects of boron in irrigation waterare used:
! A time series of annual mean boron concentration (preferably application volumeweighted) is used to detect trends and potential residual effects of earlier irrigationapplications.
! The annual mean boron concentration (preferably application volume weighted) is usedto obtain the long-term mean boron concentration with which the soil will equilibrate.
No information is available for the interpretation of potential boron absorption byfoliage when plant leaves are wetted by irrigation.

Agricultural Water Use: Irrigation 2nd Edition, 1996 (1st Issue) Boron: Page 3 of 9
37
Treatment It is highly unlikely that boron can be economically removed from water intended forOptions irrigation use. However, should it be required, it is most easily removed from water along
with other ions comprising the TDS. General methods for TDS removal include:
! Ion exchange in a mixed-bed ion exchange column, usually where the feed TDS is upto around 2 000 mg/R. On a commercial or industrial scale banks of large ion-exchangefilter beds are used, which are capable of being regenerated.
! Treatment by membrane processes such as reverse osmosis or electrodialysis, wherethe TDS concentration is in the range of 2 000 - 3 500 mg/R. Large-scale watertreatment is achieved using banks of reverse osmosis modules in parallel.
! Distillation, in cases where the TDS concentration is 10 000 mg/R or more.
All of the process alternatives are easily fouled by suspended matter in the water and maysuffer from severe scaling with hard waters. All processes on a large-scale require highlevels of design, operator and maintenance skills.
All of the processes produce a concentrated waste stream of the salts that may causedisposal difficulties.
The Effects of Boron
Norms The different norms used in the guideline to assess the effects of boron on irrigation wateruse are summarised below:
Irrigation water uses Norms for measuring waterquality effects
Application to commercial crops ! Crop yield or appearance as affected bycrop sensitivity to uptake through roots
Application to sustain suitability of ! No known effects of boron on soil itself.irrigated soil Effects are indirect since boron content
of soil affects crop yield. These indirecteffects are covered under crops
Maintenance of irrigation ! No known effectsequipment
Effects Boron is an essential plant nutrient (in the µg/R range), but becomes toxic to plant growthat higher concentrations (in the mg/R range). Due to the fact that boron concentrations inthe soil solution are largely buffered by sorption to and desorption from the soil, severalseasons may be required before the effects of boron in irrigation water manifest in plantresponses.
The symptoms of boron toxicity usually occur first on older leaves as yellowing (chlorosis),spotting or drying of leaf tissue at the tips and edges. As boron accumulates with time, thesymptoms often progress towards the centre between the veins (inter-veinal) until finallyleaf drop occurs. Some sensitive fruit crops, such as stone and pome fruit, may bedamaged without leaf symptoms. A gum or exudate on the limbs or trunk and twig die-

Agricultural Water Use: Irrigation 2nd Edition, 1996 (1st Issue) Boron: Page 4 of 9
38
back are often seen on trees without typical leaf symptoms.
The yield response of plants to increasing boron concentrations is similar to their responseto increasing salinity. The yield remains unaffected until a threshold concentration isreached, after which yield declines linearly. However, quantitative data have only beendetermined for a few plants.
Plants also vary in their sensitivity to boron toxicity. The threshold concentration at whichplants are affected varies over a considerable range. (See Table 2).
It takes time for boron to accumulate in the leaves. The leaves of vegetative crops (forexample lucerne and lawns) that are cut frequently may therefore not accumulate sufficientboron to display toxic symptoms before they are harvested.
Earlier boron tolerance research was based on visual toxicity symptoms and reductions ingrowth. Unfortunately these do not always correlate with the yield of the marketableproduct.
Mitigation Common on-farm management practices to cope with increasing levels of boron in irrigationwater are to
! apply surplus irrigation to leach accumulating boron out of the soil (increase the leachingfraction). Since the boron concentration in the soil solution is strongly buffered, thisapproach is not as effective as for unreactive ions such as chloride (two to three timesas much irrigation water as for chloride is required to achieve comparable reductions inthe boron concentration of the soil solution); and/or
! accept a reduced crop yield; and/or
! switch to crops which are more boron-tolerant; and/or
! apply extra nitrogen to stimulate vegetative growth in cases where boron toxicity-induced leaf drop reduces the photosynthetic capability of a tree crop.
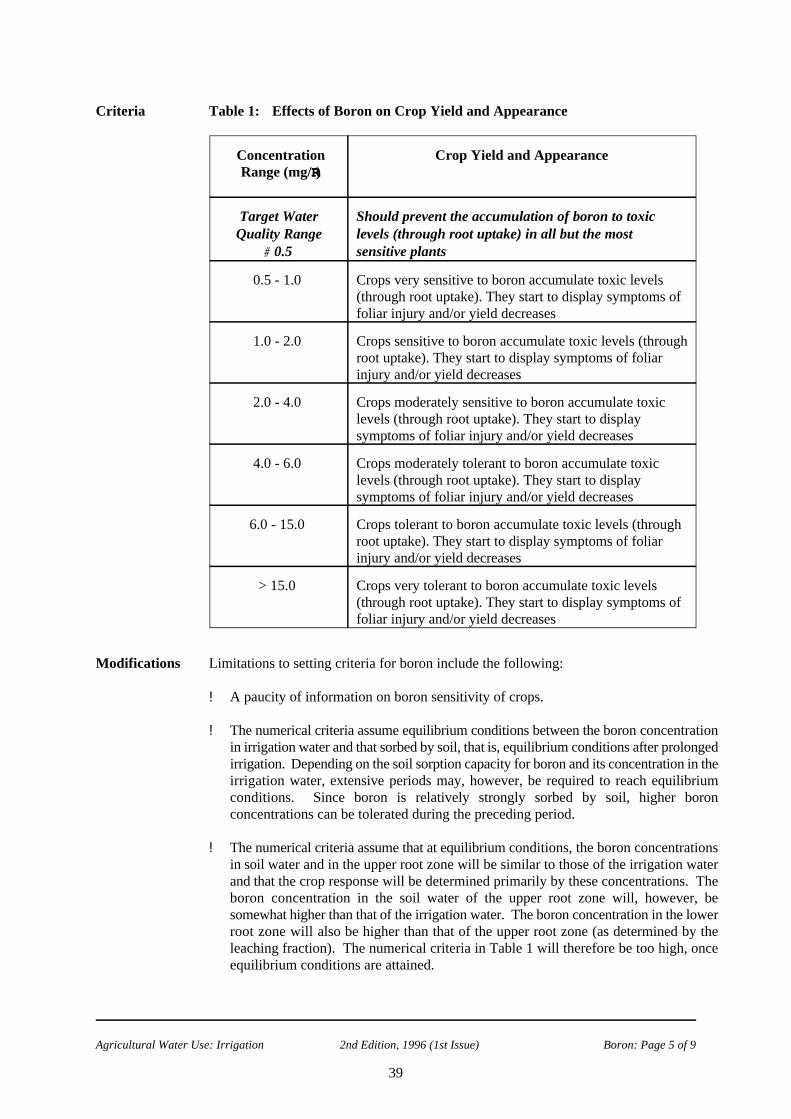
Agricultural Water Use: Irrigation 2nd Edition, 1996 (1st Issue) Boron: Page 5 of 9
39
Criteria Table 1: Effects of Boron on Crop Yield and Appearance
Concentration Crop Yield and Appearance Range (mg/RR)
Target Water Should prevent the accumulation of boron to toxicQuality Range levels (through root uptake) in all but the most
# 0.5 sensitive plants
0.5 - 1.0 Crops very sensitive to boron accumulate toxic levels(through root uptake). They start to display symptoms offoliar injury and/or yield decreases
1.0 - 2.0 Crops sensitive to boron accumulate toxic levels (throughroot uptake). They start to display symptoms of foliarinjury and/or yield decreases
2.0 - 4.0 Crops moderately sensitive to boron accumulate toxiclevels (through root uptake). They start to displaysymptoms of foliar injury and/or yield decreases
4.0 - 6.0 Crops moderately tolerant to boron accumulate toxiclevels (through root uptake). They start to displaysymptoms of foliar injury and/or yield decreases
6.0 - 15.0 Crops tolerant to boron accumulate toxic levels (throughroot uptake). They start to display symptoms of foliarinjury and/or yield decreases
> 15.0 Crops very tolerant to boron accumulate toxic levels(through root uptake). They start to display symptoms offoliar injury and/or yield decreases
Modifications Limitations to setting criteria for boron include the following:
! A paucity of information on boron sensitivity of crops.
! The numerical criteria assume equilibrium conditions between the boron concentrationin irrigation water and that sorbed by soil, that is, equilibrium conditions after prolongedirrigation. Depending on the soil sorption capacity for boron and its concentration in theirrigation water, extensive periods may, however, be required to reach equilibriumconditions. Since boron is relatively strongly sorbed by soil, higher boronconcentrations can be tolerated during the preceding period.
! The numerical criteria assume that at equilibrium conditions, the boron concentrationsin soil water and in the upper root zone will be similar to those of the irrigation waterand that the crop response will be determined primarily by these concentrations. Theboron concentration in the soil water of the upper root zone will, however, besomewhat higher than that of the irrigation water. The boron concentration in the lowerroot zone will also be higher than that of the upper root zone (as determined by theleaching fraction). The numerical criteria in Table 1 will therefore be too high, onceequilibrium conditions are attained.

Agricultural Water Use: Irrigation 2nd Edition, 1996 (1st Issue) Boron: Page 6 of 9
40
! Table 2 provides a list of commercial crops grouped into boron tolerance classes.
! The effect of boron on woody crops is determined largely by the rootstock that is used.Table 3 provides a list of citrus and stone fruit rootstocks ranked in order of increasingboron accumulation and transport to scions.
! Leaf symptoms and vegetative growth are important yardsticks for ornamental plants.Soil water concentrations at which these are affected for a number of ornamental plantsare given in Table 4.
! Potted plants usually receive water applications in excess of the assumptions used toderive the criteria. Practically no leaching occurs, with the result that boron willaccumulate faster and to higher concentrations than under field conditions.
! The criteria may not protect commercial floricultural crops grown in greenhouseswithout soil (hydroponic or similar methods) because the criteria assume that the soilhas the capacity to deactivate boron.

Agricultural Water Use: Irrigation 2nd Edition, 1996 (1st Issue) Boron: Page 7 of 9
41
Table 2: A List of Crops Grouped into Boron Tolerance Classes according toThreshold Boron Concentrations (mg/RR) in Soil Solution
Very Sensitive Moderatel Moderately Tolerant Verysensitive y Tolerant Tolerant ## 0.5 0.5 - 1.0 Sensitive 2.0 - 4.0 4.0 - 6.0 6.0 - 15.0
1.0 - 2.0
Lemon* Lemon* Broccoli Cabbage* Lucerne* SorghumBlackberry Avocado* Pepper, red Turnip Vetch, Cotton* Grapefruit* Pea* Bluegrass, purple* Celery*
Orange * Carrot Kentucky* Parsley* Asparagus*Apricot* Radish Barley Beet, redPeach* Potato Cowpea Sugar beetCherry* Cucumber Oats TomatoPlum* Lettuce* MaizePersimmon* Artichoke*Fig, kadota* Tobacco*Grape* Mustard*Walnut* Clover, sweet*Pecan* SquashOnion Muskmelon*Garlic CauliflowerSweet potatoWheatSunflowerBean, mung*Sesame*Lupine*Strawberry*Artichoke,Jerusalem*Bean, kidney*Bean, snapBean, lima*Peanut
* Tolerance based on reductions in vegetative growth rather than marketable product
Note: The crops are listed in approximate order of increasing tolerance.

Agricultural Water Use: Irrigation 2nd Edition, 1996 (1st Issue) Boron: Page 8 of 9
42
Table 3 : Rootstocks of Citrus and Stone Fruit Ranked in order of Increasing BoronAccumulation and Transport to Scions
Citrus Stone fruit
Alemow AlmondGajanimma Myrobalan plum
Chinese box orange ApricotSour orange Marianna plumCalamondin Shalil peachSweet orange
YuzuRough lemon
GrapefruitRangpur lime
Troyer citrangeSavage citrange
Cleopatra mandarinRusk citrange
Sunki mandarinSweet lemon
Trifoliate orangeCitrumelo 4475
Ponkan mandarinSampson tangeloCuban shaddock
Sweet lime
Table 4: A List of Ornamental Plants Grouped into Boron Tolerance Classesaccording to Threshold Boron Concentration (mg/RR) in Soil Solution
Very sensitive Sensitive Moderately Moderately Tolerant
## 0.5 0.5 - 1.0 1.0 - 2.0 2.0 - 4.0 6.0 - 8.0sensitive tolerant
Oregon grape Zinnia Gladiolus Bottlebrush Indian hawthornPhotinia Pansy Marigold California poppy Natal plumXylosma Violet Poinsettia Japanese boxwood OxalisThorny elaeagnus Larkspur China aster OleanderLaurustinus Glossy abelia Gardenia Chinese hibiscusWax-leaf privet Rosemary Southern yew Sweet peaPineapple guava Oriental arborvitae Brush cherry CarnationSpindle tree Geranium Blue dracaenaJapanese CenizapittosporumChinese hollyJuniperYellow sageAmerican elm
Notes:! Plants are listed in order of increasing tolerance, based on appearance and
growth reduction.! Boron concentrations exceeding the threshold may cause leaf burn and loss
of leaves.

Agricultural Water Use: Irrigation 2nd Edition, 1996 (1st Issue) Boron: Page 9 of 9
43
Sources of Information
APHA 1989. Standard Methods for the Examination of Water and Waste Water, 17thEdition. American Public Health Association, American Water Works Association, WaterPollution Control Federation. Published by the American Public Health Association,Washington DC, USA.
AYERS R.S. and D.W. Westcott 1985. Water Quality for Agriculture, FAO Irrigation andDrainage Paper No. 29. FAO, Rome.
BERMAN E. 1980. Toxic Metals and Their Analysis. Heyden, London.
BOWEN H.J.M. 1979. Environmental Chemistry of the Elements. Academic Press,London.
CANADIAN GUIDELINES 1987. Canadian Water Quality Guidelines. Prepared by theTask Force on Water Quality Guidelines of the Canadian Council of Resource andEnvironment Ministers. Canada.
DEVEREL S.J. and R. Fujii 1990. Chemistry of Trace Elements in Soils and GroundWater. In: Agricultural Salinity Assessment and Management, K.K. Tanjii (Ed.). ASCEManuals and Reprints on Engineering Practice No. 71. ASCE New York, 1990.
FORD W.E. and E.S. Dana 1963. A Textbook of Mineralogy, 4th Edition. John Wiley &Sons Inc., New York.
HART B.T., C. Angehrn-Bettinazzi, I.C. Campbell and M.J. Jones 1992. Draft AustralianWater Quality Guidelines. Australian and New Zealand Environment and ConservationCouncil. January 1992.
KEREN R. and S. Miyamoto 1990. Reclamation of Saline, Sodic and Boron-affectedSoils. In: Agricultural Salinity Assessment and Management, K.K. Tanjii (Ed.). ASCEManuals and Reprints on Engineering Practice No 7. ASCE New York 1990.
MAAS E.V. 1990. Crop Salt Tolerance. In: Agricultural Salinity Assessment andManagement, K.K Tanjii (Ed.). ASCE Manuals and Reports on Engineering Practice No.71. ASCE New York 1990.
PAGE A.L. and A.C. Chang 1990. Deficiencies and Toxicities of Trace Elements. In:Agricultural Salinity Assessment and Management, K.K. Tanjii (Ed.). ASCE Manuals andReprints on Engineering Practice No. 71. ASCE New York 1990.
PRATT P.F. and D.L. Suarez 1990. Irrigation Water Quality Assessments. In:Agricultural Salinity Assessment and Management, K.K. Tanjii (Ed.). ASCE Manuals andReports on Engineering Practice No. 71. ASCE New York 1990.
WEAST R.C. 1979. CRC Handbook of Chemistry and Physics, 60th Edition, CRC PressInc., Boca Raton, Florida, USA.

44
Agricultural Water Use: Irrigation 2nd Edition, 1996 (1st Issue) Cadmium: Page 1 of 5
45
CadmiumTentative Guideline
Background Information
Introduction Cadmium is a soft, bluish-white metal chemically similar to zinc and highly toxic to livingorganisms. The presence of cadmium in the aquatic environment is of concern because itbioaccumulates. Cadmium has a low solubility under conditions of neutral or alkaline pHand is highly soluble under acidic conditions, where toxic concentrations can easily arisefrom the dissolution of cadmium from cadmium-plated materials.
Plants respond to the cadmium concentration in the soil solution. Similar to most traceelements, cadmium is strongly adsorbed by soil and its addition in relatively highconcentrations over the short-term may not result in reduced crop growth or in itsaccumulation in plant parts to concentrations detrimental to humans or animals. However,continuous application of cadmium to soils over extended periods results in its accumulationin the surface soil layer, in practice, the cultivated or plough layer.
Occurrence Cadmium occurs in association with zinc ores and is also found as the mineral Greenockite(cadmium sulphide). Cadmium sulphide, carbonate and hydroxide salts are insoluble inwater, whereas cadmium chloride, nitrate and sulphate salts are highly soluble in water.Cadmium binds strongly to sulphydryl groups, hence, the pronounced tendency of cadmiumto bioaccumulate in the food chain. Cadmium is not usually found in water atconcentrations greater than 1 Fg/R, unless the water has been subject to pollution fromindustrial effluents containing cadmium.
Cadmium is used in electroplating, in alloys, in certain solders and in nickel-cadmiumbatteries. Salts of cadmium are used in photography, pottery, the electronics industry andas pigments in many different applications.
Interactions The soil chemical behaviour of cadmium is similar to that of copper, lead, nickel and zinc.Cadmium is strongly adsorbed by soil clay minerals and coprecipitated with iron andmanganese oxides and oxy-hydroxides. It is for these reasons that cadmium has a limitedvertical movement through neutral to alkaline soils. Its availability to plants increases at lowpH levels and with increasing chloride concentrations. Plant availability is reduced whenthe concentration of organic matter is high.
Cadmium concentrations in the soil solution are largely determined by sorption anddesorption reactions with the soil exchange complex. Sorption dominates at the relativelylow concentrations that are of concern for water quality criteria for irrigation. Soil pH hasa major effect on the concentration of cadmium in the soil solution and solubility decreaseswith increasing pH. Implications for irrigation with water containing cadmium include the following:
! Cadmium can be expected to be retained in the soil surface layers because of its strongsorption by the soil exchange complex.
! Significant downward movement to below the plough layer and hence contaminationof ground water with cadmium is unlikely.
Agricultural Water Use: Irrigation 2nd Edition, 1996 (1st Issue) Cadmium: Page 2 of 5
46
! The larger the soil's cation exchange capacity (determined by clay content and claymineral type), the more cadmium can generally be sorbed.
! Soils with a neutral to alkaline pH will be able to accept a greater cadmium load thanacidic soils, before concentrations in the soil solution become phytotoxic.
Measurement The criteria are given in terms of the total cadmium concentration, in units of mg/R. Thereference method for the measurement of cadmium is atomic absorption spectrometry. Ifother methods of analysis are used, their characteristics relative to the reference methodshould be known.
Data Because cadmium is retained strongly by soils, it is likely to accumulate to phytotoxicInterpretation concentrations before equilibrium between sorption and desorption reactions is reached.
In order to prevent its accumulation, the total load applied to soil needs to be limited.International criteria for the concentration of cadmium in irrigation water have beencalculated (using limited available information) to ensure that accumulation to eitherphytotoxic levels or levels that are toxic to consumers, within a given time period, do notoccur. The calculations assume that cadmium accumulates within the surface 150 mm ofsoil. As such the objectives of sustained soil suitability for continued use and maintenanceof crop yield and quality are accounted for.
The arithmetic mean concentration of the applied water (preferably application volumeweighted) is given in the criteria for
! the cadmium concentration that can be applied to any soil on a continuous basis. Thisconcentration is calculated such that cadmium does not accumulate to phytotoxicconcentrations in a soil that is irrigated continuously for up to 100 years at an irrigationapplication rate of 1 000 mm p.a.
! the cadmium concentration that can be applied to fine textured, neutral to alkaline soilsfor a period of up to 20 years at an irrigation application rate of 1 000 mm p.a.
Treatment It is highly unlikely that cadmium can be economically removed from water intended forOptions irrigation use. However, should it be required, cadmium can be most conveniently
removed by raising the pH and precipitating the insoluble cadmium salts after the additionof lime or iron salts in the pH range of 8.5 - 11.5. Precipitation is followed by settlementand filtration as in conventional water treatment. The precipitation process requires carefulmonitoring to ensure that removal is complete. A watery, cadmium-rich sludge orconcentrate stream is generated in the processes that may present disposal difficulties.
To achieve very low residuals, it may be necessary to pass the stream through an ionexchange column charged with the appropriate resin.
The Effects of Cadmium
Norms The different norms used in the guideline to assess the effects of cadmium on irrigationwater use are summarised in the following table.

Agricultural Water Use: Irrigation 2nd Edition, 1996 (1st Issue) Cadmium: Page 3 of 5
47
Irrigation water uses Norms for measuring waterquality effects
Application to commercial ! Crop yield as affected by crop sensitivity tocrops cadmium uptake through plant roots
! Crop quality as determined by cadmiumtoxicity to consumers
Application to sustain suitability ! Accumulation in soil to concentrations whereof irrigated soil either crop yield or crop quality is affected
Maintenance of irrigation ! No known effectsequipment
Effects Cadmium is readily taken up by plants, even though it is not an essential plant nutrient.Due to its chemical similarity to zinc (an essential plant nutrient), cadmium can readilyinterfere with some plant metabolic processes and is therefore toxic to many plants. Plants,however, do vary in their sensitivity to cadmium. Nutrient solution concentrations of 0.1mg/R reduce the yields of bean, beets and turnips by 25 %, whereas cabbage and barleyyields are reduced by 20 % - 50 % in a 1 mg/R solution. A 25 % reduction in the yields offield crops grown in soil were found at cadmium concentrations varying from 4 mg/kg forspinach to 640 mg/kg for rice. The regular consumption of cadmium-enriched foods overdecades results in the accumulation of cadmium to concentrations that are detrimental tohuman health.
Mitigation Common on-farm management practices to mitigate against cadmium uptake by plants onirrigated land, are to
! apply agricultural lime in order to raise (or maintain) soil pH to neutral to slightlyalkaline; and/or
! switch to a crop that is more tolerant to cadmium; and/or
! ensure an adequate supply of zinc, manganese and copper - the uptake of cadmium isreduced by an adequate supply of these elements.

Agricultural Water Use: Irrigation 2nd Edition, 1996 (1st Issue) Cadmium: Page 4 of 5
48
Criteria Effects of Cadmium on Crop Yield and Quality
Concentration Crop Yield and QualityRange (mg/RR)
Target Water Toxic to beans, beets and turnips at concentrations as lowQuality Range as 0.1 mg/R in nutrient solutions. Conservative limits are
# 0.01 needed because of cadmium’s potential for accumulationin plants and soils to concentrations that may be toxic tohumans and animals
0.01 - 0.05 Maximum acceptable as concentration for fine-texturedneutral to alkaline soils
> 0.05 Acceptable for irrigation only over the short term on a site-specific basis
Note:
! The TWQR for relatively unrestricted use on all soils and the concentrationrange for fine-textured neutral to alkaline soils for irrigation periods of up to20 years, are similar to most international criteria.
! The above criteria are based on relatively limited information and should beviewed as tentative.
! The criteria are calculated to ensure soil sustainability for continued cropproduction.
Modifications ! The criteria were derived with the assumption that the soil to be irrigated contained onlynegligible quantities of cadmium. Should this not be the case, the period of irrigationneeds to be reduced accordingly.
! More cadmium is absorbed by plants in the presence of chlorides. Lower cadmiumconcentrations need to be applied when irrigation water contains appreciable chlorideconcentrations.
! The criteria may not protect commercial floricultural crops grown in greenhouseswithout soil (hydroponic or similar methods), because the criteria assume that the soilhas the capacity to deactivate cadmium.
! Should the site-specific conditions vary significantly from the assumptions that wereused to derive the criteria, the criteria may need adjustment.
! Potted plants normally receive water applications in excess of the assumptions used toderive the criteria. Since potted plants are only grown for limited periods, the criteriaapplicable to fine-textured neutral to alkaline soils, can mostly be used.

Agricultural Water Use: Irrigation 2nd Edition, 1996 (1st Issue) Cadmium: Page 5 of 5
49
Sources of Information
APHA 1989. Standard Methods for the Examination of Water and Waste Water, 17thEdition. American Public Health Association, American Water Works Association, WaterPollution Control Federation. Published by the American Public Health Association,Washington DC, USA.
AYERS R.S. and D.W. Westcott 1985. Water Quality for Agriculture FAO Irrigation andDrainage Paper, No. 29. FAO, Rome.
BERMAN E. 1980. Toxic Metals and Their Analysis. Heyden, London.
BOWEN H.J.M. 1979. Environmental Chemistry of the Elements. Academic Press,London.
CANADIAN GUIDELINES 1987. Canadian Water Quality Guidelines. Prepared by theTask Force on Water Quality Guidelines of the Canadian Council of Resource andEnvironment Ministers. Canada.
DEPARTMENT OF WATER AFFAIRS AND FORESTRY 1993. South African WaterQuality Guidelines, Volume 4: Agricultural Use.
DEVEREL S.J. and R. Fujii 1990. Chemistry of Trace Elements in Soils and Ground Water. In: Agricultural Salinity Assessment and Management, K.K. Tanjii (Ed.).ASCE Manuals and Reprints on Engineering Practice No. 71. ASCE New York 1990.
HART B.T. 1974. A Compilation of Australian Water Quality Criteria. AWRCTechnical Paper No. 7.
HART B.T., C. Angehrn-Bettinazzi, I.C. Campbell and M.J. Jones 1992. Draft AustralianWater Quality Guidelines. Australian and New Zealand Environment and ConservationCouncil. January 1992.
McKEE J.E. and H.W. Wolf 1963. Water Quality Criteria, 2nd Edition. California StateWater Resources Control Board, Publication No. 3-A. California.
PAGE A.L. and A.C. Chang 1990. Deficiencies and Toxicities of Trace Elements. In:Agricultural Salinity Assessment and Management, K.K. Tanjii (Ed.). ASCE Manuals andReprints on Engineering Practice No. 71. ASCE New York, 1990.
PRATT P.F. and D.L. Suarez 1990. Irrigation Water Quality Assessments. In:Agricultural Salinity Assessment and Management, K.K. Tanjii (Ed). ASCE Manuals andReports on Engineering Practice No. 71. ASCE New York 1990.
UNITED STATES ENVIRONMENTAL PROTECTION AGENCY 1973. ProposedCriteria for Water Quality. US EPA, Washington DC October 1979.
WEAST R.C. 1979. CRC Handbook of Chemistry and Physics, 60th Edition. CRC PressInc., Boca Raton, Florida, USA.

50

Agricultural Water Use: Irrigation 2nd Edition, 1996 (1st Issue) Chloride: Page 1 of 8
51
ChlorideBackground Information
Introduction Chloride is the anion of the element chlorine. Chlorine does not occur in nature, but isfound only as chloride. The chlorides of sodium, potassium, calcium and magnesium areall highly soluble in water. Chloride is an essential plant micronutrient. Unlike most othermicronutrients it is, however, relatively non-toxic to most crops.
Occurrence Chloride is a common constituent in water, is highly soluble, and once in solution tends toaccumulate. Typically, concentrations of chloride in fresh water range from a few toseveral hundred mg/R. In sea water the concentration is approximately 19 800 mg/R.Chloride inputs to surface waters can arise from irrigation return flows, sewage effluentdischarges and various industrial processes. Chloride can only be removed from water byenergy-intensive processes.
Interactions Being an anion, chloride is only very weakly sorbed by the soil exchange complex (whichis mainly a cation exchanger). The movement of chloride in soil is considered to beunaffected by exchange reactions since chlorides leach freely and their relativeconcentration and distribution in the soil profile is largely determined by the leachingfraction (see TDS).
Measurement The criteria are given in terms of the dissolved chloride concentration, in units of mg/R.Dissolved chloride is usually determined colorimetrically by means of ferricyanide. Thisis a reference method. If other methods are used, their characteristics relative to thereference method should be known.
Data The chloride concentration of irrigation water provides an indication of the concentrationsInterpretation at which
! root uptake (that is, when foliage is not wetted by the irrigation method) by crops canbe expected to result in the uptake of chloride to plant toxic levels. The arithmeticmean concentration during the active growing season (preferably application volumeweighted) is used.
! leaf uptake (that is, when foliage is wetted by the irrigation method) by crops can beexpected to result in the uptake of chloride to plant toxic levels. The arithmetic meanconcentration during the active growing season (preferably application volumeweighted) is used.
! leaf burn (foliar damage) of crops can be expected to occur when crop foliage is wettedby irrigation water. The maximum concentration during the active growing season isused.
! chloride will accumulate in consumable plant parts for which a maximum chlorideconcentration from a quality perspective has been defined. The arithmetic meanconcentration during the active growing season (preferably application volumeweighted) is used.
Chloride concentrations should also be interpreted in conjunction with the concentrations

Agricultural Water Use: Irrigation 2nd Edition, 1996 (1st Issue) Chloride: Page 2 of 8
52
of the other major cations and anions.
Treatment Chlorides are highly soluble and cannot be precipitated at concentrations usually present inOptions water. Removal of chloride from water intended for irrigation purposes is not
economically feasible. However, should it be required, chloride can be removed fromwater by electrolysis to form chlorine gas liberated at the anode. Electrolysis is not effectivewhere the conductivity and the chloride concentration is low.
More commonly, chloride is removed together with other ions using
! anion exchange resin beds, in which all significant anions will be removed; and
! desalination techniques such as reverse osmosis and electrodialysis.
The concentrated waste streams generated from ion exchange and desalination processesmay cause disposal difficulties. Desalination techniques require skilled operation, controland maintenance. Capital and operating costs are typically high.
The Effects of Chloride
Norms The different norms used in the guideline to assess the effects of chloride on irrigation wateruse are summarised below:
Irrigation water uses Norms for measuring waterquality effects
Application to commercial crops ! Crop yield as affected by cropsensitivity to uptake through crop roots
! Crop yield as affected by cropsensitivity to uptake through foliage
! Crop quality as determined by damageto marketed produce or by limits onconcentration in final product
Application to sustain suitability of ! No known effects of chloride on itsirrigated soil own
Maintenance of irrigation ! No known effectsequipment
Effects When the accumulated chloride concentration in leaves exceeds the crop's tolerance, injurysymptoms develop in the form of leaf burn. This starts at the tips of leaves and progressesfrom the tip back, along the edges, as the severity increases. In extreme cases chloridetoxicity manifests itself in early leaf drop.
With a few exceptions (notably some soybean cultivars), non-woody plants are notspecifically sensitive to chloride. When irrigated with water with a high concentration of

Agricultural Water Use: Irrigation 2nd Edition, 1996 (1st Issue) Chloride: Page 3 of 8
53
chloride, yield decreases because the osmotic threshold of total salinity (see TDS) has beenexceeded, but no obvious injury symptoms occur.
On the other hand, many of the economically important woody plants are susceptible tochloride concentrations lower than the salinity threshold. Chloride can be absorbed eithersingly through plant roots or plant foliage, or through a combination of both.
Absorption through plant roots
Chlorides are very soluble and are not adsorbed to any significant degree by soil, but arereadily transported with the soil water, and are taken up by roots and conveyed in thetranspiration stream, where they accumulate in the leaves. Plants vary in their ability torestrict the transport of chloride to the shoots. The tolerance of avocado, citrus and grapesrelates closely to the ability of rootstocks to exclude or accumulate chloride.
Crops vary in their sensitivity to chloride and suffer yield reduction once the thresholdconcentration in the soil solution is exceeded. The yield response of crops to chloride has,as yet, not been well characterised. Chloride-crop response curves for crops that are notspecifically sensitive to chloride have been developed, using the results of the experimentsthat derived TDS-crop curves, which were determined with artificial mixtures of sodiumand calcium chloride. Absorption through plant foliage
Crops wetted by saline water are exposed not only to root zone salinity but also toabsorption directly through the leaves. Experiments to quantify the additional impact offoliar damage from sprinkler irrigation to crop yield, indicate that the effects can besubstantial. Crop tolerances to foliar absorption have, as yet, not been well characterisedand research in this regard is compounded by the pronounced influence of climaticconditions such as high temperatures, low humidity and wind, all of which aggravateadverse effects.
Further, the foliar absorption rate in crops also varies. The absorption rates of avocadoleaves are low while those of citrus, stone fruits and almonds are high. This means thatchloride concentrations as low as 70 - 105 mg/R can cause foliar damage.
Crop Quality
Crop quality is affected by chloride-induced leaf injury in plants whose leaves are themarketed product, or where fruit size and appearance are affected by chloride-induced yielddecreases. These aspects of crop quality are covered by the criteria (to the extent thatinformation is available) for yield decreases and foliar damage from chloride absorptionthrough plant roots and/or foliage.
Tobacco is an exception. Neither the yield nor the foliar appearance of tobacco isdetrimentally affected by moderate chloride concentrations. However, the burningproperties and storage life (important quality criteria) of tobacco leaves are detrimentallyaffected even at relatively low concentrations of chloride in the leaves.

Agricultural Water Use: Irrigation 2nd Edition, 1996 (1st Issue) Chloride: Page 4 of 8
54
Mitigation Chloride uptake through either roots or foliage
Common on-farm management practices to cope with an increasing chloride content ofwater affecting crop yield and quality, are to
! accept a reduced crop yield or quality; and/or
! switch to crops that are more tolerant to chloride.
Chloride uptake through foliage
Common on-farm practices to cope with problems arising from the wetting of foliage, areto
! switch to an irrigation application method that does not wet the leaves; or
! switch to crops with a lower foliar adsorption rate; and/or
! reduce the possibility for foliar absorption of chloride by reducing the number of wettingand drying cycles (that is, reducing the irrigation frequency) and/or by irrigating at nightwhen temperature (absorption rate) and evaporation (salt concentration rate) are lower;and/or
! rinse the leaves at the end of an irrigation application with low chloride water; and/or
! avoid irrigation during periods of high wind. (Wind is a major factor in theconcentration and absorption of chloride. The downwind drift of sprinklers is moreconcentrated than the applied sprinkler water and thus more likely to cause foliardamage); and/or
! increase sprinkler rotation speed (sprinklers that rotate slowly allow appreciable dryingbetween rotations); and/or
! increase application rate (within the limits posed by soil water storage capacity andinfiltration rate, thereby reducing the time period available for foliar absorption); and/or
! increase droplet size (this results in less absorption compared to small drops).
Chloride absorption through roots
Common on-farm management practices to cope with increasing problems arising fromchloride, are to
! apply surplus irrigation (in addition to the evapotranspirational requirement) in order toleach accumulating chloride out of the soil (increased leaching fraction); and/or
! select, for some horticultural crops (for example grapes, citrus, avocado), a moretolerant rootstock.

Agricultural Water Use: Irrigation 2nd Edition, 1996 (1st Issue) Chloride: Page 5 of 8
55
Criteria Table 1: Effects of Chloride on Crop Yield and Quality
Concentration Crop Yield and QualityRange (mg/RR)
Target Water Should prevent the accumulation of chloride to toxic levelsQuality Range in all but the most sensitive plants, even when chloride
# 100 uptake is through foliar absorption, that is, crop foliage iswetted
< 140 Should prevent the accumulation of chloride to toxic levels inall but the most sensitive plants, when chloride uptake isthrough root absorption, that is, water is applied to the soilsurface, thereby excluding wetting of crop foliage
140 - 175 Only slight problems with the accumulation of chloride to
100 - 175 Crops sensitive to foliar absorption accumulate toxic levels of
levels toxic to crops can be expected when chloride uptake isthrough root absorption, that is, water is applied to the soilsurface, thereby excluding wetting of crop foliage
chloride when crop foliage is wetted. They display foliar injuryand yield decreases
175 - 350 Some problems with the accumulation of chloride to levelstoxic to moderately sensitive crops can be expected whenchloride uptake is through root absorption, that is, water isapplied to the soil surface, thereby excluding wetting of cropfoliage
Crops moderately sensitive to foliar absorption accumulatetoxic levels of chloride when crop foliage is wetted. Theydisplay symptoms of foliar injury and yield decreases
350 - 700 All moderately sensitive crops and most moderately tolerantcrops accumulate chloride to levels toxic to crops whenchloride uptake is through root absorption, that is, water isapplied to the soil surface thereby excluding wetting of cropfoliage
Crops moderately tolerant to foliar absorption accumulatetoxic levels of chloride when crop foliage is wetted. Theydisplay symptoms of foliar injury and yield decreases
>700 Increasing problems with the accumulation of chloride tolevels toxic to crops can be expected when chloride uptake isthrough root absorption, that is, water is applied to the soilsurface thereby excluding wetting of crop foliage
Crops tolerant to foliar absorption increasingly accumulatetoxic levels of chloride when crop foliage is wetted. Theydisplay symptoms of foliar injury and yield decreases
Note:
! Crop tolerance to chloride, when crop foliage is wetted by sprinkler irrigation, isnot well established. Very little local confirmation of internationally published

Agricultural Water Use: Irrigation 2nd Edition, 1996 (1st Issue) Chloride: Page 6 of 8
56
experiments has taken place. The indicated concentration ranges apply todaytime sprinkling under conditions that are not too hot or too dry.
Modifications ! Environmental or other conditions causing an increased chloride concentration onfoliage (e.g. hot, dry conditions) necessitate more conservative criteria for croptolerance to foliar absorption, and vice versa (see Mitigation).
! The relative susceptibility of some crops to foliar injury is presented in Table 2.
! Potted plants usually receive water in excess of the assumptions used to derive thecriteria. Practically no leaching occurs with the result that chloride will accumulatefaster and to higher concentrations than under field conditions.
! Water and plant nutrients are often recirculated in commercial floriculture (e.g.hydroponics and soilless growth media) with the result that salts accumulate. Sincewater application is mostly controlled to ensure minimal matric potentials, higher saltand chloride concentrations can be tolerated. It should, however, still be controlled towithin plant tolerance levels.
! The effect of chloride on woody crops is determined largely by the rootstock that isused. By choosing an appropriate rootstock, the chloride concentration that istransported to the scion can be reduced drastically.
Table 2 : Relative Susceptibility of Crops to Foliar Injury from Saline SprinklingWaters
Chloride Concentration (mg/RR) Causing Foliar Injury in Crops of VaryingSensitivity to Foliar Absorption
Sensitive Moderately Moderately Tolerant
## 175 175 - 350 350 - 700 > 700 sensitive tolerant
Almond Pepper Barley CauliflowerApricot Potato Maize CottonCitrus Tomato Cucumber Sugar beetPlum Lucerne SunflowerGrape Safflower
Sesame Sorghum
Note:
! The data in the above table are general criteria for daytime sprinklingunder conditions that are not too hot or too dry.
! Tobacco presents a special case of chloride-sensitivity. Even at lowconcentrations, chloride in tobacco leaves affects the burning propertiesand storage life, and thus quality and price, of the leaves. Even thoughchloride in water and soil does not affect yield, it plays a deciding role inthe economy of tobacco production. The quality of tobacco can be

Agricultural Water Use: Irrigation 2nd Edition, 1996 (1st Issue) Chloride: Page 7 of 8
57
affected by chloride concentrations exceeding 25 mg/R in irrigation water.
! Table 3 indicates the susceptibility of some crops in chloride toleranceclasses, grouped according to their threshold chloride concentration insaturated-soil extracts. It should be used only as a guideline for relativecrop tolerances. The tolerance classes used in Table 3 agreeapproximately with those used in Table 1. It can therefore be used as anindication of the crops that are referred to in Table 1.
Although the chloride concentration in the saturated-soil extract is largely determinedby that of the irrigation water, several other factors have a moderating effect. Expertadvice should be sought to derive criteria for site-specific conditions.
Table 3: Annual Crops Grouped into Chloride Tolerance Classes according toThreshold Chloride Concentrations (mg/RR) in Saturated-soil Extracts
Sensitive Moderately Moderately Tolerant Very tolerant
## 350 425 700 - 1 200 400 - 2 100 2 450 - 2 800sensitive tolerant
Strawberry Pepper Trefoil, big Beet, red SorghumBean Clover, strawberry Lovegrass Fescue, tall Bermuda grassOnion Clover, red Spinach Squash, zucchini Sugar beet*Carrot Clover, alsike Alfalfa Hardinggrass Wheat grass,Radish Clover, ladino Sesbania* Cowpea fairway crestedLettuce Corn Cucumber Trefoil, narrow- CottonTurnip Flax Tomato leaf bird's foot Wheat grass,
Potato Broccoli Ryegrass, tallSweet Potato Squash, scallop perennial Barley*Broad bean Vetch, common Wheat, DurumCabbage Wild rye, Barley (forage)*Foxtail, meadow beardless WheatCelery Sudan grassClover, Berseem Wheat grass,Orchardsgrass standard crestedSugarcane
* Less tolerant during emergence and seedling stage
Note: Crops are listed in columns in order of increasing tolerance from top tobottom.

Agricultural Water Use: Irrigation 2nd Edition, 1996 (1st Issue) Chloride: Page 8 of 8
58
Sources of Information
APHA 1989. Standard Methods for the Examination of Water and Waste Water, 17thEdition. American Public Health Association, American Water Works Association, WaterPollution Control Federation. Published by the American Public Health Association,Washington DC, USA.
AYERS R.S. and D.W. Westcott 1985. Water Quality for Agriculture. FAO Irrigationand Drainage Paper No. 29. FAO, Rome, 19.
BOWEN H.J.M. 1979. Environmental Chemistry of the Elements. Academic Press,London.
CANADIAN GUIDELINES 1987. Canadian Water Quality Guidelines. Prepared by theTask Force on Water Quality Guidelines of the Canadian Council of Resource andEnvironment Ministers. Canada.
HART B.T., C. Angehrn-Bettinazzi, I.C. Campbell and M.J. Jones 1992. Draft AustralianWater Quality Guidelines. Australian and New Zealand Environment and ConservationCouncil. January 1992.
MAAS E.V. 1990. Crop Salt Tolerance. In: Agricultural Salinity Assessment andManagement, K.K. Tanjii (Ed.). ASCE Manuals and Reports on Engineering Practice No.71. ASCE New York 1990.
McKEE J.E. and H.W. Wolf 1963. Water Quality Criteria, 2nd Edition. California StateWater Resources Control Board, Publication No. 3-A. California.
PRATT P.F. and D.L. Suarez 1990. Irrigation Water Quality Assessments. In:Agricultural Salinity Assessment and Management, K.K. Tanjii (Ed.). ASCE Manualsand Reports on Engineering Practice No. 71. ASCE New York 1990.
WHO 1984. Guidelines for Drinking Water Quality, Volume 2: Health Criteria and OtherSupporting Information. World Health Organization, Geneva.

Agricultural Water Use: Irrigation 2nd Edition, 1996 (1st Issue) Chromium (VI): Page 1 of 6
59
Chromium(VI)Tentative Guideline
Background Information
Introduction Chromium(VI) is a highly oxidated state of metal chromium. It occurs as the yellow-coloured dichromate salt under neutral or alkaline conditions, and as the orange-colouredchromate salt under acidic conditions. Chromium(VI) is highly water soluble at all pHvalues. The reduced forms of chromium, namely chromium(II) and chromium(III), are lesssoluble than chromium(VI), have much lower toxicity indices than chromium(VI) and donot constitute as serious a health hazard.
Chromium is not essential for plant growth, but is toxic at high concentrations. Similar tomost trace elements, chromium is strongly adsorbed by soil. Its addition in relatively highconcentrations over the short-term may not result in reduced crop growth or in itsconcentration in plant parts that is detrimental to human or animal consumption. However,continuous applications of chromium to the soil over extended periods result in itsaccumulation in the surface soil layer, in practice, the cultivated or plough layer.
Occurrence The most common ore of chromium is chromite, in which chromium occurs in the trivalentstate. Minerals containing chromium(VI) do occur, but are not common. Elevatedconcentrations of chromium(VI) found in the environment are due to industrial pollution.Because chromium(VI) is highly water soluble it is mobile in the environment and movesthrough the soil profile, resulting in contamination of ground water supplies. Chromium(VI)can be reduced to chromium(III) under suitable pH and reducing conditions. However,chromium(III) can also be re-oxidised to chromium(VI) under oxidising conditions.Chromium(VI) is not normally found in water at concentrations greater than 0.01 mg/R.Higher concentrations potentially occur wherever industrial activity using chromium(VI)compounds are located.
In water, chromium(II) and chromium(III) are not normally found at near-neutral pH, sincethe hydroxides of these two oxidation states are insoluble. However, they may occur inwater under acidic conditions.
Chromic acid or hexavalent chromium salts are used in alloys in the metal pickling andplating industry, in the leather industry and in the manufacture of paints, dyes, explosives,ceramics and paper.
Interactions Chromium concentrations in the soil solution are largely determined by sorption anddesorption reactions with the soil exchange complex. Sorption dominates at the relativelylow concentrations that are of concern for water quality criteria for irrigation.
Depending on the prevailing redox conditions in soils, chromium(III) can be oxidised tochromium(VI) and vice versa. Chromium(III) oxidises readily to chromium(VI) under fieldsoil conditions; organic matter and manganese oxides are important electron acceptors inthis reaction.
Soil pH has a major effect on the concentration of chromium in the soil solution and itssolubility decreases with increasing pH. At high pH values chromium(III) hydroxide, whichhas a low solubility, is precipitated from solution.

Agricultural Water Use: Irrigation 2nd Edition, 1996 (1st Issue) Chromium (VI): Page 2 of 6
60
The implications for irrigation with water containing chromium are as follows:
! Chromium(III) can be expected to be retained in the soil surface layers, because of itsstrong sorption by the soil exchange complex. In cultivated land it accumulates in theplough layer.
! Significant downward movement of chromium(III) to below the "plough layer" andhence contamination of ground water, is unlikely. However, chromium(VI) is moremobile in soils and can thus be leached into ground water.
! The larger the soil's cation exchange capacity (determined by clay content, clay mineraltype and amorphous sesquioxide content), the more chromium can generally be sorbed.
! Soils with a neutral to alkaline pH can accept a greater chromium load than acidic soilsbefore concentrations in the soil solution become phytotoxic.
Measurement The criteria are given in terms of the total chromium concentration, in mg/R. The referencemethod for the determination of chromium(VI) is diphenyl carbazide spectrophotometry.Where other methods are used their characteristics relative to the reference method shouldbe known.
Data Because chromium(III) is retained strongly by soils, it is likely to accumulate to phytotoxicInterpretation concentrations before equilibrium between sorption and desorption reactions is reached.
Treatment It is highly unlikely that chromium can be economically removed from water intended forOptions irrigation use. However, should its removal be required, trivalent chromium can be
To prevent its accumulation to phytotoxic concentrations, the total load applied to soil mustbe limited. International criteria for the concentration of chromium in irrigation water havebeen calculated (using limited available information) to ensure that it does not accumulateto either phytotoxic levels or levels that are toxic to consumers, within a given time period.The calculations assume that chromium accumulates within the surface 150 mm of soil.As such, the objectives of sustained soil suitability for continued use and maintenance ofcrop yield and quality are accounted for.
The arithmetic mean concentration of the applied water (preferably application volumeweighted) is given in the criteria for:
! The chromium concentration that can be applied to any soil on a continuous basis.This concentration is calculated such that chromium does not accumulate to phytotoxicconcentrations in a soil that is irrigated continuously for up to 100 years at an irrigationapplication rate of 1 000 mm p.a.
! The chromium concentration that can be applied to fine textured, neutral to alkalinesoils for a period of up to 20 years at an irrigation application rate of 1 000 mm p.a.
removed by various processes including:
! Precipitation and flocculation as chromium(III) hydroxide with lime and alum or aferric salt, followed by settlement and filtration. The process needs careful monitoringto ensure effective removal of chromium.
! Removal with reverse osmosis or ion exchange.
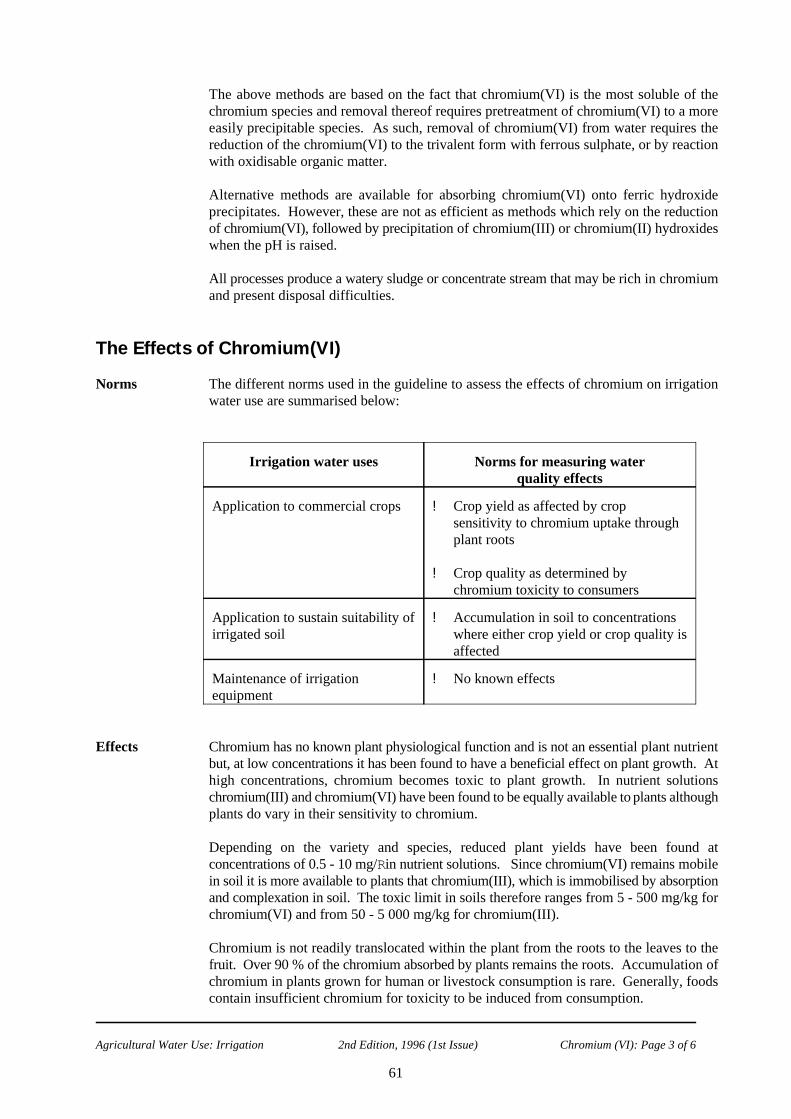
Agricultural Water Use: Irrigation 2nd Edition, 1996 (1st Issue) Chromium (VI): Page 3 of 6
61
The above methods are based on the fact that chromium(VI) is the most soluble of thechromium species and removal thereof requires pretreatment of chromium(VI) to a moreeasily precipitable species. As such, removal of chromium(VI) from water requires thereduction of the chromium(VI) to the trivalent form with ferrous sulphate, or by reactionwith oxidisable organic matter.
Alternative methods are available for absorbing chromium(VI) onto ferric hydroxideprecipitates. However, these are not as efficient as methods which rely on the reductionof chromium(VI), followed by precipitation of chromium(III) or chromium(II) hydroxideswhen the pH is raised.
All processes produce a watery sludge or concentrate stream that may be rich in chromiumand present disposal difficulties.
The Effects of Chromium(VI)
Norms The different norms used in the guideline to assess the effects of chromium on irrigationwater use are summarised below:
Irrigation water uses Norms for measuring waterquality effects
Application to commercial crops ! Crop yield as affected by cropsensitivity to chromium uptake throughplant roots
! Crop quality as determined bychromium toxicity to consumers
Application to sustain suitability of ! Accumulation in soil to concentrationsirrigated soil where either crop yield or crop quality is
affected
Maintenance of irrigation ! No known effectsequipment
Effects Chromium has no known plant physiological function and is not an essential plant nutrientbut, at low concentrations it has been found to have a beneficial effect on plant growth. Athigh concentrations, chromium becomes toxic to plant growth. In nutrient solutionschromium(III) and chromium(VI) have been found to be equally available to plants althoughplants do vary in their sensitivity to chromium.
Depending on the variety and species, reduced plant yields have been found atconcentrations of 0.5 - 10 mg/R in nutrient solutions. Since chromium(VI) remains mobilein soil it is more available to plants that chromium(III), which is immobilised by absorptionand complexation in soil. The toxic limit in soils therefore ranges from 5 - 500 mg/kg forchromium(VI) and from 50 - 5 000 mg/kg for chromium(III).
Chromium is not readily translocated within the plant from the roots to the leaves to thefruit. Over 90 % of the chromium absorbed by plants remains the roots. Accumulation ofchromium in plants grown for human or livestock consumption is rare. Generally, foodscontain insufficient chromium for toxicity to be induced from consumption.

Agricultural Water Use: Irrigation 2nd Edition, 1996 (1st Issue) Chromium (VI): Page 4 of 6
62
Mitigation Common on-farm management practices to mitigate against chromium uptake by plants onirrigated land, are to
! apply agricultural lime in order to raise (or maintain) soil pH to neutral to slightlyalkaline; and/or
! switch to a crop that is more tolerant to chromium.
Criteria Effects of Chromium(VI) on Crop Yield and Quality
Concentration Crop Yield and Soil SustainabilityRange (mg/RR)
Target Water Depending on plant species, nutrient solutions containingQuality Range 0.1 mg/R can induce chromium toxicity
# 0.10
0.10 - 1.0 Maximum acceptable concentration for fine-textured neutralto alkaline soils
> 1.0 Acceptable for irrigation only over the short term on a site-specific basis
Note:
! The TWQR for relatively unrestricted use on all soils for irrigation periods upto 100 years and the concentration range for fine-textured neutral to alkalinesoils for irrigation periods up to 20 years, are similar to most internationalcriteria.
! The above criteria are based on relatively limited information and should beviewed as tentative.
! The criteria are calculated to ensure soil sustainability for continued cropproduction.
Modifications ! The criteria were derived with the assumption that the soil to be irrigated contained onlynegligible quantities of chromium. Should this not be the case, the period of irrigationneeds to be reduced accordingly.
! The criteria may not protect commercial floricultural crops grown in greenhouseswithout soil (hydroponic or similar methods) because the criteria assume that the soilhas a capacity to deactivate chromium.
! Should the site-specific conditions vary significantly from the assumptions that wereused to derive the criteria, the criteria may need adjustment.
! Potted plants normally receive water applications in excess of the assumptions used toderive the criteria. Since potted plants are, however, grown for only limited periods,the criteria applicable to fine-textured neutral to alkaline soils can mostly be used.

Agricultural Water Use: Irrigation 2nd Edition, 1996 (1st Issue) Chromium (VI): Page 5 of 6
63
Sources of Information
APHA 1989. Standard Methods for the Examination of Water and Waste Water, 17thEdition. American Public Health Association, American Water Works Association, WaterPollution Control Federation. Published by the American Public Health Association,Washington DC, USA. AYERS R.S. and D.W. Westcott 1985. Water Quality for Agriculture FAO Irrigation andDrainage Paper No. 29. FAO, Rome.
BERMAN E. 1980. Toxic Metals and Their Analysis. Heyden, London.
CANADIAN GUIDELINES 1987. Canadian Water Quality Guidelines. Prepared by theTask Force on Water Quality Guidelines of the Canadian Council of Resource andEnvironment Ministers. Canada.
DEVEREAL S.J. and R. Fujii 1990. Chemistry of Trace Elements in Soils and GroundWater. In: Agricultural Salinity Assessment and Management, K.K. Tanjii (Ed.). ASCEManuals and Reprints on Engineering Practice No. 71. ASCE New York 1990.
HART B.T. 1974. A Compilation of Australian Water Quality Criteria. AWRCTechnical Paper No. 7.
HART B.T., C. Angehrn-Bettinazzi, I.C. Campbell and M.J. Jones 1992. Draft AustralianWater Quality Guidelines. Australian and New Zealand Environment and ConservationCouncil. January 1992.
MAAS E.V. 1990. Crop Salt Tolerance. In: Agricultural Salinity Assessment andManagement, K.K. Tanjii (Ed.). ASCE Manuals and Reports on Engineering Practice No.71., ASCE New York 1990.
McKEE J.E. and H.W. Wolf 1963. Water Quality Criteria, 2nd Edition. California StateWater Resources Control Board, Publication No. 3-A. California.
PAGE A.L. and A.C. Chang 1990. Deficiencies and Toxicities of Trace Elements. In:Agricultural Salinity Assessment and Management, K.K. Tanjii (Ed.). ASCE Manuals andReprints on Engineering Practice No. 71. ASCE New York 1990.
PRATT P.F. and D.L. Suarez 1990. Irrigation Water Quality Assessments. In:Agricultural Salinity Assessment and Management, K.K. Tanjii (Ed.). ASCE Manuals andReports on Engineering Practice No. 71. ASCE New York 1990.
UNITED STATES ENVIRONMENTAL PROTECTION AGENCY 1973. ProposedCriteria for Water Quality. US EPA, Washington DC, October 1979.
WEAST R.C. 1979. CRC Handbook of Chemistry and Physics, 60th Edition, CRC PressInc., Boca Raton, Florida, USA.
WHO 1984. Guidelines for Drinking Water Quality, Volume 2: Health Criteria and OtherSupporting Information. World Health Organization, Geneva.
WHO 1993. Guidelines for Drinking Water Quality, 2nd Edition, Volume 1:

Agricultural Water Use: Irrigation 2nd Edition, 1996 (1st Issue) Chromium (VI): Page 6 of 6
64
Recommendations. World Health Organization, Geneva.

Agricultural Water Use: Irrigation 2nd Edition, 1996 (1st Issue) Cobalt: Page 1 of 5
65
CobaltTentative Guideline
Background Information
Introduction Cobalt is a hard, grey, magnetic metal. The name cobalt derives from the German "kobelt",a term for gnomes and goblins; the toxic effects from the inhalation of dusts in cobalt mineswas originally thought to be the work of goblins.
Similar to most trace elements, cobalt is strongly adsorbed by soil. The addition of cobaltto soils in relatively high concentrations over the short-term may not result in reduced cropgrowth or in its accumulation in plant parts to concentrations detrimental to humans oranimals. However, continuous application over extended periods results in its accumulationin the surface soil layer, that is, the cultivated or plough layer. Accumulation in sedimentscan also occur as the sulphide of cobalt.
Occurrence The elemental form of cobalt is not found in nature. Cobalt occurs in various sulphide oresoften associated with arsenic, iron, nickel and copper. Important ores include cobaltite(CoAsS), linnaeite (Co S ) and smaltite (CoAs ). Cobalt also occurs as the insoluble3 4 2
carbonate (sphaerocobaltite) and rarely as the soluble sulphate (bieberite).
The typical concentration of cobalt in unpolluted surface water is 0.0002 mg/R and in seawater is approximately 0.00002 mg/R. Elevated cobalt levels may occur in the vicinity ofmines that process ores containing cobalt.
Cobalt is used in special alloys and magnets and cobalt salts are also used as pigments. Theelement has various uses in the nuclear industry, and radioactive Cobalt-60 is used inmedical treatments as a radiation source to treat malignancies.
Cobalt tends to be concentrated on particles of manganese oxide in soils. The low levelsof cobalt in natural waters may be due to an adsorption reaction of this type. The level ofcobalt in herbage is dependent primarily on the soil concentration and soil pH. Nitrogenfertilizers may increase the uptake of cobalt by plants. Increasing soil pH (5.4 - 6.4) canreduce cobalt concentrations in pastures.
Interactions The chemical properties of cobalt are similar to those of iron and nickel. Unlike iron(II),the cobalt(II) ion is quite stable in the oxidated form. Cobalt(III) is a strong oxidising agent,unstable in soil.
Cobalt concentrations in the soil solution are largely determined by sorption and desorptionreactions with the soil exchange complex. Sorption is more prevalent at the relatively lowconcentrations that are of concern for water quality criteria for irrigation.
Soil pH has a major effect on the concentration of cobalt in the soil solution and itssolubility decreases with increasing pH.
The implications for irrigation with water containing cobalt are as follows:
! Cobalt can be expected to be retained in the soil surface layers, because of its strongsorption by the soil exchange complex. In cultivated land it accumulates in the ploughlayer.

Agricultural Water Use: Irrigation 2nd Edition, 1996 (1st Issue) Cobalt: Page 2 of 5
66
! Significant downward movement to below the plough layer and hence contaminationof the ground water is unlikely.
! The larger the soil's cation exchange capacity (determined by clay content and claymineral type), the more cobalt can generally be sorbed.
! Soils with a neutral to alkaline pH can accept a greater cobalt load than acidic soilsbefore concentrations in the soil solution become phytotoxic.
Measurement The criteria are given in terms of the total cobalt concentration, in mg/R. Total cobalt isnormally measured after acidification of the sample. The reference method for thedetermination of cobalt is atomic absorption spectrometry. If other methods are used formeasuring cobalt, their characteristics relative to the reference method should be known.
Data Because cobalt is retained strongly by soils, it is likely to accumulate to phytotoxicInterpretation concentrations before equilibrium between sorption and desorption reactions are reached.
In order to prevent its accumulation, the total load applied to soil needs to be limited.International criteria for the concentration of cobalt in irrigation water have been calculated(using limited available information) to ensure that it does not accumulate to eitherphytotoxic levels or levels that are toxic to consumers, within a given time period. Thecalculations assume that cobalt accumulates within the surface 150 mm of soil. As such,the objectives of sustained soil suitability for continued use and maintenance of crop yieldand quality have been accounted for.
The arithmetic mean concentration of the applied water (preferably application volumeweighted) is given in the criteria for:
! The cobalt concentration that can be applied to any soil on a continuous basis. Thisconcentration is calculated such that cobalt does not accumulate to phytotoxicconcentrations in a soil that is irrigated continuously for up to 100 years at an irrigationapplication rate of 1 000 mm p.a.
! The cobalt concentration that can be applied to fine-textured, neutral to alkaline soilsfor a period of up to 20 years at an irrigation application rate of 1 000 mm p.a.
Treatment It is highly unlikely that cobalt can be economically removed from water intended forOptions irrigation use. However, should it be required, cobalt can be removed by precipitation at
alkaline pH, with lime, or by flocculation and coprecipitation with a ferric salt. Alternativelyion exchange can be used.
The waste stream produced will have elevated levels of cobalt, and will require appropriatedisposal.
The Effects of Cobalt
Norms The different norms used in the guideline to assess the effects of cobalt on irrigation wateruse are summarised in the following table:

Agricultural Water Use: Irrigation 2nd Edition, 1996 (1st Issue) Cobalt: Page 3 of 5
67
Irrigation water uses Norms for measuring waterquality effects
Application to commercial crops ! Crop yield as affected by cropsensitivity to cobalt uptake through plantroots
! Crop quality as determined by cobalttoxicity to consumers
Application to sustain suitability of ! Accumulation in soil to concentrationsirrigated soil where either crop yield or crop quality is
affected
Maintenance of irrigation ! No known effectsequipment
Effects Cobalt is not generally considered a plant nutrient, but appears to be essential for some plantspecies. Cobalt concentrations in the range of 0.1 - 5 mg/R have been found to be toxic toa variety of food crops when added to nutrient solutions. A concentration of 0.1 mg/R wasfound to be toxic to tomatoes; this concentration also approximates the toxicity thresholdfor many other plants. An application of 0.05 mg/R seems to be satisfactory for continuoususe in all soils. The occurrence of cobalt toxicity is rare under field conditions, presumablybecause it is strongly sorbed by soil.
Mitigation Common on-farm management practices to mitigate against cobalt uptake by plants onirrigated land, are to
! apply agricultural lime in order to raise (or maintain) soil pH to neutral to slightlyalkaline; and/or
! switch to a crop that is more tolerant to cobalt.

Agricultural Water Use: Irrigation 2nd Edition, 1996 (1st Issue) Cobalt: Page 4 of 5
68
Criteria Effects of Cobalt on Crop Yield and Quality
Concentration Crop Yield and QualityRange (mg/RR)
Target Water A satisfactory concentration for continuousQuality Range application is 0.05 mg/R; 0.1 mg/R is near the toxicity
# 0.05 threshold of many plants. Generally cobalt does notaccumulate in edible parts of plants to levels that aredangerous to consumers
0.05 - 5.0 Maximum acceptable as concentration for fine-texturedneutral to alkaline soils
> 5.0 Acceptable for irrigation only over the short term on asite-specific basis
Note:
! The TWQR for relatively unrestricted use on all soils and the concentration rangefor fine-textured neutral to alkaline soils for irrigation periods of up to 20 years,are similar to most international criteria.
! The above criteria are based on relatively limited information and should beviewed as tentative.
! The criteria are calculated to ensure soil sustainability for continued cropproduction.
Modifications ! The criteria were derived with the assumption that the soil to be irrigated containednegligible quantities of cobalt. Should this not be the case the period of irrigation needsto be reduced accordingly.
! The criteria may not protect commercial floricultural crops grown in greenhouseswithout soil (hydroponic or similar methods) because the criteria assume that the soilhas a capacity to deactivate cobalt.
! Should the site-specific conditions vary significantly from the assumptions that wereused to derive the criteria, the criteria may need adjustment.
! Potted plants normally receive water applications in excess of the assumptions used toderive the guidelines. Since potted plants are only grown for limited periods, the criteriaapplicable to fine-textured neutral to alkaline soils can mostly be used.
Agricultural Water Use: Irrigation 2nd Edition, 1996 (1st Issue) Cobalt: Page 5 of 5
69
Sources of Information
AYERS R.S. and D.W. Westcott 1985. Water Quality for Agriculture FAO Irrigation andDrainage Paper No. 29. FAO, Rome.
CANADIAN GUIDELINES 1987. Canadian Water Quality Guidelines. Prepared by theTask Force on Water Quality Guidelines of the Canadian Council of Resource andEnvironment Ministers. Canada.
DEPARTMENT OF WATER AFFAIRS AND FORESTRY 1993. South African WaterQuality Guidelines, Volume 4: Agricultural Use.
HART B.T. 1974. A Compilation of Australian Water Quality Criteria. AWRCTechnical Paper No. 7.
HART B.T., C. Angehrn-Bettinazzi, I.C. Campbell and M.J. Jones 1992. Draft AustralianWater Quality Guidelines. Australian and New Zealand Environment and ConservationCouncil. January 1992.
PAGE A.L. and A.C. Chang 1990. Deficiencies and Toxicities of Trace Elements:Agricultural Salinity Assessment and Management, K.K. Tanjii (Ed.). ASCE Manuals andReprints on Engineering Practice No. 71. ASCE New York 1990.
PRATT P.F. and D.L. Suarez 1990. Irrigation Water Quality Assessments. In:Agricultural Salinity Assessment and Management, K.K. Tanjii (Ed.). ASCE Manuals andReports on Engineering Practice No. 71. ASCE New York 1990.
UNITED STATES ENVIRONMENTAL PROTECTION AGENCY 1973. ProposedCriteria for Water Quality. US EPA, Washington DC, October 1979.

70

Agricultural Water Use: Irrigation 2nd Edition, 1996 (1st Issue) Coliforms (Faecal): Page 1 of 6
71
Coliforms (Faecal)Tentative Guideline
Background Information
Introduction Field crops and vegetables can become contaminated with human and animal pathogens andparasites when irrigated with water containing these organisms. These organisms may betransferred to humans when they are retained and survive on the surfaces of produce thatare eaten raw, and to animals in their feed. Organisms transferred this way may lead tovarious bacterial enteric diseases, such as cholera (Vibrio cholera), typhoid fever(Salmonella typhi), salmonellosis (Salmonella spp.) and bacillary dysentery (Shigella spp.).Viruses are also important agents of waterborne diseases and can cause illnesses such asgastroenteritis, hepatitis, poliomyelitis and respiratory illness. The risk of Helminth(intestinal nematodes) and protozoan parasite (e.g. Giardia spp.) transmission by wastewateris also considered to be high.
A feature of bacterial pathogens is that a high infective dose of 10 - 1 000 or moreorganisms is required to cause infection, whereas a much lower infectious dose for bothviruses and protozoan parasites causes infection.
Detection of pathogens in water is methodologically complex, time-consuming andexpensive. Given the low density of pathogens in environmental waters and the largenumber of potential pathogens which may be associated with polluted water, it is commonpractice to monitor and control microbiological water quality on the basis of concentrationof indicator organisms, rather than of the pathogens themselves. See Volume 1: DomesticUse.
Faecal coliforms, and more specifically Escherichia coli (E.coli), are the most commonbacterial indicators of faecal pollution. This indicator group is used to evaluate the qualityof wastewater effluents, river water, sea water at bathing beaches, raw water for drinkingwater supply, treated drinking water, water used for irrigation and aquaculture andrecreational waters. The presence of E. coli is used to confirm the presence of faecalpollution by warm-blooded animals (often interpreted as human faecal pollution). Someorganisms detected as faecal coliforms may not be of human faecal origin but are almostdefinitely from warm-blooded animals.
Occurrence Many of the micro-organisms that are pathogenic to animals and humans are carried inwaters derived from surface sources. They originate from municipal and industrial waste,including food processing plants, slaughter houses, poultry processing operations, feed lotsand runoff from unserviced high density housing areas. Indicator organisms are excretedby healthy individuals and form part of the natural flora of human faeces. Water pollutedby human and/or animal faecal matter will show the presence of indicator organisms.
Faecal coliforms have been shown to represent 93 % - 99 % of coliform bacteria in faecesfrom humans, poultry, cats, dogs and rodents. Some faecal coliform tests also enumerateKlebsiella spp., which can originate from non-faecal sources, and a few other bacterialstrains also of non-faecal origin. Escherichia coli may comprises up to 97 % of coliformbacteria in human faeces. The remainder include other Escherichia spp., Klebsiella spp.,Enterobacter spp., Enterobacter spp. and Citrobacter spp.
Interactions Numerous physical and biological factors influence the rate of die-off or disappearance of

Agricultural Water Use: Irrigation 2nd Edition, 1996 (1st Issue) Coliforms (Faecal): Page 2 of 6
72
bacteria in water. Among the most significant are the type of organism, sunlight,temperature, pH, salinity, competition, predation, algae, nutrient deficiencies, toxicsubstances, organism density in the discharge, settling of organisms after discharge,resuspension of particulates and aftergrowth, and multiplication of organisms in the waterbody. Extremes in pH, elevated temperatures and solar radiation promote microbial decay,while elevated nutrient concentrations and lower temperatures promote microbial survival.Polluted water may contain enough nutrients to support the growth of some of the bacterialindicator organisms, especially in temperate waters.
Micro-organisms demonstrate increased survival in sediments and when aggregated toparticles, possibly due to reduced predation and parasitism. The nature and stability ofaggregates are highly dependent on environmental conditions and the physical and chemicalnature of the particles.
Measurement Faecal coliforms are usually enumerated as counts (number of colony forming units)/100 mRof water. Water samples must be refrigerated immediately after collection and should beanalysed within 24 hours. Analysis may be by membrane filtration (0.45 Fm diameter poresize) or by multiple tube fermentation techniques. Faecal coliform bacteria are all bacteriawhich produce typical blue colonies on m-FC agar within 20 - 24 hours of incubation at44.5 C. Escherichia coli are considered to be all the faecal coliforms which test indole-o
positive at 44.5 C.o
Data Strictly speaking, faecal bacterial indicators should be used to indicate the presence ofInterpretation bacterial pathogens only. However, although inappropriate, they are widely used to indicate
the microbial quality of water in general, which includes viruses and parasites. The faecalcoliform (specifically E. coli) content is used as indication of the microbial quality ofirrigation water.
Geometric mean values (based on not less than six samples over a growing season) shouldbe used to compare with the criteria given and should be interpreted as maximal values, notto be exceeded. To assess the effect on crop quality, more importance should be attachedto the faecal coliform concentrations of irrigation applications immediately precedingharvesting, compared to those earlier during the season.
The geometric mean concentration of the applied water (preferably application volumeweighted) should be used to assess the effect of faecal coliforms on irrigation equipment.
Treatment In practice treatment is mostly too costly an option to remove human and animalOptions pathogens and parasites from irrigation water. However, should their removal be
required, several conventional water purification processes, including sedimentation,absorption, coagulation and flocculation can be used for partial removal. These treatmentprocesses do not necessarily inactivate the micro-organisms and additional disinfectionprocesses need to be applied.
The most common and practical treatment options for irrigation water are:
! Disinfection of the water - mostly with chlorine. Disinfection requires careful processcontrol of dosage and contact time.
! Filtration which physically removes the pathogens and parasites.
The Effects of Faecal Coliforms

Agricultural Water Use: Irrigation 2nd Edition, 1996 (1st Issue) Coliforms (Faecal): Page 3 of 6
73
Norms The norms used in the guideline to assess the effects of faecal coliforms on irrigation wateruse are summarised below:
Irrigation water uses Norms for measuring water quality effects
Application to commercial ! Crop quality as determined by the likelihoodcrops of negative health effects being transmitted by
crops irrigated with the water
Application to sustain ! Soil quality as determined by the likelihood ofsuitability of irrigated soil negative health effects being transmitted
through human or crop contact with the soil,as a result of irrigation with contaminatedwater. (No criteria given )
Maintenance of irrigation ! Faecal coliforms and other micro-organismsequipment can cause the clogging of irrigation equipment
when secondary growth (which often collectssuspended particles) takes place under growthstimulating (sufficient nutrients) conditions
Effects Faecal coliforms are primarily used to indicate the presence of bacterial pathogens such asSalmonella spp., Shigella spp. Vibrio cholerae, Campylobacter jejuni, Campylobactercoli, Yersinia enterocolitica and pathogenic E. coli. These organisms can be transmittedvia the faecal/oral route by eating raw produce that has been irrigated with contaminatedwater and may cause diseases such as gastroenteritis, salmonellosis, dysentry, cholera andtyphoid fever.
The risk of being infected by microbial pathogens correlates with the level of contaminationof the water and the amount of contaminated produce consumed. Higher concentrationsof faecal coliforms in water will indicate a higher risk of contracting a waterborne disease,even if small amounts of produce are consumed.
The criteria are therefore based on the contamination level of the irrigation water and thelikelihood of consumer exposure (e.g. ingestion of contaminated raw produce). Thelikelihood of clogging micro-irrigation equipment is linked to the total number of micro-organisms. Although individual micro-organisms are too small to cause clogging of dripirrigation systems, the presence of rough areas or particles to which they can adhere to andmultiply in the presence of nutrients may give rise to secondary growth of micro-organismclusters which can cause clogging when dislodged.
Mitigation Common on-farm management practices to mitigate against the transmission of human andanimal pathogens as a result of irrigation with contaminated water, are to
! irrigate only crops that will be disinfected (cooked) before eaten, that is, crops that arenot eaten raw;
! use an application method that does not wet the produce (e.g. drip irrigation); and
! allow as much time as possible to pass between the last irrigation and harvesting in orderto maximise the natural die-off of pathogens. The survival rate of pathogens variesgreatly depending on the type of pathogen and environmental conditions.

Agricultural Water Use: Irrigation 2nd Edition, 1996 (1st Issue) Coliforms (Faecal): Page 4 of 6
74
Common on-farm management practices to mitigate against the clogging of irrigationequipment, are to
! switch to an alternative application system; and
! regularly disinfect dripper lines to prevent secondary regrowth of micro-organismswhich can cause clogging when dislodged.
Criteria Table 1: Effects of Faecal Coliforms (E.Coli) on Crop Quality
Concentration Crop Quality Range (E. coli
counts/100 mRR)
Target Water Irrigation water can be applied with any irrigation Quality Range method to any crop with little likelihood that this will
# 1 lead to the spread of human pathogens
1 - 1 000 Likelihood of contamination from vegetables and othercrops eaten raw and of milk from cows grazing onpastures will result in the transmission of humanpathogens
Fruit trees and grapes may be irrigated provided that thefruits are not wetted
Crops and pastures not consumed raw can be irrigatedwith any method provided crops and pastures are allowedto dry before harvesting and grazing
> 1 000 Provided water treatment quality is equivalent to or betterthan primary and secondary treated waste water, and thatno contact is allowed to take place with humans, watercan be used in irrigation for the production of fodder, treeplantations, nurseries, parks, etc.
Note:
! The above criteria are based largely on the existing criteria of the Departmentof Health for the disposal of treated effluent from waste water treatmentworks.
! Since there is only limited consensus on the faecal coliform concentrationsthat can be allowed in water used to irrigate crops for human consumption,these criteria must be treated as tentative.
Table 2: Effect of Faecal Coliforms (and other bacterial populations) onIrrigation Systems (primarily drip irrigation)
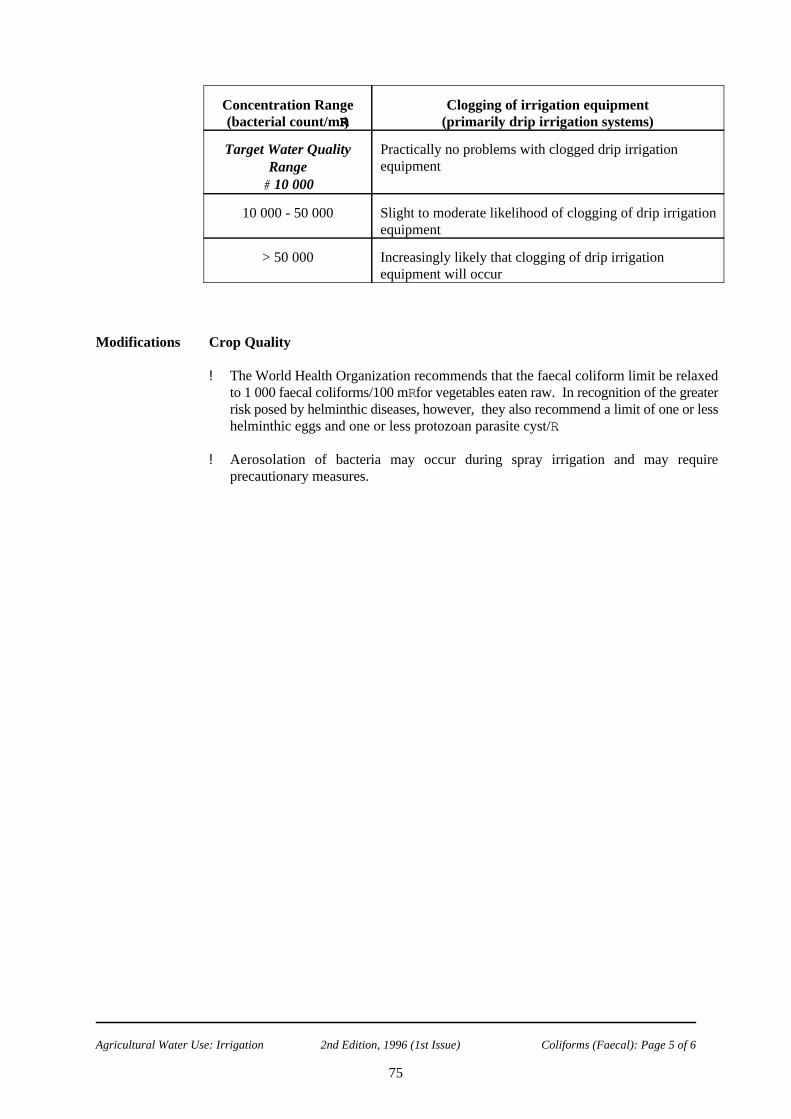
Agricultural Water Use: Irrigation 2nd Edition, 1996 (1st Issue) Coliforms (Faecal): Page 5 of 6
75
Concentration Range Clogging of irrigation equipment(bacterial count/mRR) (primarily drip irrigation systems)
Target Water Quality Practically no problems with clogged drip irrigationRange# 10 000
equipment
10 000 - 50 000 Slight to moderate likelihood of clogging of drip irrigationequipment
> 50 000 Increasingly likely that clogging of drip irrigationequipment will occur
Modifications Crop Quality
! The World Health Organization recommends that the faecal coliform limit be relaxedto 1 000 faecal coliforms/100 mR for vegetables eaten raw. In recognition of the greaterrisk posed by helminthic diseases, however, they also recommend a limit of one or lesshelminthic eggs and one or less protozoan parasite cyst/R.
! Aerosolation of bacteria may occur during spray irrigation and may requireprecautionary measures.

Agricultural Water Use: Irrigation 2nd Edition, 1996 (1st Issue) Coliforms (Faecal): Page 6 of 6
76
Sources of Information
APHA 1989. Standard Methods for the Examination of Water and Waste Water, 17thEdition. American Public Health Association, American Water Works. Association, WaterPollution Control Federation. Published by the APHA, Washington DC, USA.
AYERS R.S. and D.W. Westcott 1985. Water Quality for Agriculture, FAO Irrigation andDrainage Paper No. 29, FAO, Rome.
BERMAN E. 1980. Toxic Metals and Their Analysis. Heyden, London.
CANADIAN GUIDELINES 1987. Canadian Water Quality Guidelines. Prepared by theTask Force on Water Quality Guidelines of the Canadian Council of Resource andEnvironment Ministers. Canada.
DEPARTMENT OF WATER AFFAIRS AND FORESTRY 1993. South African WaterQuality Guidelines, Volume 4: Agricultural Use.
HART B.T. 1974. A Compilation of Australian Water Quality Criteria. AWRCTechnical Paper No. 7.
HART B.T., C. Angehrn-Bettinazzi, I.C. Campbell and M.J. Jones 1992. Draft AustralianWater Quality Guidelines. Australian and New Zealand Environment and ConservationCouncil. January 1992.
NAKAYAMA F.S. and D.A. Backs 1991. Water Quality in Drip/trickle Irrigation: AReview. Irrig.Sci. 12, 187 - 192.
PAYMENT et al. 1991. A Prospective Epidemiological Study of Drinking Water relatedGastrointestinal Illnesses. Water Science and Technology 24(2), 27-28.
PIPES W.O. 1982 (ed.). Bacterial Indicators of Pollution. CRC Press Inc., Boca Raton,Florida, USA.
UNITED STATES ENVIRONMENTAL PROTECTION AGENCY 1973. ProposedCriteria for Water Quality. US EPA, Washington, DC. October 1979.
WHO 1993. Guidelines for Drinking-Water Quality, 2nd Ed.Vol.1: Recommendations.World Health Organization, Geneva.

Agricultural Water Use: Irrigation 2nd Edition, 1996 (1st Issue) Copper: Page 1 of 5
77
CopperTentative Guideline
Background Information
Introduction Copper occurs in three oxidation states, as metallic copper(0), cuprous copper(I) and cupriccopper(II). Copper is an essential micro-nutrient for plants but at high concentrationsbecomes toxic to plants. Plants respond to the copper concentration in the soil solution.Similar to most trace elements, copper is strongly adsorbed by soil. Its addition to soils, inrelatively high concentrations over the short-term, may not result in reduced crop growthor in its accumulation in plant parts detrimental to humans or animals. However,continuous application over extended periods results in its accumulation in the surface soillayer, in practice, the cultivated or plough layer.
Occurrence Many minerals containing copper are known, some of which are important semi-preciousminerals, such as malachite, azurite and turquoise. Copper is also sometimes found in theelemental state. Copper(II) carbonate, hydroxide and sulphide are insoluble in water, whilecopper sulphate, nitrate and chloride are soluble. Ammonium complexes of copper are alsosoluble in water. At neutral and alkaline pH, the concentration of copper in surface watersis usually low, typically, around 0.003 mg/R, whereas in acidic waters, copper readilydissolves, and substantially higher concentrations may occur. The concentration of copperin sea water is approximately 0.0003 mg/R. Copper is readily adsorbed and precipitated insediments at alkaline pH. Re-mobilisation of copper to underlying water occurs onacidification.
Copper has excellent conducting properties. One of the most important industrial uses ofcopper is in the electrical industry.
Interactions Soils were previously treated for years with copper sulphate as a fungicide. The fact thatthey mostly do not display toxicity symptoms is often quoted as evidence that coppercombines strongly with most soils.
The soil chemical behaviour of copper is similar to those of cadmium, lead, nickel and zinc.Copper concentrations in the soil solution are largely determined by sorption and desorptionreactions with the soil exchange complex. Sorption dominates at the relatively low concen-trations that are of concern for water quality criteria for irrigation.
Soil pH has a major effect on the concentration of copper in the soil solution and itssolubility decreases with increasing pH. At high pH values copper hydroxide, which has alow solubility, is precipitated from solution. Copper availability to plants is reduced whenthe soil organic matter content is high and at high concentrations of phosphate, zinc andmanganese.
Implications for irrigation with water containing copper involve the following:
! Copper can be expected to be retained in the soil surface layers because of strongsorption by the soil exchange complex. In cultivated land it accumulates in the ploughlayer.
! Significant downward movement to below the plough layer is unlikely, as is resultant

Agricultural Water Use: Irrigation 2nd Edition, 1996 (1st Issue) Copper: Page 2 of 5
78
contamination of ground water with copper.
! The larger the soils cation exchange capacity (determined by clay content and claymineral type), the more copper can generally be sorbed.
! Soils with a neutral to alkaline pH can accept a greater copper load than acidic soilsbefore concentrations in the soil solution become phytotoxic.
Measurement The criteria are given in terms of the total copper concentration, measured in mg/R. Totalcopper is measured after acidification of the water sample. The reference method for thedetermination of copper is atomic absorption spectrometry. If other methods are used formeasuring copper, their characteristics relative to the reference method should be known.
Data Because copper is retained strongly by soils, it is likely to accumulate to phytotoxicInterpretation concentrations before equilibrium between sorption and desorption reactions are reached.
In order to prevent its accumulation, the total load applied to soil needs to be limited.International criteria for the concentration of copper in irrigation water have been calculated(using limited available information) to ensure that it does not accumulate to eitherphytotoxic levels or levels that are toxic to consumers within a given time period. Thesecalculations assume that copper accumulates within the top 150 mm of soil. As such, theobjectives of sustained soil suitability for continued use and maintenance of crop yield andquality have been accounted for.
The arithmetic mean concentration of the applied water (preferably application volumeweighted) is given in the criteria for:
! The copper concentration that can be applied to any soil on a continuous basis. Thisconcentration is calculated such that copper does not accumulate to phytotoxicconcentrations in a soil that is irrigated continuously for up to 100 years at an irrigationapplication rate of 1 000 mm p.a.
! The copper concentration that can be applied to fine-textured, neutral to alkaline soilsfor a period of up to 20 years at an irrigation application rate of 1 000 mm p.a.
Treatment It is highly unlikely that copper can be economically removed from water intended forOptions irrigation purposes. However, should its removal be required, copper can be removed by
raising the pH and precipitating the insoluble copper carbonate and hydroxide complexeswith lime treatment. The precipitation is followed by settlement and filtration as inconventional water treatment.
The precipitation process requires careful monitoring to ensure complete removal. Awatery, copper-rich sludge is generated in the process; this may present disposal difficulties.
The Effects of Copper
Norms The different norms used in the guidelines to assess the effects of copper on irrigation wateruse are summarised in the following table:
Irrigation water uses Norms for measuring waterquality effects

Agricultural Water Use: Irrigation 2nd Edition, 1996 (1st Issue) Copper: Page 3 of 5
79
Application to commercial ! Crop yield as affected by crop sensitivity tocrops copper uptake through plant roots
! Crop quality as determined by coppertoxicity to consumers
Application to sustain ! Accumulation in soil to concentrationssuitability of irrigated soil where either crop yield or crop quality is
affected
Maintenance of irrigation ! No known effectsequipment
Effects Copper is an essential plant micro-nutrient and is an important component of several plantenzymes. Copper deficiency symptoms occur in plants grown in soil that have a lowcopper concentration. Approximately 6 mg/kg of copper in soil is the lower limit for healthyplant growth. Copper toxicity is usually associated with soil concentrations in the range of150 - 400 mg/kg. Depending on plant species, copper toxicity occurs in nutrient solutionsat concentrations between 0.1 and 1 mg/R.
Mitigation Common on-farm management practices to mitigate against copper uptake by plants onirrigated land, are to
! apply agricultural lime in order to raise (or maintain) soil pH to neutral to slightlyalkaline; and/or
! switch to a crop that is more tolerant to copper;
! apply ample phosphate fertilisers or iron salts; the addition of either has been reportedto reduce copper toxicity.

Agricultural Water Use: Irrigation 2nd Edition, 1996 (1st Issue) Copper: Page 4 of 5
80
Criteria Effects of Copper on Crop Yield and Quality
Concentration Crop Yield Crop QualityRange (mg/RR)
Target Water Depending on plant species, Yield reduction and crop Quality Range nutrient solutions containing failure are the main effects
# 0.2 0.1 - 1.0 mg/R can induce of copper-contaminated soilscopper toxicity Generally copper does not
accumulate in edible parts ofplants to levels that aredangerous to consumers(root crops such as potatoesand radishes have beenshown to concentratecopper)
0.2 - 5.0 Maximum acceptable asconcentration for fine texturedneutral to alkaline soils
> 5.0 Acceptable for irrigation onlyover the short term on a site-specific basis
Note:
! The TWQR for relatively unrestricted use on all soils and the concentration rangefor fine-textured neutral to alkaline soil for irrigation for periods up to 20 years,are similar to most international criteria.
! The above criteria are based on relatively limited information and should beviewed as tentative.
! The criteria are calculated to ensure soil sustainability for continued cropproduction.
Modifications ! The criteria were derived with the assumption that the soil to be irrigated contained onlynegligible quantities of copper. Should this not be the case the period of irrigation needsto be reduced accordingly.
! The criteria may not protect commercial floricultural crops grown in greenhouseswithout soil (hydroponic or similar methods), because it is assumed that the soil has acapacity to deactivate copper.
! Should the site-specific conditions vary significantly from the assumptions that wereused to derive the criteria, the values may need adjustment.
! Potted plants normally receive water applications in excess of the assumptions used toderive the criteria. Since potted plants are only grown for limited periods, the criteriaapplicable to fine textured neutral to alkaline soils, can mostly be used.

Agricultural Water Use: Irrigation 2nd Edition, 1996 (1st Issue) Copper: Page 5 of 5
81
Sources of Information
AYERS R.S. and D.W. Westcott 1985. Water Quality for Agriculture, FAO Irrigation andDrainage Paper No. 29. FAO, Rome.
BERMAN E. 1980. Toxic Metals and Their Analysis. Heyden, London.
BOWEN H.J.M. 1979. Environmental Chemistry of the Elements. Academic Press,London.
CANADIAN GUIDELINES 1987. Canadian Water Quality Guidelines. Prepared bythe Task Force on Water Quality Guidelines of the Canadian Council of Resource andEnvironment Ministers. Canada.
DEPARTMENT OF WATER AFFAIRS AND FORESTRY 1993. South African WaterQuality Guidelines, Volume 4: Agricultural Use. The Government Printer, Pretoria, SouthAfrica.
DEVEREL S.J. and R. Fujii 1990. Chemistry of Trace Elements in Soils and GroundWater: In: Agricultural Salinity Assessment and Management, K.K. Tanjii (Ed.). ASCEManuals and Reprints on Engineering Practice No. 71. ASCE New York 1990.
HART B.T. 1974. A Compilation of Australian Water Quality Criteria. AWRCTechnical Paper No. 7.
HART B.T., C. Angehrn-Bettinazzi, I.C. Campbell and M.J. Jones 1992. Draft AustralianWater Quality Guidelines. Australian and New Zealand Environment and ConservationCouncil. January 1992.
PAGE A.L. and A.C. Chang 1990. Deficiencies and Toxicities of Trace Elements. In:Agricultural Salinity Assessment and Management, K.K. Tanjii (Ed.). ASCE Manuals andReprints on Engineering Practice No. 71. ASCE New York 1990.
PRATT P.F. and D.L. Suarez 1990. Irrigation Water Quality Assessments: In:Agricultural Salinity Assessment and Management, K.K. Tanjii (Ed.). ASCE Manuals andReports on Engineering Practice No. 71. ASCE New York 1990.
UNITED STATES ENVIRONMENTAL PROTECTION AGENCY 1973. ProposedCriteria for Water Quality. US EPA, Washington DC, October 1979.
WEAST R.C. 1979. CRC Handbook of Chemistry and Physics, 60th Edition. CRC PressInc., Boca Raton, Florida, USA.

82

Agricultural Water Use: Irrigation 2nd Edition, 1996 (1st Issue) Fluoride: Page 1 of 5
83
FluorideTentative Guideline
Background Information
Introduction Fluoride is the most electronegative member of the halogens and therefore the mostreactive. It has a strong affinity for positive ions and readily forms complexes with manymetals. In its elemental form, fluorine is a greenish-yellow gas which readily dissolves inwater to form hydrofluoric acid. Fluorine is highly reactive and will attack most materials,including glass. Apart from the alkali metal fluorides, most fluorides are insoluble in water.Many soluble complexes are formed with silicates and the transition metals.
Plants respond to the fluoride concentration in the soil solution. Addition of fluoride to soilin relatively high concentrations over the short-term may not result in reduced crop growthor in its accumulation in plant parts to concentrations detrimental to humans or animals.However, continuous applications over extended periods result in accumulation in thesurface soil layer, in practice, the cultivated or plough layer.
Occurrence Common fluoride minerals are fluor-spar (CaF ) and fluor-apatite, which is a calcium2
fluoro-phosphate. Others of importance are various fluoro-silicates and mixed fluoride salts,such as cryolite (Na AlF ). 3 6
Typically, the concentration of fluoride in ! unpolluted surface water is approximately 0.1 mg/R; ! ground water up to 3 mg/R is common, but as a consequence of leaching from fluoride
containing minerals to ground water supplies, a range of 3 - 12 mg/R and higher may befound; and
! sea water is approximately 1.4 mg/R.
Fluoride is present in many foods, and water is not the only source thereof. Drinking wateris estimated to contribute between 50 % - 75 % of the total dietary fluoride intake in adulthuman beings.
In industry, fluorine and fluorides are used in the isotopic enrichment of uranium, in themanufacture of various fluorochemicals such as fluoro-chlorohydrocarbon refrigerants andin the etching of glass.
Interactions Fluoride is only very weakly sorbed by the soil exchange complex and its movement in soilis not affected by exchange reactions. Fluoride is, however, strongly adsorbed to iron andaluminium oxides and to clay minerals. The amount of fluoride plants remove from soil isgenerally unrelated to the fluoride content of the soil or the irrigation water. The controllingfactors appear to be soil type, calcium and phosphorous content, and soil pH. Neutral andalkaline soils deactivate fluoride, and thereby restrict uptake by roots.
The implications of irrigating with water containing fluoride include the following:
! Retention in the soil surface layers due to sorption of fluoride by the soil. In cultivatedland, accumulation will occur in the plough layer.

Agricultural Water Use: Irrigation 2nd Edition, 1996 (1st Issue) Fluoride: Page 2 of 5
84
! Significant downward movement to below the plough layer and hence contaminationof ground water with fluoride is unlikely under alkaline and neutral conditions. Underacidic conditions leaching to ground water occurs.
! Soils with a neutral to alkaline pH will be able to accept a greater fluoride load thanacidic soils before concentrations in the soil solution become phytotoxic.
Measurement The criteria are given in terms of the dissolved fluoride concentration, in units of mg/R. Thereference method for the determination of fluoride is the SPADNS colorimetric method. The SPADNS method is based on the formation of a red colour between the fluoride ionand a zirconium dye lake and relies on the tendency of fluoride to complex strongly to thezirconium ion. Where other methods are used, such as use of a fluoride-specific electrodeor ion chromatography, their characteristics relative to the reference method should beknown.
Data Because fluoride is retained by soils, it may accumulate to phytotoxic concentrations. InInterpretation order to prevent its accumulation the total load applied to soil needs to be limited.
International criteria for the concentration of fluoride in irrigation water have beencalculated (using limited available information) to ensure that accumulation to eitherphytotoxic levels, or levels that are toxic to consumers, within a given time period does notoccur. The calculations assume that fluoride accumulates within the top 150 mm of soil.As such, the objectives of sustained soil suitability for continued use and maintenance ofcrop yield and quality are accounted for.
The arithmetic mean concentration of the applied water (preferably application volumeweighted) is given in the criteria for:
! The fluoride concentration that can be applied to any soil on a continuous basis. Thisconcentration is calculated such that fluoride does not accumulate to phytotoxicconcentrations in a soil that is irrigated continuously for up to 100 years at an irrigationapplication rate of 1 000 mm p.a.
! The fluoride concentration that can be applied to fine-textured, neutral to alkaline soilsfor a period of up to 20 years at an irrigation application rate of 1 000 mm p.a.
Treatment It is highly unlikely that fluoride can be economically removed from water intended forOptions irrigation use. However, should it be required, methods for the removal of fluoride include
! adsorption in a bed of activated alumina;
! removal in ion exchange columns along with other anions; and
! removal in membrane processes such as reverse osmosis and electrodialysis togetherwith virtually all other ions.
Regeneration of the activated alumina or ion exchange bed produces a high fluoride streamwhich can pose disposal difficulties. A concentrated reject stream is also produced fromreverse osmosis and electrodialysis, and needs careful disposal.
The techniques used are sophisticated and relatively expensive both in capital and operatingcosts. High levels of skills are needed in the design, operation and maintenance of theequipment.

Agricultural Water Use: Irrigation 2nd Edition, 1996 (1st Issue) Fluoride: Page 3 of 5
85
The Effects of Fluoride
Norms The different norms used in the guideline to assess the effects of fluoride on irrigation wateruse are summarised below:
Irrigation water uses Norms for measuring waterquality effects
Application to commercial ! Crop yield as affected by crop sensitivity tocrops fluoride uptake through plant roots
! Crop quality as determined by fluoridetoxicity to consumers
Application to sustain ! Accumulation in soil to concentrations wheresuitability of irrigated soil either crop yield or crop quality is affected
Maintenance of irrigation ! No known effectsequipment
Effects The most serious effect of fluoride is usually not its effect on plant growth, but rather itseffect on animals and humans that consume plants that have accumulated fluoride. Plantroots mostly exclude fluoride, but some accumulate large amounts. For the most part theseplants are, however, not consumed by humans or animals. Plant roots and leaves of someplants are damaged when grown in nutrient solutions containing 0.02 - 0.5 mg/R fluoride.When present in the gaseous form, fluoride is most easily absorbed by plant foliage.
Mitigation Common on-farm management practices to mitigate against fluoride uptake by plants onirrigated land, are to
! apply agricultural lime in order to raise (or maintain) soil pH to neutral to slightlyalkaline (lime also adds calcium which reacts with fluoride); and/or
! switch to a crop that is more tolerant to fluoride;
! apply agricultural gypsum to raise the soil calcium content and promote the formationof fluoride which has a relatively low solubility. (Addition of gypsum to irrigation waterwill have a similar effect).
Criteria Effects of Fluoride on Crop Yield and Quality
Concentration Crop Yield, Crop Quality and Soil SustainabilityRange (mg/RR)
Target Water No adverse effects on cropsQuality Range
# 2.0
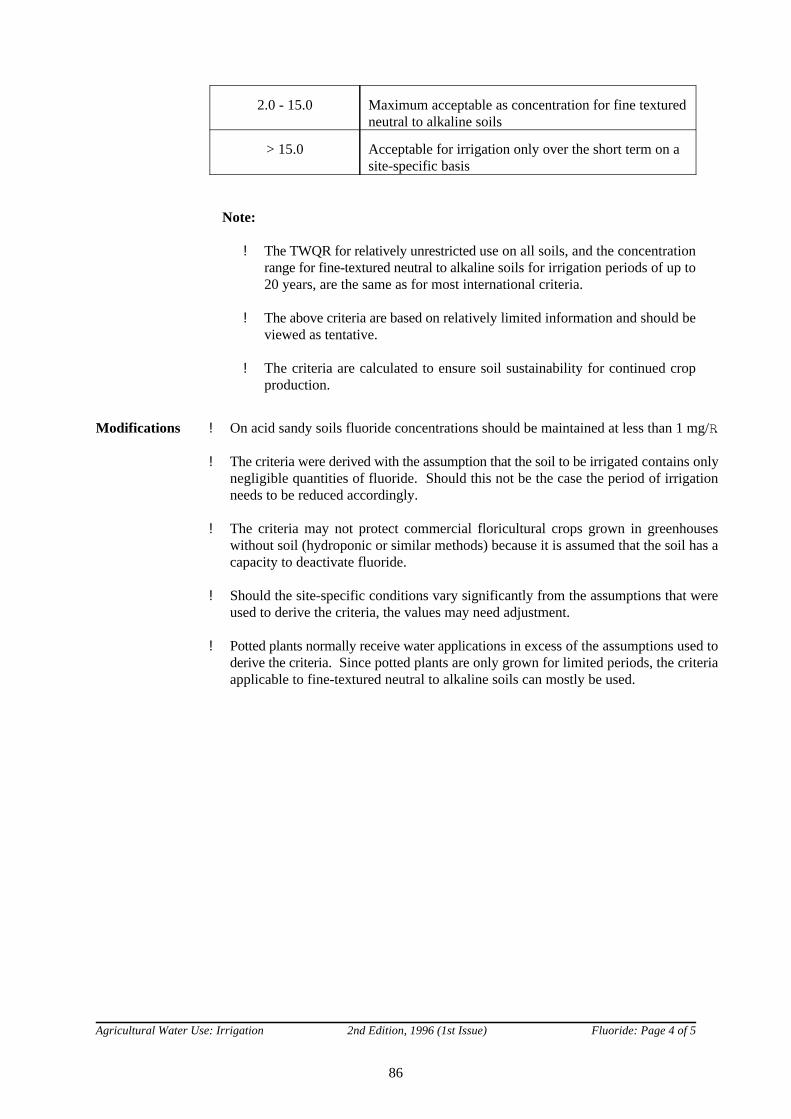
Agricultural Water Use: Irrigation 2nd Edition, 1996 (1st Issue) Fluoride: Page 4 of 5
86
2.0 - 15.0 Maximum acceptable as concentration for fine texturedneutral to alkaline soils
> 15.0 Acceptable for irrigation only over the short term on asite-specific basis
Note:
! The TWQR for relatively unrestricted use on all soils, and the concentrationrange for fine-textured neutral to alkaline soils for irrigation periods of up to20 years, are the same as for most international criteria.
! The above criteria are based on relatively limited information and should beviewed as tentative.
! The criteria are calculated to ensure soil sustainability for continued cropproduction.
Modifications ! On acid sandy soils fluoride concentrations should be maintained at less than 1 mg/R.
! The criteria were derived with the assumption that the soil to be irrigated contains onlynegligible quantities of fluoride. Should this not be the case the period of irrigationneeds to be reduced accordingly.
! The criteria may not protect commercial floricultural crops grown in greenhouseswithout soil (hydroponic or similar methods) because it is assumed that the soil has acapacity to deactivate fluoride.
! Should the site-specific conditions vary significantly from the assumptions that wereused to derive the criteria, the values may need adjustment.
! Potted plants normally receive water applications in excess of the assumptions used toderive the criteria. Since potted plants are only grown for limited periods, the criteriaapplicable to fine-textured neutral to alkaline soils can mostly be used.

87
Sources of Information
APHA 1989. Standard Methods for the Examination of Water and Waste Water, 17thEdition. American Public Health Association, American Water Works Association, WaterPollution Control Federation. Published by the American Public Health Association,Washington DC, USA.
AYERS R.S. and D.W. Westcott 1985. Water Quality for Agriculture FAO Irrigation andDrainage Paper No. 29. FAO, Rome.
BOWEN H.J.M. 1979. Environmental Chemistry of the Elements. Academic Press,London.
CANADIAN GUIDELINES 1987. Canadian Water Quality Guidelines. Prepared by theTask Force on Water Quality Guidelines of the Canadian Council of Resource andEnvironment Ministers. Canada.
DEPARTMENT OF WATER AFFAIRS AND FORESTRY 1993. South African WaterQuality Guidelines, Volume 4: Agricultural Use.
FORD W.E. and E.S. Dana 1963. A Textbook of Mineralogy, 4th Edition. John Wiley &Sons Inc., New York.
HART B.T. 1974. A Compilation of Australian Water Quality Criteria. AWRCTechnical Paper No. 7.
HART B.T., C. Angehrn-Bettinazzi, I.C. Campbell and M.J. Jones 1992. Draft AustralianWater Quality Guidelines. Australian and New Zealand Environment and ConservationCouncil. January 1992.
McKEE J.E. and H.W. Wolf 1963. Water Quality Criteria, 2nd Edition. California StateWater Resources Control Board, Publication No. 3-A. California.
PRATT P.F. and D.L. Suarez 1990. Irrigation Water Quality Assessments. In:Agricultural Salinity Assessment and Management, K.K. Tanjii (Ed.). ASCE Manuals andReports on Engineering Practice No. 71. ASCE New York 1990.
UNITED STATES ENVIRONMENTAL PROTECTION AGENCY 1973. ProposedCriteria for Water Quality. US EPA, Washington DC, October 1979.
WEAST R.C. 1979. CRC Handbook of Chemistry and Physics, 60th Edition. CRC PressInc., Boca Raton, Florida, USA.
Agricultural Water Use: Irrigation 2nd Edition, 1996 (1st Issue) Fluoride: Page 5 of 5

Agricultural Water Use: Irrigation 2nd Edition, 1996 (1st Issue) Fluoride: Page 6 of 5
88
89
IronTentative Guideline
Background Information
Introduction Pure iron is silvery in colour but usually appears as greyish-black or brown deposits as aresult of oxidation. Iron is found in three oxidation states, namely, 0, II and III of whichthe III oxidation state is the most common. In water, iron can be present as dissolved ferriciron, Fe(III), as ferrous iron, Fe(II) or as suspended iron hydroxides. Biologically iron isan essential micro-nutrient required by all living organisms. Since most soils are naturallyiron-rich, its concentration in the soil solution is determined primarily by soil pH, and soilaeration, which determine the oxidation state and thus solubility of iron. Therefore, the ironcontent of irrigation water has a negligible effect on the iron concentration in soil water,except in the case of soils with a low natural iron content. Iron dissolved in irrigation watergives rise to problems when it precipitates as damaging deposits on leaves or causes cloggingof irrigation equipment.
Occurrence Iron is the fourth most abundant element and constitutes five percent of the earth's crust.It is found in many minerals, the most common of which is haematite (Fe O ), widely used2 3
as an iron ore for metallurgical purposes. Other important iron minerals are pyrite (FeS ),2
siderite (FeCO ), magnetite (Fe O ), goethite (Fe O .H O), limonite (2Fe O .3H O) and a3 3 4 2 3 2 2 3 2
number of mixed ores, such as chalcopyrite (CuFeS ) and arsenopyrite (FeAsS). Pyrite is2
often associated with coal formations and iron may also occasionally be found in theelemental form, either as terrestrial iron or as meteoric iron. The reddish colour of soil isdue to iron, the median concentration in soil being four percent (m/m). Typically, theconcentration of dissolved iron in :
! unpolluted surface water is in the range of 0.001 - 0.5 mg/R; and ! sea water is approximately 0.002 mg/R.
The speciation of iron is strongly related to the pH and the redox potential of the water. Atneutral or alkaline pH, under oxidising conditions, the dissolved iron concentration is usuallyin the µg/R range but under reducing conditions, soluble ferrous iron may be formed andsubstantially higher concentrations, in the mg/R range may be encountered. Where markedacidification of the water occurs and the pH is less than 3.5, the dissolved ironconcentration can be several hundred mg/R, as may be the case with acid mine drainage.
There is a natural cycling of iron between the dissolved and precipitated phases at the watersediment interface, in which micro-organisms, particularly iron bacteria such as Gallionellaspp., play a significant role.
Interactions Iron is a major constituent in many soils. The iron concentration in soil water is determinedprimarily by its oxidation state and soil pH. Iron is precipitated as hydroxides in alkalinesoils, that render the iron unavailable to plants, so that iron deficiency mostly develops inalkaline soils. Ferrous iron dissolved in irrigation water oxidises and precipitates uponaeration when applied to soil, and is therefore relatively unavailable to plants. Underwaterlogged conditions iron is reduced and goes into solution. Precipitated iron in soil bindsphosphorus and molybdenum (essential plant nutrients), thereby making them unavailableto plants.
Therefore, the iron content of irrigation water for most soil types has little effect on the ironconcentration in the soil solution.

90
Measurement The criteria are given in terms of the total iron concentration, expressed in units of mg/R.The reference method is atomic absorption spectrometry (AAS) using an air acetyleneflame. Measurement of the total iron concentration requires acidification followed byfiltration prior to AAS analysis. Where other methods are used, their characteristics relativeto the reference method should be known.
Data International criteria for the concentration of iron in irrigation water have been calculatedInterpretation on a similar basis to that of other trace elements. In this guideline the criteria were
calculated (using limited available information) to ensure that iron does not accumulate toeither phytotoxic levels or levels that are toxic to consumers, within a given time period.The calculations assume that iron accumulates within the surface 150 mm of soil. As such,the objectives of sustained soil suitability for continued use and maintenance of crop yieldand quality are accounted for.
The arithmetic mean concentration of the applied water (preferably application volumeweighted) is used in the criteria for:
! The iron concentration that can be applied to any soil on a continuous basis. Thisconcentration is calculated such that iron does not accumulate to phytotoxicconcentrations in a soil that is irrigated continuously for up to 100 years at an irrigationapplication rate of 1 000 mm p.a.
! The iron concentration that can be applied to fine-textured, neutral to alkaline soils fora period of up to 20 years at an irrigation application rate of 1 000 mm p.a.
Treatment It is highly unlikely that iron can be economically removed from water intended forOptions irrigation use. However, should this be required, iron can be removed from water using
an oxidising process which will convert the iron into an insoluble oxide removable byfiltration. The following treatment approaches are used:
! The water can be aerated by devices such as fountains, cascades or mechanicalaeration; and
! The water can be chemically oxidised by dosing with chlorine, hydrogen peroxide,ozone or other strong oxidants. On an industrial scale chlorine is commonly used as thechemical oxidant. Post-treatment, high levels of residual chlorine should be avoidedsince this may interfere with the quality of the water for the purpose intended.
For the optimisation of treatment processes it is important to determine both the total anddissolved iron species and their relative concentrations.

91
The Effects of Iron
Norms The different norms used in the guideline to assess the effects of iron on irrigation water useare summarised below:
Irrigation water uses Norms for measuring waterquality effects
Application to commercial ! Crop yield as affected by crop sensitivity tocrops iron deposits on leaves
! Crop quality as affected by iron oxide spotson marketable product
Application to sustain ! No known negative effect in natural soilssuitability of irrigated soil
Maintenance of irrigation ! Iron precipitation can clog irrigationequipment equipment
Effects Iron is an essential micro-nutrient. Chlorosis as a result of iron deficiency is oftenencountered on alkaline soils. Iron-rich irrigation water can cause a number of problems,namely:
! When sprinkler irrigated, an iron coating may be deposited on plant leaves or fruit. Itcould be in the form of light brown spotting, a silvery coating or a thick black coating.This interferes with normal photosynthesis, transpiration and respiration and may leadto damage and eventual plant death.
! Iron oxide spots or coatings on marketable plant products reduce their quality and thusthe price that can be obtained for the produce.
! Iron precipitates can cause the clogging of irrigation equipment.
Mitigation Common on-farm management practices to mitigate against iron uptake by plants onirrigated land, are to
! apply agricultural lime in order to raise (or maintain) soil pH to neutral to slightlyalkaline; and/or
! ensure that soil is well aerated and not waterlogged; the solubility of iron increases underreducing conditions such as those associated with waterlogged soils; and/or
! switch to an irrigation system that does not wet plant leaves or marketable products.

92
Criteria Table 1: Effects of Iron on Crop Yield and Quality
Concentration Range Crop Yield and Quality(mg/RR)
Target Water Quality Not toxic to root uptake by plants in aerated soils. Range Plant foliage damaged or blemished by iron deposits# 5.0 when wetted during irrigation
5.0 - 20.0 Maximum acceptable as concentration for fine-texturedneutral to alkaline soils
> 20.0 Exceeds the maximum acceptable concentration usedby most international guidelines
Note:
! The TWQR for relatively unrestricted use on all soils and the concentrationrange for fine-textured neutral to alkaline soils for irrigation periods of up to20 years, are similar to most international criteria.
! The above criteria are based on relatively limited information and should beviewed as tentative.
Table 2: Effects of Iron on Water Uses involving Irrigation Equipment
Concentration Clogging of Irrigation EquipmentRange (mg/RR)
< 0.2 Only minor problems encountered with clogging of dripirrigation systems
0.2 - 1.5 Moderate problems encountered with clogging of dripirrigation systems
> 1.5 Severe problems encountered with clogging of dripirrigation systems
Modifications ! The criteria may not be protective for commercial floricultural crops grown ingreenhouses without soil (hydroponic or similar methods) because the criteria assumethat the soil has a capacity to deactivate iron.
! Should the site-specific conditions vary significantly from the assumptions that wereused to derive the criteria, the criteria may need adjustment.
! Since potted plants are grown for only limited periods, the criteria applicable to fine-textured neutral to alkaline soils, can mostly be used, provided leaves are not wetted.
Sources of Information

93
APHA 1989. Standard Methods for the Examination of Water and Waste Water, 17thEdition. American Public Health Association, American Water Works Association, WaterPollution Control Federation. Published by the American Public Health Association,Washington DC, USA.
AYERS R.S. and D.W. Westcott 1985. Water Quality for Agriculture, FAO Irrigation andDrainage Paper No. 29. FAO, Rome.
BOWEN H.J.M. 1979. Environmental Chemistry of the Elements. Academic Press,London.
CANADIAN GUIDELINES 1987. Canadian Water Quality Guidelines. Prepared by theTask Force on Water Quality Guidelines of the Canadian Council of Resource andEnvironment Ministers. Canada.
DEPARTMENT OF WATER AFFAIRS AND FORESTRY 1993. South African WaterQuality Guidelines, Volume 4: Agricultural Use.
FORD W.E. and E.S. Dana 1963. A Textbook of Mineralogy, 4th Edition. John Wiley &Sons Inc., New York.
HART B.T. 1974. A Compilation of Australian Water Quality Criteria. AWRCTechnical Paper No. 7.
HART B.T., C. Angehrn-Bettinazzi, I.C. Campbell and M.J. Jones 1992. Draft AustralianWater Quality Guidelines. Australian and New Zealand Environment and ConservationCouncil.
McKEE J.E. and H.W. Wolf 1963. Water Quality Criteria, 2nd Edition. California StateWater Resources Control Board, Publication No. 3-A. California.
NAKAYAMA F.S. and D.A. Bucks 1991. Water Quality in Drip/trickle Irrigation: AReview. Irrig. Sci. 12, 187 - 192.
PAGE A.L. and A.C. Chang 1990. Deficiencies and Toxicities of Trace Elements. In:Agricultural Salinity Assessment and Management, K.K. Tanjii (Ed.). ASCE Manuals andReprints on Engineering Practice No. 71. ASCE New York 1990.
PRATT P.F. and D.L. Suarez 1990. Irrigation Water Quality Assessments. In:Agricultural Salinity Assessment and Management, K.K. Tanjii (Ed.). ASCE Manuals andReports on Engineering Practice No. 71. ASCE New York 1990.
UNITED STATES ENVIRONMENTAL PROTECTION AGENCY 1973. ProposedCriteria for Water Quality. US EPA, Washington DC, October 1979.
WEAST R.C. 1979. CRC Handbook of Chemistry and Physics, 60th Edition. CRC PressInc., Boca Raton, Florida, USA.
Agricultural Water Use: Irrigation 2nd Edition, 1996 (1st Issue) Iron: Page 5 of 5

94

Agricultural Water Use: Irrigation 2nd Edition, 1996 (1st Issue) Lead: Page 1 of 5
95
LeadTentative Guideline
Background Information
Introduction Lead is a bluish-white, very soft metal, which is highly malleable and ductile. It is alsohighly resistant to corrosion. Plants respond to the lead concentration in the soil solution.Similar to most trace elements, lead is strongly adsorbed by soil and its addition to soils inrelatively high concentrations over the short-term may not result in reduced crop growth orin its accumulation in plant concentrations detrimental to humans or animals. However,continuous application over extended periods results in its accumulation in the surface soillayer, in practice, the cultivated or plough layer.
Occurrence The most common mineral ores of lead are galena (lead sulphide), cerussite (leadcarbonate) and anglesite (lead sulphate). The occurrence of lead in its elemental state israre. Lead tends to accumulate in sediments and soils in the environment. Lead which hasbeen absorbed by vertebrate organisms, is to a large extent deposited in the bony skeleton.
Typically, the concentration of lead in
! surface water is less than 0.010 mg/R; ! sea water is no more than 0.003 mg/R; and ! contaminated water may be several mg/R. Dissolution of lead from lead pipes occurs
particularly with soft water low in calcium carbonate.
Lead has many industrial applications which can give rise to sources of lead contaminationin water supplies. Lead is used in batteries, in domestic water distribution pipes, in paintsand as an organic lead compound, alkyl lead, in gasoline.
Interactions The soil chemical behaviour of lead is similar to that of cadmium, copper, nickel and zinc.Lead concentrations in the soil solution are largely determined by sorption and desorptionreactions with the soil exchange complex. Sorption dominates at the relatively low concen-trations that are of concern for water quality criteria for irrigation. Soil pH has a majoreffect on the concentration of lead in the soil solution and its solubility decreases withincreasing pH.
Implications for irrigation with water containing lead include the following:
! Due to the strong sorption of lead by the soil exchange complex, it can be expected tobe retained in the soil surface layers.
! Significant downward movement to below the plough layer and contamination ofground water with lead is unlikely.
! The larger the soil's cation exchange capacity (determined by clay content and claymineral type) the more lead can generally be sorbed.
! Soils with a neutral to alkaline pH will be able to accept a greater lead load than acidicsoils before concentrations in the soil solution become phytotoxic.
Measurement The criteria are given in terms of the total lead concentration, in units of mg/R. Lead canbe measured colorimetrically at low concentration (0 - 30 Fg/R) using the dithizone method

Agricultural Water Use: Irrigation 2nd Edition, 1996 (1st Issue) Lead: Page 2 of 5
96
to form the cherry red lead dithizonate, which is measured spectrophotometrically.Alternatively, lead may be measured by atomic absorption spectrophotometry. These twomethods constitute the reference methods for lead. If other methods are used, theircharacteristics relative to the reference methods should be known.
Data Because lead is retained strongly by soils, it is likely to accumulate to phytotoxicInterpretation concentrations before equilibrium between sorption and desorption reactions are reached.
In order to prevent its accumulation, the total load applied to soil needs to be limited.International criteria for the concentration of lead in irrigation water has been calculated(using limited available information) to ensure that it does not accumulate to eitherphytotoxic levels or levels that are toxic to consumers, within a given time period. Thecalculations assume that lead accumulates within the surface 150 mm of soil. As such, theobjectives of sustained soil suitability for continued use and maintenance of crop yield andquality are accounted for.
The arithmetic mean concentrations of the applied water (preferably application volumeweighted) are given in the criteria for two concentration ranges, namely:
! The lead concentration that can be applied to any soil on a continuous basis. Thisconcentration is calculated such that lead does not accumulate to phytotoxicconcentrations in a soil that is irrigated continuously for up to 100 years at an irrigationapplication rate of 1 000 mm p.a.
! The lead concentration that can be applied to fine-textured, neutral to alkaline soils fora period of up to 20 years at an irrigation application rate of 1 000 mm p.a.
Treatment It is highly unlikely that lead can economically be removed from water intended forOptions irrigation use. However, should it be required, lead is most conveniently removed by
applying conventional water treatment processes of coagulation with alum, ferric salts orlime followed by settlement and filtration.
The coagulation/flocculation process requires careful monitoring to ensure completeremoval. A watery sludge containing lead is generated in the process; this may presentdisposal difficulties.
The Effects of Lead
Norms The different norms used in the guidelines to assess the effects of lead on irrigation wateruse are summarised below:
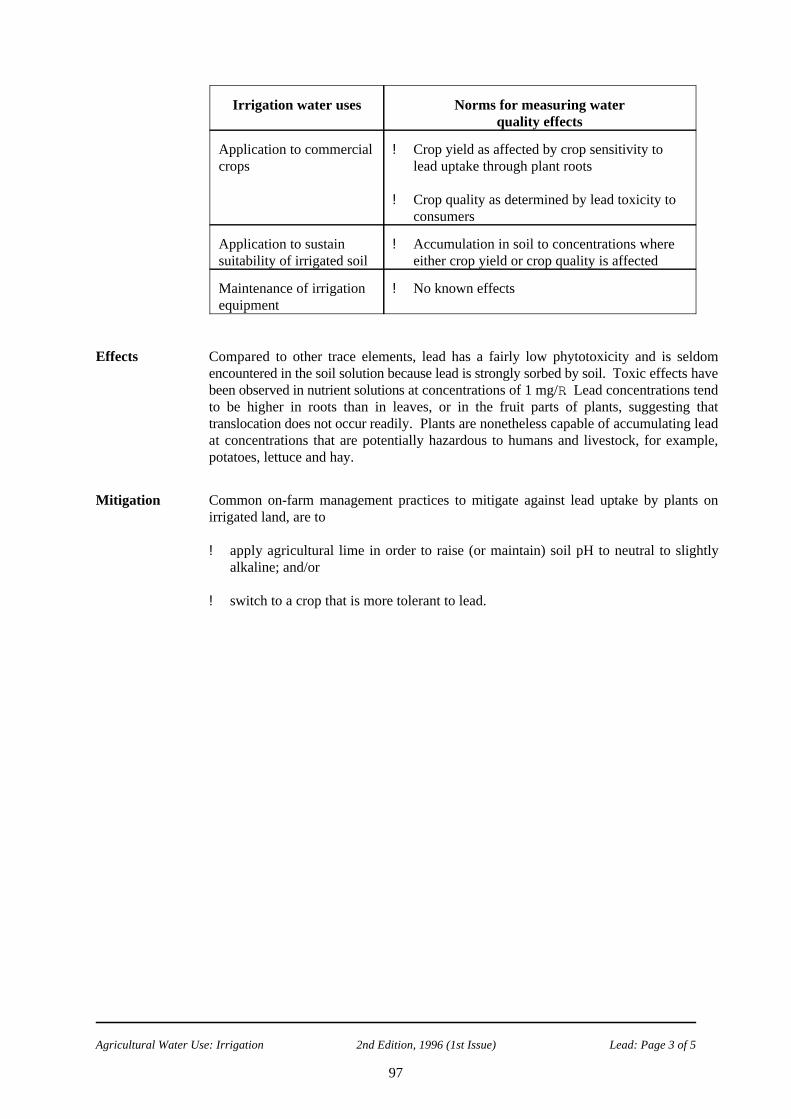
Agricultural Water Use: Irrigation 2nd Edition, 1996 (1st Issue) Lead: Page 3 of 5
97
Irrigation water uses Norms for measuring waterquality effects
Application to commercial ! Crop yield as affected by crop sensitivity tocrops lead uptake through plant roots
! Crop quality as determined by lead toxicity toconsumers
Application to sustain ! Accumulation in soil to concentrations wheresuitability of irrigated soil either crop yield or crop quality is affected
Maintenance of irrigation ! No known effectsequipment
Effects Compared to other trace elements, lead has a fairly low phytotoxicity and is seldomencountered in the soil solution because lead is strongly sorbed by soil. Toxic effects havebeen observed in nutrient solutions at concentrations of 1 mg/R. Lead concentrations tendto be higher in roots than in leaves, or in the fruit parts of plants, suggesting thattranslocation does not occur readily. Plants are nonetheless capable of accumulating leadat concentrations that are potentially hazardous to humans and livestock, for example,potatoes, lettuce and hay.
Mitigation Common on-farm management practices to mitigate against lead uptake by plants onirrigated land, are to
! apply agricultural lime in order to raise (or maintain) soil pH to neutral to slightlyalkaline; and/or
! switch to a crop that is more tolerant to lead.

Agricultural Water Use: Irrigation 2nd Edition, 1996 (1st Issue) Lead: Page 4 of 5
98
Criteria Effects of Lead on Crop Yield and Quality
Concentration Crop Yield and QualityRange (mg/RR)
Target Water Application at the rate of 1 000 mm/annum for 100Quality Range years would result in lead accumulation to 89 mg/kg in
# 0.2 the top 150 mm of soil. Few plants appear to beaffected at this level
Yield reduction and crop failure are the main effects oflead contaminated soils. Generally lead does notaccumulate in edible parts of plants to levels that aredangerous to consumers (potatoes, lettuce and hayhave, however, been shown to concentrate lead)
0.2 - 2.0 Maximum acceptable as concentration for fine-texturedneutral to alkaline soils
Acceptable for irrigation only over the short term on asite-specific basis
> 2.0
Note:
! The TWQR for relatively unrestricted use on all soils and the concentrationrange for fine-textured neutral to alkaline soils for irrigation periods of up to20 years, are similar to most international criteria.
! The above criteria are based on relatively limited information and should beviewed as tentative.
! The criteria are calculated to ensure soil sustainability for continued cropproduction.
Modifications ! The criteria were derived with the assumption that the soil to be irrigated contains onlynegligible quantities of lead. Should this not be the case the period of irrigation shouldbe reduced accordingly.
! The criteria may not protect commercial floricultural crops grown in greenhouseswithout soil (hydroponic or similar methods) because the criteria assume that the soilhas a capacity to deactivate lead.
! Should the site-specific conditions vary significantly from the assumptions that wereused to derive the criteria, the criteria may need adjustment.
! Since potted plants are only grown for limited periods, the criteria applicable to fine-textured neutral to alkaline soils can mostly be used.

Agricultural Water Use: Irrigation 2nd Edition, 1996 (1st Issue) Lead: Page 5 of 5
99
Sources of Information
APHA 1989. Standard Methods for the Examination of Water and Waste Water, 17thEdition. American Public Health Association, American Water Works Association, WaterPollution Control Federation. Published by the APHA, Washington DC, USA.
AYERS R.S. and D.W. Westcott 1985. Water Quality for Agriculture FAO Irrigation andDrainage Paper No. 29. FAO, Rome.
BERMAN E. 1980. Toxic Metals and Their Analysis. Heyden, London.
CANADIAN GUIDELINES 1987. Canadian Water Quality Guidelines. Prepared by theTask Force on Water Quality Guidelines of the Canadian Council of Resource andEnvironment Ministers. Canada.
DEPARTMENT OF WATER AFFAIRS AND FORESTRY 1993. South African WaterQuality Guidelines, Volume 4: Agricultural Use.
DEVEREL S.J. and R. Fujii 1990. Chemistry of Trace Elements in Soils and GroundWater. In: Agricultural Salinity Assessment and Management, K.K. Tanjii (Ed.). ASCEManuals and Reprints on Engineering Practice No. 71. ASCE New York 1990.
HART B.T. 1974. A Compilation of Australian Water Quality Criteria. AWRCTechnical Paper No. 7.
HART B.T., C. Angehrn-Bettinazzi, I.C. Campbell and M.J. Jones 1992. Draft AustralianWater Quality Guidelines. Australian and New Zealand Environment and ConservationCouncil. January 1992.
McKEE J.E. and H.W. Wolf 1963. Water Quality Criteria, 2nd Edition. California StateWater Resources Control Board, Publication No. 3-A. California.
PAGE A.L. and A.C. Chang 1990. Deficiencies and Toxicities of Trace Elements. In:Agricultural Salinity Assessment and Management, K.K. Tanjii (Ed.). ASCE Manuals andReprints on Engineering Practice No. 71. ASCE New York 1990.
PRATT P.F. and D.L. Suarez 1990. Irrigation Water Quality Assessments. In:Agricultural Salinity Assessment and Management, K.K. Tanjii (Ed.). ASCE Manuals andReports on Engineering Practice No. 71. ASCE New York 1990.
UNDERWOOD E.J. 1977. Trace Elements in Human and Animal Nutrition, 4th Edition.Academic Press, New York, USA.
US EPA 1973. Proposed Criteria for Water Quality. US EPA, Washington DC, October1979.
WEAST R.C. 1979. CRC Handbook of Chemistry and Physics, 60th Edition. CRC PressInc., Boca Raton, Florida, USA.

100

Agricultural Water Use: Irrigation 2nd Edition, 1996 (1st Issue) Lithium: Page 1 of 4
101
LithiumTentative Guideline
Background Information
Introduction Lithium is the lightest of all the metals; it is also lighter than water. It reacts with water,resulting in the release of hydrogen. Like sodium, higher concentrations tend to be foundin hot springs associated with arid hydrogeological conditions.
Occurrence Lithium is found as the pearly-coloured spodumene (lithium aluminium silicate) andamblygonite (lithium aluminium fluorophosphate) in granite pegmatites. It also occurs aslilac-coloured lepidolite mica.
Typically, lithium concentrations in fresh waters are around 0.002 mg/R. Higherconcentrations can be found in spring waters and mineral springs. Sea water containsapproximately 0.18 mg/R lithium.
Lithium is used in the aerospace industry in the manufacture of light alloys. Lithium saltsare used in lubricating greases and in metal cleaning and soldering fluxes. Lithium is alsoused in the manufacture of glazes and enamels, in alkaline batteries and in photography.
Interactions Lithium is a monovalent cation which takes part in cation exchange reactions. It is fairlyeasily displaced by all other cations and is therefore fairly mobile and leaches relativelyeasily. Its behaviour is similar to sodium but it is less strongly adsorbed and more mobile.However, the fact that it is adsorbed does not appear to have much affect on its availabilityto plants.
Over the long term (i.e. under conditions of chemical equilibrium) the lithium content ofirrigation water determines the percentage of exchangeable lithium on the soil exchangecomplex. Since the quantity of cations in irrigation water is normally small compared tothose adsorbed on a soil's cation exchange complex, the exchangeable lithium percentageof a soil profile changes only slowly towards that implied by its concentration in irrigationwater. Several years to decades may be required before steady state conditions areestablished throughout the soil profile.
Measurement Lithium is very easily measured by flame emission photometry, by virtue of the intense redlight emission of thermally-excited lithium atoms. This is the reference method. Whereother methods are used, their characteristics relative to the reference method should beknown.
Data Since the exchangeable lithium percentage of a soil profile is well buffered against changes,Interpretation plant and soil reactions with lithium in soil are not affected by short-term variations in the
lithium content of irrigation water. The mean lithium concentration of water during theirrigation season (application volume weighted where possible) should therefore be used toassess the following plant and soil reactions:
! The degree to which the growth of lithium-sensitive plants is affected by root uptakeof lithium.
! The negative effect of lithium on soil physical properties.

Agricultural Water Use: Irrigation 2nd Edition, 1996 (1st Issue) Lithium: Page 2 of 4
102
TreatmentOptions It is highly unlikely that lithium can economically be removed from water intended for
irrigation use. However, should it be required, lithium can be removed from water,together with other ions which constitute the TDS, by a number of desalination processes,including:
! Demineralisation in a mixed-bed ion exchange column, usually where the feed TDS isup to approximately 2 000 mg/R.
! Treatment by membrane processes such as reverse osmosis and electrodialysis, wherethe TDS concentration is in the range of 2 000 - 3 500 mg/R.
! Distillation, in cases where the TDS is 10 000 mg/R or more.
The Effects of Lithium
Norms The different norms used in the guideline to assess the effects of lithium on irrigation wateruse are summarised below:
Irrigation water uses Norms for measuring waterquality effects
Application to commercial crops ! Crop yield as affected by crop sensitivityto lithium uptake through plant roots
Application to sustain suitability ! Accumulation in soil to levels where cropof irrigated soil yield is affected
! Accumulation in soils to concentrationswhere soil physical properties are affected
Maintenance of irrigation ! No known effectsequipment
Effects Irrigation with water containing lithium results in the retention of lithium by the soilexchange complex. Two negative effects are associated with lithium-affected soils, namely:
! reduced crop yield caused by lithium toxicity when lithium is taken up by plant roots;and
! impaired soil physical conditions (similar to the effects of sodium on soils).
The uptake of lithium by plant roots can result in the accumulation of lithium to levels thatare toxic to plant growth. This can cause reduced yields or impaired crop quality. Cropssensitive to sodium are generally also sensitive to lithium. Most crops grown in nutrientsolutions can tolerate up to 5 mg/R lithium. Citrus is, however, very sensitive and showstoxic responses at concentrations of 0.06 - 0.1 mg/R. Severe toxicity symptoms have beendisplayed by grapefruit irrigated with water containing 0.18 - 0.25 mg/R. Barley growth isreduced by 1 mg/R in nutrient solutions while cabbage displays a 30 % decrease in growthin a nutrient solution with 6.9 mg/R lithium. Increased potassium and decreased calciumuptake has been observed at high lithium concentrations, possibly due to changes in rootmembrane permeability.

Agricultural Water Use: Irrigation 2nd Edition, 1996 (1st Issue) Lithium: Page 3 of 4
103
Lithium has a similar (but more severe) effect than sodium on soil physical properties. Thiseffect is, however, not noticeable at concentrations toxic to plants. Criteria which protectplant growth automatically protect soil physical properties as well.
Mitigation Common on-farm management practices to mitigate against the negative effects of anincreasing lithium concentration in water affecting crop yield, are to
! accept a reduced crop yield; and/or
! switch to crops that are more tolerant; and/or
! apply calcium and/or magnesium to the soil to promote displacement of lithium fromthe soil exchange complex.
Criteria Effects of Lithium on Crop Yield
Concentration Crop YieldRange (mg/RR)
Target Water Tolerated by most crops in nutrient solutionsQuality Range
# 2.5 containing 5 mg/R. Some crops are more sensitive, e.g.sugar beet (3.5 mg/R), barley (1 mg/R) and citrus(0.075 mg/R).
Note:
! The TWQR for relatively unrestricted use on all soils is similar to mostinternational criteria.
! The above criteria guideline is based on relatively limited information andshould be viewed as tentative.
Modifications ! Citrus experience lithium toxicity at low levels. The limit for irrigating citrus is0.075 mg/R.
! The criteria to prevent crop yield reduction is in most cases applicable for theprevention of lithium-induced soil physical degradation.
! Commercial floricultural crops grown in greenhouses without soil (hydroponic or similarmethods) may tolerate slightly higher lithium concentrations.
! Potted plants normally receive water applications in excess of irrigated crops and are notregularly leached.
Lithium can thus be expected to accumulate to higher concentrations than in irrigated soil.However, since potted soil can be leached fairly easily and is normally used for limitedperiods only, the same criteria as for commercial irrigated crops can be used.

Agricultural Water Use: Irrigation 2nd Edition, 1996 (1st Issue) Lithium: Page 4 of 4
104
Sources of Information
AYERS R.S. and D.W. Westcott 1985. Water Quality for Agriculture, FAO Irrigation andDrainage Paper No. 29. FAO, Rome.
BERMAN E. 1980. Toxic Metals and Their Analysis. Heyden, London.
BOWEN H.J.M. 1979. Environmental Chemistry of the Elements. Academic Press,London.
CANADIAN GUIDELINES 1987. Canadian Water Quality Guidelines. Prepared by theTask Force on Water Quality Guidelines of the Canadian Council of Resource andEnvironment Ministers. Canada.
DEPARTMENT OF WATER AFFAIRS AND FORESTRY 1993. South African WaterQuality Guidelines, Volume 4: Agricultural Use.
DEVEREL S.J. and R. Fujii 1990. Chemistry of Trace Elements in Soils and GroundWater. In: Agricultural Salinity Assessment and Management, K.K. Tanjii (Ed.). ASCEManuals and Reprints on Engineering Practice No. 71. ASCE New York 1990.
FORD W.E. and E.S. Dana 1963. A Textbook of Mineralogy, 4th Edition. John Wiley &Sons Inc., New York.
HART B.T. 1974. A Compilation of Australian Water Quality Criteria. AWRCTechnical Paper No. 7.
HART B.T., C. Angehrn-Bettinazzi, I.C. Campbell and M.J. Jones 1992. Draft AustralianWater Quality Guidelines. Australian and New Zealand Environment and ConservationCouncil. January 1992.
PAGE A.L. and A.C. Chang 1990. Deficiencies and Toxicities of Trace Elements. In:Agricultural Salinity Assessment and Management, K.K. Tanjii (Ed.). ASCE Manuals andReprints on Engineering Practice No. 71. ASCE New York 1990.
PRATT P.F. and D.L. Suarez 1990. Irrigation Water Quality Assessments. In:Agricultural Salinity Assessment and Management, K.K. Tanjii (Ed.). ASCE Manuals andReports on Engineering Practice No. 71. ASCE New York 1990.
UNITED STATES ENVIRONMENTAL PROTECTION AGENCY 1973. ProposedCriteria for Water Quality. US EPA, Washington DC, October 1979.

Agricultural Water Use: Irrigation 2nd Edition, 1996 (1st Issue) Manganese: Page 1 of 5
105
ManganeseTentative Guideline
Background Information
Introduction Manganese is a grey-white, brittle metal and is found in several oxidation states, namely -III, -I, 0, I, II, III, IV, V, VI and VII. Plants respond to the manganese concentration inthe soil solution. Manganese is an essential plant nutrient. It appears to be required as anenzyme activator. Its concentration is highest in the reproductive parts of plants (seeds) andlowest in woody sections.
Occurrence Manganese is a relatively abundant element, constituting approximately 0.1 % of the earth'scrust. Commonly occurring minerals which contain manganese include pyrolusite (MnO ),2
manganite (Mn O .H O), rhodochrosite (MnCO ) and rhodonite (MnSiO ). Manganese is2 3 2 3 3
found in solution predominantly as the manganous Mn(II) ion, which can be stabilised bycomplexation to humic acids. On oxidation to the manganic, ion, Mn(IV), manganese tendsto precipitate out of solution to form a black hydrated oxide, which is responsible for thestaining problems often associated with manganese-bearing waters.
Typically, the median concentration of manganese in
! fresh water is 8 µg/R, with a range of 0.02 - 130 µg/R; ! soils is 1 000 mg/kg; and! sea water is approximately 0.2 µg/R.
Manganese concentrations in the mg/R range can be found in anaerobic, bottom levelwaters, where manganese has been mobilised from the sediments. Industrial uses ofmanganese include
! the manufacture of steel and manganese alloys; ! the salts of manganese as drying compounds in varnishes and oils;! manganese chloride in dry cell batteries;! manganese carbonate as the pigment "manganese white"; and ! manganese dioxide in the manufacture of amethyst glass and decorative porcelain.
Interactions Manganese is a normal soil constituent. Its concentration in the soil solution is largelydetermined by soil pH and oxidation-reduction reactions. This is further modified bysorption and desorption reactions with the soil exchange complex. Manganese is reduced(and the solubility increased) under waterlogged conditions in association with low pH.Under these conditions the manganese concentration in the soil solution can increase tolevels toxic to plant growth. The effect of soil pH is to decrease the manganeseconcentration in the soil solution as soil pH increases. Manganese toxicity seldom occursat soil pH (water) above 5.5 - 6.0. In practice the concentration of manganese in irrigationwater is therefore relatively unimportant in determining the concentration in soil solution.
Measurement Manganese is measured as total manganese, in units of mg/R. The reference method for thedetermination of manganese in water is atomic absorption spectrometry, using an air-acetylene flame. Samples should be acidified prior to analysis to dissolve manganeseadsorbed to suspended matter. Where other methods are used, their characteristics relativeto the reference method should be known.

Agricultural Water Use: Irrigation 2nd Edition, 1996 (1st Issue) Manganese: Page 2 of 5
106
DataInterpretation International criteria for the concentration of manganese in irrigation water have been
calculated (using limited available information) to ensure that it does not accumulate tophytotoxic levels, within a given time period. The calculations assume that manganeseaccumulates within the surface 150 mm of soil. As such, the objectives of sustained soilsuitability for continued use and maintenance of crop yield and quality are accounted for.
The arithmetic mean concentration of the applied water (preferably application volumeweighted) is given in the criteria for:
! The manganese concentration that can be applied to any soil on a continuous basis.This concentration is calculated such that manganese does not accumulate to phytotoxicconcentrations in a soil that is irrigated continuously for up to 100 years at an irrigationapplication rate of 1 000 mm p.a.
! The manganese concentration that can be applied to fine-textured, neutral to alkaline
soils for a period of up to 20 years at an irrigation application rate of 1 000 mm p.a.
Treatment It is highly unlikely that manganese can be economically removed from water intendedOptions for irrigation use. However, should it be required, manganese is commonly removed from
water using an oxidising process which converts the manganese into an insoluble oxideremovable by filtration. The reaction is considerably more difficult to achieve than withiron and normally requires the use of a strong oxidising agent. Agents commonly usedinclude
! chlorine;! hydrogen peroxide;! potassium permanganate; and! ozone.
Where the oxidant leaves a residual, as is the case with chlorine, the residual should beremoved before the water is supplied for use.
On an industrial scale the process usually needs to be closely controlled and monitoredbecause the consequences of incomplete treatment may be severe.
The Effects of Manganese
Norms The different norms used in the guideline to assess the effects of manganese on irrigationwater use are summarised in the table that follows:

Agricultural Water Use: Irrigation 2nd Edition, 1996 (1st Issue) Manganese: Page 3 of 5
107
Irrigation water uses Norms for measuring waterquality effects
Application to commercial crops ! Crop yield as affected by crop sensitivityto manganese uptake through plant roots
Application to sustain suitability ! Accumulation in soil to concentrationsof irrigated soil where crop yield is affected
Maintenance of irrigation ! Clogging of irrigation emitters andequipment distribution system
Effects Plants vary in their sensitivity to manganese and toxicity has been observed at a fraction ofa mg/R in nutrient solution. At fairly low concentrations manganese can cause the cloggingof irrigation pipelines, drip and microjet emitters.
Mitigation Common on-farm management practices to mitigate against excessive manganese uptakeby plants on irrigated land, are to
! apply agricultural lime, in order to raise or maintain soil pH to neutral to slightly alkaline;and/or
! maintain the aeration status of the soil to ensure oxidising conditions; and/or
! switch to a crop that is more tolerant to manganese.
Criteria Table 1: Effects of Manganese on Crop Yield and Soil Sustainability
Concentration Crop Yield and Soil SustainabilityRange (mg/RR)
Target Water Depending on plant species, nutrient solutions containingQuality Range a few tenths of a mg/R can induce manganese toxicity
# 0.02
0.02 - 10.0 Maximum acceptable concentration for fine-textured neutralto alkaline soils
> 10.0 Acceptable for irrigation only over the short term on a site-specific basis
Note:
! The TWQR for relatively unrestricted use on all soils, and the concentrationrange for fine-textured neutral to alkaline soils for irrigation periods of up to20 years, are similar to the most conservative international criteria.
! The above criteria are based on relatively limited information and should be

Agricultural Water Use: Irrigation 2nd Edition, 1996 (1st Issue) Manganese: Page 4 of 5
108
viewed as tentative.
! The criteria are calculated to ensure soil sustainability for continued cropproduction.
Table 2: Effects of Manganese on Water Uses involving Irrigation Equipment
Concentration Clogging of Irrigation EquipmentRange (mg/RR)
< 0.1 Only minor problems encountered with clogging of dripirrigation systems
0.1 - 1.5 Moderate problems encountered with clogging of dripirrigation systems
> 1.5 Severe problems encountered with clogging of dripirrigation systems
Modifications ! Should the site-specific conditions vary significantly from the assumptions that wereused to derive the criteria, the values may need adjustment.
! Potted plants normally receive water applications in excess of the assumptions used toderive the criteria. Since potted plants are only grown for limited periods, the criteriaapplicable to fine-textured neutral to alkaline soils, can mostly be used.
Sources of Information
APHA 1992. Standard Methods for the Examination of Water and Waste Water, 18thEdition. American Public Health Association, American Water Works Association, WaterEnvironment Federation. Published by the American Public Health Association,Washington DC, USA.
AYERS R.S. and D.W. Westcott 1985. Water Quality for Agriculture, FAO Irrigation andDrainage Paper No. 29. FAO Rome.
BERMAN E. 1980. Toxic Metals and Their Analysis. Heyden, London.
BOWEN H.J.M. 1979. Environmental Chemistry of the Elements. Academic Press,London.
CANADIAN GUIDELINES 1987. Canadian Water Quality Guidelines. Prepared by theTask Force on Water Quality Guidelines of the Canadian Council of Resource andEnvironment Ministers. Canada.
DEPARTMENT OF WATER AFFAIRS AND FORESTRY 1993. South African WaterQuality Guidelines, Volume 4: Agricultural Use. The Government Printer, Pretoria, SouthAfrica.
DEVEREAL S.J. and R. Fujii 1990. Chemistry of Trace Elements in Soils and GroundWater. In: Agricultural Salinity Assessment and Management, K.K. Tanjii (Ed.). ASCEManuals and Reprints on Engineering Practice No. 71. ASCE New York 1990.

Agricultural Water Use: Irrigation 2nd Edition, 1996 (1st Issue) Manganese: Page 5 of 5
109
FORD W.E. and E.S. Dana 1963. A Textbook of Mineralogy, 4th Edition. John Wiley &Sons Inc., New York.
HART B.T. 1974. A Compilation of Australian Water Quality Criteria. AWRCTechnical Paper No. 7.
HART B.T., C. Angehrn-Bettinazzi, I.C. Campbell and M.J. Jones 1992. Draft AustralianWater Quality Guidelines. Australian and New Zealand Environment and ConservationCouncil. January 1992.
McKEE J.E. and H.W. Wolf 1963. Water Quality Criteria, 2nd Edition. California StateWater Resources Control Board, Publication No. 3-A. California.
NAKAYAMA F.S. and D.A. Bucks 1991. Water Quality in Drip/trickle Irrigation: AReview. Irrig. Sci. 12, 187 - 192.
PAGE A.L. and A.C. Chang 1990. Deficiencies and Toxicities of Trace Elements. In:Agricultural Salinity Assessment and Management, K.K. Tanjii (Ed). ASCE Manuals andReprints on Engineering Practice No. 71. ASCE New York 1990.
PRATT P.F. and D.L. Suarez 1990. Irrigation Water Quality Assessments. In:Agricultural Salinity Assessment and Management, K.K. Tanjii (Ed.). ASCE Manuals andReports on Engineering Practice No. 71. ASCE New York 1990.
UNITED STATES ENVIRONMENTAL PROTECTION AGENCY 1973. ProposedCriteria for Water Quality. US EPA, Washington DC, October 1979.
WEAST R.C. 1979. CRC Handbook of Chemistry and Physics, 60th Edition. CRC PressInc., Boca Raton, Florida, USA.

110

Agricultural Water Use: Irrigation 2nd Edition, 1996 (1st Issue) Molybdenum: Page 1 of 4
111
MolybdenumBackground Information
Introduction Molybdenum is a silvery-white, very hard metal and is an essential micro-element for allliving organisms, but is toxic in excess. Molybdenum plays a role in many enzymes,notably the flavoprotein enzyme, xanthine oxidase.
Molybdenum occurs in soil predominantly as the molybdate (MoO ) anion. Plants absorb42-
molybdenum predominantly as molybdate from the soil solution. Plants concentratemolybdenum and are apparently able to tolerate concentrations of several 100 mg/kg inplant tissue without adverse effect. High molybdenum concentrations in feed is toxic toruminants. The risk associated with molybdenum uptake by crops is related to adverseeffects to livestock that consume these crops.
Occurrence The principle ore of molybdenum is molybdenite (MoS ), frequently found in association2
with tungsten-bearing minerals. Molybdenum is also found in association with lead, as themineral wulfenite (PbMoO ). Typically, the concentration of molybdenum in4
! freshwater is between 0.03 - 10 µg/R, with a median concentration of 0.5 µg/R; ! sea water is similar to that of freshwater; and! soils is between 0.1 - 40 mg/kg, with a median concentration of 1.2 mg/kg.
Molybdenum tends to be associated with the suspended sediment fraction of water. Higherconcentrations are generally found in sediments and soils and not in solution.
Molybdenum is used in the manufacture of hardened alloys and high strength steels and asa lubricant additive. It is used as a filament material in the electronics industry, in glass andceramics, and as a corrosion inhibitor.
Interactions Because of the generally low anion exchange capacity of soils, molybdenum is similar toother anions which are mostly very mobile in soils. Anion exchange capacity generallyincreases with decreasing pH, especially in soils with high fractions of aluminium and ironoxides. Molybdenum is therefore retained by acid soils, making it unavailable to plants.Thus molybdenum availability to plants increases with increasing soil pH.
Measurement The criteria are given in terms of the total molybdenum concentration, in units of mg/R.The reference method for the measurement of molybdenum is by electrothermal atomicabsorption spectrometry. Where other methods are used, their characteristics relative tothe reference method should be known.
Data Molybdenum concentrations in water should be interpreted in conjunction withInterpretation molybdenum concentrations in soils and sediments, and also in relation to copper and
sulphate concentrations. The arithmetic mean concentration of molybdenum in irrigationwater (preferably application volume weighted) are given in the criteria for:
! The molybdenum concentration that can be applied to any soil on a continuous basis.
! The molybdenum concentration that can be applied to acidic soils on a short- term

Agricultural Water Use: Irrigation 2nd Edition, 1996 (1st Issue) Molybdenum: Page 2 of 4
112
basis.
Treatment It is highly unlikely that molybdenum can be economically removed from water intendedOptions for irrigation use. However, should it be required, molybdenum is most conveniently
removed by raising the pH and precipitating the insoluble salts, after adding lime or ironsalts in the pH range of 8.5 - 11.5. The precipitation is followed by settlement and filtrationas in conventional water treatment.
The precipitation process requires careful monitoring to ensure that removal is complete.To achieve very low residuals, it may be necessary to pass the stream through an ionexchange column charged with the appropriate ions.
A watery, molybdenum-rich sludge or concentrate stream is generated in the processes thatmay present disposal difficulties.
The Effects of Molybdenum
Norms The different norms used in the guidelines to assess the effects of molybdenum on irrigationwater use are summarised below:
Irrigation water uses Norms for measuring waterquality effects
Application to commercial crops ! Crop quality as determined bymolybdenum toxicity to animals
Application to sustain suitability of ! Accumulation in soil to concentrationsirrigated soil where crop quality is affected
Maintenance of irrigation ! No known effectsequipment
Effects Molybdenum in low concentrations is an essential plant micro-nutrient, and plants can takeup relatively large amounts of molybdenum without any apparent ill effect. Molybdenumuptake appears to be proportional to the amount added to the soil. The accumulation ofmolybdenum in plant tissue is of concern because of its toxicity to livestock (molybdenosis).Molybdenum concentrations of 0.01 mg/R in soil and nutrient solutions have been found toaccumulate in legumes to levels that are toxic to cattle. The effects of molybdenum toxicityto livestock are aggravated by conditions of copper deficiency and high sulphur intake.
Mitigation Common on-farm management practices to mitigate against excessive molybdenum uptakeby plants on irrigated land, are to
! switch to a crop that is less absorbent of molybdenum; and/or
! acidify the soil (to reduce molybdenum availability);
! switch to crops that are not used as forage for livestock.Criteria Effects of Molybdenum on Water Uses involving Application to Commercial Crops
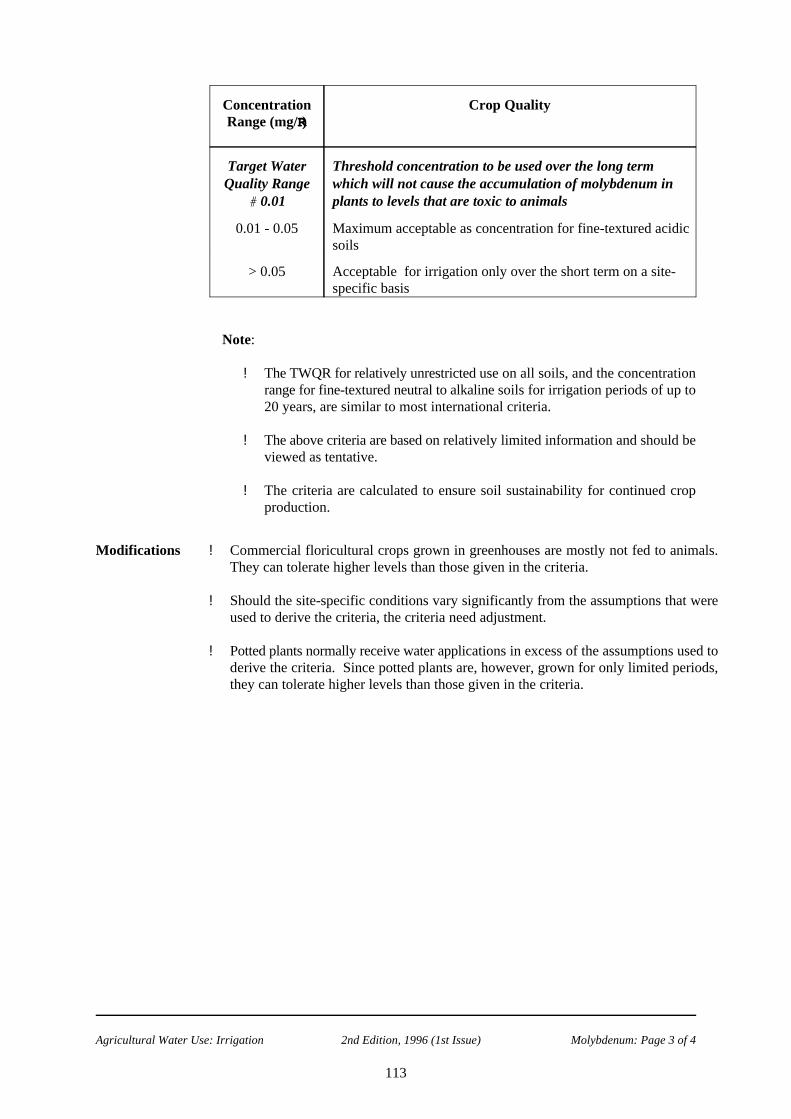
Agricultural Water Use: Irrigation 2nd Edition, 1996 (1st Issue) Molybdenum: Page 3 of 4
113
Concentration Crop QualityRange (mg/RR)
Target Water Threshold concentration to be used over the long term Quality Range which will not cause the accumulation of molybdenum in
# 0.01 plants to levels that are toxic to animals
0.01 - 0.05 Maximum acceptable as concentration for fine-textured acidicsoils
> 0.05 Acceptable for irrigation only over the short term on a site-specific basis
Note:
! The TWQR for relatively unrestricted use on all soils, and the concentrationrange for fine-textured neutral to alkaline soils for irrigation periods of up to20 years, are similar to most international criteria.
! The above criteria are based on relatively limited information and should beviewed as tentative.
! The criteria are calculated to ensure soil sustainability for continued cropproduction.
Modifications ! Commercial floricultural crops grown in greenhouses are mostly not fed to animals.They can tolerate higher levels than those given in the criteria.
! Should the site-specific conditions vary significantly from the assumptions that wereused to derive the criteria, the criteria need adjustment.
! Potted plants normally receive water applications in excess of the assumptions used toderive the criteria. Since potted plants are, however, grown for only limited periods,they can tolerate higher levels than those given in the criteria.

Agricultural Water Use: Irrigation 2nd Edition, 1996 (1st Issue) Molybdenum: Page 4 of 4
114
Sources of Information
APHA 1992. Standard Methods for the Examination of Water and Waste Water, 18thEdition. American Public Health Association, American Water Works Association, WaterEnvironment Federation. Published by the American Public Health Association,Washington DC, USA.
AYERS R.S. and D.W. Westcott 1985. Water Quality for Agriculture, FAO Irrigation andDrainage Paper No. 29. FAO, Rome.
BERMAN E. 1980. Toxic Metals and Their Analysis. Heyden, London.
BOWEN H.J.M. 1979. Environmental Chemistry of the Elements. Academic Press,London.
CANADIAN GUIDELINES 1987. Canadian Water Quality Guidelines. Prepared by theTask Force on Water Quality Guidelines of the Canadian Council of Resource andEnvironment Ministers. Canada.
DEPARTMENT OF WATER AFFAIRS AND FORESTRY 1993. South African WaterQuality Guidelines, Volume 4: Agricultural Use.
DEVEREAL S.J. and R. Fujii 1990. Chemistry of Trace Elements in Soils and GroundWater . In: Agricultural Salinity Assessment and Management, K.K. Tanjii (Ed.). ASCEManuals and Reprints on Engineering Practice No. 71. ASCE New York 1990.
FORD W.E. and E.S. Dana 1963. A Textbook of Mineralogy, 4th Edition. John Wiley &Sons Inc., New York.
HART B.T. 1974. A Compilation of Australian Water Quality Criteria. AWRCTechnical Paper No. 7.
HART B.T., C. Angehrn-Bettinazzi, I.C. Campbell and M.J. Jones 1992. Draft AustralianWater Quality Guidelines. Australian and New Zealand Environment and ConservationCouncil. January 1992.
McKEE J.E. and H.W. Wolf 1963. Water Quality Criteria, 2nd Edition. California StateWater Resources Control Board, Publication No. 3-A. California.
PAGE A.L. and A.C. Chang 1990. Deficiencies and Toxicities of Trace Elements.In:Agricultural Salinity Assessment and Management, K.K. Tanjii (Ed.). ASCE Manuals andReprints on Engineering Practice No. 71. ASCE New York 1990.
PRATT P.F. and D.L. Suarez 1990. Irrigation Water Quality Assessments. In:Agricultural Salinity Assessment and Management, K.K. Tanjii (Ed.). ASCE Manuals andReports on Engineering Practice No. 71. ASCE New York 1990.
WEAST R.C. 1979. CRC Handbook of Chemistry and Physics, 60th Edition. CRC PressInc., Boca Raton, Florida, USA.
Agricultural Water Use: Irrigation 2nd Edition, 1996 (1st Issue) Nickel: Page 1 of 4
115
NickelTentative Guideline
Background Information
Introduction Nickel is a silvery-white, hard, semi-magnetic metal, and occurs most commonly as asulphide ore. Plants respond to the nickel concentration in the soil solution and nickel, likemost trace elements, is strongly adsorbed by soil. The addition of nickel in relatively highconcentrations over the short-term may not result in reduced crop growth or in itsaccumulation in plant parts to concentrations detrimental to humans or animals. However,continuous applications of nickel over extended periods result in its accumulation in thesurface soil layer, in practice, the cultivated or plough layer.
Occurrence Nickel is widespread in the environment, with a slightly higher occurrence than copper in
the earth's crust. It tends to be concentrated on particles of manganese oxide in soils.Nickel occurs together with iron as a major constituent of most meteorites. Nickel mineralsinclude sulphides and arsenides. Important minerals are millerite (NiS), niccolite (NiAs) andchloanthite (NiAs ). The most common state is Ni(II). Most of the nickel released globally2
is from the burning of fossil fuels. Nickel is insoluble in water and other common solvents.Most soils tend to bind relatively large quantities of nickel.
Typically, the concentration of nickel in unpolluted fresh water is 0.0005 mg/R, and in seawater, is approximately 0.0006 mg/R. Higher concentrations may be found around mineswhere the ores contain nickel. Nickel is used for manufacturing a variety of alloys and iswidely used for making coins, in armour plating and for burglar proof vaults. Nickelcompounds are also used for catalytic properties in the chemical industry and in thehydrogenation of fats in the manufacturing of margarine.
Accumulation of nickel can occur in certain plants as well as in sediments, usually in thesulphide form.
Interactions The soil chemical behaviour of nickel is similar to that of cadmium, copper, lead and zinc.Nickel concentrations in the soil solution are largely determined by sorption and desorptionreactions with the soil exchange complex. Sorption dominates at the relatively lowconcentrations that are of concern for water quality criteria for irrigation. Soil pH also hasa major effect on the concentration of nickel in the soil solution. Its solubility decreaseswith increasing pH.
Implications for irrigation with water containing nickel, include the following:
! Due to the strong sorption of nickel by the soil exchange complex, nickel is expected tobe retained in the soil surface layer.
! There is little significant downward movement through the soil profile, and hencecontamination of groundwater is unlikely.
! Generally, the larger the soil's cation exchange capacity (determined by clay content andclay mineral type) the more nickel can be sorbed.
! Soils with a neutral to alkaline pH will be able to accept a greater nickel load than acidicsoils, before concentrations in the soil solution become phytotoxic.

Agricultural Water Use: Irrigation 2nd Edition, 1996 (1st Issue) Nickel: Page 2 of 4
116
Measurement The criteria are given in terms of the total nickel concentration, in mg/R. Total nickel isnormally measured by atomic absorption spectrometry after acidification of the sample. Ifother methods are used for the measurement of nickel, their characteristics relative to thereference method should be known.
Data Because nickel is retained strongly by soils, it is likely to accumulate to phytotoxicInterpretation concentrations before equilibrium between sorption and desorption reactions is reached.
In order to prevent nickel accumulation, the total load applied to soil needs to be limited.International criteria for the concentration of nickel in irrigation water have been calculated(using limited available information) to ensure that accumulation to either phytotoxic levels,or levels that are toxic to consumers, will not occur within a given time period. Thecalculations assume that nickel accumulates within the surface 150 mm of soil. As such,the objectives of sustained soil suitability for continued use and maintenance of crop yieldand quality are accounted for.
The arithmetic mean concentration of the applied water (preferably application volumeweighted) is given in the criteria for:
! The nickel concentration that can be applied to any soil on a continuous basis. Thisconcentration is calculated such that nickel does not accumulate to phytotoxicconcentrations in a soil that is irrigated continuously for up to 100 years at an irrigationapplication rate of 1 000 mm p.a.
! The nickel concentration that can be applied to fine-textured, neutral to alkaline soilsfor a period of up to 20 years at an irrigation application rate of 1 000 mm p.a.
Treatment It is highly unlikely that nickel can be economically removed from water intended forOptions irrigation use. However, should this be required, nickel can be removed from water by
precipitation at alkaline pH with lime, or by flocculation and coprecipitation with a ferricsalt. Alternatively ion exchange can be used.
The waste stream produced will have elevated levels of nickel, and will require appropriatedisposal.
The Effects of Nickel
Norms The different norms used in the guideline to assess the effects of nickel on irrigation wateruse are summarised below:

Agricultural Water Use: Irrigation 2nd Edition, 1996 (1st Issue) Nickel: Page 3 of 4
117
Irrigation water uses Norms for measuring waterquality effects
Application to commercial ! Crop yield as affected by crop sensitivity tocrops nickel uptake through plant roots
! Crop quality as determined by nickel toxicity toconsumers
Application to sustain ! Accumulation in soil to concentrations wheresuitability of irrigated soil either crop yield or crop quality is affected
Maintenance of irrigation ! No known effectsequipment
Effects Nickel can be translocated from soils through the human and animal food chain. It is notconsidered to be an essential plant nutrient. However, there is some evidence that nickelin small quantities may improve the growth of some plants, including oats and mustard. Athigh concentrations plant growth is reduced. In sand and solution cultures nickel has beenfound to be toxic to a number of plants at concentrations of 0.5 - 1.0 mg/R. Concentrationsof 0.5 mg/R in water culture are toxic to flax, but symptoms are reduced in the presence ofmolybdenum.
Mitigation Common on-farm management practices to mitigate against nickel uptake by plants onirrigated land, are to
! apply agricultural lime in order to raise (or maintain) soil pH to neutral to slightlyalkaline conditions; and/or
! switch to a crop that is more tolerant to nickel.
Criteria Effects of Nickel on Crop Yield and Quality
Concentration Crop Yield and QualityRange (mg/RR)
Target Water Depending on plant species, nutrient solutions containingQuality Range 0.5 - 1.0 mg/R can induce nickel toxicity
# 0.20
0.20 - 2.0 Maximum acceptable as concentration for fine-texturedneutral to alkaline soils
> 2.0 Acceptable for irrigation only over the short term on a site-specific basis
Note:
! The TWQR for relatively unrestricted use on all soils, and the concentrationrange for fine-textured neutral to alkaline soils for irrigation periods of up to20 years, are similar to most international criteria.
! The above criteria are based on relatively limited information and should beviewed as tentative.

Agricultural Water Use: Irrigation 2nd Edition, 1996 (1st Issue) Nickel: Page 4 of 4
118
! The criteria are calculated to ensure soil sustainability for continued cropproduction.
Modifications ! The criteria were derived with the assumption that the soil to be irrigated contains onlynegligible quantities of nickel. Should this not be the case, the period of irrigationshould be reduced accordingly.
! The criteria may not protect commercial floricultural crops grown in greenhouseswithout soil (hydroponic or similar methods), because it is assumed that the soil has acapacity to deactivate nickel.
! Should the site-specific conditions vary significantly from the assumptions that wereused to derive the criteria, the criteria may need adjustment.
! Potted plants normally receive water applications in excess of the assumptions used toderive the criteria. Since potted plants are only grown for limited periods, the criteriaapplicable to fine-textured neutral to alkaline soils, can mostly be used.
Sources of Information
AYERS R.S. and D.W. Westcott 1985. Water Quality for Agriculture, FAO Irrigation andDrainage Paper No. 29. FAO, Rome.
CANADIAN GUIDELINES 1987. Canadian Water Quality Guidelines. Prepared by theTask Force on Water Quality Guidelines of the Canadian Council of Resource andEnvironment Ministers. Canada.
DEPARTMENT OF WATER AFFAIRS AND FORESTRY 1993. South African WaterQuality Guidelines, Volume 4: Agricultural Use. The Government Printer, Pretoria, SouthAfrica
DEVEREAL S.J. and R. Fujii 1990. Chemistry of Trace Elements in Soils and GroundWater. In: Agricultural Salinity Assessment and Management, K.K. Tanjii (Ed.). ASCEManuals and Reprints on Engineering Practice No. 71. ASCE New York 1990.
HART B.T., C. Angehrn-Bettinazzi, I.C. Campbell and M.J. Jones 1992. Draft AustralianWater Quality Guidelines. Australian and New Zealand Environment and ConservationCouncil. January 1992.
PAGE A.L. and A.C. Chang 1990. Deficiencies and Toxicities of Trace Elements. In:Agricultural Salinity Assessment and Management, K.K. Tanjii (Ed.). ASCE Manualsand Reprints on Engineering Practice No. 71. ASCE New York 1990.
PRATT P.F. and D.L. Suarez 1990. Irrigation Water Quality Assessments. In:Agricultural Salinity Assessment and Management, K.K. Tanjii (Ed.). ASCE Manuals andReports on Engineering Practice No. 71. ASCE New York 1990.

Agricultural Water Use: Irrigation 2nd Edition, 1996 (1st Issue) Nitrogen (Inorganic): Page 1 of 7119
Nitrogen (Inorganic)Background Information
Introduction Nitrogen, as used in this guideline, refers to all inorganic nitrogen forms present in water,that is, ammonia, ammonium, nitrite and nitrate. Ammonia (NH ) and ammonium (NH ),3 4
are the reduced forms of inorganic nitrogen and their relative portions in water are governedby water temperature and pH. Nitrite (NO ) is the inorganic intermediate and nitrate (NO2 3
- -
) the end product of the oxidation of organic nitrogen and ammonia. Nitrate is the morestable of the two forms, and usually, by far, the more abundant in the soil and waterenvironment. In view of their co-occurrence and rapid interconversion, nitrite and nitrateare usually measured and considered together.
Nitrogen in irrigation water is primarily of concern because of :! its stimulatory effect on plant growth when applied in excess of plant requirements,! its potential to leach and contaminate ground water sources, and ! its stimulatory effect on nuisance growth of algae and aquatic plants in irrigation
structures (canals, storage, dams, etc.), that can interfere with the efficient distributionof irrigation water (diminished carrying or storage capacity of irrigation structures andclogging of sprinklers and micro-irrigation openings)
Occurrence All nitrogen forms are interrelated by a series of reactions, collectively known as thenitrogen cycle, which regulate the flow of nitrogen from inorganic soil forms in soil, air andwater into living systems, and then back again to inorganic forms. Organic nitrogen is alsoassociated with other components of organic matter, such as total organic carbon (TOC)and total phosphorus. In aquatic systems, interactions with suspended matter and withother nitrogen species such as ammonia, nitrate and nitrite take place.
Inorganic nitrogen is seldom present in high concentrations in unimpacted natural surfacewaters. This is because inorganic nitrogen is rapidly taken up by plants and converted toprotein and other organic forms of nitrogen in plant cells. Inorganic nitrogen concentrationsin unimpacted aerobic surface waters are usually less than 0.5 mg/R. In highly enrichedwaters, concentrations may be as high as 5 - 10 mg N/R.
Oxidised forms of organic nitrogen (usually nitrate) can sometimes be present in very highconcentrations (> 150 mg NO -N/R) in ground water. Such high concentrations occur under3
natural conditions (e.g. mineral salts derived from rock and soil) or from seepage of sewagesystems and leaching of fertilizers from soil.
Nitrogen in surface runoff from the surrounding catchment is the major inflow source tosurface waters. This is supplemented by the discharge from effluent streams containinghuman and animal wastes, agricultural fertilizers and organic industrial wastes. In highlyimpacted catchments, the inorganic nitrogen arising from human activities can greatlyexceed natural sources. In addition many groups of bacteria are able to transform organicnitrogen during the decomposition of organic material.
Interactions Nitrogen occurs predominantly as nitrate in irrigation water. The ammonium form is usuallya result of contamination with waste water. The amounts of nitrate and ammonia addedthrough the application of irrigation water, are usually small compared to that which isapplied as fertilizer or released by the mineralisation of organic matter. The concentrationsof nitrate and ammonia in soil water are determined primarily by the amounts added asfertilizer, sorption on the soil exchange complex (mainly ammonia), organic matter

Agricultural Water Use: Irrigation 2nd Edition, 1996 (1st Issue) Nitrogen (Inorganic): Page 2 of 7120
transformations (where nitrogen can be either incorporated into, or released from soilorganic matter) and nitrogen uptake by crops.
Being an anion, nitrate is only very weakly sorbed by the soil exchange complex (which ismainly a cation exchanger) and its movement in the soil is considered to be unaffected byexchange reactions. Therefore, nitrates leach freely, and their relative concentration anddistribution in a soil profile is largely determined by the leaching fraction (see TDS).Ammonia takes part in normal cation exchange reactions. Its movement in the soil profileis largely determined by exchange reactions, and leaching of the ammonium ion occurs veryseldom under normal conditions.
The interaction of nitrogen with soil is complicated by the fact that nitrogen is a majorconstituent of soil organic matter. Generally, the amount of nitrogen in soil organic matteris one order of magnitude greater than that present in the soil solution. The concentrationand oxidation state of nitrate or ammonium in the soil solution is largely affected by organicmatter transformations. For example, nitrogen is consumed by micro-organisms during thebreakdown of fresh organic material (low concentrations in soil) and released when soilorganic matter is decomposed. Acidity is released during the microbial oxidation of reducedsources of nitrogen, for example ammonium ions. High concentrations of reduced nitrogensources in irrigation water can therefore cause soil acidification.
Since nitrogen is one of the major plant nutrients, plants actively absorb nitrate andammonium ions from the soil solution, as do soil micro-organisms. Nitrate ions that remainin the soil solution can be leached by irrigation water applications, and thus may polluteground water.
Measurement The concentration of inorganic nitrogen in water is obtained by adding together theindividual concentrations of ammonia (NH + NH ), nitrite and nitrate. No single analytical4 3
technique will provide a measure of the inorganic nitrogen. Nitrite and nitrate aredetermined by the cadmium reduction method followed by diazotisation andspectrophotometry. Nitrite alone is determined by diazotisation without prior reduction.Free ammonia (the sum of NH + NH ) is determined by the phenate hypochlorite method4 3
followed by spectrophotometry or colorimetry.
Where other analytical methods are used their characteristics relative to the referencemethods should be known. Concentrations are usually expressed as mg N/R. Prior filtrationmay be required where water samples are turbid. Analysis, after the taking of the sample,should be as rapid as possible to minimise the effects of bacterial transformations and pHchanges. Water samples should preferably not be preserved with acid before analysis;rather the samples should be kept at low temperature (4 EC).
Data The nitrogen concentration of irrigation water provides an indication of: Interpretation
! The arithmetic mean concentration during the active vegetative growing season(preferably application volume weighted) which is used to determine levels at whichnitrogen needs of crops may be exceeded. It is assumed that crops are fertilizedaccording to their nitrogen requirements, and that the application of nitrogen throughirrigation water can lead to an excess of nitrogen. Provided that the nitrogenconcentrations are less than the crop's nitrogen requirement, fertilizer applications canbe adjusted to compensate for unintended applications.
! The degree to which ground water is at risk of nitrate pollution; this can be expectedwhen crops are supplied in excess of their needs, either during the active vegetativegrowing season, before, or thereafter. The arithmetic mean concentration (preferably

Agricultural Water Use: Irrigation 2nd Edition, 1996 (1st Issue) Nitrogen (Inorganic): Page 3 of 7121
application volume weighted) is used during the active vegetative growing season andthe non-vegetative growing season.
! The likelihood that nuisance growth of algae and aquatic plants will occur. Theconcentration during each irrigation release or where releases are near continuous, theaverage of weekly samples over a four-week period, should be compared with thecriteria.
Treatment It is highly unlikely that nitrate can be economically removed from water intended forOptions irrigation use. However, should this be required, nitrate is not readily removed from water
supplies. Some reduction of nitrate may be achieved using slow sand filtration, but themethod is not reliable. Biological reduction of nitrate to nitrogen gas is feasible in thepresence of a suitable carbon source. Non-specific methods of removing nitrate include:
! Passing the water stream through an ion exchange column which is selected for itsaffinity for nitrates. The method is expensive because other anions will also beremoved, depending on the nature of the resin;
! Reverse osmosis will remove nitrate effectively from water, along with highpercentages of virtually all other ions and many organic compounds.
On a large scale the processes described require competent operation, control andmaintenance.
The Effects of Nitrogen
Norms The different norms used in the guideline to assess the effects of nitrogen on irrigation wateruse are summarised below:
Irrigation water uses Norms for measuring waterquality effects
Application to commercial crops ! Crop yield as affected by cropsensitivity to uptake through roots orfoliage
! Crop quality as determined by lodgingand delayed crop maturity
Application to sustain suitability of ! Groundwater contamination as a resultirrigated soil of nitrate leaching
! No known negative effects of nitrogenon soil itself
Maintenance of irrigation equipment ! Nuisance growth of algae and aquaticplants can cause clogging of irrigationequipment
Effects Nitrogen is one of the essential macro plant nutrients and its presence in irrigation water ismostly viewed as beneficial. However, high concentrations may stimulate excessivevegetative growth and cause lodging, delayed crop maturity and poor quality (as is the casewhen too much nitrogenous fertilizer is applied). These effects are similar to excessive use

Agricultural Water Use: Irrigation 2nd Edition, 1996 (1st Issue) Nitrogen (Inorganic): Page 4 of 7122
of fertilizers.
Crop sensitivity and the need for nitrogen varies with different growth stages. High nitrogenlevels may be beneficial during early growth stages, whereas these may cause yield orquality losses during the flowering and fruiting stages. Crops that are supplied with toomuch nitrogen, or supplied with nitrogen on a continuous basis, continue to grow late intothe season at the expense of fruit production, that is, yields are often reduced, fruit may belate in maturing and have a low sugar content. Excessive vegetative growth in grain cropsproduces weak stalks that are unable to support the grain.
Ruminants are sensitive to nitrogen. Heavy nitrogen applications to pastures used aslivestock feed can cause the nitrogen to accumulate to levels that are hazardous to animals.
Sensitive crops such as grapes and most other fruit crops may be affected when totalnitrogen concentrations in irrigation water exceed 5 mg/R. Most other crops remainrelatively unaffected until nitrogen exceeds 30 mg/R. These concentrations, either nitrateor ammonium are equivalent to nitrogen applications of 50 and 300 kg/ha respectively foran irrigation application of 1 000 mm.
Nitrogen in irrigation water may stimulate the growth of algae and aquatic plants in irrigationcanals and storage dams. During optimum growth conditions of sunlight, temperature andother nutrients, rapid growth of algae may occur. This can, in turn, result in clogged valves,pipelines, sprinklers and filtering equipment. Maintenance costs are also increased whenalgae and aquatic plants need to be cleared from irrigation canals, storage dams and drainageditches.
Mitigation On-farm management options available to deal with elevated nitrogen levels in irrigationwater, are to
! reduce nitrogen fertilizer application by the amount added with irrigation water; and/or
! dilute the nitrogen-rich source if another water source is available, or to use thenitrogen-rich source only during vegetative plant growth stages when crop nitrogenrequirements are high; and/or
! switch to crops with a high nitrogen requirement; and/or
! use a water source that is low in nitrogen during periods when crop nitrogenrequirements are low;
! limit leaching as far as possible to reduce the likelihood of ground water contamination;
! control algae growth in irrigation structures chemically with copper sulphate;
! remove nuisance algae and water plants from irrigation water with screens and filters.

Agricultural Water Use: Irrigation 2nd Edition, 1996 (1st Issue) Nitrogen (Inorganic): Page 5 of 7123
Criteria Table 1: Effects of Nitrogen on Crop Yield and Quality and Ground WaterContamination
Concentration Crop Yield and Quality Ground WaterRange (mg/RR) Contamination
Target Water The unintended nitrogen The unintended nitrogen Quality Range application should, at normal application should, at
# 5 irrigation applications, be low normal irrigationenough not to affect even applications, be lowsensitive crops such as grapes enough so that most of itand most fruit trees would be utilised by the
irrigated crop and littlebe available for leachingto ground water
5 - 30 Sensitive crops increasingly Likelihood of groundlikely to be affected (depending water contaminationon magnitude of irrigation increases, depending onapplication). Other crops remain actual volume of irrigationlargely unaffected in the lower water applied and uptakeconcentration range, but are by irrigated cropincreasingly affected asconcentration increases
> 30 Most crops are affected. A Increasingly seriouslimited range of crops can utilise likelihood of ground waterthe nitrogen applied. Severe contaminationrestrictions are placed on theutilisation of these waters

Agricultural Water Use: Irrigation 2nd Edition, 1996 (1st Issue) Nitrogen (Inorganic): Page 6 of 7124
Table 2: Effects of Nitrogen on Irrigation Equipment
Concentration Effects on Irrigation Equipment Range(mg/RR)
Target Water Oligotrophic conditions. No nuisance growth of aquaticQuality Range plants or blue-green algal blooms in irrigation structures
# 0.5 (canals and storage dams)
0.5 - 2.5 Mesotrophic conditions. Occasional growth of nuisance plantsand blue-green algae in irrigation structures
2.5 - 10 Eutrophic conditions. Frequent growth of nuisance plants andblue-green algal blooms in irrigation structures, in the absenceof other limiting growth factors
> 10 Hypertrophic conditions. Almost continuous growth ofnuisance plants and blue-green algal blooms in irrigationstructures in the absence of other growth-limiting factors
Modifications ! The criteria for the nitrogen content of irrigation water are calculated to prevent theoversupply of nitrogen to crops and to protect groundwater from nitrate pollution. Bothcan be met if the nitrogen supplied through irrigation does not exceed the croprequirement. Since crops vary in their total nitrogen requirement and the growth periodduring which it is required, criteria should preferably be calculated on a site-specificbasis. The criteria presented above are for "average" conditions.
! Potted plants usually receive water applications in excess of the assumptions used toderive the criteria. Practically no leaching occurs with the result that more nitrogen willbe applied than under field conditions. This may be acceptable when lush vegetativegrowth is required, but is detrimental to flower development.
! Plant nutrients are often added to irrigation water for commercial floricultureproduction. Care should be taken to adjust the nitrogen applications based on thenitrogen content of the irrigation water.

Agricultural Water Use: Irrigation 2nd Edition, 1996 (1st Issue) Nitrogen (Inorganic): Page 7 of 7125
Sources of Information
APHA 1992. Standard Methods for the Examination of Water and Waste Water, 18thEdition. American Public Health Association, American Water Works Association, WaterEnvironment Federation. Published by the American Public Health Association,Washington DC, USA.
DEPARTMENT OF WATER AFFAIRS AND FORESTRY 1995. Draft of South AfricanWater Quality Guidelines, Volume 7: Aquatic Ecosystems.
AYERS R.S. and D.W. Westcott 1985. Water Quality for Agriculture, FAO Irrigation andDrainage Paper No. 29. FAO, Rome.
McKEE J.E. and H.W. Wolf 1963. Water Quality Criteria, 2nd Edition. California StateWater Resources Control Board, Publication No. 3-A. California.

126
Agricultural Water Use: Irrigation 2nd Edition, 1996 (1st Issue) pH: Page 1 of 4
127
pHBackground Information
Introduction The pH of a solution is the negative logarithm to the base ten of the hydrogen ionconcentration, given by the expression
pH = -log [H ]10+
where [H ] is the hydrogen ion concentration.+
At pH less than 7 water is acidic, while at pH more than 7 water is alkaline.
The pH of natural waters is a measure of the acid-base equilibrium of various dissolvedcompounds, and is a result of the carbon dioxide-bicarbonate-carbonate equilibrium whichinvolves various constituent equilibria, all of which are affected by temperature. Conditionswhich favour production of hydrogen ions result in a lowering of pH, referred to as anacidification process. Alternatively, conditions which favour neutralisation of hydrogen ionsresult in an increase in pH, referred to as an alkalinisation process. The pH of water doesnot indicate the ability to neutralise additions of acids or bases without appreciable change.This characteristic, termed buffering capacity, is controlled by the amounts of acidity andalkalinity present.
The pH of water does not have direct consequences except at extremes. The adverseeffects of pH result from the solubilisation of toxic heavy metals and the protonation ordeprotonation of other ions.
Occurrence The geology and geochemistry of the rocks and soils of a particular catchment area affectthe pH and alkalinity of the water. The pH of most raw waters lies in the range of 6.5 -8.5. Biological activities and anthropogenic sources such as nutrient cycling and industrialeffluent discharge, respectively, may give rise to pH fluctuations. Notably acid minedrainage, can have a marked effect on the pH. Further, acid-forming substances releasedinto the atmosphere such as oxides of sulphur and nitrogen may ultimately alter the acid-base equilibria in natural waters and result in a reduced acid-neutralising capacity, and hencea lowering of the pH.
Interactions The hydrogen ion concentration is probably the single most important reactant in chemicalreactions. It largely determines the solubility and availability of many plant nutrients andpotentially toxic ions. Soil is much more strongly buffered against changes in pH than iswater. Except in extreme conditions irrigation water will cause soil pH to change slowlywith time and does not present a problem in itself over the short term. Extreme pHconditions in irrigation water can be corrosive or scale-forming to some of the componentsused in irrigation equipment.
Measurement Water pH is measured electrometrically using a pH meter. The pH meter should becalibrated against standard buffer solutions of known pH, prior to measurement of asample. Fresh samples should be used to determine pH. The temperature at whichmeasurements are made should always be reported since pH measurement is influenced bytemperature.

Agricultural Water Use: Irrigation 2nd Edition, 1996 (1st Issue) pH: Page 2 of 4
128
Errors may be caused by the presence of sodium at pH values more than 10.
Data Use of single-sample (maximal or minimal) or mean values to compare with the criteriaInterpretation given, depends on application. The pH should be interpreted in relation to the full analysis
of the water sample and its use. The pH of irrigation water indicates the levels at which
! soil pH will equilibrate over the very long term. The long term mean pH (calculatedfrom the hydrogen ion concentration of individual applications of the applied irrigationwater) is used.
! leaf burn (foliar damage) of crops will occur when crop foliage is wet by irrigationwater. The maximum or minimum pH during the active growing season is used.
! irrigation equipment may be damaged by either corrosion or encrustation. These effectsare calculated with various indices; see Total Hardness. As a preliminary estimate ofthe potential to cause damage to equipment the seasonal mean pH (calculated from thehydrogen ion concentration of individual applications) is used.
Treatment Although seldom used, the pH of irrigation water can be adjusted up or down by theOptions addition of an alkali or an acid respectively.
Agricultural lime is mostly used as an alkali reagent, whereas sodium carbonate and sodiumhydroxide are mostly not used (see sodium and sodium adsorption ratio). Acidicreagents commonly used are carbon dioxide (a gas which forms carbonic acid in water),controlled burning of sulphur (which forms sulphuric acid in water) or sulphuric acid. Nitricacid and phosphoric acid are also used, in part because they are also a source of plantnutrients. The reagent is usually diluted using a dosing pump controlled by a pH monitor.
The adjustment of pH in water will inevitably increase the salinity of the water by addingions such as calcium, carbonate, hydroxyl or sulphate. Reagents should be chosen tominimise secondary effects. For certain purposes the pH of the water will need to bestabilised to within a chosen range by the addition of buffering reagents.
The handling of acids and alkalis is often hazardous requiring special precautions in theform of protective clothing and in materials used in the manufacture of the dosingequipment.
The Effects of pH
Norms The different norms used in the guideline to assess the effects of pH on irrigation water useare summarised below:
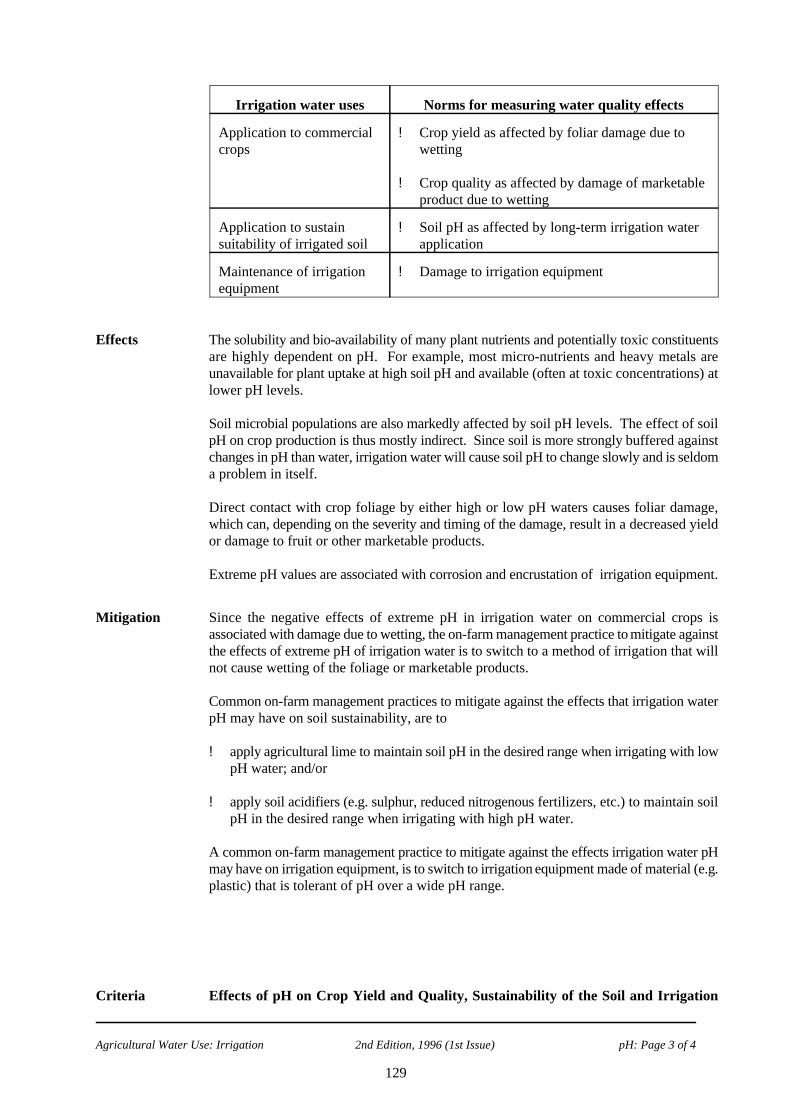
Agricultural Water Use: Irrigation 2nd Edition, 1996 (1st Issue) pH: Page 3 of 4
129
Irrigation water uses Norms for measuring water quality effects
Application to commercial ! Crop yield as affected by foliar damage due tocrops wetting
! Crop quality as affected by damage of marketableproduct due to wetting
Application to sustain ! Soil pH as affected by long-term irrigation watersuitability of irrigated soil application
Maintenance of irrigation ! Damage to irrigation equipmentequipment
Effects The solubility and bio-availability of many plant nutrients and potentially toxic constituentsare highly dependent on pH. For example, most micro-nutrients and heavy metals areunavailable for plant uptake at high soil pH and available (often at toxic concentrations) atlower pH levels.
Soil microbial populations are also markedly affected by soil pH levels. The effect of soilpH on crop production is thus mostly indirect. Since soil is more strongly buffered againstchanges in pH than water, irrigation water will cause soil pH to change slowly and is seldoma problem in itself.
Direct contact with crop foliage by either high or low pH waters causes foliar damage,which can, depending on the severity and timing of the damage, result in a decreased yieldor damage to fruit or other marketable products.
Extreme pH values are associated with corrosion and encrustation of irrigation equipment.
Mitigation Since the negative effects of extreme pH in irrigation water on commercial crops isassociated with damage due to wetting, the on-farm management practice to mitigate againstthe effects of extreme pH of irrigation water is to switch to a method of irrigation that willnot cause wetting of the foliage or marketable products.
Common on-farm management practices to mitigate against the effects that irrigation waterpH may have on soil sustainability, are to
! apply agricultural lime to maintain soil pH in the desired range when irrigating with lowpH water; and/or
! apply soil acidifiers (e.g. sulphur, reduced nitrogenous fertilizers, etc.) to maintain soilpH in the desired range when irrigating with high pH water.
A common on-farm management practice to mitigate against the effects irrigation water pHmay have on irrigation equipment, is to switch to irrigation equipment made of material (e.g.plastic) that is tolerant of pH over a wide pH range.
Criteria Effects of pH on Crop Yield and Quality, Sustainability of the Soil and Irrigation

Agricultural Water Use: Irrigation 2nd Edition, 1996 (1st Issue) pH: Page 4 of 4
130
Equipment
pH Range Crop Yield and Quality Sustainability IrrigationEquipment
< 6.5 Increasing problems with foliar damage Increasing problems Increasing problems withwhen crop foliage is wet. This could with the availability corrosion of metal andgive rise to yield reduction or a of several micro- and concrete in irrigationdecrease in the quality of marketable macro-nutrients in equipment are experienced inmaterials toxic concentrations this range
are experienced inthis range over the Practically no problemslong term experienced with clogging of
drip irrigation systems
Target Even when crop foliage is wetted, Soil pH within this Mostly no major problemWater this should not cause foliar damage range does not with either corrosion or
Quality in plants which will result in a yield present major encrustation of irrigationRange reduction or a decrease in the quality problems with either equipment is experienced
6.5 - 8.4 of marketable products. unavailability of within this range (see Totalplant nutrients or Hardness).toxic levels ofelements. Slight to moderate problems
with the clogging of dripirrigation systems.
> 8.4 Increasing problems with foliar damage Increasing problems Increasing problems withaffecting yield or decrease in visual with the unavailability encrustation of irrigation pipesquality of visual marketable products of several micro- and and clogging of drip irrigationare experienced in this range. macro-nutrients are systems are experienced in
experienced within this range.this range over thelong term.
Modifications ! The severity of effects increase as the buffering capacity of the irrigation waterincreases. Water with an extreme pH and a low TDS concentration may have minimaleffects because of the low quantity of neutralising agent it requires.
! Corrosion and encrustation are affected by several factors in addition to the pH of water(see total hardness).
Sources of Information
AYERS R.S. and D.W. Westcott 1985. Water Quality for Agriculture, FAO Irrigation andDrainage Paper No. 29. FAO, Rome.
HART B.T., C. Angehrn-Bettinazzi, I.C. Campbell and M.J. Jones 1992. Draft AustralianWater Quality Guidelines. Australian and New Zealand Environment and ConservationCouncil. January 1992.
McKEE J.E. and H.W. Wolf 1963. Water Quality Criteria, 2nd Edition. California StateWater Resources Control Board, Publication No. 3-A. California.
UNITED STATES ENVIRONMENTAL PROTECTION AGENCY 1973. ProposedCriteria for Water Quality. US EPA, Washington DC, October 1979.

Agricultural Water Use: Irrigation 2nd Edition, 1996 (1st Issue) Scaling/Corrosion: Page 1 of 6
131
Scaling/CorrosionBackground Information
Introduction The equilibrium saturation point of water for calcium carbonate, as well as for other salts,is described by various indices which provide an indication of the scale-forming or corrosivepotential of water. If the water is supersaturated it will be scale forming, whereas if it isundersaturated, it will be non-scale forming or corrosive. The Langelier index is often usedto predict the potential of an irrigation water to be either scale forming or corrosive.
Distribution and application systems represent much of the capital outlay required forirrigation farming. Maintenance and replacement of corroded or scaled-up components ofthe system may incur unnecessary costs for the irrigator. The application of appropriatewater treatment practices can minimise the adverse effects of scaling and corrosion.Ideally, water that is stable, i.e. non-corrosive and non-scaling, should be used for irrigation.
Occurrence Various indices are used to quantify the corrosivity or scaling tendency of water. TheLangelier index provides a measure with which to assess the potential of an irrigation waterto be either scale forming or corrosive, and it is calculated from the concentrations ofcalcium, alkalinity and total dissolved salts, the pH and the temperature of the water.
The corrosive/scaling properties of water can be manipulated during water treatment by theaddition of various chemicals to the water. See Modifications for other indices that areoften used to determine the scaling and corrosive potential of water.
Interactions The corrosive properties of water are influenced not only by the chemical composition ofwater, but by other determining factors such as the bacteriological activity, the presence ofelectrical fields and the conjunction of dissimilar metals.
Measurement The Langelier index (LI) is based on the calculation of the saturation pH (pH ) of water withs
respect to the calcium carbonate concentration. It is calculated as the difference betweenthe measured (or actual) pH of the water (pH ) and the hypothetical pH (pH ) of the water,a s
if it were in equilibrium with solid calcium carbonate (CaC0 ) at the actual concentrations3
of bicarbonate ions and calcium ions present:
LI = pH - pHa s
A positive Langelier index indicates scale forming, and a negative Langelier index indicatesa scale-dissolving tendency, with the possibility of corrosion. Calculation of the pH values
is derived from the pH, temperature and concentrations of the alkalinity, calcium, anddissolved salts.
The Langelier index should be calculated for the water temperature (or range oftemperatures) that is applicable to the particular site and distribution or application system.For example, the water temperature in black, slow-flowing, PVC dripper lines is muchhigher than in fast-flowing aluminium sprinkler lines.
Data The Langelier index of irrigation water provides an indication of theInterpretation
! likelihood for corrosion to occur in irrigation distribution and application systems(negative LI index values);

Agricultural Water Use: Irrigation 2nd Edition, 1996 (1st Issue) Scaling/Corrosion: Page 2 of 6
132
! likelihood for scale forming to occur in irrigation distribution and application systems(positive LI index values); and
! likelihood for irrigation distribution and application systems to be unaffected by theirrigation water quality (near-neutral LI values)
For practical purposes the arithmetic mean value of the applied water (preferably applicationvolume weighted) can mostly be used to calculate the Langelier index. Where the watershows marked variation over time it is advisable to also calculate the extreme LI values,since both corrosion and scale forming are practically irreversible.
No single test or index is infallible and it is thus desirable to apply as many of theavailable indices and tests as possible and to use the most conservative (safest) values forplanning purposes. (See Modifications).
Treatment The tendency of a water to form a scaling film or be aggressive can be reduced byOptions manipulation of the chemical composition of the water. In practice, treatment is mostly
too costly an option to overcome scale-forming or corrosive characteristics of irrigationwater. Mitigating measures are mostly preferred. However, each case has to be decidedon its own merits.
! Scaling is commonly reduced by removal of alkalinity and calcium hardness from thewater until it becomes slightly undersaturated with respect to the calcium carbonateconcentration, and consequently slightly aggressive. (Alkalinity can be reduced byadding a weak acid solution, while calcium hardness can be reduced by base exchangesoftening, which is seldom practical for irrigation applications).
! Conversely, an aggressive water, which tends to attack unprotected structures, can bestabilised by increasing the alkalinity and calcium content. Poorly-controlled additionsmay result in a scaling water.
! A water which is corrosive to metal fittings can usually be rendered less corrosive byincreasing its alkalinity and reducing the sulphate and chloride content. Alkalinityaddition is the more simple procedure since removal of sulphate and chloride wouldnecessitate using desalination techniques.
! The modifications necessary to achieve acceptably stable water may be very complexand require a high level of treatment skills and sophisticated analytical facilities. Theamount of chemicals to be added can be determined by graphical methods, usingmanual calculations, or with computer software, such as Stasoft III.
The Effects of Total Hardness
Norms The different norms used in the guideline to assess the effects of a given value of theLangelier index on irrigation water use, are summarised in the table that follows:
Irrigation Water Uses Norms for Measuring Water QualityEffects
Application to commercial crops ! No norms used
Application to maintain suitability ! No norms usedof irrigated soil

Agricultural Water Use: Irrigation 2nd Edition, 1996 (1st Issue) Scaling/Corrosion: Page 3 of 6
133
Maintenance of irrigation ! Likelihood of corrosion to irrigationequipment equipment
! Likelihood of scale forming in irrigationequipment
Effects For the irrigator, a corrosive (or aggressive) water may necessitate premature replacementof pipes, irrigation ditches and other irrigation equipment. A scaling water may result inimpaired water flow rates and blocking or partial blocking of dripper and sprinkler orifices,which may in turn result in poor water distribution and reduced yields.
A scaling water mostly presents a problem of white scale formation on leaves and fruitwhen sprinklers are used. These deposits often build up on leaves, fruit and flowers andnegatively affect the marketability of these products. No numerical criteria are provided forthese effects.
The presence of oxidised iron as a result of corrosion can give rise to a red discolourationof the water and impact negatively on the aesthetic quality of irrigated fruits. (See iron).
Mitigation Chemical Corrosion
! Chemical corrosion can be eliminated or alleviated by using corrosion-resistant coatingsor materials (e.g. PVC pipes) for all elements of the water distribution system whichcome into direct contact with the water.
! Cathodic protection may be required in some instances, for example where pipelines runclose to electrical cables, or close to electric railway lines.
! The resistance of concrete to corrosion as a result of dissolution of lime by low salinitysoft water can be greatly increased by the use of good quality concrete compared topoor quality porous concrete.
! Corrosion can be avoided by preventing different metals from having contact with oneanother in the water distribution system.
! Chemical corrosion can be reduced by limiting sulphate and chloride concentrations inthe water.
Scaling
! Scaling due to hard water may be alleviated by lowering the pH. Scale is extremelydifficult to remove and even with the use of the stabilised acid wash procedure, removalis seldom effective.
! Electromagnetic anti-scaling devices are available on the market but have not beenproven or widely accepted.
! Scaling due to increases in water temperature in the distribution system may be reducedby not irrigating in the middle of the day or, where practical, burying the distributionpipeline.
Biological Corrosion

Agricultural Water Use: Irrigation 2nd Edition, 1996 (1st Issue) Scaling/Corrosion: Page 4 of 6
134
! Biological corrosion is best prevented by commencing with a clean, sediment-freesystem that is maintained as such. Bacterial growth or other biological activity shouldbe monitored and prevented if possible.
! The organic content of the water, and especially the Assimilable Organic Carbon (AOC)content should be kept as low as possible in order to deprive micro-organisms ofnutrition. This in turn will limit the amount of post-disinfection required. However,post-disinfection using chlorination or chloramination is imperative at high AOCconcentrations and/or in distribution systems having long retention times. Re-chlorination in multiple steps may be required to ensure the presence of adequatechlorine residual in all parts of the distribution system.
Criteria Effects on Irrigation Equipment
Langelier Index Irrigation EquipmentRange
# -0.2 Increasing problems with corrosion of metal and concretein irrigation equipment
Target Water No major problem with either corrosion or scaling ofQuality Range irrigation equipment
-0.2 - +0.2
> +0.2 Increasing problems with scaling or encrustation ofirrigation pipes, drippers and other openings
Modifications Various indices are used to quantify the tendency of water to be either corrosive or scaleforming. No single test or index is infallible. It is thus advisable to apply as many of theavailable indices and tests as possible and to use the most conservative (safest) forplanning purposes. It is also advisable to obtain expert opinion. The following are themost well-known complementary scaling/corrosion indices.
! Aggressiveness index
The aggressiveness index (AI) formulated for evaluating corrosion in an asbestos cementpipe, is defined as
AI = pH + log (AH)10
where
A = total alkalinity in mg/RCaC0 , and3
H = calcium hardness as mg/R CaC03
Interpretation of the aggressiveness index is as follows
Aggressiveness Index (AI) Water Property
$ 12 Non-aggressive

Agricultural Water Use: Irrigation 2nd Edition, 1996 (1st Issue) Scaling/Corrosion: Page 5 of 6
135
10.0 - 11.9 Moderately aggressive
# 10 Highly aggressive
! Ryznar index
The Ryznar index (RI) is defined as
RI = 2pH - pHs a
where pH is the saturation pH as given by the Langelier method, and pH is the s a
actual pH.
An alternate formula for the Ryznar index is
RI = pH - 2LIa
where LI is the Langelier index.
Interpretation of the Ryznar index is as follows
Ryznar index Effect
< 6.5 Scale-forming tendency
> 6.5 Corrosive tendency
! Corrosion ratio
The corrosion ration (R) is used to estimate the corrosive tendency of chloride andsulphate ions, and is given by
R = { me/R(CI + SO ) }/ {me/R alkalinity as CaCO }- 2-4 3
A ratio below 0.1 indicates general freedom from corrosion in neutral to slightlyalkaline oxygenated waters. Higher ratios indicate a tendency towards progressivecorrosion, i.e. aggressive waters.
Sources of Information
APHA 1975. Standard Methods for the Examination of Water and Waste Water, 14thEdition. American Public Health Association, American Water Works Association,Water Pollution Control Federation. Published by the American Public Healthassociation, Washington DC, USA.
AYERS R.S. and D.W. Westcott 1985. Water Quality for Agriculture, FAO Irrigationand Drainage Paper No. 29. FAO, Rome.
DEPARTMENT OF WATER AFFAIRS AND FORESTRY 1995. Draft South AfricanWater Quality Guidelines (Second Edition), Volume 3: Industrial Water Use.

Agricultural Water Use: Irrigation 2nd Edition, 1996 (1st Issue) Scaling/Corrosion: Page 6 of 6
136
FRIEND F. and R.E. Loewenthal 1992. Stasoft III, Computer Program for ChemicalConditioning of Low and Medium Salinity Waters. Water Research Commission,Pretoria, South Africa.
SCHOCK M.R. 1984. Temperature and Ionic Strength Corrections to the LangelierIndex - Revised. JAWWA, 76 (8), 72-76.
LOEWENTHAL R.E. and G.v.R. Marais 1976. Carbonate Chemistry of AquaticSystems: Theory and Application. Ann Arbor Science Publishers, Ann Arbor, USA.
MILLETTE J.R., A.F. Hammonds, M.F. Pansing, E.C. Hansen, P.J. Clark 1980.Aggressive Water: Assessing the Extent of the Problem, JAWWA, May 1980, Corrosionand Scaling, 262-266.
Agricultural Water Use: Irrigation 2nd Edition, 1996 (1st Issue) Selenium: Page 1 of 4
137
SeleniumTentative Guideline
Background Information
Introduction Selenium is a semi-metallic element with pronounced photoconductivity. At lowconcentrations it is an essential nutritional micro-element in humans and animals, and is anintegral part of the enzyme glutathione peroxidase.
Occurrence Selenium occurs in association with sulphide ores of heavy metals such as copper, iron andzinc. Selenium forms insoluble metal selenides which tend to be incorporated intosediments, particularly under anaerobic conditions. Selenium is also bio-accumulated bycertain plants which are used as indicators in the bio-measurement of selenium. Typically,the concentration of selenium in surface water is less than 10 Fg/R. Elevated concentrationscan occur in ground waters in seleniferous areas. Selenium is used in various industrial processes, such as the manufacture of glass andceramics, ink and paint pigments, plastics, rubber, photoelectric cells and various alloys.
Interactions The chemistry of selenium is similar to that of sulphur. Selenium occurs in soilpredominantly as selenite (Se0 ) and selenate (Se0 ). Under strong oxidising conditions,3 4
2- 2-
selenate is predominant, while selenite occurs under moderately oxidising conditions.Because of the generally low anion exchange capacity of soils, selenium is similar to otheranions and is mostly very mobile in soils. In acid soils, containing high fractions of iron andaluminium oxides, selenite forms low solubility complexes with ferric and aluminiumhydroxides. In alkaline soils selenium occurs as selenate which is leachable with water.
Measurement The criteria are given in terms of total selenium concentration in units of Fg/R. Thereference method for the determination of selenium is atomic absorption spectrometry.Prior to analysis, digestion of the sample followed by reduction of Se(VI) to Se(IV) withhydrochloric acid, and the formation of selenium hydride using a borohydride reagent, isrequired. If other methods of measuring selenium are used, their characteristics relative tothe reference method should be known.
Data The arithmetic mean concentration of the applied water (preferably application volumeInterpretation weighted) is given in the criteria for:
! the selenium concentration that can be applied to any soil on a continuous basis; and
! the selenium concentration that can be applied to fine-textured soils for a period of upto 20 years at an irrigation application rate of 1 000 mm p.a.
Treatment It is highly unlikely that selenium can be economically removed from water intended forOptions irrigation purposes. However, should it be required, selenium is most effectively removed
by one of the two processes:
! Coagulation and precipitation by treatment with lime or ferric chloride at pH valuesmore than 8.5. Careful monitoring is needed to ensure effective removal.

Agricultural Water Use: Irrigation 2nd Edition, 1996 (1st Issue) Selenium: Page 2 of 4
138
! Adsorption on to activated alumina at low pH levels.
The processes involved require skilled operation and process control. Both processesproduce a waste stream that may be rich in selenium, presenting disposal difficulties.
The Effects of Selenium
Norms The different norms used in the guideline to assess the effects of selenium on irrigationwater use are summarised below:
Irrigation water uses Norms for measuring waterquality effects
Application to commercial crops ! Crop quality as determined by seleniumtoxicity to consumers
Application to sustain suitability ! Accumulation in soil to concentration whereof irrigated soil crop quality is affected
Maintenance of irrigation ! No known effectsequipment
Effects Plants take up relatively large amounts of selenium without apparent adverse effects. Ofmore concern is the toxicity of selenium to animals eating plants containing too muchselenium. Selenium is required in small quantities by livestock. Selenium concentrationsof around 0.03 - 0.10 mg/kg in forage are required by cattle to prevent deficiencies. On theother hand, concentrations more than 3 - 4 mg/kg are considered toxic. This level ofselenium may be absorbed by many plants from a solution containing 0.05 mg/R selenium.In most fruit and annual crops, selenium accumulation is generally restricted to the leaves.
Mitigation Common on-farm management practices to mitigate against selenium uptake by plants onirrigated land, are to
! leach excess selenium from the soil when selenium is in the selenate form; and/or
! apply sulphate to the soil to inhibit uptake of selenium; and/or
! switch to a crop that is less absorbent of selenium.

Agricultural Water Use: Irrigation 2nd Edition, 1996 (1st Issue) Selenium: Page 3 of 4
139
Criteria Effects of Selenium on Crop Quality
Concentration Crop QualityRange (mg/RR)
Target Water The threshold concentration that can be used over theQuality Range long term, and which does not result in the
# 0.02 accumulation of selenium in plants to concentrationsthat are toxic to animals
0.02 - 0.05 Maximum concentration range, acceptable for fine-textured soils
> 0.05 Acceptable for irrigation only over the short term on asite-specific basis
Note:
! The TWQR for relatively unrestricted use on all soils and the concentrationrange for fine-textured neutral to alkaline soils for irrigation periods of up to20 years, are similar to most international criteria.
! The above criteria are based on relatively limited information and should beviewed as tentative.
! The criteria are calculated to ensure soil sustainability for continued cropproduction.
Modifications ! Commercial floricultural crops grown in greenhouses are mostly not fed to animals.They could thus tolerate higher levels than given in the criteria.
! Should the site-specific conditions vary significantly from the assumptions that wereused to derive the criteria, the values may need adjustment.
! Potted plants normally receive water applications in excess of the assumptions used toderive the criteria. Since potted plants are only grown for limited periods, the criteriaapplicable to fine-textured soils can mostly be used.
Sources of Information
APHA 1989. Standard Methods for the Examination of Water and Waste Water, 17thEdition. American Public Health Association, American Water Works Association, WaterPollution Control Federation. Published by the American Public Health Association,Washington DC, USA.
AYERS R.S. and D.W. Westcott 1985. Water Quality for Agriculture, FAO Irrigation andDrainage Paper No. 29. FAO, Rome.
BOWEN H.J.M. 1979. Environmental Chemistry of the Elements. Academic Press,London.
CANADIAN GUIDELINES 1987. Canadian Water Quality Guidelines. Prepared by the

Agricultural Water Use: Irrigation 2nd Edition, 1996 (1st Issue) Selenium: Page 4 of 4
140
Task Force on Water Quality Guidelines of the Canadian Council of Resource andEnvironment Ministers. Canada.
DEPARTMENT OF WATER AFFAIRS AND FORESTRY 1993. South African WaterQuality Guidelines, Volume 4: Agricultural Use.
DEVEREL S.J. and R. Fujii 1990. Chemistry of Trace Elements in Soils and GroundWater: Agricultural Salinity Assessment and Management, K.K. Tanjii (Ed.). ASCEManuals and Reprints on Engineering Practice No. 71. ASCE New York 1990.
HART B.T. 1974. A Compilation of Australian Water Quality Criteria. AWRCTechnical Paper No. 7.
HART B.T., C. Angehrn-Bettinazzi, I.C. Campbell and M.J. Jones 1992. Draft AustralianWater Quality Guidelines. Australian and New Zealand Environment and ConservationCouncil. January 1992.
McKEE J.E. and H.W. Wolf 1963. Water Quality Criteria, 2nd Edition. California StateWater Resources Control Board, Publication No. 3-A. California.
PAGE A.L. and A.C. Chang 1990. Deficiencies and Toxicities of Trace Elements. In:Agricultural Salinity Assessment and Management, K.K. Tanjii (Ed.). ASCE Manuals andReprints on Engineering Practice No. 71. ASCE New York 1990.
PRATT P.F. and D.L. Saurez 1990. Irrigation Water Quality Assessments. In:Agricultural Salinity Assessment and Management, K.K. Tanjii (Ed.). ASCE Manuals andReports on Engineering Practice No. 71. ASCE New York 1990.
UNDERWOOD E.J. 1977. Trace Elements in Human and Animal Nutrition, 4th Edition.Academic Press, New York, USA.
UNITED STATES ENVIRONMENTAL PROTECTION AGENCY 1973. ProposedCriteria for Water Quality. US EPA, Washington DC, October 1979.
WEAST R.C. 1979. CRC Handbook of Chemistry and Physics, 60th Edition. CRC PressInc., Boca Raton, Florida, USA.
WHO 1984. Guidelines for Drinking Water Quality, Volume 2: Health Criteria and OtherSupporting Information. World Health Organization, Geneva.

Agricultural Water Use: Irrigation 2nd Edition, 1996 (1st Issue) Sodium Adsorption Rate: Page 1 of 13
141
Sodium Adsorption RatioBackground Information
Introduction The sodium adsorption ratio (SAR) is an index of the potential of a given irrigation waterto induce sodic soil conditions. (Soil sodicity is usually measured by the percentage of asoil's cation exchange capacity that is occupied by sodium ions). It is calculated from theconcentrations of sodium, calcium and magnesium in water, and gives an indication of thelevel at which the exchangeable sodium percentage (ESP) of the soil will stabilise afterprolonged irrigation.
In addition to irrigation water, SAR is also determined on the saturated soil extract. In thiscase, the SAR gives an indication of the ESP of the soil, and the two values areapproximately equal.
Occurrence The SAR is an index of the potential of water to induce sodic soil conditions, and iscalculated from the sodium, calcium and magnesium concentrations in the water.
Interactions Over the long-term (i.e. under conditions of chemical equilibrium) the SAR of an irrigationwater determines the ESP of the irrigated soil. Since the quantity of cations in irrigationwater is normally small, compared to those adsorbed on a soil's cation exchange complex,the ESP over the depth of a soil profile only changes slowly towards that applied byirrigation water SAR. Several years to decades may be required before steady stateconditions are established throughout the soil profile.
Changes to the ESP start in the topsoil and move progressively down to lower layers,therefore short-term variations in irrigation water SAR affects the soil profile ESP onlymarginally, but largely determines the ESP at the soil surface.
The SAR of an irrigation water increases in soil when its sodium, calcium and magnesiumcontent increases together with that of other ions when water is lost throughevapotranspiration. This gives rise to a progressive increase in soil ESP from the top to thebottom soil layers in tandem with the increasing salt concentration from top to bottom. Bydecreasing the leaching fraction both the salt concentration and ESP in the bottom soillayers are thus increased, and vice versa.
Since the sodium concentration of water is a common factor for both the SAR and the totalsalt content) is often found to increase with increasing salt content (EC), the SAR tends toincrease with increasing EC. The EC also indirectly determines how soon the soil ESP willreach equilibrium conditions with the irrigation water SAR. The higher the irrigation waterEC at a particular SAR, the sooner equilibrium ESP conditions will be established.
It has been found that irrigation water with high bicarbonate/carbonate concentrations givesrise to the precipitation of calcium as calcium carbonate (in soil). This causes the soilsolution to become relatively enriched with sodium and, consequently, results in an effectiveincrease in the SAR and the ESP. In order to compensate for this effect, a revisedprocedure for calculating SAR (the adjusted SAR) is used. The adjusted SAR values arehigher for waters with appreciable bicarbonate concentrations and this has become apopular index for calculating the "effective" SAR.
In practice it has, however, been found to over-predict the sodicity hazard, and for this

Agricultural Water Use: Irrigation 2nd Edition, 1996 (1st Issue) Sodium Adsorption Rate: Page 2 of 13
142
reason has not been used in this guideline.
The presence of lime and other calcium sources in soil has an effect on the SAR of the soilsolution. The effective SAR in the soil solution is reduced by such calcium sources. Acalculating procedure to compensate for both this phenomenon and the increase in SAR asa result of lime precipitation from solution is recommended. It is termed the adjustedsodium ratio (adj. RNa) and is an improved index of the soil ESP that would be induced byirrigation water sodicity and can be used instead of SAR. Since SAR and adj. RNa valuesare normally given within 10 % of each other and adj. RNa requires a more elaboratecalculating procedure, SAR is used in these guidelines.
Measurement SAR is calculated from the total concentrations of sodium, calcium and magnesium inirrigation water by using the following formula.
SAR = [sodium]/([calcium] + [magnesium])0.5
where the concentrations of sodium, calcium and magnesium in solution aremeasured in mmol/R of sodium, calcium and magnesium in solution. The units inwhich SAR is measured are thus (mmol/R) . However, SAR values are mostly0.5
reported without units.
The SAR is used in preference to the adjusted SAR since it was found that the latter over-predicts the sodicity hazard.
For specific applications such as advanced water quality evaluation procedures which utilisechemical speciation models, the SAR is calculated using the "active" ion concentrationswhich exclude ion pairs.
Data The SAR of irrigation water provides an indication of the soil ESP that can be expected toInterpretation develop in soil, once chemical equilibrium has been established.
The SAR is numerically approximately equal to the ESP which is established in the soilunder equilibrium conditions. A relationship between ESP and SAR, with ESPapproximately equal to 1.475 SAR/(1 + 0.0147 SAR), has been derived by the UnitedStates Salinity Laboratory from a dataset for soils in the western USA. It is often usedlocally to calculate the approximate ESP of a soil under equilibrium conditions with a givenirrigation water SAR. However, soils vary significantly in their relationship between ESPand SAR and further investigation is therefore required for site-specific applications.
Since the ESP of the soil profile is well buffered against change (see Interactions), plant andsoil reactions that are determined by soil profile ESP are not affected by short- termvariations in irrigation water SAR. These reactions can be predicted best by the mean SARof the applied water. The mean SAR of water during the irrigation season (applicationvolume weighted where possible) should therefore be used for the following plant and soilreactions:
! The degree to which the growth of sodium sensitive plants is affected by root uptakeof sodium.
! The development of sodium-induced hardsetting in soils.
! The degree to which hydraulic conductivity in the soil profile will be reduced at a given

Agricultural Water Use: Irrigation 2nd Edition, 1996 (1st Issue) Sodium Adsorption Rate: Page 3 of 13
143
EC of the soil water.
Since the ESP at the soil surface (where "surface sealing" can develop) is mostly affectedby the SAR of the most recent irrigation application (see Interactions), the maximumirrigation water SAR during the irrigation season is used to estimate
! the ESP-determined potential for the development of infiltration rate reducing surfaceseals.
Treatment The SAR presents problems (and the need for treatment) only when its value is high. TheOptions SAR of a water can be reduced either by decreasing the sodium concentration or by
increasing the calcium and/or magnesium concentrations. Sodium can be removed fromwater only by highly sophisticated physico-chemical separation techniques. Because of thehigh cost involved, the option of sodium removal is ruled out as uneconomic. The calciumand/or magnesium concentrations can be increased cost-effectively by the addition ofcalcium and/or magnesium salts to the irrigation water.
Any relatively soluble salt of calcium or magnesium can be added to irrigation water todecrease its SAR. In practice agricultural gypsum (CaSO 2H O) is most often used.4 2
.
Certain practical implications need to be considered:
! The addition of salt gives rise to an increase of the salt content of the water, which haspotentially negative effects. See TDS.
! The complementary anions can have negative effects on crop response. For this reasonthe use of sulphate (which is not considered to be a potentially toxic ion) rather thanchlorides (although more soluble) are usually recommended. (Chlorides are also moreexpensive).
! Plant nutritional imbalances can be introduced when large quantities of either calciumor magnesium are added to the soil.
! Impurities in the added salt (e.g. fluorides in some gypsum sources) can induce negativeeffects.
! Although reasonably soluble, agricultural gypsum has a limited solubility and specialequipment is often required to ensure complete dissolution, such that it does not remainin particulate form; this can lead to the clogging of some irrigation equipment.
Several management alternatives, that can be applied at the point of use, to offset thenegative effects of high sodium and SAR are available.

Agricultural Water Use: Irrigation 2nd Edition, 1996 (1st Issue) Sodium Adsorption Rate: Page 4 of 13
144
The Effects of the Sodium Adsorption Ratio
Norms The different norms used in the guideline to assess the effects of SAR on irrigation wateruse are summarised below:
Irrigation Water Uses Norms for Measuring WaterQuality Effects
Application to ! Crop yield as affected by crop sensitivity tocommercial crops sodium uptake through plant roots
! Crop quality as determined by damage tomarketed product or by regulatory limits on thesodium concentration in the final product
Application to sustain ! Infiltration rate (because of surface sealing) ofsuitability of irrigated soil soils varying in sensitivity as affected by
increasing SAR
! Reduction in hydraulic conductivity of soil
! Hardsetting of soils which affect, inter alia,cultivation
Maintenance of irrigation ! No known effectsequipment
Note :
Almost all available information on the effects of SAR when used for irrigation are on theeffects on crop yield and water penetration (infiltration rate and hydraulic conductivity) intosoil. Less information is available on hardsetting and practically no reliable information isavailable to link the SAR of irrigation water to crop quality.
Effects By irrigation with sodium-rich water, soil sodicity is induced. Negative effects associatedwith sodium affected soils, include
! reduced crop yield and quality as a result of sodium uptake through the roots of sodiumsensitive plants;
! impaired soil physical conditions, as manifested by reduced soil permeability (infiltrationrate and hydraulic conductivity) and an increased tendency for hardsetting; and
! reduced crop yield and quality.
The uptake of sodium by plant roots can result in the accumulation of sodium to levelsthat are toxic to plant growth, and may be the cause of reduced yield or impaired cropquality. The sodium concentration in the soil water (that which is taken up by plants)is determined by both the mean soil ESP in the root zone and the total saltconcentration of the soil water. The higher the total salt concentration and/or the soilESP, the higher the sodium concentration.
Typical symptoms of plants experiencing sodium toxicity are leaf burn, scorch, and

Agricultural Water Use: Irrigation 2nd Edition, 1996 (1st Issue) Sodium Adsorption Rate: Page 5 of 13
145
dead tissue along the outside edges of leaves. Symptoms appear first on older leaves,starting at the outer edges and, as severity increases, move progressively inwardsbetween the veins towards the leaf centre.
Most experiments to determine the uptake of sodium at toxic levels by plant roots linksodium levels to the soil ESP. The criteria in this guideline are based on the results ofthese experiments. There are, however, indications that the nutritional effects ofsodium in the soil are determined to a greater extent by the absolute sodium, calciumand magnesium concentrations in the soil solution rather than by ESP.
The toxic effects of absorption of sodium by plant foliage (see sodium) and root uptakeof sodium are cumulative.
! Crop quality
Crop quality is affected by sodium-induced leaf injury in plants of which leaves are themarketed product, or where fruit size and appearance are affected by sodium-inducedyield decreases. These aspects of crop quality are covered (to the extent thatinformation is available) by the criteria for yield decreases and foliar damage as a resultof sodium absorption through plant roots.
Crop quality is also affected by restrictions by users or regulating authorities on thesodium content of the final product. In South Africa the sodium content of wine isrestricted to 100 mg/R.
! Soil physical conditions
The most prominent impairment to soil physical conditions under irrigation is reducedsoil permeability which may, in turn, result in the soil not being able to absorbsufficient water to supply the crop water requirement. A reduction in soil permeabilitycan be the result of a reduction in either infiltration rate or hydraulic conductivity. Itcould also be a combination of both. Both are reduced by increasing soil ESP.
Another impairment of soil physical conditions related to elevated ESP is the physicaldeterioration of primarily the ploughed layer of the soil profile. It is manifested by soilhardsetting which manifests as difficult cultivation conditions and poor tilth (slipperywhen wet and hard clods when dry).
Both soil permeability and hardsetting are determined by soil properties such as potentialdenseness of packing of soil particles as predetermined by their size distribution (i.e. soiltexture), by the swell-shrink properties of the clay minerals, and by the soil ESP.
The degree to which the potential denseness of packing is realised, is determined by thedegree to which the factors promoting the breakdown of the existing structure arecounteracted by those soil properties that stabilise the existing structure. The soilorganic matter and sesquioxic content are properties that act to stabilise the existing soilstructure. The breakdown of the existing structure is promoted by a decrease in soilorganic matter, by an increase in ESP, and by mechanical destruction such as,ploughing and compaction by wheel traffic. Inherent soil properties therefore largelydetermine the permeability and hardsetting characteristics of a soil.
Soils with a low organic matter content with a large percentage silt and/or fine sand canbe expected to be more prone to permeability and hardsetting problems than eithersandy or loamy soil with a high organic matter content.

Agricultural Water Use: Irrigation 2nd Edition, 1996 (1st Issue) Sodium Adsorption Rate: Page 6 of 13
146
Under irrigation the inherent permeability and hardsetting characteristics of a soil aremodified by the SAR and EC of the irrigation water. Increasing soil ESP (irrigationwater SAR) gives rise to increasing swelling and dispersion of clay minerals, whichdestabilise soil structure. High salt concentrations in the soil solution, on the other hand,counteract swelling and dispersion.
The infiltration rate of soils is affected by both soil ESP and the EC of the infiltratingwater. The infiltration rate, is therefore, much more susceptible to soil sodicity underrainfall conditions, than where only irrigation water (with a higher EC) is applied. Soilssensitive to sodium have been found to form surface seals or crusts and experience asignificant reduction in infiltration rate even at low ESP values, when exposed to thecombined effects of low salinity rain water, and the disruptive mechanical effect offalling rain drops. (Moderate EC levels in infiltrating water offset this effect and help toprevent the formation of infiltration rate-reducing surface seals). These surface sealsare much less permeable than the underlying undisturbed soil.
For most of the summer rainfall areas of South Africa, it rains during the irrigationperiod. This is different from the situation in the western USA and Israel, where mostof the published criteria originate from. The potential for the formation of surface sealsis higher under South African conditions. This is reflected by more conservative criteriaaimed at preventing surface seal formation.
The effect of SAR on infiltration rate is mainly a soil surface phenomenon. Dependingon the concentration of the SAR constituents in the water and the soil bufferingcapacity, the ESP of the soil surface may often be determined by the SAR of the lastirrigation. The risk of SAR-induced infiltration rate reduction, is therefore related tothe maximum, rather than the mean, SAR.
Hydraulic conductivity determinations approximate the permeability of subsurface soilhorizons. Because the disruptive effect of falling drops does not operate below surface,reductions in hydraulic conductivity are usually much less with the same combinationof ESP and water EC, than for the infiltration rate. Reduced hydraulic conductivitypresents problems in irrigated agriculture when it manifests itself as a reduction inhydraulic conductivity to below a critical value in one or more layers of an irrigatedsoil. Such a reduction gives rise to a decrease in the flow of irrigated water down a soilprofile, and reaches critical values if it results in the establishment of a temporary orpermanent water table, a decrease in the volume of soil available for root development,and/or the development of anaerobic conditions which are unfavourable for rootdevelopment and metabolism.
Since hydraulic conductivity, as used in these guidelines, refers to reduced soilpermeability within the soil profile, where ESP is fairly well buffered against rapidchange, the risk of SAR-induced hydraulic conductivity changes is related to the long-term mean SAR during the irrigation season (preferably weighted by the irrigationvolume). It is not affected by short-term variations in SAR.
Hardsetting of a cultivated soil involves slumping, a process of compaction that occurswithout the application of an external load. Hardsetting involves the collapse of theaggregated structure during and after wetting, and a hardening without restructuringduring drying.
Hardsetting is common in soils prone to dispersion and, therefore very sensitive to theelectrolyte concentration of the soil solution. The potential for dispersion is enhancedwhere irrigation periodically supplements rainfall, or vice versa. The potential for

Agricultural Water Use: Irrigation 2nd Edition, 1996 (1st Issue) Sodium Adsorption Rate: Page 7 of 13
147
dispersion is further enhanced when sensitive soils are cultivated under wet conditionsand low EC of the soil water. A soil need not have a high ESP for dispersion to occur.Soils with an SAR of less than three are found to disperse when a mechanical stress isapplied.
Hardsetting was, up to now, only superficially investigated under South Africanconditions. Previous research dealt with crust strength (modulus of rupture)measurements as affected by inter alia ESP, and on soil compaction as a result ofwheel traffic. Of these, only the research on modulus of rupture is applicable.
The effect of SAR on hardsetting is manifested mostly in the upper part of the soilprofile. Because of the soil buffering capacity, the SAR-induced changes in soil ESPoccur gradually with time. The risk of SAR-induced hardsetting is therefore related tothe long-term mean SAR value during the irrigation season (preferably weighted by theirrigation volume). It is not significantly affected by short time variations in SAR.
! Guideline implications
The TWQR for the SAR, which aims to prevent surface sealing-induced reductions ininfiltration rate, is lower than that for plant toxicity by root uptake, hydraulicconductivity and hardsetting. The SAR criteria for the latter three effects will only beused where the site-specific criteria to prevent surface sealing are higher.
Mitigation Common on-farm management practices to mitigate against the negative effects of anincreasing SAR of water affecting crop yield and quality are to
! accept a reduced crop yield or quality; and/or
! switch to crops that are more tolerant; and/or
! increase the leaching fraction; and/or
! ameliorate the water and/or soil with plant nutrients such as calcium, magnesium andpotassium to overcome plant nutritional imbalances induced by the excess sodiumassociated with a high SAR.
Reductions in infiltration rate as a result of surface sealing which develops under theimpact of rain drops, can be reduced by
! surface applications of easily dissolvable gypsum to increase the salt content ofinfiltrating water (especially rain water); and/or
! a surface mulch which reduces drop impact energy; and/or
! the application of huge quantities of organic matter; and/or
! soil stabilisers which can be applied on their own or in combination with each other andeasily dissolvable gypsum.
Hardsetting and reduced soil hydraulic conductivity can be counteracted by
! gypsum applications designed to reduce soil ESP to acceptable levels by mixing it to thedesired depth with the affected soil (gypsum applications also increase the EC of the soilsolution); and/or

Agricultural Water Use: Irrigation 2nd Edition, 1996 (1st Issue) Sodium Adsorption Rate: Page 8 of 13
148
! the application of huge quantities of organic matter; and/or
! increasing the irrigation water salinity (TDS/EC) without increasing its SAR. This mayhave other negative effects (see TDS); and/or
! increasing the leaching fraction to enhance the ESP of the bottom soil layers;
! refraining from cultivation when the soil is wet, thereby reducing the likelihood offurther hardsetting.
Criteria Table 1: Effects of the SAR on Crop Yield and Quality
SAR Range Crop Yield and Quality
Target Water Should prevent sodium toxicity from developing in plantsQuality Range sensitive to sodium, provided that irrigation water is applied
# 2.0 to the soil surface (that is, crop foliage is not wetted),limiting sodium uptake to that through the roots
2.0 - 8.0 The most sodium-sensitive crops absorb toxic levels of sodiumthrough roots (that is, crop foliage is not wetted). Crops vary insensitivity
8.0 - 15.0 Sodium-sensitive crops absorb toxic concentrations of sodiumthrough roots (that is, if crop foliage is not wetted). Crops varyin sensitivity
> 15.0 All sodium-sensitive crops absorb toxic levels of sodiumthrough root uptake (that is, crop foliage is not wetted). Cropsthat are more tolerant of sodium increasingly absorb toxicconcentrations of sodium through root uptake. A number ofeconomically important crops can be irrigated withoutdeveloping sodium toxicity

Agricultural Water Use: Irrigation 2nd Edition, 1996 (1st Issue) Sodium Adsorption Rate: Page 9 of 13
149
Table 2 : Effects of the SAR on Soil Physical Conditions
SAR Range Infiltration Rate Hydraulic Conductivity andHardsetting
Target Water Should ensure an adequate infiltration rate for soils No significant reduction in hydraulic conductivity below Quality Range sensitive to the formation of infiltration rate-
# 1.5 reducing surface seals under conditions of rainfallduring the irrigation season or irrigation withwater having an EC < 20 mS/m
inherent soil hydraulic conductivity expected in this SARrange for any soil; no hardsetting above inherenthardsetting expected in any soil in this SAR range
1.5 - 3.0 Infiltration problems likely to occur in soils sensitive No significant reduction in hydraulic conductivity belowto the formation of infiltration rate-reducing surface inherent soil hydraulic conductivity expected in this SARseals under conditions of rainfall during the irrigation range for any soil; no hardsetting above inherent hardsettingseason or irrigation with water having an EC < 20 expected in any soil in this SAR rangemS/m; no problem is expected with irrigation watershaving on EC > 90 mS/m and slight to moderateproblems at ECs in the range of 20 - 90 mS/m
3.0 - 6.0 Infiltration problems likely to occur in soils sensitive Hydraulic conductivity reduction likely to occur in soilsto the formation of infiltration rate-reducing surface sensitive to hydraulic conductivity reduction. A low EC in theseals when irrigated with water having an EC < 25 soil solution may cause hydraulic conductivity to bemS/m; no problem is expected with irrigation waters irreversibly reduced by up to 25 % for sensitive soils;having an EC > 130 mS/m and slight to moderate Hardsetting increasingly likely to occur in sensitive soils atproblems at ECs in the range of 25 - 130 mS/m ECs < 6O mSg/m for SAR = 3 and < 120 mS/m for SAR = 6
6.0 - 12.0 Infiltration problems likely to occur in soils sensitive Hydraulic conductivity reduction likely to occur in soilsto the formation of infiltration rate-reducing surface sensitive to hydraulic conductivity reduction. A low EC in theseals when irrigated with water having an EC < 35 soil solution may cause hydraulic conductivity to bemS/m; no problem is expected with irrigation waters irreversibly reduced by > 25 % for sensitive soils and < 25 %having an EC > 200 mS/m and slight to moderate in less sensitive soils, depending on the particle sizeproblems at ECs in the range of 35 - 200 mS/m distribution of the soil and the type of clay mineral present in
the clay size fraction. Tolerant soils will show little or noeffect
Small and reversible changes in hydraulics occur in sensitivesoils when EC is in the range of 100 - 200 mS/m; Hardsettinglikely to occur in sensitive soils at ECs < 120 mS/m for SAR =6 and < 240 mS/m for SAR = 12
12.0 - 20.0 Infiltration problems likely to occur in soils sensitive Hydraulic conductivity reduction likely to occur in soilsto the formation of infiltration rate- reducing surface sensitive to hydraulic conductivity reduction. A low EC in theseals when irrigated with water having an EC < 90 soil solution may cause hydraulic conductivity to bemS/m; no problem is expected with irrigation waters irreversibly reduced by > 25 % for sensitive soils and having an EC > 310 mS/m and slight to moderate < 25 % in less sensitive soils, depending on the particle sizeproblems at ECs in the range of 90 - 310 mS/m distribution of the soil and the type of clay mineral present in
the clay size fraction. Tolerant soils will show little or noeffect
Small and reversible changes in hydraulics occur in sensitivesoils when EC is in the range of 100 - 200 mS/m; Hardsettinglikely to occur in sensitive soils at ECs < 240 mS/m for SAR = 12 and < 400 mS/m for SAR = 20
> 20 Infiltration problems likely to occur in soils sensitive Hydraulic conductivity reduction likely to occur in soilsto the formation of infiltration rate-reducing surface sensitive to hydraulic conductivity reduction. A low EC in theseals when irrigated with water having an EC < 180 soil solution may cause hydraulic conductivity to bemS/m; no problem is expected with irrigation waters irreversibly reduced by > 25 % for sensitive soils and having an EC > 560 mS/m and slight to moderate < 25 % in less sensitive soils, depending on the particle sizeproblems at ECs in the range pf 180 - 560 mS/m distribution of the soil and the type of clay mineral present in
the clay size fraction. Tolerant soils will show little or noeffect Small and reversible changes in hydraulics occur in sensitivesoils when EC is in the range of 100 - 200 mS/m.

Agricultural Water Use: Irrigation 2nd Edition, 1996 (1st Issue) Sodium Adsorption Rate: Page 10 of 13
150
Modifications A slightly improved index of the SAR in the soil solution can be obtained by calculating theadj. RNa or by using a computer programme to simulate the chemical equilibria.
Reduced crop yield and quality
! It should be noted that absorption of sodium by plant roots (described in this guideline)and absorption by crop foliage (see sodium) are additive to one another. The mostrestrictive guideline value should therefore be used when crop foliage is wetted(sprinkler irrigation).
! There is uncertainty whether SAR is the most appropriate index for the assessment ofthe sodium sensitivity of crops. However, the sodium concentration in the soil solutionis largely determined by (and is in dynamic equilibrium with) soil ESP and the total saltcontent of the soil solution of which SAR is an index.
! Frequent water application in quantities exceeding that applied for commercial cropscause the soil in containers and under intensive cultivation for floricultural productionto equilibrate faster with the SAR of applied irrigation waters than under commercialcrops. The effects of SAR-induced reduction in crop yield and quality can thus beexpected to become visible sooner than under commercial cropping practices.
! See Table 3 for a grouping of crops according to their relative sensitivity to ESP. TheSAR of irrigation water provides a reasonable estimate of soil ESP after long-termirrigation.
Table 3: Relative Tolerance of Crops to ESP
ESP Range
2 - 15 % 15 - 40 % > 40 %
Avocado Carrot Lucerne Deciduous Fruits Clover, Landino Barley Grapes Dallisgrass Beet, garden Nuts Fescue, tall Beet, sugar Beans (green) Lettuce Bermuda grass Cotton (at germination) Sugarcane Cotton Maize Berseem Paragrass Peas Benji Rhodes grass Grapefruit Raya Wheatgrass, crested Orange Oat Wheatgrass, fairway Peach Onion Wheatgrass, tall Tangerine Radish Karnal grass Mungbean Rice Mashbean Rye Lentil Ryegrass, Italian Groundnut Sorghum Gram Spinach Cowpeas Tomato
Vetch Wheat
Note :
Tolerance decrease in each column from top to bottom
The tolerances which are listed are relative. Nutritional factors and adverse physical

Agricultural Water Use: Irrigation 2nd Edition, 1996 (1st Issue) Sodium Adsorption Rate: Page 11 of 13
151
conditions usually stunt growth before the higher levels are reached. (In most cases thesetolerances were established by first stabilising soil structure).
Soil physical conditions
! Because soils are generally well buffered against changes in ESP when irrigated withwater having a different SAR value, the effects mentioned in the criteria will not bevisible immediately after SAR changes are introduced.
! Frequent water application in quantities exceeding that applied for commercial cropscauses the soil in containers and under intensive cultivation for floricultural productionto equilibrate faster with the SAR of applied irrigation waters than under commercialcrops. The effects of SAR-induced reduction in soil physical conditions can thus beexpected to become visible sooner than under commercial cropping practices.
! See Table 4 for a list of soil types classified according to their sensitivity to soil physicaldeterioration as determined by ESP - EC interactions.
Table 4 : The Susceptibility of South African Soil Types to Physical Deteriorationdue to ESP - EC Interactions
Soil PhysicalReaction
Sensitivity of Different Soil Types*
Sensitive Medium Tolerant
Infiltration rate G I E B D A J C F H
Hydraulic conductivity G F E I B J A C H
Hardsetting E G J I A B C D F H
Note :
* Symbols refer to soil descriptions in table below
Several factors affect soil susceptibility to physical deterioration. The information givenin Table 4 provides general guidance on how different soil types can be expected to react.The grouping of soil types into different classes requires modification as a result ofdifference in rainfall (degree of soil weathering) and parent material, e.g. the Oakleaf (J)soils of the Western Cape are mostly leached of stabilising sequioxides and thus highlysensitive to infiltration. Furthermore it is often difficult to decide where to group a soiltype. Cracking clay soils (F) is classed as tolerant to infiltration because their deepvertical cracks (when dry) allow for the infiltration of large volumes of water. However,when they are already wet, water intake is slow, with a sensitive rate for hydraulicconductivity.
Expert opinion should be sought when critical decisions about soil physical reaction toESP - EC interactions need to be made.
Soil Generic description Typical South AfricanType Soil Forms

Agricultural Water Use: Irrigation 2nd Edition, 1996 (1st Issue) Sodium Adsorption Rate: Page 12 of 13
152
A. Freely drained, structureless and red- Hutton, Clovelly,structured soils excluding those Shortlandcontaining sand and loamy sand textures
B. Red and yellow structureless soil with Avalon, Glencoe,imperfectly drained plinthic horizons Bainsvlei, Pinedeneexcluding sand textures
C. Exclusively drained soils (sandy) Shepstone, Lamotte,Fernwood, Dundee
D. Clay soils, usually dark, often swelling Bonheim, Inhoek,Tambankul, Arcadia
E. Soils with a blocky structured horizon Vals River, Swartland
F. Clay soils, often dark, imperfectly Rensburg, Willowbrookdrained
G. Texture contrast soils with sandy topsoil Estcourt, Sterkspruit,overlaying structured clay horizon Poorly Kroonstaddrained
H. Soils with a humic topsoil containing Kranskop, Magwa,> 2 % organic carbon Inanda
I. Poorly drained soils. Shallow with a Westleigh, Cartref,plinthic horizon especially those Longlands, Wasbank,containing high silt and sand fractions Katspruit
J. Weakly structured soils, somewhat Oakleaf, Vilafontepoorly drained

Agricultural Water Use: Irrigation 2nd Edition, 1996 (1st Issue) Sodium Adsorption Rate: Page 13 of 13
153
Sources of Information
AYERS R.S. and D.W. Westcott 1985. Water Quality for Agriculture, FAO Irrigation andDrainage Paper No. 29. FAO, Rome.
BLOEM A.A., M.C. Laker, L.F. La Grange and C.J. Smit 1991. Kriteria vir dieaanpassing van die ontwerp en bestuur van oorhoofse besproeiingstelsels by dieinfiltreerbaarheid van grond. WRC Report No. 208/1/91.
DEPARTMENT OF WATER AFFAIRS AND FORESTRY 1993. Volume 1: 1st Edition:Domestic Use. South African Water Quality Guidelines, The Government Printer,Pretoria, South Africa.
DU PLESSES H.M. and I Shainberg 1985. Effect of exchangeable sodium andphosphogypsum on the hydraulic properties of several South African soils. S.Afr. J. PlantSoil, 2, 179 186.
KEREN R. and S. Miyamoto 1990. Reclamation of Saline, Sodic and Boron-affected Soils:Agricultural Salinity Assessment and Management, K.K. Tanjii (Ed.). ASCE Manualsand Reprints on Engineering Practice No. 71. ASCE New York 1990.
MAAS E.V. 1990. Crop Salt Tolerance. In: Agricultural Salinity Assessment andManagement, K.K. Tanjii (Ed.). ASCE Manuals and Reports on Engineering Practice No.71. ASCE New York 1990.
MacVICAR C.M., J.M. de Villiers, R.F. Loxton, E. Vester, J.N.N. Lambrechts, F.R.Merryweather, J. le Roux, T.H. van Rooyen and H.J von M. Haremse 1977. SoilClassification, A Binomial System for South Africa. Science Bull., 390. Dept. of Agric.Tech. Services, Pretoria.
SHAINBERG I. and J Letey 1984. Response of Soils to Sodic and Saline Conditions.Hilgardia 52, No. 2.
VAN DER MERWE A.J. 1973. Physico-chemical relationships of selected OFS soils. AStatistical Approach based on Taxonomic Criteria. Ph.D (Agric) Thesis, Univ. Of OFS,Bloemfontein.
UNITED STATES SALINITY LABORATORY STAFF 1954. Diagnosis andImprovement of Saline and Alkali Soils. USDA Agricultural Handbook No. 60.Washington DC.

154

Agricultural Water Use: Irrigation 2nd Edition, 1996 (1st Issue) Sodium: Page 1 of 6
155
SodiumTentative guideline
Background Information
Introduction Sodium is an alkali metal which reacts with water to form highly soluble positively- chargedsodium ions. It is an essential dietary element important for the electrolyte balance and themaintenance of many essential physiological functions. Sodium is present in all food tovarying degrees. In minute quantities sodium is beneficial to the growth of some plants.At higher concentrations it is, however, toxic to many plants, especially woody plants.Sodium also has a potentially detrimental effect on soil physical conditions.
Occurrence Sodium is ubiquitous in the environment and usually occurs as sodium chloride, butsometimes as sodium sulphate, bicarbonate or even nitrate. Sodium is found as solidsodium chloride (rock salt) in areas where geological deposits occur. The levels of sodiumin surface waters are generally low in areas of high rainfall and high in arid areas with lowmean annual precipitation. Sodium is highly soluble in water and does not precipitate whenwater evaporates, unless saturation occurs. Hence, water in arid areas often containselevated concentrations of sodium. High concentrations also occur in sea water, atapproximately 110 g/R. Industrial wastes, especially processes that give rise to brines, contain elevatedconcentrations of sodium. Sodium is also present at high concentrations in domestic wastewater. This is in part due to the addition of table salt (sodium chloride) to foods.Furthermore, with re-use or recycling of water, the sodium concentration will tend toincrease with each cycle or addition of sodium to the water. Sodium concentrations aremostly elevated in runoffs of leachates from irrigated soils.
Interactions Metabolically, sodium interacts with potassium. Sodium and potassium are the mostimportant extracellular and intracellular cations respectively, and vital to all living organisms.Sodium interactions with soil are described in the SAR guideline.
Measurement The criteria are given in terms of the dissolved sodium concentration, in units of mg/R. Forall practical purposes this is identical to the total sodium concentration, as sodium is alwaysin the dissolved form, except in supersaturated brines.
The reference method for the determination of sodium is flame photometry, with lithiumas the internal standard. If other methods for measuring sodium are used, theircharacteristics relative to the reference method should be known.
Data The sodium concentration of irrigation water provides an indication of the levels at whichInterpretation
! leaf uptake (i.e. when foliage is wetted by the irrigation method) by crops resulting inthe uptake of sodium to plant toxic levels, can be expected to occur. The arithmeticmean concentration during the active growing season (preferably application volumeweighted) is used for this purpose.
! leaf burn (foliar damage) of crops can be expected to occur when crop foliage is wettedby irrigation water. The maximum concentration during the active growing season isused for this purpose.

Agricultural Water Use: Irrigation 2nd Edition, 1996 (1st Issue) Sodium: Page 2 of 6
156
! Sodium will accumulate in consumable plant parts; a maximum sodium level from aquality perspective has been defined. The arithmetic mean concentration during theactive growing season (preferably application volume weighted) is used for this purpose.
Note: The degree to which root uptake of sodium affects crop response is dealt with underthe SAR guideline.
Treatment It is highly unlikely that sodium can be economically removed from water intended forOptions irrigation purposes. However, should it be required, sodium can be removed from water
together with other ions which constitute the TDS by the following desalination processes:
! ion-exchange using a mixed-bed ion exchange column, usually where the feed TDS isup to around 2 000 mg/R;
! treatment by membrane processes such as reverse osmosis or electrodialysis, where theTDS concentration is in the range of 2 000 to 3 500 mg/R; and
! distillation, in cases where the TDS is no less than 10 000 mg/R.
All of the processes are easily fouled by suspended matter, and are prone to scaling withhard waters. All of the processes produce a concentrated waste stream of the salts that maycause disposal difficulties. If used on a large scale, all of the processes require high levelsof design, operator and maintenance skills.
The Effects of Sodium
Norms The different norms used in the guideline to assess the effects of sodium on irrigation wateruse are summarised below:
Irrigation water uses Norms for measuring waterquality effects
Application to commercial crops ! Crop yield as affected by crop sensitivity touptake through foliage
! Crop quality as determined by damage tomarketed product or by regulatory limits onconcentration in final product
Application to sustain suitability ! No known effects of sodium on its own (Seeof irrigated soil Sodium Adsorption Ratio)
Maintenance of irrigation ! No known effectsequipment
Almost all available information on the effects of sodium in irrigation water are on theeffects of crop yield. Sparse information is available with which the sodiumconcentration of irrigation water can be related to the regulatory limits placed on thesodium concentration in final products.
Effects Sodium is not recognised as an essential plant nutrient, although it does benefit the growthof some plants. Many crops are reported to show sodium toxicity when it accumulates to

Agricultural Water Use: Irrigation 2nd Edition, 1996 (1st Issue) Sodium: Page 3 of 6
157
elevated levels in plant tissues; sensitivity varies considerably between species. Woodycrops are especially sensitive. The effects of sodium toxicity are compounded by indirecteffects such as, induced nutritional imbalances and impairment of soil physical conditions.Plants absorb sodium through both their roots and leaves.
Root uptake is determined primarily by sodium concentrations in the soil solution that aredetermined by a number of factors, of which, the exchangeable sodium percentage (ESP)of the soil and total salt content are the most important. The effects of sodium toxicitythrough root uptake are dealt with in the SAR guideline.
Crops wetted by water containing sodium are exposed not only to the root zone sodiumcontent but, also to absorption directly through the leaves. Experiments to quantify theadditional impact of foliar damage by sprinkler irrigation to crop yield (over and above thatcaused by root uptake) indicate that the effects may be substantial.
Foliar absorption of sodium is often associated with leaf burn. Leaf burn can be the resultof a single exposure to a high sodium concentration. The extreme visual effect oncrop/plant reaction will mostly be determined by the maximum sodium concentration. Theeffect is acute and irreversible over the short term. Provided the damage to the crop wasnot permanent, the effect can be reversed over the long-term.
Crops vary in foliar absorption rates. The absorption rates of avocado leaves are low whilethose of citrus, stonefruits and almonds are high. This means that 45 - 70 mg/R sodium cancause damage in crops with a high leaf absorption rate. The relative susceptibility of cropsto foliar injury from saline sprinkling is given in Table 2.
Typical symptoms of sodium toxicity are leaf burn, scorch, and dead tissue along theoutside edges of leaves. As the severity increases, the symptoms move progressively inwardbetween the veins towards the centre of the leaf. This contrasts with symptoms of chloridetoxicity which occur first at the leaf tip. Several days or weeks are normally requiredbefore sodium accumulates to toxic levels. Symptoms therefore appear first on olderleaves.
Crop quality may also be affected by sodium-induced leaf injury in plants of which leavesare the marketed product, or where fruit size and appearance are affected by sodium-induced yield decreases. These aspects of crop quality are covered (to the extent thatinformation is available) by the criteria for yield decreases and foliar damage as a result ofsodium absorption through plant leaves; see SAR guideline.
Crop quality is also affected by restrictions by users or regulating authorities on the sodiumcontent of the final product. In South Africa the sodium content of wine is restricted to 100mg/R.
Mitigation Common on-farm management practices to cope with increasing sodium content of wateraffecting crop yield and quality, when the crop is subjected to sprinkler irrigation, are to
! switch to an irrigation method that does not wet the leaves; or
! accept a reduced crop yield or quality; and/or
! switch to crops that are more tolerant to sodium; and/or
! switch to crops with a lower foliar adsorption rate; and/or

Agricultural Water Use: Irrigation 2nd Edition, 1996 (1st Issue) Sodium: Page 4 of 6
158
! ameliorate the water and/or soil with plant nutrients such as calcium, magnesium andpotassium to overcome plant nutritional imbalances induced by the excess sodium;and/or
! reduce the opportunity for foliar absorption of sodium by reducing the number ofwetting and drying cycles, (i.e. reduce the irrigation frequency) and/or by irrigating atnight when temperature (and thus absorption rate) and evaporation (and thus saltconcentration rate) are lower; and/or
! rinse the leaves at the end of an irrigation application with low sodium water; and/or
! avoid irrigation during periods of high wind (wind is a major factor in the concentrationand adsorption of sodium. The downwind drift of sprinklers is more concentrated thanthe applied sprinkler water and thus more likely to cause foliar damage); and/or
! increase sprinkler rotation speed (sprinklers that rotate slowly allow appreciable dryingbetween rotations); and/or
! increase application rate (within the limits posed by soil water storage capacity andinfiltration rate, thereby reducing the time period available for foliar absorption); and/or
! increase droplet size. (This results in less absorption compared to small drops).

Agricultural Water Use: Irrigation 2nd Edition, 1996 (1st Issue) Sodium: Page 5 of 6
159
Criteria Table 1: Effects of Sodium on Foliar Crop Yield and Quality
Concentration Crop Yield and QualityRange
Target Water Should prevent the accumulation of sodium to toxic levelsQuality Range in all but the most sensitive plants, even when crop foliage# 70 mg/R is wet
70 - 115 Crops sensitive to foliar absorption accumulate toxic levels ofsodium when crop foliage is wetted. They display symptomsof foliar injury and yield decrease
115 - 230 Crops moderately sensitive to foliar absorption accumulatetoxic levels of sodium when crop foliage is wetted. Theydisplay symptoms of foliar injury and yield decreases
230 - 460 Crops moderately tolerant to foliar absorption accumulatetoxic levels of sodium when crop foliage is wetted. Theydisplay symptoms of foliar injury and yield decreases
> 460 Crops tolerant to foliar absorption increasingly accumulatetoxic levels of sodium when crop foliage is wetted. They display symptoms of foliar injury and yield decreases
Note:
! Crop tolerance to sodium when crop foliage is wetted by the irrigation method(sprinkler irrigation) is not well established, due to limited data. Very littlelocal confirmation of internationally published experiments has taken place.
! The indicated concentration ranges apply to daytime sprinkling underconditions that are not too hot or too dry.
Modifications ! It should be noted that the effects of sodium absorption by plant roots (see SAR) andcrop foliage (denoted by sodium concentration) are additive. The most restrictivecriteria should thus be used when crop foliage is wetted (sprinkler irrigation).
! Environmental or other conditions causing an increased sodium concentration on foliage(e.g. hot, dry conditions) necessitate the use of more conservative criteria.
! The relative susceptibility of some crops to foliar injury is presented in Table 2.
Table 2: Relative Susceptibility of Crops to Foliar Injury from Saline Sprinkling
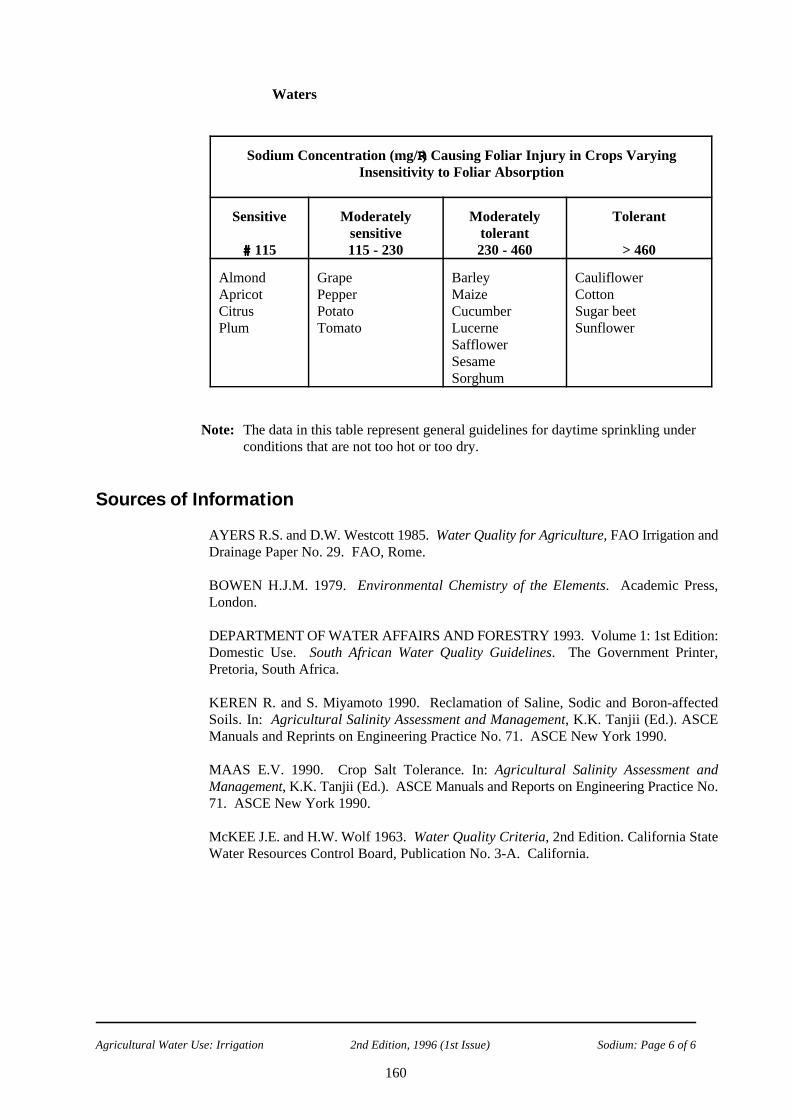
Agricultural Water Use: Irrigation 2nd Edition, 1996 (1st Issue) Sodium: Page 6 of 6
160
Waters
Sodium Concentration (mg/RR) Causing Foliar Injury in Crops VaryingInsensitivity to Foliar Absorption
Sensitive Moderately Moderately Tolerantsensitive tolerant
## 115 115 - 230 230 - 460 > 460
Almond Grape Barley CauliflowerApricot Pepper Maize CottonCitrus Potato Cucumber Sugar beetPlum Tomato Lucerne Sunflower
Safflower Sesame Sorghum
Note: The data in this table represent general guidelines for daytime sprinkling underconditions that are not too hot or too dry.
Sources of Information
AYERS R.S. and D.W. Westcott 1985. Water Quality for Agriculture, FAO Irrigation andDrainage Paper No. 29. FAO, Rome.
BOWEN H.J.M. 1979. Environmental Chemistry of the Elements. Academic Press,London.
DEPARTMENT OF WATER AFFAIRS AND FORESTRY 1993. Volume 1: 1st Edition:Domestic Use. South African Water Quality Guidelines. The Government Printer,Pretoria, South Africa.
KEREN R. and S. Miyamoto 1990. Reclamation of Saline, Sodic and Boron-affectedSoils. In: Agricultural Salinity Assessment and Management, K.K. Tanjii (Ed.). ASCEManuals and Reprints on Engineering Practice No. 71. ASCE New York 1990.
MAAS E.V. 1990. Crop Salt Tolerance. In: Agricultural Salinity Assessment andManagement, K.K. Tanjii (Ed.). ASCE Manuals and Reports on Engineering Practice No.71. ASCE New York 1990.
McKEE J.E. and H.W. Wolf 1963. Water Quality Criteria, 2nd Edition. California StateWater Resources Control Board, Publication No. 3-A. California.

Agricultural Water Use: Irrigation 2nd Edition, 1996 (1st Issue) Suspended Solids: Page 1 of 4
161
Suspended SolidsTentative Guideline
Background Information
Introduction Suspended solids are the particulate matter retained on a glass fibre filter, after filtration ofa well-mixed sample and drying of the filter at 103 - 105 C. The settleable solids fractiono
is a component of the suspended solids fraction and is that fraction which settles out ofsolution within a defined period.
Surface water often contains appreciable concentrations of suspended solids. Largequantities of suspended solids can affect irrigation in many ways. Surface deposition mayform crusts which inhibit infiltration and seedling emergence; deposition on plant leaves canreduce plant photosynthetic activity, growth and marketability of some crops; dripperoutlets may clog; and sprinkler jets may be subject to accelerated wear.
Occurrence Suspended solids in water consist of inorganic and organic matter such as, clay particles orsuspended mineral matter and a combination of decay products and living organismsrespectively. In clear non-turbid waters, like spring water, the suspended matter is low orabsent, while in muddy waters, the amount of suspended matter is high. The amount ofsuspended matter found in the rivers draining a catchment area usually reflects the degreeof soil erosion. Activities which result in accelerated soil erosion will therefore increase thesuspended solids load in the draining rivers.
The settleable fraction of the suspended solids accumulates as sediment in lakes, dams andrivers. Scouring action during high flow periods in rivers can resuspend settled matter andfiner particles can remain in suspension for long periods.
Interactions Suspended solids give rise to turbidity in water. The relationship between the amount ofsuspended solids and the turbidity measurement is, however, dependent on the nature andparticle size distribution of the suspended matter. Addition of strongly electropositive ionssuch as ferrous, Fe(III) and aluminium, Al(III) salts to water will neutralise the electricalrepulsive charges on the suspended matter and allow coagulation and settling to occur.
Measurement The criteria for the suspended solids concentration are given in units of mg/R. Suspendedsolids are measured as the mass of material retained on a glass fibre filter after drying at 103- 105 EC. The settleable solids fraction is determined by difference after a one hour settlingperiod followed by determination of the suspended solids in the supernatant.
Data The geometric mean concentration in the applied water (preferably application volumeInterpretation weighted) should be used to compare with the criteria given. The suspended solid content
of irrigation water provides an indication of the likelihood that:
! drip irrigation systems will become clogged
! soil surface crusts will form which may inhibit water infiltration and seedling emergence.
! photosynthetic activity reducing films will form on plant leaves when water is appliedwith sprinkler irrigation.

Agricultural Water Use: Irrigation 2nd Edition, 1996 (1st Issue) Suspended Solids: Page 2 of 4
162
Treatment Treatment to remove suspended solids is often too costly to be economical for mostOptions irrigation applications. Where treatment is required, suspended solid loads are mostly
removed by coagulation and flocculation followed by filtration, by one of the followingtechniques:
! Aluminium sulphate and ferric chloride are conventionally used as coagulants. Smalldoses of polyelectrolytes are often added to assist in flocculation.
! Sand and screen filters that can be backwashed, as well as centrifugal separators arecommonly used in-line to protect drip irrigation systems from clogging.
The Effects of Suspended Solids
Norms The different norms used in the guidelines to assess the effects of suspended solids onirrigation water use are summarised below:
Irrigation water uses Norms for measuring water quality effects
Application to commercial ! Crop yield as affected by photosynthetic activitycrops reducing films (no numerical criteria given)
! Crop quality as affected by appearance ofmarketable products as a result of suspendedsolid deposits (no numerical criteria given)
Application to sustain ! Reduction in infiltration rate and/or seedlingsuitability of irrigated soil emergence because of a soil surface crust being
deposited by suspended solids (no numericalcriteria given)
Maintenance of irrigation ! The degree of clogging that can be expected inequipment drip irrigation systems
! Accelerated wear of sprinkler irrigation nozzlesand other components in the distribution system(no numerical criteria given)
Effects Suspended solids are mostly comprised of particulate matter of inorganic origin with noinherent toxic effect for plants or soil and effects are of a physical nature. Because of theparticle size distribution found in the suspended solids fraction, and the small size orifices(emitters) used in drip (and to a lesser extent microjet) irrigation systems, partial to completeclogging or plugging of orifices occurs. This leads to a decrease in uniformity of waterapplication and subsequent yield decreases. The abrasive action of particles may also leadto accelerated wear of sprinkler nozzles (decreased uniformity of water application) andother components (pumps, seals and control valves) of the distribution system.
When present in sufficiently high concentrations, deposition of suspended solids on the soilsurface can lead to the formation of a depositional surface crust which inhibits waterinfiltration and seedling emergence, and reduces soil aeration. When applied to sandy soils,suspended solids may have a beneficial effect; they may improve the soil texture,consistency and water holding capacity.

Agricultural Water Use: Irrigation 2nd Edition, 1996 (1st Issue) Suspended Solids: Page 3 of 4
163
Deposition on plant leaves may reduce plant photosynthetic activity and result in reducedyields. Deposition on plant parts may also affect the appearance and marketability ofproduce.
Mitigation Common on-farm management practices to mitigate against the negative effects ofsuspended solids in irrigation water, are to:
! Allow suspended solids to settle in temporary storage dams (settling ponds) and extractthe supernatant for filtration (if required).
! Switch to an application system that will minimise the negative effects (e.g. microjetinstead of drip irrigation to overcome clogging or flood irrigation to overcome depositionon foliage).
! Reduce the likelihood of clogging by using emitters that are designed to be self-cleaning.
! Use regularly flush dripper lines to remove accumulated sediment (suspended solids).
! Control the growth of micro-organisms in distribution lines. Suspended particles areoften caught by the slime and filament byproducts of bacteria. When these increase insize they cause clogging of emitters. The control of micro-organisms thus helps toalleviate the problem of clogging.
Criteria Effects of Suspended Solids on the Clogging of Drip Irrigation Systems
Concentration Range Clogging of Drippers(mg/RR)
Target Water Quality Practically no problems with the clogging of dripRange irrigation emitters# 50
50 - 100 Slight to moderate problems with the clogging of dripirrigation emitters
> 100 Increasingly severe problems with the clogging of dripirrigation emitters
Note:
! The above criteria are tentative.
! Suspended solids are only one of a number of causes of clogging in dripirrigation systems. See pH, total dissolved solids, manganese, iron and faecalcoliforms.
Sources of Information
APHA 1989. Standard Methods for the Examination of Water and Waste Water, 17thEdition. American Public Health Association, American Water Works Association, WaterPollution Control Federation. Published by the American Public Health Association,Washington DC, USA.

Agricultural Water Use: Irrigation 2nd Edition, 1996 (1st Issue) Suspended Solids: Page 4 of 4
164
AYERS R.S. and D.W. Westcott 1985. Water Quality for Agriculture, FAO Irrigation andDrainage Paper No. 29. FAO, Rome.
HART B.T. 1974. A Compilation of Australian Water Quality Criteria. AWRCTechnical Paper No. 7.
DEPARTMENT OF WATER AFFAIRS 1993. South African Water Quality Guidelines,Volume 4: Agricultural Use. The Government Printer, Pretoria, South Africa
NAKAYAMA F.S. and D.A. Bucks 1991. Water Quality in Drip/trickle Irrigation: Areview, 12, 187 - 192.
UNITED STATES ENVIRONMENTAL PROTECTION AGENCY 1973. ProposedCriteria for Water Quality. US EPA, Washington DC, October 1979.

Agricultural Water Use: Irrigation 2nd Edition, 1996 (1st Issue) Total Dissolved Solids: Page 1 of 11
165
Total Dissolved SolidsBackground Information
Introduction The total dissolved solids (TDS) are a measure of the quantity of various inorganic saltsdissolved in water. The TDS concentration is directly proportional to the electricalconductivity (EC) of water. Since EC is much easier to measure than TDS, it is routinelyused as an estimate of the TDS concentration.
Electrical conductivity is a measure of the ability of water to conduct an electrical current.This ability is a result of the presence of ions in water such as carbonate, bicarbonate,chloride, sulphate, nitrate, sodium, potassium, calcium and magnesium, all of which carryan electrical charge. Most organic compounds dissolved in water do not dissociate intoions, consequently they do not affect the EC.
Irrigation with water containing salt induces salt into the soil profile. When no or littleleaching of salt takes place from the soil profile, salt accumulates and a saline soil is formed.Crops are sensitive to soil salinity; yield is reduced if grown on salt-affected soils. Underconditions of extreme soil salinity, crops cannot be grown successfully.
Occurrence Virtually all natural waters contain varying concentrations of TDS as a consequence of thedissolution of minerals in rocks, soils and decomposing plant material. The TDS of naturalwaters is therefore often dependent on the characteristics of the geological formations withwhich the water was, or is, in contact.
Typically, the concentration of the TDS in
! rainwater is low, generally less than 1 mg TDS/R;! water in contact with granite, siliceous sand and well-leached soils is generally low, less
than 30 mg TDS/R;! water in contact with precambrian shield areas is generally less than 65 mg TDS/R; and! water in contact with palaeozoic and mesozoic sedimentary rock formations is generally
in the range of 195 - 1 100 mg TDS/R.
TDS are likely to accumulate in water as water moves downstream because salts arecontinuously being added through natural and manmade processes whilst very little isremoved by precipitation or natural processes. Domestic and industrial effluent dischargesand surface runoff from urban, industrial and cultivated areas are examples of the types ofreturn flows that may contribute to increased TDS concentrations.
High TDS concentrations in surface waters are also caused by evaporation in water bodieswhich are isolated from natural drainage systems. The saline pans in the central parts ofSouth Africa are examples of such water bodies.
Interactions Over the long term (i.e. under equilibrium conditions) the TDS content of irrigation waterdetermines the salt distribution in a soil profile. Since exchange reactions take place on astoichiometric basis, cation and other exchange reactions in soil have only a limited effecton the TDS of the soil solution. Therefore, the soil salinity profile attains equilibriumconditions more rapidly than do individual cations. Although true equilibrium conditions areseldom attained in practice (due to changes in irrigation management, irrigation water, theTDS concentration and rainfall), quasi-equilibrium soil salinity profiles are mostly attained

Agricultural Water Use: Irrigation 2nd Edition, 1996 (1st Issue) Total Dissolved Solids: Page 2 of 11
166
within two irrigation seasons.
The salt content in the root zone increases with depth. Close to the surface it is similar tothat of the irrigation water. Since plants actively absorb water and leave most of the saltbehind (in a reduced volume), the salt concentration throughout the soil profile increasesbetween irrigation applications. During each irrigation the accumulated salt is leacheddeeper into the soil profile where it is again concentrated and progressively leached downever deeper by successive irrigation applications, until it is leached from the root zone.Unless salt is leached, salinity within the root zone will accumulate to levels at which plantscannot extract water. The salinity at the bottom of the root zone (i.e. salinity of drainagewater, EC ) is determined by the irrigation water salinity (EC ) and the degree of leachingdw iw
that takes place, and is derived from the equation
EC = EC /LFdw iw
where LF is the leaching fraction, i.e. the fraction of the total water application that isleached to below the root zone, which is derived from the equation
LF = D /Ddw iw
where D is the total depth of water applied, and D is the depth of drainage water (i.e.iw dw
D is the depth of evapotranspiration).iw
Therefore, a high leaching fraction results in a lower TDS/EC in the drainage water and inthe overlying soil profile compared to a low leaching fraction. A wide range of soil salinitiescan therefore be induced by varying the leaching fraction.
Measurement The criteria are given in terms of the TDS concentration in mg/R, as well as the equivalentEC, expressed in milli-Siemens per metre (mS/m), measured at or corrected to atemperature of 25 EC.
The TDS concentration can be measured as ! an estimate based on the EC value (see below);! the dry weight of the salts after evaporation of a known volume of filtered water; and! the sum of the concentrations of the constituent cations and anions.
For most natural waters EC is related to the dissolved salt concentration by a conversionfactor ranging from 5.5 - 7.5. The average conversion factor for most waters is 6.5. Theconversion equation is as follows:
EC(mS/m at 25 EC) x 6.5 = TDS(mg/R)
The exact value of the conversion factor depends on the ionic composition of the water,especially the pH and bicarbonate concentration.
Should very accurate measures of TDS be required the conversion factor should bedetermined for specific sites and runoff events.
Data The TDS/EC concentration of irrigation water provides an indication of the levels at whichInterpretation
! crop yield will be affected. The arithmetic mean concentration during the activegrowing season (preferably application volume weighted) is used.

Agricultural Water Use: Irrigation 2nd Edition, 1996 (1st Issue) Total Dissolved Solids: Page 3 of 11
167
! soil salinity will stabilise under long-term irrigation with water of a particular TDSconcentration, under given irrigation water management practices and climaticconditions. The arithmetic mean concentration during the active growing season(preferably application volume weighted) is used.
Treatment Although some salts, such as those of calcium, magnesium and certain heavy metals canOptions be removed by chemical precipitation, most of the inorganic salts dissolved in water can
only be removed by distillation or by highly sophisticated physical-chemical separationtechnologies. All these technologies are characterised by their high cost and/or their highenergy requirements. It is highly unlikely that TDS can be economically removed fromwater intended for irrigation use. However, should this be required, the technologiesavailable for reducing the concentration of TDS in water are
! ion exchange using a mixed ion exchange column, usually where the feed TDS is up to2 000 mg/R;
! treatment by membrane processes such as reverse osmosis or electrodialysis, where theTDS concentration is in the range of 2 000 - 3 500 mg/R; and
! distillation in cases where the TDS concentration is approximately 10 000 mg/R.
All of the processes are usually fouled by suspended matter and are prone to scaling withhard waters. All large-scale processes require high levels of design, operator andmaintenance skills. Furthermore, all processes produce a concentrated waste stream of thesalts that may cause disposal difficulties.
The Effects of Total Dissolved Solids
Norms The different norms used in the guideline to assess the effects of the TDS on irrigationwater use are summarised below:
Irrigation Water Uses Norms for Measuring WaterQuality Effects
Application to commercial crops ! Crop yield as affected by crop sensitivity toirrigation water-induced soil salinity
! Crop quality as affected by soil salinity
Application to sustain suitability ! Soil salinity that would allow cropof irrigated soil production on a sustainable basis
Maintenance of irrigation ! See Total Hardnessequipment
A considerable information base is available on the effects of TDS/EC of irrigationwater on crop yield and soil salinisation. Much less is known about the effects oncrop quality.
Effects Irrigation with water containing salt introduces salt into the soil profile. When no or littleleaching of salt takes place from the soil profile, salt accumulates and a saline soil is formed.Since crops are sensitive to soil salinity, yield is reduced if grown on salt affected soils.Under conditions of extreme soil salinity, crops cannot be grown successfully.

Agricultural Water Use: Irrigation 2nd Edition, 1996 (1st Issue) Total Dissolved Solids: Page 4 of 11
168
! Saline soils
Irrigation management practices should ensure a stable soil salinity for sustainedagricultural practice. Under natural conditions, saline soils are mostly associated withsalt accumulation as a result of surface evaporation of salty water. This often occurs in
- low-lying areas (pans) with poor vertical drainage, where salts in the runoff waterconcentrate and accumulate when the water evaporates; or
- in areas where groundwater seeps to the surface, evaporation takes place and saltsaccumulate.
Extremely saline soils often display salt efflorescence at the soil surface. Other visualindications of high soil salinity are a powdery, loose appearance at the soil surface.Intermediate salinities need to be determined with field instruments or laboratoryanalyses. Saline areas within a field can often be identified by the comparativelystunted growth of crops, although stunted growth in itself may be the result of manycauses, and does not necessarily indicate soil salinity.
Under irrigation, saline soils are formed primarily when high salinity water is used forirrigation. Soil salinity is determined by interactions between the TDS of irrigationwater and leaching. Saline soils can, however, also be formed when salts from anelevated water table (which mostly form under irrigated land as a result of over-irrigation) are concentrated in the soil profile by surface evaporation.
Therefore, provided that soils are adequately drained, soil salinity can be controlled byproviding for additional leaching. However, the higher the irrigation water TDS/ECconcentration, the higher the leaching fraction, and the greater the soil drainage capacityneeded to cope with an additional leaching volume. Increasingly strict screening of soildrainage properties is therefore required to ensure soil sustainability as the TDS/ECconcentration of irrigation water increases.
The fact that leaching of salts is required to maintain a stable soil salinity implies thatthe leached salts have to be disposed of. Their disposal inevitably results in thesalinisation of rivers associated with irrigation schemes. For irrigation to be sustainable,the salinisation of rivers as a result of irrigation needs to be minimised as far as possible.
! Crop yield and quality
The magnitude of the yield decrease is determined by both the duration and the levelof exposure to salinity-induced water stress. The presence of dissolved salts in soilwater reduces the physiological availability of water to plants. When the salt contentreaches a concentration where the plant is no longer able to extract sufficient water forits requirements, salinity-induced water stress develops, the growth rate starts todecline and, if it continues for a significant period of time, crop yield starts to decline.
The soil salinity at which plant growth starts to decline is defined as the thresholdsalinity. It is usually expressed as the TDS/EC of the saturated-soil extract , which isthe reference water content for the measurement of soil salinity. Crop yield has beenfound to decrease approximately linearly with salinity increases above the thresholdsalinity. Both the threshold salinity and the slope of yield decline above this point arespecific to a particular crop or cultivar.
When the time interval between irrigation applications is long, the salt in the soil solution

Agricultural Water Use: Irrigation 2nd Edition, 1996 (1st Issue) Total Dissolved Solids: Page 5 of 11
169
becomes more concentrated than when applications are applied frequently. The effectsthat saline irrigation water have on crop growth are therefore more pronounced withlow, than with high, frequency irrigation applications.
The symptoms plants display when affected by salinity are similar in appearance tothose of drought, namely stunted growth, wilting (even though the soil may not be dry),a darker, bluish-green colour and in some cases thicker, waxier leaves. Symptoms varywith the growth stage. Usually symptoms are more obvious when plants are affectedduring early growth stages. Mild salinity effects may go unnoticed because the effectmay be uniform over a field, with no basis for comparison.
Crop salt tolerance has mostly been determined over a growing season. The availablesalt tolerance data may therefore reflect the tolerance of the most sensitive growth stageand does not necessarily provide a good indication of salinities that may be toleratedduring more resistant growth stages.
Mitigation Reduced crop yield and quality
Common on-farm management practices to cope with the effects of increasing irrigationwater salinity, are to
! apply surplus irrigation water (in addition to crop water requirements) in order to leachaccumulating salt out of the soil (increase the leaching fraction); and/or
! accept a reduced crop yield; and/or
! switch to crops which are more salt-tolerant; and/or
! plant annual crops at a higher density (a reduced yield on a greater number of plantspartially offsets the total yield reduction); and/or
! switch to a higher frequency irrigation application.
! use irrigation only to supplement rainfall, that is, do not practice full-scale irrigation.
Soil sustainability
Common on-farm practices to cope with the effects of increasing irrigation water salinity,are to
! apply surplus irrigation water (in addition to crop water requirements) in order to leachaccumulating salt out of the soil by increasing the leaching fraction); and/or
! install artificial drainage to supplement or replace the soil's inherent internal drainage,and/or
! accept temporary waterlogged conditions and a higher soil salinity; and/or
! improve irrigation application efficiency; and/or
! switch to a higher frequency irrigation application (thereby reducing the likelihood oftemporary waterlogged conditions from developing immediately following a heavyirrigation application).

Agricultural Water Use: Irrigation 2nd Edition, 1996 (1st Issue) Total Dissolved Solids: Page 6 of 11
170
Criteria Table 1: Effects of TDS/EC on Crop Yield
EC Range Crop Yield (mS/m)
Target Water Should ensure that salt-sensitive crops can be grownQuality Range without yield decreases when using low frequency
# 40 irrigation systems. A leaching fraction of up to 0.1 may berequired and wetting of the foliage of sensitive crops shouldbe avoided
40 - 90 A 95 % relative yield of moderately salt-sensitive crops canbe maintained by using a low-frequency irrigation system. Aleaching fraction of up to 0.1 may be required and wetting ofthe foliage of sensitive crops should be avoided
90 - 270 A 90 % relative yield of moderately salt-tolerant crops can bemaintained by using a low-frequency application system. Aleaching fraction of up to 0.15 may be required and wetting ofthe foliage of sensitive crops should be avoided
270 - 540 A 80 % relative yield of moderately salt-tolerant crops can bemaintained provided that a high-frequency irrigation system isused. A leaching fraction of up to 0.2 may be required andwetting of the foliage of sensitive crops should be avoided
> 540 These waters can still be used for irrigation of selected cropsprovided sound irrigation management is practised and yielddecreases are acceptable. However, the management and soilrequirements become increasingly restrictive and thelikelihood of sustainable irrigation decreases rapidly
Note:
! Since sustainable soil salinity is determined by the soil's ability to sustain cropproduction, the effects on soil sustainability and crop yield are similar.
! Information about the effect of soil salinity on crop quality is too limited toderive general criteria.
Modifications The limitations of setting criteria for salinity include:
! The need to make assumptions about the relationship between saturation extract salinity(for which yield response data is available) and soil water salinity and the deviation ofthe mean soil profile salinity, to which crops would respond. These were discussed indetail in the first edition of the guidelines.
! The fact that most of the available salinity-yield response data was derived fromexperiments using artificial irrigation waters (consisting of calcium and sodium chloride)and water applications to achieve high leaching fractions. No precipitation of salts canbe expected under these conditions. Higher yield could thus be expected if, forexample, calcium sulphate rich irrigation water (a portion of which would precipitate

Agricultural Water Use: Irrigation 2nd Edition, 1996 (1st Issue) Total Dissolved Solids: Page 7 of 11
171
under low leaching conditions) was used.
! A lack of information on foliar damage to leaves caused by salinity per se; criteria are,however, provided for foliar damage by chloride and sodium.
! The criteria for crop salt tolerance do not consider differences in crop tolerance duringdifferent growth stages. This needs to be considered for site-specific cases. Table 2provides some information for the germination period.
! A list of commercial crops grouped into salt tolerance classes as used in the criteria islisted in Table 3.
! A list of ornamental shrubs, trees and ground cover plants grouped into salt toleranceclasses used in the criteria is listed in Table 4.
! It may be possible to provide criteria for the effect of salinity on the quality of somespecific crops (e.g. the solid content of tomatoes increases with increasing salinity), butthe available information is too limited to derive general criteria.
! Potted plants usually receive water applications in excess of the assumptions used toderive the criteria. Practically no leaching occurs with the result that salt canaccumulate to relatively high concentrations. To control salt accumulation, pottedplants should be leached by excessive watering on a regular basis.
! Water and plant nutrients are often recirculated in commercial floriculture (e.g.hydroponics and soilless growth media), with the result that salts accumulate. Sincewater application is mostly controlled to ensure minimal matric potentials, higher saltconcentrations can be tolerated. It should, however, still be controlled to within planttolerance levels.

Agricultural Water Use: Irrigation 2nd Edition, 1996 (1st Issue) Total Dissolved Solids: Page 8 of 11
172
Table 2: Relative Salt Tolerance of Various Commercial Crops at Germination(after Ayers and Westcott, 1985)
Crop Fifty Percent Emergence Reduction(EC (mS/m) of Saturated Soil Extract
Barley 1 600 - 2 400Cotton 1 550Sugarbeet 500 - 1 250Sorghum 1 300Safflower 1 230Wheat 1 400 - 1 600Beet, red 1 380Lucerne 820 - 1 340Tomato 760Rice 1 800Cabbage 1 300Muskmelon 1 040Maize 2 100 - 2 400Lettuce 1 140Onion 560 - 750Bean 800
Table 3 : Commercial Crops classified according to Salt Tolerance Classes(After Maas, 1990 and Ayers and Westcott, 1985)
Table 3a: Fruit and nut crops
Sensitive Moderately Moderately TolerantSensitive Tolerant
Almond Mango Castorbean Fig Date palmApple Orange Grape Jujube GuayuleApricot Passion fruit Olive JojobaAvocado Peach PapayaBlackberry Pear PineappleBoysenberry Persimmon PomegranateCherimoya Plum/pruneCherry, sweet PomeloCherry, sand RaspberryCurrant Rose appleGooseberry Sapote, whiteGrapefruit StrawberryLemon TangerineLimeLoquat

Agricultural Water Use: Irrigation 2nd Edition, 1996 (1st Issue) Total Dissolved Solids: Page 9 of 11
173
Table 3b: Vegetables
Sensitive Moderately Sensitive Moderately TolerantTolerant
Bean Broccoli Artichoke AsparagusCarrot Brussels sprouts Beet, redOkra Cabbage Squash, zucchiniOnion CauliflowerParsnip CeleryPea Maize, sweet
CucumberEggplantKaleKohlrabiLettuceMuskmelonPepperPotatoPumpkinRadishSpinachSquash, scallopSweet potatoTomatoTurnipWatermelon
Table 3c: Fibres, Seed and Sugar
Sensitive Moderately sensitive Moderately Toleranttolerant
Bean Broadbean Cowpea BarleyGuayule Castorbean Kenaf CottonRice, paddy Maize Oats GuarSesame Flax Safflower Jojoba
Millet, foxtail Sorghum RyeGroundnut/peanut Soybean SugarbeetSugarcane Wheat TriticaleSunflower Wheat, Durum

Agricultural Water Use: Irrigation 2nd Edition, 1996 (1st Issue) Total Dissolved Solids: Page 10 of 11
174
Table 3d: Grasses and Forage
Sensitive Moderately Sensitive Moderately Tolerant Tolerant
None Alfalfa (lucerne) Barley (forage) Alkali grass,Bentgrass Brome, mountain NuttallBluestem, Angleton Canary grass, reed Alkali sacationBrome, smooth Clover, Hubam Bermuda grassBuffelgrass Clover, sweet Kallar grassBurnet Fescue, meadow Saltgrass, desertClover, alsike Fescue, tall Wheatgrass,Clover, Berseem Harding grass fairway crestedClover, ladino Panic grass, blue Wheatgrass, tallClover, red Rape Wildrye, AltaiClover, strawberry Rescue grass Wildrye, Rus-Clover, white Dutch Rhodes grass sian Cowpea (forage) Ryegrass, ItalianDallis grass Ryegrass, perennialFoxtail, meadow Sudan grassGrama, blue Trefoil, narrowleafLovegrass birdsfootLucerne (alfalfa) Trefoil, broadleafMaize (forage) birdsfootMilkvetch, Cicer Wheat (forage)Oatgrass, tall Wheat, DurumOats (forage) (forage)Orchard grass Wheatgrass, standardRye (forage) crestedSesbania Wheatgrass, inter-Siratro mediateSphaerophysa Wheatgrass, slenderTimothy Wheatgrass, westernTrofoil, big Wildrye, beardlessVetch, common Wildrye, Canadian

Agricultural Water Use: Irrigation 2nd Edition, 1996 (1st Issue) Total Dissolved Solids: Page 11 of 11
175
Table 4: A List of Ornamental Shrubs, Trees and Ground Covers, classifiedinto Salt Tolerance Classes (After Maas, 1990)
Very Sensitive Moderately Moderately Tolerant VerySensitive sensitive Tolerant Tolerant
Star jasmine Pineapple guava Glossy privet Weeping Brush cherry White Pyrenees Chinese holly, Yello sage bottlebrush Ceniza iceplantcotoneaster cv. Burford Orchid tree Oleander Natal plum Rosea Oregon Rose, Southern Magnolia European fan palm Evergreen Pear iceplantgrape cv. Grenoble Japanese boxwood Blue dracaena Bougainvillea Purple Photinia Glossy abelia Xylosma Spindle tree, Italian stone iceplant
Southern yew Japanese black pine cv. Grandiflora pine Croceum Tulip tree Indian hawthorn Rosemary iceplantAlgerian ivy Dodonaea, Aleppo pineJapanese cv. atropuruea Sweet gum pittosporum Oriental arborvitaeHeavenly Thorny elaeagnusbamboo Spreading juniperChinese hibiscus Pyracantha, Laurustinus, cv. Graberi cv. Robustum Cherry plumStrawberry tree, cv. CompactCrape Myrtle
Sources of Information
AYERS R.S. and D.W. Westcott 1985. Water Quality for Agriculture, FAO Irrigationand Drainage Paper No. 29. FAO, Rome.
CANADIAN GUIDELINES 1987. Canadian Water Quality Guidelines. Prepared bythe Task Force on Water Quality Guidelines of the Canadian Council of Resource andEnvironment Ministers. Canada.
DEPARTMENT OF WATER AFFAIRS AND FORESTRY 1993. South AfricanWater Quality Guidelines, Volume 4: Agricultural Use.
HART B.T. 1974. A Compilation of Australian Water Quality Criteria. AWRCTechnical Paper No. 7.
HART B.T., C. Angehrn-Bettinazzi, I.C. Campbell and M.J. Jones 1992. DraftAustralian Water Quality Guidelines. Australian and New Zealand Environment andConservation Council. January 1992.
KEREN R. and S. Miyamoto 1990. Reclamation of Saline, Sodic and Boron-affectedSoils. In: Agricultural Salinity Assessment and Management, K.K. Tanjii (Ed.). ASCE Manuals and Reprints on Engineering Practice No. 71. ASCE New York 1990.
MAAS E.V. 1990. Crop Salt Tolerance. In: Agricultural Salinity Assessment andManagement, K.K. Tanjii (Ed.). ASCE Manuals and Reports on Engineering PracticeNo. 71. ASCE New York 1990.

Agricultural Water Use: Irrigation 2nd Edition, 1996 (1st Issue) Total Dissolved Solids: Page 12 of 11
176

Agricultural Water Use: Irrigation 2nd Edition, 1996 (1st Issue) Uranium: Page 1 of 4
177
UraniumTentative Guideline
Background Information
Introduction Uranium has fourteen isotopes, all of which are radioactive. Naturally-occurring uraniumconsists nominally of 99.27 % U and 0.72 % U . Much of the internal heat of the earth238 235
is thought to be due to the presence of the naturally-radioactive uranium and thorium.Uranium is chemically quite a reactive element and forms many compounds with otherelements, particularly with electronegative elements such as fluorine, phosphorus andarsenic.
Plants respond to the uranium concentration in the soil solution. Similar to most traceelements, uranium is strongly adsorbed by soil. The addition of uranium to the soil inrelatively high concentrations over the short-term may not result in reduced crop growth orin its accumulation in plant concentrations detrimental to humans or animals. However,continuous application over extended periods results in its accumulation in the surface soillayer, in practice the cultivated or plough layer.
Occurrence Traces of uranium are found in all soils, typically in the concentration range of 0.7 -9 mg/kg. Uranium is also found in a variety of uraniferous minerals. For example, uranyluranate (uraninite, is found in granitic pegmatites together with silver, lead and copper oresand in the yellow mineral carnotite (potassium uranyl vanadate). It also occurs incombination with various phosphate, arsenate and silicate minerals.
The mean concentration of uranium in fresh surface water is approximately 0.4 µg/R andin sea water, 3.2 µg/R. Considerably higher concentrations can occur in ground water,particularly where concentrations of uranium minerals are found in the rocks.
The U isotope is used in the nuclear industry, while the U isotope has various industrial235 238
uses, for example the production of yellow glass and glazes.
Interactions Uranium concentrations in the soil solution are largely determined by sorption anddesorption reactions with the soil exchange complex. Sorption appears to dominate at therelatively low concentrations that are of concern for water quality criteria for irrigation use.
Soil pH has a major effect on the concentration of uranium in the soil solution and itssolubility decreases with increasing pH.
Implications for irrigation with water containing uranium include the following:
! Uranium can be expected to be retained in the soil surface layers, because of its strongsorption by the soil exchange complex. In cultivated land it accumulates in the ploughlayer.
! Significant downward movement to below the plough layer and hence contaminationof groundwater with uranium is highly unlikely.
! The larger the soils cation exchange capacity (determined by clay content and claymineral type) the more uranium can generally be sorbed.

Agricultural Water Use: Irrigation 2nd Edition, 1996 (1st Issue) Uranium: Page 2 of 4
178
! Soils with a neutral to alkaline pH will be able to accept a greater uranium load thanacidic soils before concentrations in the soil solution become phytotoxic.
Measurement A variety of methods can be used to measure uranium. It can be chemically measured,where the concentration is expressed as mg/R uranium, or it can be radiologically measuredin terms of the á-particle radiation activity, where the concentration is expressed in units ofBq/R (Becquerel/litre). 1 Bq/R U activity corresponds to 80 µg/R uranium.238
Data Isolated uranium concentrations are difficult to interpret, and should always be evaluatedInterpretation in terms of the natural background concentrations expected in a given area. These can only
be determined by extensive surveys.
Because uranium is retained strongly by soils, it is likely to accumulate to phytotoxicconcentrations before equilibrium between sorption and desorption reactions is established.In order to prevent its accumulation, the total load applied to soil needs to be limited.International guidelines for its concentration in irrigation water have been calculated (usingvery limited available information) to ensure that it does not accumulate to either phytotoxiclevels or levels that are toxic to consumers, within a given time period. The calculationsassume that uranium accumulates within the surface 150 mm of soil. As such, theobjectives of sustained soil suitability for continued use and maintenance of crop yield andquality are accounted for.
The arithmetic mean concentration of the applied water (preferably application volumeweighted) is given in the criteria for:
! The uranium concentration that can be applied to any soil on a continuous basis. Thisconcentration is calculated such that uranium does not accumulate to phytotoxicconcentrations in a soil that is irrigated continuously for a period exceeding 100 yearsat an irrigation application rate of 1 000 mm p.a.
! The uranium concentration that can be applied to fine-textured, neutral to alkalinesoils for a period of up to 20 years at an irrigation application rate of 1 000 mm p.a.
Treatment Specialist advice should be sought to remove uranium from water and it is highly unlikelyOptions that removal from water intended for irrigation purposes is economically feasible.
Depending on the degree of removal required, processes such as conventional flocculationwith ferric salts, or more sophisticated processes such as ion exchange resins may be used.
The Effects of Uranium
Norms The different norms used in the guideline to assess the effects of uranium on irrigationwater use are summarised below:

Agricultural Water Use: Irrigation 2nd Edition, 1996 (1st Issue) Uranium: Page 3 of 4
179
Irrigation Water Uses Norms for Measuring WaterQuality Effects
Application to commercial crops ! Crop yield as affected by crop sensitivityto uranium uptake through plant roots
Application to sustain suitability ! Accumulation in soil to concentrationsof irrigated soil where either crop yield or crop quality is
affected
Maintenance of irrigation ! No known effectsequipment
Effects Uranium is taken up by plants through their roots. Uranium commonly accumulates withinthe roots of plants. It has been reported that vegetables can concentrate uranium to levelswhich are a 100 times that of the irrigation water. Reduction of wheat yields by 50 % uponaddition of 50 mg/kg uranium, and no effect on yield at 10 mg/kg have been shown.
Mitigation Common on-farm management practices to mitigate against uranium uptake by plants onirrigated land, are to
! apply agricultural lime in order to raise (or maintain) soil pH to neutral to slightlyalkaline; and/or
! switch to a crop that is more tolerant to uranium.
Criteria Effects of Uranium on Crop Yield and Soil Sustainability
Concentration Crop Yield Range (mg/RR)
Target Water Plant yield remains unaffected at uranium concentrationsQuality Range < 10 mg/kg in soil
# 0.01
0.01 - 0.10 Maximum acceptable concentration for fine-textured neutral toalkaline soils
> 0.10 Acceptable for irrigation only over the short term on a site-specific basis
Note:
! The TWQR for relatively unrestricted use on all soils, and the concentrationrange for fine-textured neutral to alkaline soils for irrigation periods of up to20 years, are similar to the few existing international criteria.
! The above criteria are based on limited information and should be viewed astentative.
! The criteria are calculated to ensure soil sustainability for continued cropproduction.

Agricultural Water Use: Irrigation 2nd Edition, 1996 (1st Issue) Uranium: Page 4 of 4
180
Modifications ! The criteria were derived with the assumption that the soil to be irrigated contains onlynegligible quantities of uranium. Should this not be the case, the period of irrigationneeds to be reduced accordingly.
! The criteria may not protect commercial floricultural crops grown in greenhouseswithout soil (hydroponic or similar methods) because the criteria assume that the soilhas a capacity to deactivate uranium.
! Should the site-specific conditions vary significantly from the assumptions that wereused to derive the criteria, the criteria may need adjustment.
! Potted plants normally receive water applications in excess of the assumptions used toderive the criteria. Since potted plants are only grown for limited periods, the criteriaapplicable to fine-textured neutral to alkaline soils, can mostly be used.
Sources of Information
CANADIAN GUIDELINES 1987. Canadian Water Quality Guidelines. Prepared by theTask Force on Water Quality Guidelines of the Canadian Council of Resource andEnvironment Ministers. Canada.
BERMAN E. 1980. Toxic Metals and Their Analysis. Heyden, London.
BOWEN H.J.M. 1979. Environmental Chemistry of the Elements. Academic Press,London.
DEPARTMENT OF WATER AFFAIRS AND FORESTRY 1993. South African WaterQuality Guidelines, Volume 4: Agricultural Use.
FORD W.E. and E.S. Dana 1963. A Textbook of Mineralogy, 4th Edition. John Wiley &Sons Inc., New York.
HART B.T. 1974. A Compilation of Australian Water Quality Criteria. AWRCTechnical Paper No. 7.
HART B.T., C. Angehrn-Bettinazzi, I.C. Campbell and M.J. Jones 1992. Draft AustralianWater Quality Guidelines. Australian and New Zealand Environment and ConservationCouncil. January 1992.
WEAST R.C. 1979. CRC Handbook of Chemistry and Physics, 60th Edition. CRC PressInc., Boca Raton, Florida, USA.

Agricultural Water Use: Irrigation 2nd Edition, 1996 (1st Issue) Vanadium: Page 1 of 5
181
VanadiumTentative guideline
Background Information
Introduction Vanadium is a white, soft, ductile metal resistant to corrosion. Vanadium occurs in severaloxidation states, namely II, III, IV, and V. Soluble vanadium salts are readily taken up byliving organisms.
Similar to most trace elements, vanadium is adsorbed by soil and plants respond to thevanadium concentration in the soil solution. The addition of vanadium to soils in relativelyhigh concentrations over the short-term, may not result in reduced crop growth or in itsaccumulation in plant parts to concentrations detrimental to humans or animals. However,continuous application over extended periods results in its accumulation in the surface soillayer, in practice the cultivated, or the plough layer.
Occurrence Minerals containing vanadium are widespread and include vanadium sulphide and thecalcium salt of vanadium. Metallic vanadium does not occur in nature. Vanadium(IV) andvanadium(V) salts are generally soluble in water and tend to remain in solution and are notstrongly adsorbed onto soil particles. Compounds of vanadium such as trifluoride, trioxideand trisulphide are insoluble in water and are associated with sediments.
Typically, the concentration of vanadium in
! fresh water is less than 1 Fg/R; and ! sea water is approximately 3 Fg/R.
Vanadium compounds have various industrial applications and are used as catalysts in thechemical industry, in certain glassware and ceramic products, in the textile industry, and inthe manufacture of dyes.
Interactions Vanadium concentrations in the soil solution are influenced by sorption and desorptionreactions with the soil exchange complex. Sorption is expected to dominate at the relativelylow concentrations that are of concern for water quality criteria for irrigation.
Soil pH also has a major effect on the concentration of vanadium in the soil solution. Itssolubility decreases with increasing pH. Because it tends to exist in oxy-anion forms,vanadium is often more mobile in alkaline, oxidised aqueous environments.
Implications for irrigation with water containing vanadium, include the following:
! Vanadium can be expected to be retained in the soil surface layers due to sorption ofvanadium by the soil exchange complex, and in cultivated land it is expected toaccumulate in the plough layer.
! Significant downward movement to below the plough layer and contamination ofgroundwater is unlikely.
! The larger the soil's cation exchange capacity (determined by clay content and claymineral type), the more vanadium can generally be sorbed.

Agricultural Water Use: Irrigation 2nd Edition, 1996 (1st Issue) Vanadium: Page 2 of 5
182
! Soils with a neutral to alkaline pH will be able to tolerate a greater vanadium load thanacidic soils before concentrations in the soil solution become phytotoxic. On the otherhand when vanadium is in the oxyanion form it is commonly mobile in alkaline, oxidisedaqueous environments.
Measurement The criteria are given in terms of the total vanadium concentration in units of mg/R. Thereference method for the determination of vanadium is by atomic absorption spectrometry,using a nitrous oxide-acetylene flame. If other methods are used, their characteristicsrelative to the reference method should be known.
Data Because vanadium is retained by soils, it is likely to accumulate to phytotoxic concentrationsInterpretation before equilibrium between sorption and desorption reactions are established. In order to
prevent its accumulation, the total load applied to soil needs to be limited. Internationalcriteria for the concentration of vanadium in irrigation water have been calculated (usinglimited available information) to ensure that accumulation to either phytotoxic levels orlevels that are toxic to consumers, within a given time period, does not occur. Thecalculations assume that vanadium accumulates within the surface 150 mm of soil. Assuch, the objectives of sustained soil suitability for continued use and maintenance of cropyield and quality are accounted for.
The arithmetic mean concentration of the applied water (preferably application volumeweighted) is given in the criteria for:
! The vanadium concentration that can be applied to any soil on a continuous basis.This concentration is calculated such that vanadium does not accumulate to phytotoxicconcentrations in a soil that is irrigated continuously for up to 100 years at an irrigationapplication rate of 1 000 mm p.a.
! For the vanadium concentration that can be applied to fine-textured, neutral to alkalinesoils for a period of up to 20 years at an irrigation application rate of 1 000 mm p.a.
Treatment It is highly unlikely that vanadium can be economically removed from water intended forOptions irrigation use. However, should it be required, vanadium is removed by raising the pH and
precipitating the insoluble vanadium salts after the addition of lime or iron salts in the pHrange of 8.5 - 11.5. Precipitation is followed by settlement and filtration as in conventionalwater treatment. The precipitation process requires careful monitoring to ensure thatremoval is complete.
To achieve very low residuals, it may be necessary to pass the stream through an ionexchange column charged with the appropriate ions.
A watery vanadium-rich sludge or concentrate stream is generated in the processes that maypresent disposal difficulties.
The Effects of Vanadium
Norms The different norms used in the guideline to assess the effects of vanadium on irrigationwater use are summarised below:

Agricultural Water Use: Irrigation 2nd Edition, 1996 (1st Issue) Vanadium: Page 3 of 5
183
Irrigation water uses Norms for measuring waterquality effects
Application to commercial crops ! Crop yield as affected by cropsensitivity to vanadium uptake throughplant roots.
Application to sustain suitability ! Accumulation in soil to concentrationsof irrigated soil where either crop yield or crop quality is
affected.
Maintenance of irrigation ! No known effectsequipment
Effects Vanadium is not required for plant growth. Vanadium interferes with the uptake of essentialplant nutrients such as calcium, copper, iron, manganese and phosphorus. Depending onplant species and soil type, plant growth appears to be inhibited when vanadiumconcentrations in soil exceed 10 mg/kg. Plant toxicity has also been recorded atconcentrations exceeding 0.5 mg/R in nutrient solutions.
Mitigation Common on-farm management practices to mitigate against vanadium uptake by plants onirrigated land, are to
! apply lime in order to raise (or maintain) soil pH to neutral to slightly alkaline conditions;and/or
! switch to a crop that is more tolerant to vanadium.
Criteria Effects of Vanadium on Crop Yield and Soil Sustainability
Concentration Crop Yield and Soil SustainabilityRange (mg/RR)
Target Water Plant yield appears to be affected at vanadiumQuality Range concentrations exceeding 10 mg/kg in soil
# 0.10
0.10 - 1.0 Maximum acceptable concentration for fine-textured neutral toalkaline soils
> 1.0 Acceptable for irrigation only over the short term on a site-specific basis
Note:
! The above criteria are based on relatively limited information and should beviewed as tentative.
! The criteria are calculated to ensure soil sustainability for continued crop

Agricultural Water Use: Irrigation 2nd Edition, 1996 (1st Issue) Vanadium: Page 4 of 5
184
production.
Modifications ! The criteria were derived with the assumption that the soil to be irrigated contained onlynegligible quantities of vanadium. Should this not be the case the period of irrigationneeds to be reduced accordingly.
! The criteria may not protect commercial floricultural crops grown in greenhouseswithout soil (hydroponic or similar methods), because it is assumed that the soil has acapacity to deactivate vanadium.
! Should the site-specific conditions vary significantly from the assumptions that wereused to derive the criteria, they may need adjustment.
! Potted plants normally receive water applications in excess of the assumptions used toderive the criteria. Since potted plants are, however, grown for only limited periods,the criteria applicable to fine-textured neutral to alkaline soils, can mostly be used.

Agricultural Water Use: Irrigation 2nd Edition, 1996 (1st Issue) Vanadium: Page 5 of 5
185
Sources of Information
APHA 1989. Standard Methods for the Examination of Water and Waste Water, 17thEdition. American Public Health Association, American Water Works Association, WaterPollution Control Federation. Published by the American Public Health Association,Washington DC, USA.
AYERS R.S. and D.W. Westcott 1985. Water Quality for Agriculture, FAO Irrigation andDrainage Paper, No. 29. FAO, Rome
BERMAN E. 1980. Toxic Metals and Their Analysis. Heyden, London.
BOWEN H.J.M. 1979. Environmental Chemistry of the Elements. Academic Press,London.
CANADIAN GUIDELINES 1987. Canadian Water Quality Guidelines. Prepared by theTask Force on Water Quality Guidelines of the Canadian Council of Resource andEnvironment Ministers. Canada.
DEPARTMENT OF WATER AFFAIRS AND FORESTRY 1993. South African WaterQuality Guidelines, Volume 4: Agricultural Use.
DEVEREAL S.J. and R. Fujii 1990. Chemistry of Trace Elements in Soils and GroundWater. In: Agricultural Salinity Assessment and Management, K.K. Tanjii (Ed.). ASCEManuals and Reprints on Engineering Practice No. 71. ASCE New York 1990.
HART B.T., C. Angehrn-Bettinazzi, I.C. Campbell and M.J. Jones 1992. Draft AustralianWater Quality Guidelines. Australian and New Zealand Environment and ConservationCouncil. January 1992.
McKEE J.E. and H.W. Wolf 1963. Water Quality Criteria, 2nd Edition. California StateWater Resources Control Board, Publication No. 3-A. California.
PRATT P.F. and D.L. Saurez 1990. Irrigation Water Quality Assessments. In:Agricultural Salinity Assessment and Management. K.K. Tanjii (Ed.). ASCE Manuals andReports on Engineering Practice No. 71. ASCE New York 1990.
UNDERWOOD E.J. 1977. Trace Elements in Human and Animal Nutrition, 4th Edition.Academic Press, New York, USA.
WEAST R.C. 1979. CRC Handbook of Chemistry and Physics, 60th Edition. CRC PressInc., Boca Raton, Florida, USA.

186

Agricultural Water Use: Irrigation 2nd Edition, 1996 (1st Issue) Zinc: Page 1 of 5
187
ZincTentative Guideline
Background Information
Introduction Zinc is a metallic element. The stable oxidation states of zinc are the metal (0) and the II+
oxidation state, which is the form found in nature. The carbonate, hydroxide and oxideforms of zinc are relatively resistant to corrosion, and zinc has many applications.
Zinc is an essential nutritional trace element for plants and animals. Plants respond to thezinc concentration in the soil solution. Similar to most trace elements, zinc is stronglyadsorbed by soil and the addition thereof in relatively high concentrations over the shortterm, may not result in reduced crop growth. However, with continuous applications of zincover extended periods accumulation occurs in the surface soil layer, the cultivated, orplough layer.
Occurrence The most common mineral form of zinc is the sulphide (sphalerite). Zinc is also found asa carbonate, oxide or silicate and may occur in association with many other metal ores suchas copper and arsenic. The chloride, sulphate and nitrate salts of zinc are highly soluble inwater, but at neutral and alkaline pH tend to hydrolyse to form relatively insolublehydroxides which tend to be associated with sediments. On acidification of the water, theinsoluble hydroxides are released back into the dissolved phase. If the water is acidic, zincleaching caused by dissolution of the protective zinc hydroxide layer of galvanised pipingcan give rise to relatively high concentrations of zinc in solution. The concentration of zinc in water is usually low, typically around 0.015 mg/R. Elevatedzinc concentrations at neutral and alkaline pH arise where zinc occurs largely as a colloidalsuspension of zinc hydroxide which imparts a milky white appearance to the water. In seawater the zinc concentration is also very low, typically around 0.005 mg/R. Zinc and zinc salts are used in many industrial processes. Zinc itself is extensively used ingalvanising processes and in alloys. Zinc salts are used in paint pigments, in cosmetics andin the manufacture of pharmaceuticals, dyes and insecticides.
Interactions The soil chemical behaviour of zinc is similar to those of cadmium, lead, copper and nickel.The zinc concentration in the soil solution is largely determined by sorption and desorptionreactions with the soil. Sorption dominates at the relatively low concentrations that are ofconcern for water quality criteria for irrigation. Soil pH has a major effect on theconcentration of zinc in the soil solution. Its solubility decreases with increasing pH. Zincis relatively strongly bound to even coarse-textured soils, and little is known about thefactors which affect the release of zinc. Due to the formation of sulphides, zinc has a verylow solubility under reducing conditions.
Implications for irrigation with water containing zinc, include the following:
! Zinc can be expected to be retained in the soil surface layers due to strong sorption ofzinc by soil, and accumulates in the plough layer of cultivated land.
! Significant downward movement of zinc to below the plough layer and hencecontamination of groundwater is unlikely.

Agricultural Water Use: Irrigation 2nd Edition, 1996 (1st Issue) Zinc: Page 2 of 5
188
! The larger the soil's cation exchange capacity (determined by clay content and claymineral type) the more zinc can generally be sorbed.
! Soils with a neutral to alkaline pH will be able to accept a greater zinc load than acidicsoils before concentrations in the soil solution becomes phytotoxic.
Measurement The criteria are given in terms of the total zinc concentration in units of mg/R. Total zincis measured after acidification of the sample by atomic absorption spectrometry, which isthe reference method. If other methods are used, their characteristics relative to thereference method should be known.
Data Due to zinc being retained strongly by soils, it is likely to accumulate to phytotoxicInterpretation concentrations before equilibrium between sorption and desorption reactions is reached.
In order to prevent accumulation to phytotoxic concentrations, which would also render thesoil unsuitable for continued crop production, the total load of zinc applied to soil needs tobe limited. International criteria for the concentration of zinc in irrigation water have beencalculated to ensure that accumulation to either phytotoxic concentrations or levels that aretoxic to consumers, within a given time period, do not occur. The calculations assume thatzinc accumulates within the top 150 mm of soil. As such, the objectives of sustained soilsuitability for continued use and maintaining crop yield and quality are accounted for.
The arithmetic mean concentration of the applied water (preferably application volumeweighted) is given in the criteria for: ! The zinc concentration that can be applied to any soil on a continuous basis. This
concentration is calculated to ensure that zinc does not accumulate to phytotoxicconcentrations in a soil that is irrigated continuously for up to 100 years at an irrigationapplication rate of 1 000 mm p.a.
! The zinc concentration that can be applied to fine-textured, neutral to alkaline soils fora period of up to 20 years at an irrigation application rate of 1 000 mm p.a.
Treatment It is highly unlikely that zinc can be economically removed from water intended forOptions irrigation use. However, should it be required, zinc is removed by raising the pH and
precipitating the insoluble zinc hydroxide with lime treatment in the pH range of 9.5 - 10.0.The precipitation is followed by settlement and filtration as in conventional water treatment.
The precipitation process requires careful monitoring to ensure that removal is complete.A watery zinc-rich sludge is generated in the process; this may present disposal difficulties.
The Effects of Zinc
Norms The different norms used in the guideline to assess the effects of zinc on irrigation wateruse are summarised below:

Agricultural Water Use: Irrigation 2nd Edition, 1996 (1st Issue) Zinc: Page 3 of 5
189
Irrigation Water Uses Norms for Measuring WaterQuality Effects
Application to commercial crops ! Crop yield as affected by crop sensitivityto zinc uptake through plant roots
Application to sustain suitability ! Accumulation in soil to concentrationsof irrigated soil where crop is affected
Maintenance of irrigation ! No known effectsequipment
Effects Zinc is an essential plant nutrient that is required in small amounts. At higher concentrationsit causes toxic responses by inducing iron deficiency. Toxicity appears to be induced atconcentrations of 0.3 - 10 mg/R (depending on the type of plant) in nutrient solutions.Symptoms of zinc toxicity include iron chlorosis, reduced leaf size, necrosis of tips anddistortion of foliage. Since irrigated soils are often alkaline, the low solubility of zinc underthese conditions often leads to the development of plant zinc deficiencies.
Mitigation Common on-farm management practices to mitigate against excessive zinc uptake by plantson irrigated land, are to
! apply agricultural lime in order to raise (or maintain) soil pH to neutral to slightlyalkaline; and/or
! apply huge quantities of organic material; and/or
! switch to a crop that is more tolerant to zinc.
Criteria Effects of Zinc on Crop Yield and Soil Sustainability
Concentration Crop Yield and Soil SustainabilityRange (mg/RR)
Target Water Toxic to many plants at concentration of 1 mg/R andQuality Range less in nutrient solutions. The TWQR should protect
# 1.0 most plants from absorbing toxic concentrations ofzinc, even when grown on acid sandy soils
1.0 - 5.0 Maximum acceptable as concentration for fine-texturedneutral to alkaline soils
> 5.0 Acceptable for irrigation only over the short term on asite-specific basis
Note:
! The TWQR for relatively unrestricted use on all soil types and theconcentration range for fine-textured neutral to alkaline soils for periods of upto 20 years use, are similar to the most conservative of the internationalcriteria. Higher concentrations may apply on a site-specific basis.

Agricultural Water Use: Irrigation 2nd Edition, 1996 (1st Issue) Zinc: Page 4 of 5
190
! The above criteria are based on relatively limited information and should beviewed as tentative.
! The criteria are calculated to ensure soil sustainability for continued cropproduction.
Modifications ! The criteria were derived with the assumption that the soil to be irrigated contains onlynegligible quantities of zinc. Should this not be the case the period of irrigation needsto be reduced accordingly.
! The criteria may not be protective for commercial floricultural crops grown ingreenhouses without soil (hydroponic or similar methods) because it is assumed that thesoil has a capacity to deactivate zinc.
! Should the site-specific conditions vary significantly from the assumptions that wereused to derive the criteria, they may need adjustment.
! Potted plants normally receive water applications in excess of the assumptions used toderive the criteria. Since potted plants are only grown for limited periods, the criteriaapplicable to fine-textured neutral to alkaline soils, can mostly be used.

Agricultural Water Use: Irrigation 2nd Edition, 1996 (1st Issue) Zinc: Page 5 of 5
191
Sources of Information
AYERS R.S. and D.W. Westcott 1985. Water Quality for Agriculture. FAO Irrigationand Drainage Paper No. 29. FAO Rome.
BERMAN E. 1980. Toxic Metals and Their Analysis. Heyden, London.
BOWEN H.J.M. 1979. Environmental Chemistry of the Elements. Academic Press,London.
CANADIAN GUIDELINES 1987. Canadian Water Quality Guidelines. Prepared by theTask Force on Water Quality Guidelines of the Canadian Council of Resource andEnvironment Ministers. Canada.
DEPARTMENT OF WATER AFFAIRS AND FORESTRY 1993. South African WaterQuality Guidelines, Volume 4: Agricultural Use.
DEVEREAL S.J. and R. Fujii 1990. Chemistry of Trace Elements in Soils and GroundWater: Agricultural Salinity Assessment and Management, Ed: KK Tanjii. ASCEManuals and Reprints on Engineering Practice No. 71. ASCE New York 1990.
HART B.T. 1974. A Compilation of Australian Water Quality Criteria. AWRCTechnical Paper No. 7.
HART B.T., C. Angehrn-Bettinazzi, I.C. Campbell and M.J. Jones 1992. Draft AustralianWater Quality Guidelines. Australian and New Zealand Environment and ConservationCouncil. January 1992.
McKEE J.E. and H.W. Wolf 1963. Water Quality Criteria, 2nd Edition. California StateWater Resources Control Board, Publication No. 3-A. California.
PAGE A.L. and A.C. Chang 1990. Deficiencies and Toxicities of Trace Elements:Agricultural Salinity Assessment and Management, Ed: KK Tanjii. ASCE Manuals andReprints on Engineering Practice No. 71. ASCE New York 1990.
PRATT P.F. and D.L. Suarez 1990. Irrigation Water Quality Assessments: AgriculturalSalinity Assessment and Management, Ed: KK Tanjii. ASCE Manuals and Reports onEngineering Practice No. 71. ASCE New York 1990.

192

Chapter 6
Glossaries
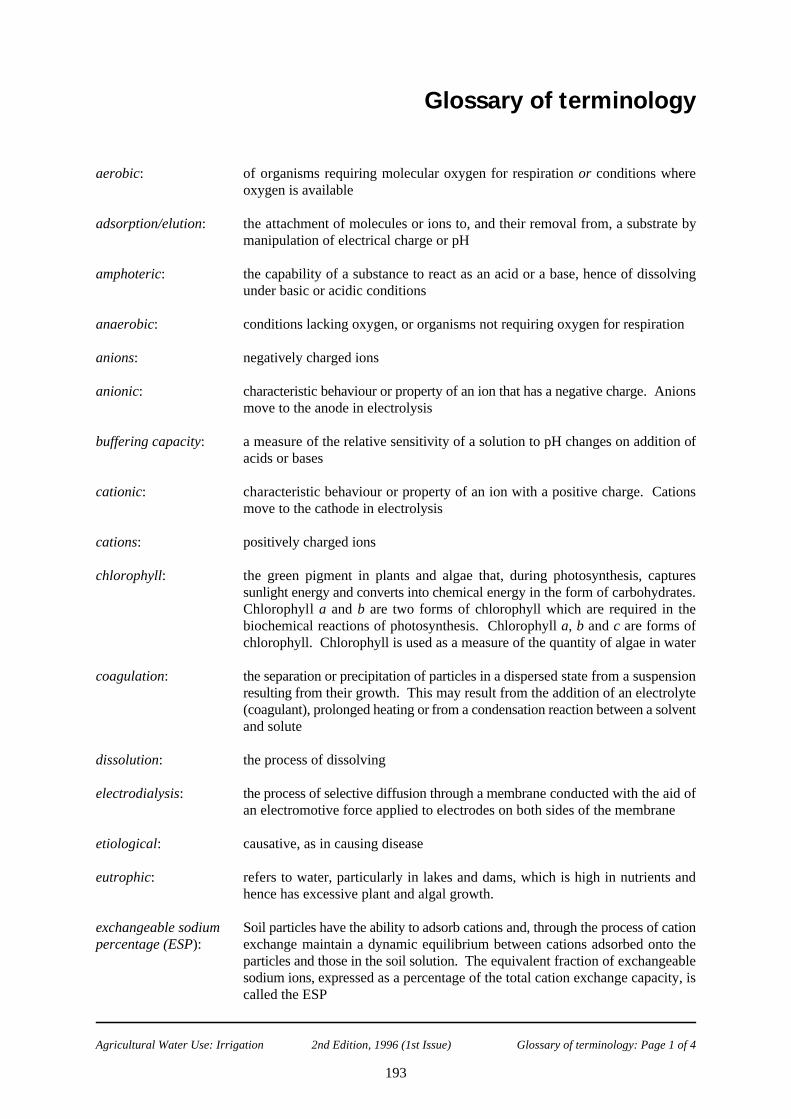
Agricultural Water Use: Irrigation 2nd Edition, 1996 (1st Issue) Glossary of terminology: Page 1 of 4
193
Glossary of terminology
aerobic: of organisms requiring molecular oxygen for respiration or conditions whereoxygen is available
adsorption/elution: the attachment of molecules or ions to, and their removal from, a substrate bymanipulation of electrical charge or pH
amphoteric: the capability of a substance to react as an acid or a base, hence of dissolvingunder basic or acidic conditions
anaerobic: conditions lacking oxygen, or organisms not requiring oxygen for respiration
anions: negatively charged ions
anionic: characteristic behaviour or property of an ion that has a negative charge. Anionsmove to the anode in electrolysis
buffering capacity: a measure of the relative sensitivity of a solution to pH changes on addition ofacids or bases
cationic: characteristic behaviour or property of an ion with a positive charge. Cationsmove to the cathode in electrolysis
cations: positively charged ions
chlorophyll: the green pigment in plants and algae that, during photosynthesis, capturessunlight energy and converts into chemical energy in the form of carbohydrates.Chlorophyll a and b are two forms of chlorophyll which are required in thebiochemical reactions of photosynthesis. Chlorophyll a, b and c are forms ofchlorophyll. Chlorophyll is used as a measure of the quantity of algae in water
coagulation: the separation or precipitation of particles in a dispersed state from a suspensionresulting from their growth. This may result from the addition of an electrolyte(coagulant), prolonged heating or from a condensation reaction between a solventand solute
dissolution: the process of dissolving
electrodialysis: the process of selective diffusion through a membrane conducted with the aid ofan electromotive force applied to electrodes on both sides of the membrane
etiological: causative, as in causing disease
eutrophic: refers to water, particularly in lakes and dams, which is high in nutrients andhence has excessive plant and algal growth.
exchangeable sodium Soil particles have the ability to adsorb cations and, through the process of cationpercentage (ESP): exchange maintain a dynamic equilibrium between cations adsorbed onto the
particles and those in the soil solution. The equivalent fraction of exchangeablesodium ions, expressed as a percentage of the total cation exchange capacity, iscalled the ESP

Agricultural Water Use: Irrigation 2nd Edition, 1996 (1st Issue) Glossary of terminology: Page 2 of 4
194
flocculation: the addition of chemical reagents (flocculants) to bring small particles together inflocs through the process of coagulation, aggregation or biochemical reaction offine suspended particles
halophytie: a salt-tolerant plant
hard water: water that contains high concentrations of calcium, magnesium, and to a lesserextent other alkaline earth metal ions, in solution. Under highly alkalineconditions, the calcium and magnesium of hard waters may precipitate out asscale or as some other insoluble salt of these two metal ions
hardness: defined as the sum of the calcium and magnesium concentrations, both expressed ascalcium carbonate, in milligrams per litre
hygroscopic: a substance that absorbs water
indole-positive: means producing a positive reaction in a biochemical test for the production ofindole
ion exchange: the interchange of ions of like charge, usually on a solid medium; used in watertreatment, such as water softening
lignin: an organic polymer providing strengthening and thickening in plant cell walls.The properties of wood are due to the encrustation of plant cell walls with lignin
macrophyte: any macroscopic form of aquatic vegetation: encompasses certain species ofalgae, mosses and ferns as well as aquatic vascular plants
mesotrophic: a term applied to freshwater bodies that contain moderate quantities of plantnutrients and are therefore moderately productive
microbes: microscopic organisms such as bacteria or viruses
mucilaginous: the tacky or slimy property of extracellular substances secreted by certain groupsof bacteria, such as the slime-producing bacteria
necrosis: the death of cells or tissues
occlusion: blockage
osmoregulation: the regulation of the osmotic pressure of body fluids by controlling the amountof water and/or salts in the body
osmosis: the diffusion of a solvent, usually water, through a semi-permeable membrane,into a more concentrated solution
pathogenic: refers to causing disease
permeability: the condition of allowing the passing of fluid molecules through a particularmedium such as soil, etc.
photosynthesis: the trapping of solar energy and its conversion to chemical energy by plants andalgae, which use the energy in manufacturing food molecules from carbon dioxideand water

Agricultural Water Use: Irrigation 2nd Edition, 1996 (1st Issue) Glossary of terminology: Page 3 of 4
195
physico-chemical: refers to the physical (e.g. pH, temperature, electrical conductivity) and chemical(e.g. concentrations of nitrate, mercury) characteristics of water
point of supply: that point in an industrial operation where water is obtained for use in variousindustrial processes
polyvalent metallic ions of metals having more than one oxidation state e.g. Cr(III) and Cr(VI)ions:
raw water: source water in its untreated state
redox potential: an expression of the oxidising or reducing power of a solution relative to areference potential. This potential is dependent on the nature of the substancesdissolved in the water, as well as on the proportion of their oxidised and reducedcomponents
reducing conditions: conditions prevailing within an aquatic environment in which the redoxpotential is such that substances become reduced
reverse osmosis: a technique in the desalination of water in which pressure is applied to the surfaceof the saline solution, forcing pure water to pass through a semi-permeablemembrane which prevents the passage of other ions
salinity: a measure of the salt content of soil or water
scaling: the formation of a dense coating of predominantly inorganic material formed fromthe precipitation of water soluble constituents. The most common substancesforming scale are carbonates and sulphates of calcium and magnesium hydroxide
sodicity: a qualitative term referring to the sodium content of water or soil (refer also tosodium adsorption ratio (SAR) and exchangeable sodium percentage)
sodium adsorption the ratio between soluble sodium and soluble divalent cations in water or soilratio (SAR): extracts, which can be used to predict the relative activity of sodium ions in
exchange reactions with soil
supersaturation: refers to a solution containing more solute than equilibrium conditions will allow;unstable to the addition of solute crystals
surficial deposits: are unconsolidated alluvial, residual or glacial deposits overlying bedrock oroccurring on or near the surface of the earth
treatment breakthrough: the occurrence of contaminants in final water after treatment as a result of failureof a component of the treatment process. This is usually an isolated event witha clearly definable cause and effect, e.g. appearance of bacteria in treated wateras a result of failure of chlorination
valency: the number of electrons required to be gained or lost by an atom to reach a statewhere the outermost electron shell is full
vascular plants: plants with woody conducting vessels

Agricultural Water Use: Irrigation 2nd Edition, 1996 (1st Issue) Glossary of terminology: Page 4 of 4
196

Agricultural Water Use: Irrigation 2nd Edition, 1996 (1st Issue) Glossary of abbreviations/acronyms: Page 1 of 2
197
Glossary of abbreviations / acronyms
APHA American Public Health Association
ASCE American Society of Civil Engineers
AWWA American Water Works Association
BOD biological oxygen demand
COD chemical oxygen demand
CSIR Council for Scientific and Industrial Research
DOC dissolved organic carbon
EC electrical conductivity
EC European Community - in this document, the European Community (EC) is referred to assuch when discussing it as an economic/political entity. It is referred to the EuropeanEconomic Community (EEC) when directly citing a Directive promulgated prior to thechange from EEC to EC, formally in 1992.
EEC European Economic Community
EDTA ethylenediamine tetra-acetic acid
ESP exchangeable sodium percentage
GAC granular activated carbon
HC hydraulic conductivity
HOCl hypochlorous acid
HPLC high performance liquid chromatography
IAWPRC International Association for Water Pollution Research and Control
IR infiltration rate
NAS/NAE National Academy of Sciences/National Academy of Engineering (USA)
PVA polyvinyl alcohols
SAR sodium adsorption ratio
TDS total dissolved solids
TOC total organic carbon
TWQR Target Water Quality Range

Agricultural Water Use: Irrigation 2nd Edition, 1996 (1st Issue) Glossary of abbreviations/acronyms: Page 2 of 2
198
US EPA United States Environmental Protection Agency
WHO World Health Organisation

Agricultural Water Use: Irrigation 2nd Edition, 1996 (1st Issue) Glossary of units of measure: Page 1 of 1
199
Glossary of units of measure
kg/h kilograms per hectare
µg/RR micrograms per litre
µS/cm micro-Siemens per centimetre
meq/RR milli-equivalents per litre
mg/RR milligrams per litre
mM/RR millimoles per litre
mS/m milli-Siemens per metre
ng/RR nanograms per litre
nm nanometre
EEC degrees centigrade