south africa: the economics of nuclear energy russia · south africa’s planned nuclear energy...
TRANSCRIPT
Copyright © 2016 Trusted Sources UK Ltd. All rights reserved. www.trustedsources.co.uk
Russia
Overview
Over the past year, political momentum has been building in South Africa behind the plan to
build a modern fleet of nuclear power plants (NPPs) with aggregate capacity of nearly 10GW. At
the same time, the plan remains the subject of lively debate, much of which is focused on the
affordability for South Africa of the substantial cost of as much as US$50 billion. Against this
background, this report considers some of the economic implications were this nuclear energy
initiative to go ahead. First, we estimate the cost of nuclear generated electricity. We then model
the extent of the resulting reduction in CO2 emissions. A further modelling exercise is focused
on the impact on economic growth in South Africa economy from varying degrees of
localization of the investment involved in building nuclear power capacity on the scale
envisaged.
Main findings
Applying the IEA’s method and formula for the “levelised cost of electricity” (LCOE) –
that is, the average lifetime cost of generating electricity using different fuels over the life
of the corresponding technologies – the resulting estimate of the nuclear LCOE compares
favourably with the current cost of coal-fired generation (US$86.88/MWh in our base
case vs the IEA’s estimate for coal of US$99.79/MWh at the same cost of capital).
South Africa’s planned nuclear energy development would reduce carbon emissions
compared to the business-as-usual baseline by 21 per cent. A monetary value may be put
on this reduction based on carbon tax rates. That value would be around US5 billion
assuming a modest tax rate of US$5/tonne that may seem suitable for a developing
country, rising to about US$22 billion if South Africa were to introduce a carbon tax
close to conservative forecasts of future European levels – around €20/tonne. These
values apply to our modelling period out to 2040 but would be higher in practice since
the NPPs’ useful life would continue for another three decades.
The localization of a portion of the investment in the envisaged NPP new builds would
produce a positive shock for South African industry and economic growth. At the highest
plausible localization level of 45 per cent, the multiplier effect of this industrial
investment on GDP would be 3.4x, and the monetary value of the incremental value
added in current US dollars would be over US$77 billion (about one quarter of the
country’s current GDP).
South Africa: The economics of nuclear energy
March 2016

Copyright © 2016 Trusted Sources UK Ltd. All rights reserved. www.trustedsources.co.uk 2
South Africa: Nuclear economics – March
2016 20162016Outlook
Report
Policy background
In GDP terms, South Africa is the second largest economy in Africa – but it has the highest
energy consumption on the continent, accounting for about 30 per cent of total primary energy
consumption in Africa. Its economy is heavily reliant on the energy-intensive coal mining
industry, as coal accounts for about 72 per cent of the country's total primary energy
consumption – and over 90 per cent of electricity generation. This heavy dependence on coal has
led the country to become Africa’s leading emitter of carbon dioxide (CO2, the single most
important “greenhouse gas”), accounting for 40 per cent of the entire continent’s emissions and
making South Africa the 13th largest emitter in the world, according to the latest (2012) EIA
estimates.
Following the 2009 climate change Summit in Copenhagen at which President Zuma pledged
ambitious reductions in CO2 emissions on condition that South Africa was supported in this goal
by international financial and technology transfers, the Department of Energy released a draft
Integrated Electricity Resource Plan (IERP) for 2010-2030. The IERP forecasts electricity
demand and outlines how this demand might be met in a way that would also lead to secure
energy supplies and reduced CO2 emissions. The IERP calls for 52GW of new electricity
generation capacity by 2030, assuming 3.4GW of demand-side savings owing to the expected
reduced energy intensity of GDP.
This was the first official policy statement which signaled a growing role for nuclear power as
part of the country’s low carbon strategy. The plan foresaw that South Africa’s generation mix
by 2030 should break down as follows: 48 per cent coal; 13.4 per cent nuclear; 6.5 per cent
hydro, 14.5 per cent other renewables, and 11 per cent open cycle gas turbines to meet peak-load
demand. An updated version of this plan published in 2011 increased the projected share of
nuclear to 22 per cent based on the construction of 9.6 GW of new nuclear capacity by 2030.
This nuclear power strategy has moved into a higher gear since 2014. In its annual report to
parliament submitted in October 2015, the Department of Energy reported the completion of
“vendor parades” with five countries: China, France, Russia, South Korea and the US. Following
the completion of the preliminary formality of signing inter-governmental agreements on nuclear
energy with all five of these countries, the Department called in December 2015 for initial
nuclear construction and financing proposals from these potential bidders.
This momentum appeared to be underpinned by a clear reaffirmation of the nuclear energy
strategy by Zuma in his annual State of the Nation Address in February 2015:
“Our plan is to introduce 9,600MW of nuclear energy in the next decade. We will test the market
to ascertain the true cost of building modern nuclear plants. Let me emphasize that we will only
procure nuclear on a scale and pace that our country can afford”.

Copyright © 2016 Trusted Sources UK Ltd. All rights reserved. www.trustedsources.co.uk 3
South Africa: Nuclear economics – March
2016 2016 Outlook
5
Quarterly Report
In the ensuing parliamentary debate on the Address, the Energy Minister Tina Joemat-Pettersson
emphasized the importance of water conservation as a factor underlying the plan to build a fleet
of modern nuclear power plants (NPPs). She noted that Koeberg (South Africa’s one existing
NPP, commissioned in 1984) recycles 22 billion litres of seawater, while Medupi (a coal-fired
power station) uses 17 billion litres of freshwater “that we don’t have enough of.” Her
conclusion was clear: “We simply have to go the nuclear route.”
This clear political momentum behind the nuclear power option co-exists with continuing
debates about the economic rationale for South Africa taking on an investment commitment
likely to be as high as US$50 billion (a concern to which Zuma nodded in his February Address).
Against this background, we take a closer look at the economic case for developing nuclear
energy in South Africa on the scale now envisaged by the authorities.
The following three main sections of this report estimate the cost of nuclear generated electricity,
the extent and benefits of the resulting reduction in CO2 emissions, and the impact on South
Africa’s economy from varying degrees of localization of the investment involved. In each case,
we present our assumptions, method and the results that come out of our models.
Copyright © 2016 Trusted Sources UK Ltd. All rights reserved. www.trustedsources.co.uk 4
South Africa: Nuclear economics – March
2016 20162016Outlook
Report
Levelised cost of electricity
We start by assessing the likely cost of the electricity that would be generated by the ten new
reactors necessary to meet the goal of installing nearly 10GW of nuclear-powered generation
capacity. For this purpose, we use the well-established method developed under the auspices of
the IEA that is designed to estimate the levelised cost of electricity (LCOE). The term
“levelised” captures a key feature of this approach in permitting comparison of the unit costs of
different generation technologies (involving both low-carbon sources and fossil fuels) over their
economic life.
Method & assumptions
To calculate the levelised average lifetime cost of generating electricity from nuclear power in
South Africa, we use the formula used in the IEA publication Projected Costs of Generating
Electricity 2015. This formula breaks down the costs into initial investment, operations and
maintenance, cost of fuel, carbon costs (zero in the case of nuclear) and the cost of capital (or
discount rate).
We posit a staggered timeframe for the construction of each of the ten planned reactors during
the overall period 2018-40. The LCOE is calculated for each reactor then a blended final figure
is arrived at based on the average NPP lifetime.
Detailed Assumptions
Operational parameters
The total cost of building new NPPs with an aggregate capacity of 9.6GW will be US$50
billion.
Building each reactor will take 10 years and construction of the first seven reactors will
be underway by 2020 with 30 per cent of the construction cost of each reactor disbursed
in the first five years from the start of construction.
Once connected to the grid, each plant will operate at 90 per cent of its capacity.
The lifetime of each plant will be 40 years.
Financial parameters
The financial assumptions below use OECD benchmarks for a conservative base case, and a
better case where operational and fuel costs are reduced to a mid-point between the OECD
average and Chinese levels. As for the cost of capital, the better case assumption – while
undercutting the rate implied by the present yields on South African sovereign debt – would stem
from generous vendor finance that may be expected given the competitive pressures in the global
nuclear industry.
Copyright © 2016 Trusted Sources UK Ltd. All rights reserved. www.trustedsources.co.uk 5
South Africa: Nuclear economics – March
2016 2016 Outlook
5
Quarterly Report
Operational and management costs (O&M)
o Base case: US$14.5/MWh
o Better case: US$10.7/MWh
Fuel costs
o Base case: US$10.8/MWh
o Better case: US$9.8/MWh
Cost of capital
o Base case: 10 per cent
o Better case: 7 per cent
Results and discussion
Table 1: LCOE estimates for nuclear-generated electricity in South Africa
USD/MWh
Base case 86.88
Better case 68.21
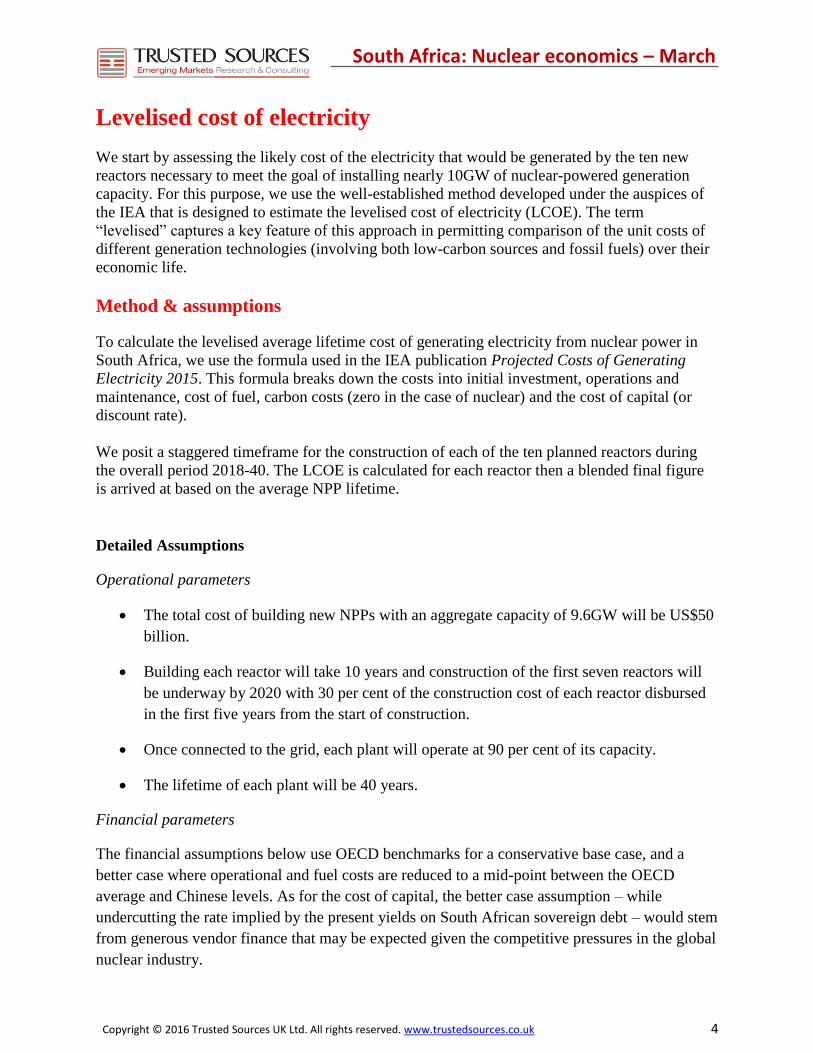
The LCOEs delivered by our model’s base and better cases compare favourably with the IEA
estimates for the current cost of coal-generated electricity shown in Table 2 below extracted from
the above-referenced IEA publication. On this basis, the LCOE of nuclear-generated electricity
would be 13 per cent and 17 per cent lower than coal-fired power at, respectively, a 10 per cent
and 7 per cent cost of capital.
Table 2: Levelised cost of current electricity generation in South Africa
Source: IEA, 2015

Copyright © 2016 Trusted Sources UK Ltd. All rights reserved. www.trustedsources.co.uk 6
South Africa: Nuclear economics – March
2016 20162016Outlook
Report
The comparison with the cost of coal-generated power would have been even more favourable
based on longer-term average coal prices, as the current cost of the fuel is well below that
average as a result of sharp price falls during the present decade. In the future, the underlying
coal price is likely to continue its decline with demand for this most polluting of fuels falling
away as countries strive to reduce emissions. On the other hand, the actual price of coal will, on
the contrary, be increased in countries that introduce meaningful carbon taxation.
Either way, the prospect for coal is one of price volatility: and in this area, nuclear-generated
power has the advantage of offering steady supply at stable prices (assuming only that regulation
of end-user electricity prices maintains a level playing field as between fuels and technologies).
Since South Africa’s nuclear power plans would, if implemented, result in nuclear taking a 20
per cent share of the generation market, it is reasonable to expect that volatility in the overall cost
– and, subject to regulatory decisions, price – of electricity would be reduced by the same 20 per
cent. Reduced volatility in costs and output might be advantageous for the industrial sector, as it
means fewer interruptions in the production process due to electricity shortages. More stable
electricity – in terms both of cost (price) and output – should support existing industrial
capabilities of the country, as well as stimulating further investment in energy intensive
industries.

Copyright © 2016 Trusted Sources UK Ltd. All rights reserved. www.trustedsources.co.uk 7
South Africa: Nuclear economics – March
2016 2016 Outlook
5
Quarterly Report
Low carbon effect
In this section we present the results of modelling the extent of reduction in carbon emissions
that would result from the implementation of South Africa’s announced intention to develop
large scale nuclear energy capacity.
Step-by-step assumptions
The first step in this analysis is to estimate the outlook for electricity consumption. Our starting
assumption here is that per capita consumption will remain steady at the level of a little over
4,600kWh as predicted by a MA (moving average, or ARIMA 001) model. (We rejected the
alternative modelling approach of extrapolating from an historic trend since the increases in
consumption seen in the 1970-80s were driven by the rapid development of electricity supplies at
that time.)
Chart 1: Electric power consumption
This projection shown in Chart 1 above of constant average per capita consumption assumes a
mutually offsetting effect of two drivers: first, on the positive side, increases in per capita
incomes and consumption will include electricity consumption; second, on the negative side, the
adoption of energy efficient technology will reduce the energy intensity of GDP.
Copyright © 2016 Trusted Sources UK Ltd. All rights reserved. www.trustedsources.co.uk 8
South Africa: Nuclear economics – March
2016 20162016Outlook
Report
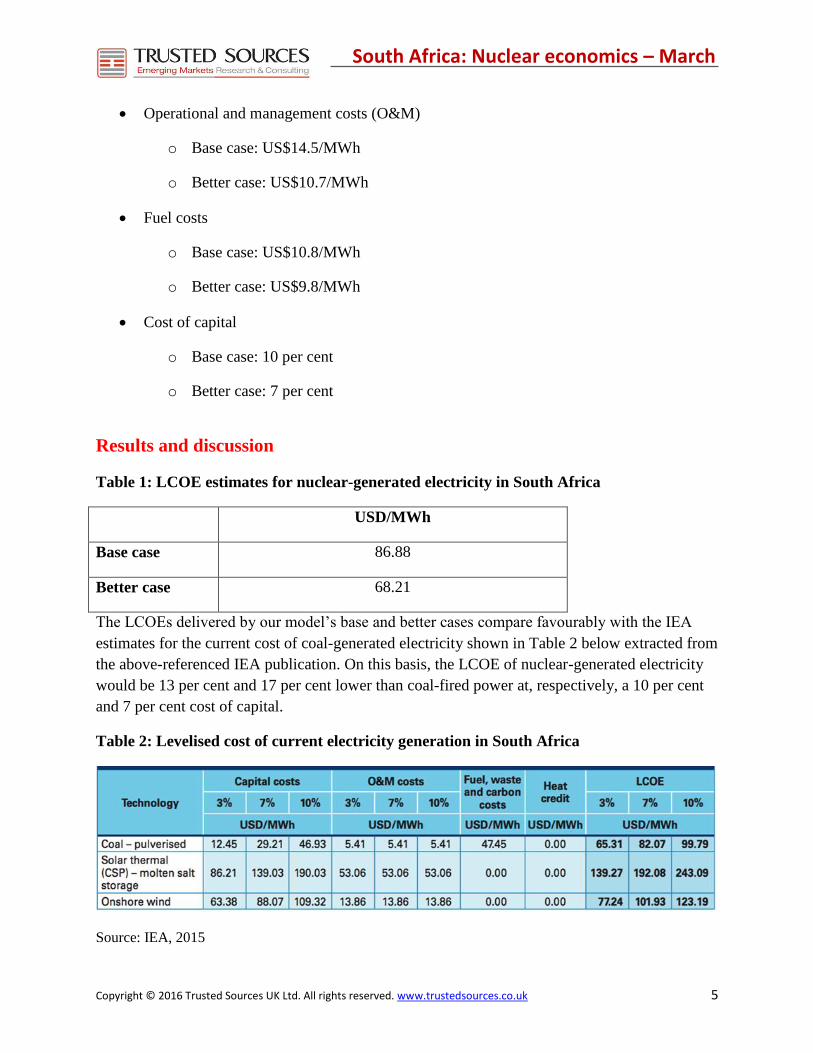
Chart 2: Total electricity demand
Total electricity demand (Chart 2 above) will be the product of this per capita consumption level
and population growth, which was estimated with a simple regression and has a strong trend
component projected well into the future. So a constant linear population growth rate is assumed.
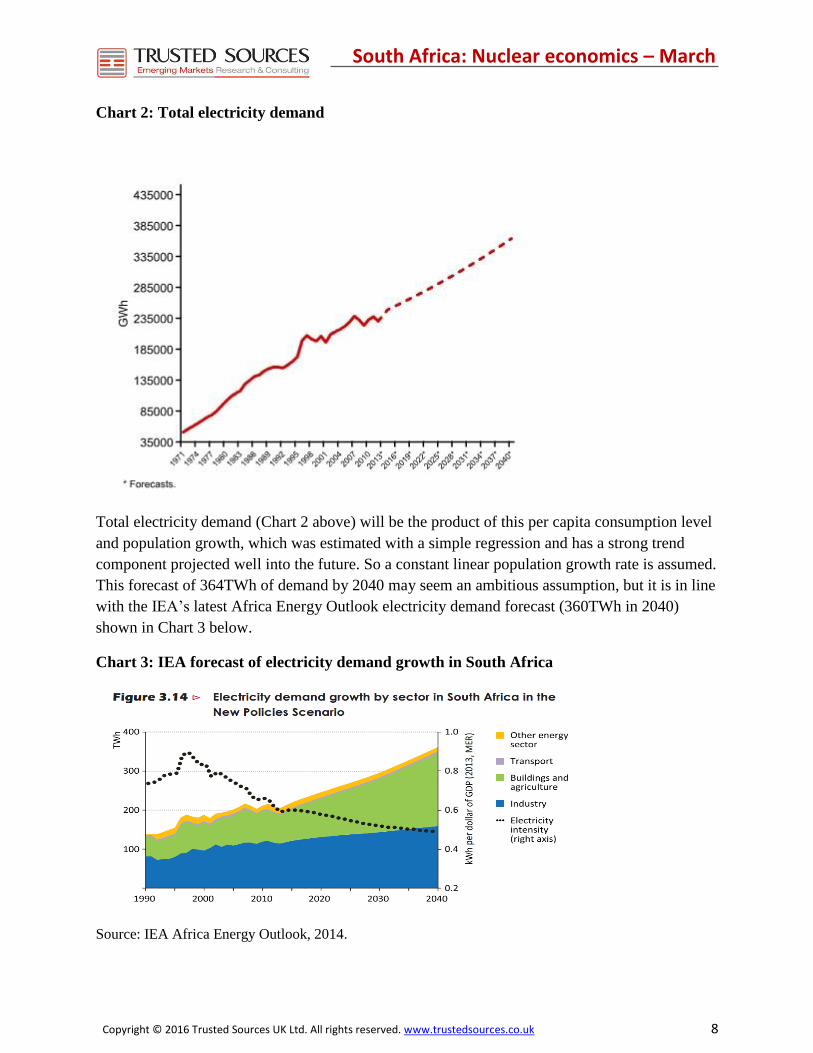
This forecast of 364TWh of demand by 2040 may seem an ambitious assumption, but it is in line
with the IEA’s latest Africa Energy Outlook electricity demand forecast (360TWh in 2040)
shown in Chart 3 below.
Chart 3: IEA forecast of electricity demand growth in South Africa
Source: IEA Africa Energy Outlook, 2014.
Copyright © 2016 Trusted Sources UK Ltd. All rights reserved. www.trustedsources.co.uk 9
South Africa: Nuclear economics – March
2016 2016 Outlook
5
Quarterly Report
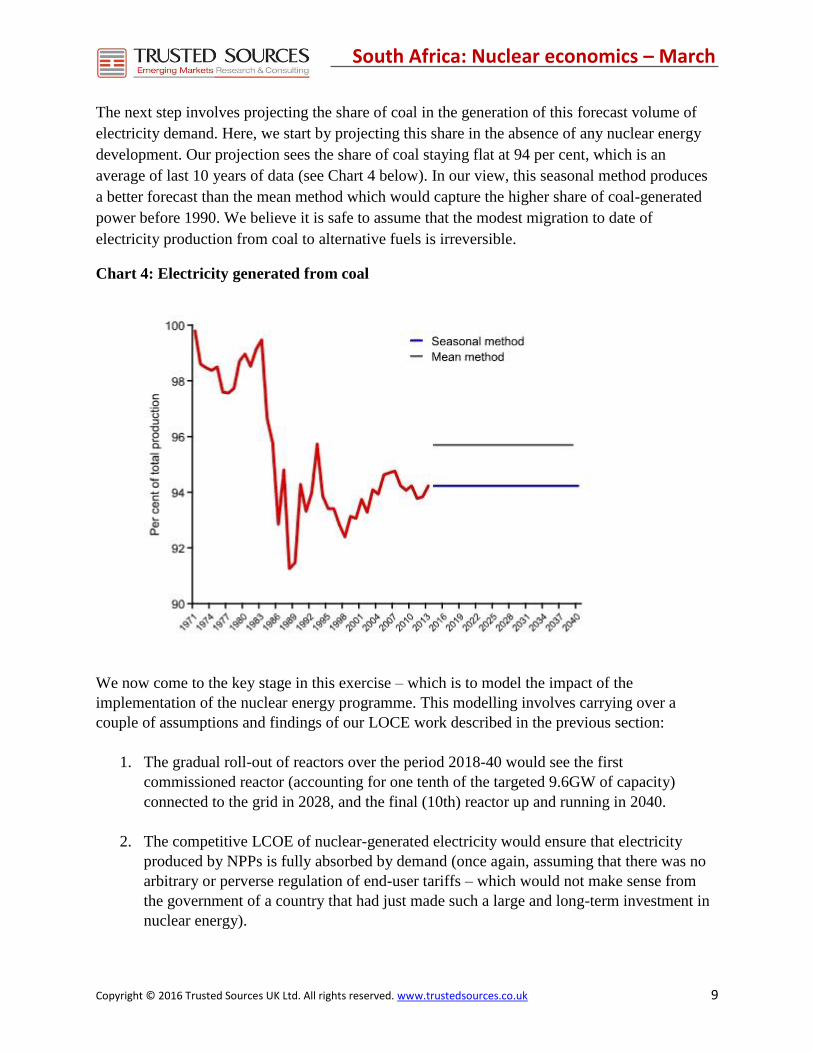
The next step involves projecting the share of coal in the generation of this forecast volume of
electricity demand. Here, we start by projecting this share in the absence of any nuclear energy
development. Our projection sees the share of coal staying flat at 94 per cent, which is an
average of last 10 years of data (see Chart 4 below). In our view, this seasonal method produces
a better forecast than the mean method which would capture the higher share of coal-generated
power before 1990. We believe it is safe to assume that the modest migration to date of
electricity production from coal to alternative fuels is irreversible.
Chart 4: Electricity generated from coal
We now come to the key stage in this exercise – which is to model the impact of the
implementation of the nuclear energy programme. This modelling involves carrying over a
couple of assumptions and findings of our LOCE work described in the previous section:
1. The gradual roll-out of reactors over the period 2018-40 would see the first
commissioned reactor (accounting for one tenth of the targeted 9.6GW of capacity)
connected to the grid in 2028, and the final (10th) reactor up and running in 2040.
2. The competitive LCOE of nuclear-generated electricity would ensure that electricity
produced by NPPs is fully absorbed by demand (once again, assuming that there was no
arbitrary or perverse regulation of end-user tariffs – which would not make sense from
the government of a country that had just made such a large and long-term investment in
nuclear energy).
Copyright © 2016 Trusted Sources UK Ltd. All rights reserved. www.trustedsources.co.uk 10
South Africa: Nuclear economics – March
2016 20162016Outlook
Report
Based on our steady-state projection of the share of coal in power generation, we next assume
that 94 per cent of residual demand (the demand left over after all nuclear electricity had been
consumed) would be met by coal-generated electricity. On this basis, in the scenario where the
NPPs were built, the share of coal in 2040 would be around 75 per cent.
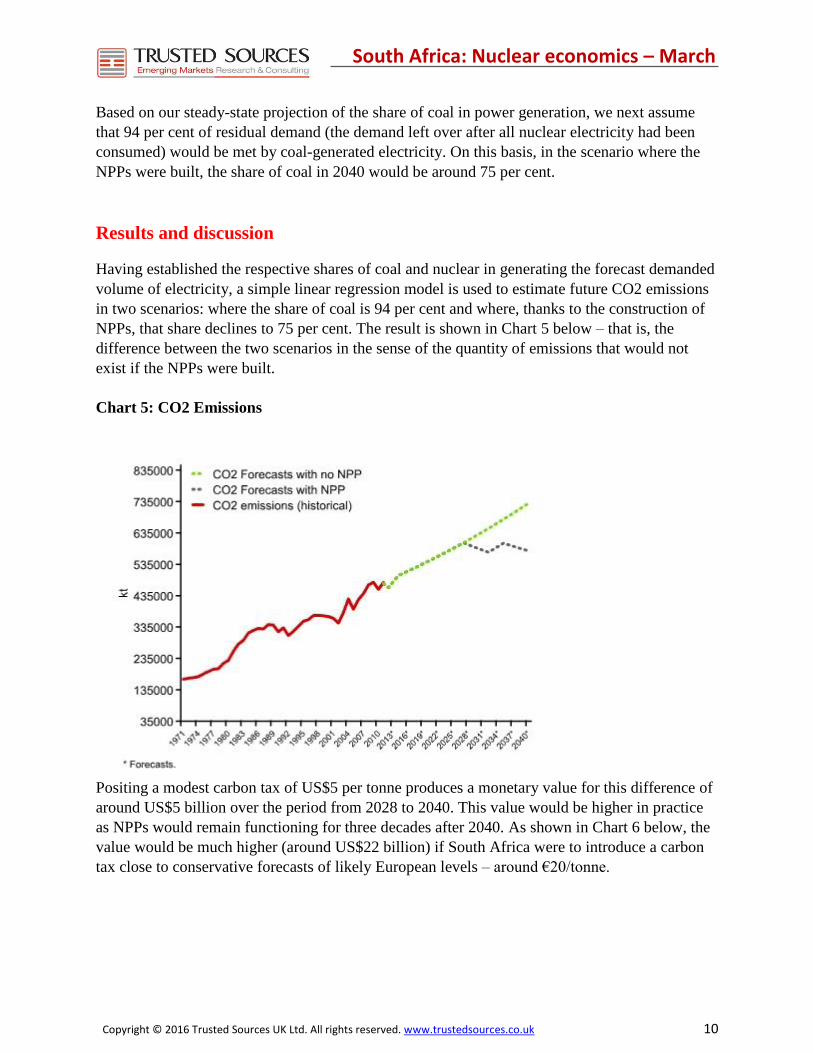
Results and discussion
Having established the respective shares of coal and nuclear in generating the forecast demanded
volume of electricity, a simple linear regression model is used to estimate future CO2 emissions
in two scenarios: where the share of coal is 94 per cent and where, thanks to the construction of
NPPs, that share declines to 75 per cent. The result is shown in Chart 5 below – that is, the
difference between the two scenarios in the sense of the quantity of emissions that would not
exist if the NPPs were built.
Chart 5: CO2 Emissions
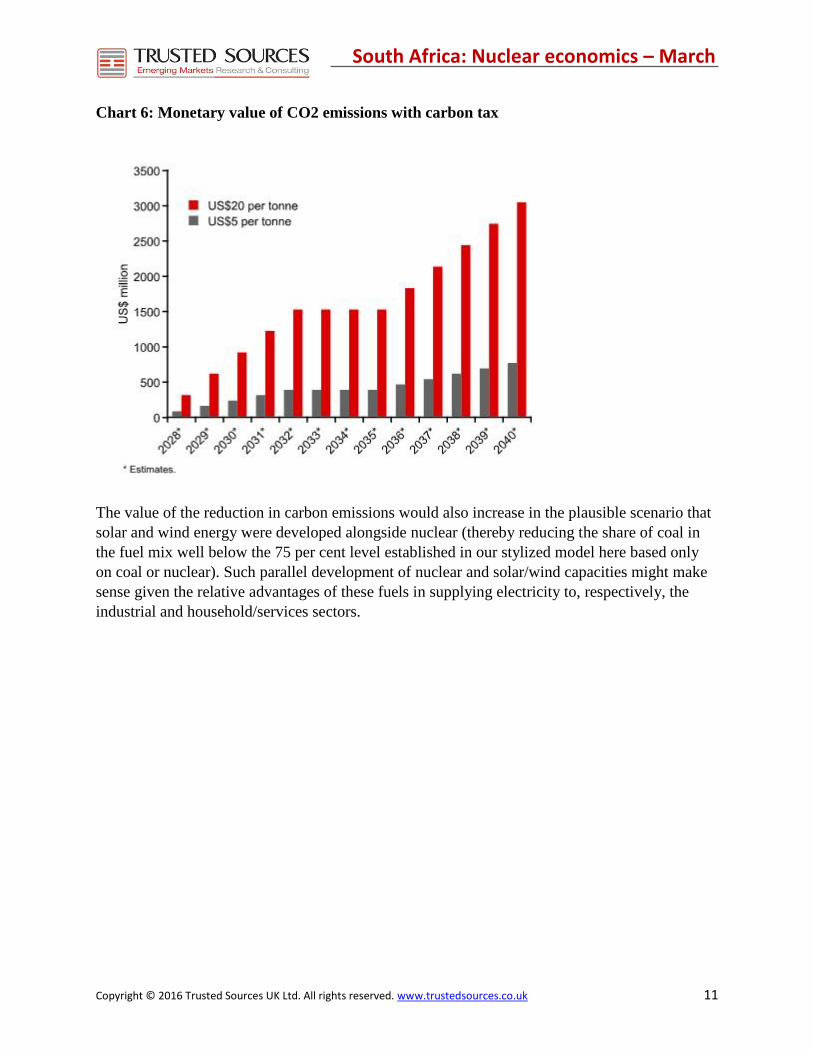
Positing a modest carbon tax of US$5 per tonne produces a monetary value for this difference of
around US$5 billion over the period from 2028 to 2040. This value would be higher in practice
as NPPs would remain functioning for three decades after 2040. As shown in Chart 6 below, the
value would be much higher (around US$22 billion) if South Africa were to introduce a carbon
tax close to conservative forecasts of likely European levels – around €20/tonne.
Copyright © 2016 Trusted Sources UK Ltd. All rights reserved. www.trustedsources.co.uk 11
South Africa: Nuclear economics – March
2016 2016 Outlook
5
Quarterly Report
Chart 6: Monetary value of CO2 emissions with carbon tax
The value of the reduction in carbon emissions would also increase in the plausible scenario that
solar and wind energy were developed alongside nuclear (thereby reducing the share of coal in
the fuel mix well below the 75 per cent level established in our stylized model here based only
on coal or nuclear). Such parallel development of nuclear and solar/wind capacities might make
sense given the relative advantages of these fuels in supplying electricity to, respectively, the
industrial and household/services sectors.
Copyright © 2016 Trusted Sources UK Ltd. All rights reserved. www.trustedsources.co.uk 12
South Africa: Nuclear economics – March
2016 20162016Outlook
Report
Localization scenarios
A major attraction for countries developing nuclear energy for the first time or, as would be
South Africa’s case, expanding materially on a small existing base of capacity and scientific and
technical skills established at the Koeberg NPP, is the positive shock to industry and the skills
base that can come from the localization of a part of the investment in nuclear new builds. The
extent of potential localization varies according to the choice of main vendor and technology.
We have modelled the impact on overall economic growth of two levels of localization relative
to a scenario of “no localization” (that is, no nuclear energy development). The base level is 15
per cent localization, and the high case is 45 per cent, based on indications of maximum possible
localization levels indicated by some potential vendors including the French and the Russians.
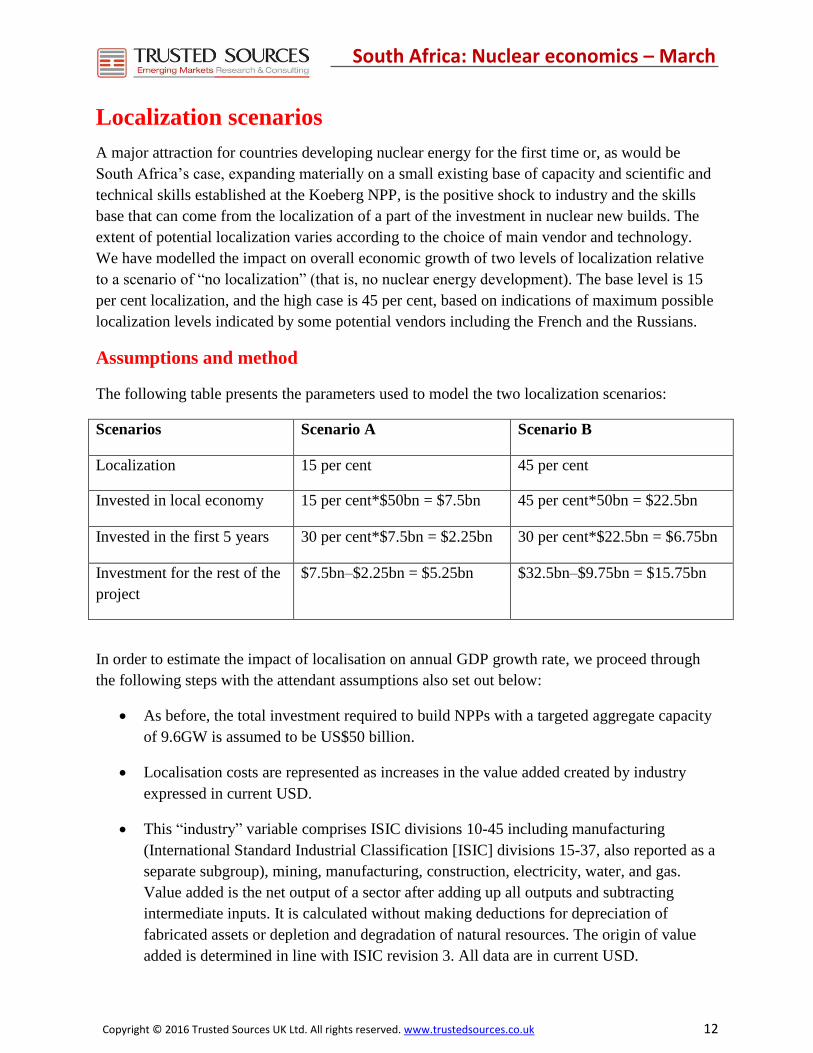
Assumptions and method
The following table presents the parameters used to model the two localization scenarios:
Scenarios Scenario A Scenario B
Localization 15 per cent 45 per cent
Invested in local economy 15 per cent*$50bn = $7.5bn 45 per cent*50bn = $22.5bn
Invested in the first 5 years 30 per cent*$7.5bn = $2.25bn 30 per cent*$22.5bn = $6.75bn
Investment for the rest of the
project
$7.5bn–$2.25bn = $5.25bn $32.5bn–$9.75bn = $15.75bn
In order to estimate the impact of localisation on annual GDP growth rate, we proceed through
the following steps with the attendant assumptions also set out below:
As before, the total investment required to build NPPs with a targeted aggregate capacity
of 9.6GW is assumed to be US$50 billion.
Localisation costs are represented as increases in the value added created by industry
expressed in current USD.
This “industry” variable comprises ISIC divisions 10-45 including manufacturing
(International Standard Industrial Classification [ISIC] divisions 15-37, also reported as a
separate subgroup), mining, manufacturing, construction, electricity, water, and gas.
Value added is the net output of a sector after adding up all outputs and subtracting
intermediate inputs. It is calculated without making deductions for depreciation of
fabricated assets or depletion and degradation of natural resources. The origin of value
added is determined in line with ISIC revision 3. All data are in current USD.

Copyright © 2016 Trusted Sources UK Ltd. All rights reserved. www.trustedsources.co.uk 13
South Africa: Nuclear economics – March
2016 2016 Outlook
5
Quarterly Report
This “industry” variable is then forecast using ARIMA (extending an increasing trend).
A new variable is added: “industry + localization boost”, which combines the base
forecast for industry value added with one or another level of localization.
This produces three industry forecasts (no localization, 15 per cent and 45 per cent
localizations).
The next step is to use this “industry” variable to forecast GDP growth and compare the
results in the no localization, 15 per cent localization and 45 per cent localization
scenarios.
Results and discussion
The differences between those forecasts are shown in Chart 7 below.
Chart 7: Effect of localization on GDP
As can be seen in this chart, there is a clear reaction of GDP to localized investment and its effect
of increasing industrial activity. Under the highest level of localization (Scenario B) the model
indicates that the average annual GDP growth rate would be 0.007 per cent higher than in the no
localization scenario, while the equivalent figure in the 15 per cent localization scenario
(Scenario A) would be 0.002 per cent. While these gains are clearly marginal, they are not

Copyright © 2016 Trusted Sources UK Ltd. All rights reserved. www.trustedsources.co.uk 14
South Africa: Nuclear economics – March
2016 20162016Outlook
Report
negligible given that the largest incremental input is only 45 per cent of US$50 billion spread out
over 22 years, where every year GDP is over US$300 billion.
Another perspective on the scale of this contribution can be gained by aggregating the monetary
value in current USD of the incremental GDP attributable to the 45 per cent localization of
investment in NPP development. That number is USD77.3 billion (compared to US$26 billion in
the 15 per cent localization scenario) – or around one quarter of South Africa’s current annual
GDP. This compares with the USD22.5 billion of “localized” investment in domestic industry:
there is thus a substantial multiplier effect that, according to our model, would be around 3.4x.
It is worth noting an additional benefit of localization that cannot be directly quantified. Industry
experts would expect around a third of the localized investment to be directed towards the
production of specialized equipment for use in the future NPPs (while the rest would create more
generic manufacturing capacity for construction materials and so on). That specialized part of
localization may provide future opportunities to export NPP components (similar to the way that
some German vehicle makes now assembled in South Africa are exported to Asia). This point
underlines the potential returns to scale – that is, prospects of this indirect benefit for the real
economy would rise in the line with the extent, and efficiency, of localization.
.
Copyright © 2016 Trusted Sources UK Ltd. All rights reserved. www.trustedsources.co.uk 15
South Africa: Nuclear economics – March
2016 2016 Outlook
5
Quarterly Report
Trusted Sources Disclosure Statement
The analysis and information presented in this report (Report) by Trusted Sources UK Limited (TS) may include summary profiles of key companies in the relevant sector and the information is offered for subscriber interest only. This Report is not to be used or considered as a recommendation to buy, hold or sell any securities or other financial instruments and does not constitute an investment recommendation or investment advice. The information contained in this Report has been compiled by TS from various public and industry sources that we believe to be reliable; no representation or warranty, expressed or implied is made by TS, its affiliates or any other person as to the accuracy or completeness of the information. TS is not responsible for any errors in or omissions to such information, or for any consequences that may result from the use of such information. Such information is provided with the expectation that it will be read as part of a wider investment analysis and this Report should not be relied upon on a stand-alone basis. Past performance should not be taken as an indication or guarantee of future performance; we make no representation or warranty regarding future performance. The opinions expressed in this Report reflect the judgment of TS as of the date hereof and are subject to change without notice. This Report is not an offer to sell or a solicitation of an offer to buy any securities. The offer and sale of securities are regulated generally in various jurisdictions, particularly the manner in which securities may be offered and sold to residents of a particular country or jurisdiction. Securities referenced in this Report may not be eligible for sale in some jurisdictions. To the fullest extent provided by law, neither TS nor any of its affiliates, nor any other person accepts any liability whatsoever for any direct or consequential loss, including without limitation, lost profits arising from any use of this Report or the information contained herein. No director, officer or employee of TS is on the board of directors of any company referenced herein and no one at any such referenced company is on the board of directors of TS. TS does not invest in any securities although it is possible that one or more of TS's directors, officers, employees or consultants may at times be invested in the securities of a referenced company. TS is not authorised or regulated in the United Kingdom by the Financial Services Authority or by any other regulator in any jurisdiction for the provision of investment advice. Specific professional financial and investment advice should be sought from your stockbroker, bank manager, solicitor, accountant or other independent professional adviser authorised pursuant to the Financial Services and Markets Act 2000 if you are resident in the United Kingdom or, if not, another appropriately qualified independent financial adviser who specialises in advising on the acquisition of shares and other securities before any investment is undertaken. This Report, including the text and graphics, is subject to copyright protection under English law and, through international treaties, other countries. No part of the contents or materials available in this Report may be reproduced, licensed, sold, hired, published, transmitted, modified, adapted, publicly displayed, broadcast or otherwise made available in any way without TS's prior written permission. All rights reserved.
Trusted Sources UK Limited
Europe +44 (0) 20 7183 5280 The Americas +1 (646) 496 9856 Asia +852 2973 6093 [email protected] www.trustedsources.co.uk
Contact us
Please read this important disclosure statement which includes our disclaimer and copyright status