south africa - medupi power project - appraisal report · original: english language: english...
TRANSCRIPT

Original: English Language: English
AFRICAN DEVELOPMENT BANK
PROJECT: Medupi Power Project COUNTRY: Republic of South Africa
PROJECT APPRAISAL REPORT
Date: 14 October 2009
Appraisal Team
Team Leader Mr. B. RAM Chief Power Engineer OINF3 2266Team Members Mr. Y. VYAS Lead Environmentalist OIVP 2178
Ms. Y.FAL Manager ORPF1 3217Mr. S. AMADOU Chief Legal Counsel GECL1 Mr. C. AHOSSI Chief Procurement Officer ORPF1 2718
Mr. D. GOYAL Chief Financial Management Specialist ORPF2 2569
Mr. F. KANONDA Senior Financial Analyst OINF3 2723Sector Manager Mr. A.T. DIALLO OINF3 2125Sector Director Mr. G. MBESHERUBUSA OINF 2034Regional Director Mr. A. BEILEH ORSA 2039
Peer Reviewers
H.R. HEERO (Senior Infrastructure Specialist) GFO 6134Mrs. G. GEISLER (Principal Gender Specialist) OSHD0 2643M. DIMMER (Senior Financial Analyst) OINF3 2377W. A. MARIKI (Senior Country Economist) ORSA 3606
L. MOOLA (Senior Disbursement Officer) FFCO3 2603 D. LEKOETJE (Senior Public Utilities Economist) OINF3 2651 M.SAKHO ( Senior Commercial Risk Officer) FFMA2 2372 C. AHOSSI (Chief Regional Procurement Coordinator) ORPF1 2718

TABLE OF CONTENTS I – STRATEGIC THRUST & RATIONALE ........................................................................... 1 1.1. Project linkages with country strategy and objectives ...................................................... 1 1.2. Rationale for Bank’s involvement .................................................................................... 2 1.3. Donors coordination.......................................................................................................... 2 II – PROJECT DESCRIPTION ................................................................................................. 3 2.1. Project Objective ............................................................................................................... 3 2.2 Project Components ........................................................................................................... 3 2.3. Technical solution retained and other alternatives explored ............................................. 3 2.4. Project type ....................................................................................................................... 4 2.5. Project cost and financing arrangements .......................................................................... 6 2.6. Project’s target area and population .................................................................................. 6 2.7. Participatory process for project identification, design and implementation ................... 7 2.8. Bank Group experience, lessons reflected in project design ............................................ 7 2.9. Key performance indicators .............................................................................................. 9 III – PROJECT FEASIBILITY ................................................................................................. 9 3.1. Economic and financial performance ............................................................................... 9 3.2. Environmental and Social impacts .................................................................................. 10 IV – IMPLEMENTATION...................................................................................................... 15 4.1. Implementation arrangements ......................................................................................... 15 4.2. Monitoring . 17 4.3. Governance 17 4.4. Sustainability................................................................................................................... 18 4.5. Risk management ............................................................................................................ 18 4.6. Knowledge building 19 V – LEGAL INSTRUMENTS AND AUTHORITY............................................................... 20 5.1. Legal instrument ............................................................................................................. 20 5.2. Conditions associated with Bank’s intervention ............................................................. 20 5.3. Compliance with Bank Policies ...................................................................................... 20 VI – RECOMMENDATION ................................................................................................... 20 Annex 1 South Africa's comparative socio-economic indicators Annex 2 Table of AfDB’s portfolio in South Africa Annex 3 Key related projects financed by the Bank and other development partners in South .......................................................................................................................................... Africa Annex 4 Map of the Project Area

i
Currency Equivalents As of 18th August 2009
1 UA = 1.5533 US Dollar 1 UA = 12.337 South African Rands (ZAR) 1 US Dollar = 7.9423 ZAR 1 UA = 1.09411 Euro
Fiscal Year 1 April – 31 March
Weights and Measures
1 metre (m) = 3.28 feet (ft) 1 kilometre (km) = 0.62 mile 1 hectare (ha) = 2.471 acres
1 Kilovolt (kV) = 1000 volts 1 Megawatt (MW) = 1000 kW 1 Gigawatt (GW) = 1000 MW 1 Gigawatt hour (GWh) = 106 watt hour
ABBREVIATIONS
AfDB African Development Bank AC Alternating Current ASGISA Accelerated and Shared Growth Initiative of South Africa BBBEEP Broad Based Black Economic Empowerment Plan CAPEX Capital Expenditure Program of Eskom
CFL Compact Fluorescent Lamp COFACE the Compagnie Française d’Assurances Pour le Commerce
Extérieur CS Concentrated Solar
CSP Country Strategy Paper CTF Clean Technology Fund DWA Department of Water Affairs DOE Department of Energy DPE Department of Public Enterprises DRC Democratic Republic of Congo DTI Department of Trade and Industry ECA Export Credit Agency EIRR Economic Internal Rate of Return EMP Environmental Management Plan ENPV Economic Net Present Value
EPC Engineering, Procurement and Construction ESIA Environmental and Social Impact Assessment ESMP Environmental and Social Management Plan ESW Economic and Sector Work FC Foreign Cost
FGD Flue Gas Desulphurization

ii
FIRR Financial Internal Rate of Return FNPV Financial Net Present Value FY Financial Year GDP Gross Domestic Product GHG Green House Gases GoRSA Government of Republic of South Africa IDC Interest During Construction IEC International Electro-technical Commission IFC International Finance Corporation I&APs Interested & Affected Parties IP Investment Plan IPP Independent Power Producers ISEP Integrated Strategic Electricity Plan IEP Integrated Energy Planning L/kWh Liter per unit of electricity produced LC Local Cost LP Low Pressure LTMS Long Term Mitigation Scenario MCR Machine Continuous Rating MDB Multilateral Development Banks M&E Monitoring and Evaluation MDG Millennium Development Goals MICA Middle Income Country Assistance MTR Mid Term Review MTSF Medium Term Strategic Framework NERSA National Energy Regulator of South Africa NIRP National Integrated Resource Planning O&M Operation and Maintenance OCGT Open Cycle Gas Turbines
OGWC Optical Ground Wire Cable OPEV Operations Evaluation Department OpsCom Operations Committee ORPC Operational Resources and Policies PAR Project Appraisal Reports PC Pulverised Coal PBMR Pebble Bed Modular Reactor PCR Project Completion Report PIU Project Implementation Unit QPR Quarterly Progress Report
RAP Resettlement Action Plan REFIT Renewable Energy Feed-in Tariff SANERI South Africa National Energy Research Institute SAPP Southern African Power Pool SOE State Owned Enterprises SWAP Sector Wide Approach TpH Tones per hour
UA Units of Account

iii
Loan Information
Client’s information BORROWER : Eskom Holdings Ltd. EXECUTING AGENCY : Eskom Holdings Ltd Financing plan
AfDB’s key financing information Loan currency
Euro
Interest type Fixed or Floating
Interest rate spread Bank’s cost of funding+40bp1
Commitment fee Nil
Service Charge Nil
Tenor 20 years
Grace period 5 years
FIRR, FNPV (base case) 13.0%, ZAR45,22 billion (Real)
EIRR, ENPV (base case) 17.4%, ZAR69.50 billion (Real)
Timeframe - Main Milestones (expected) Concept Note approval 28 July 2009
Project approval November 2009
Effectiveness December 2009
Last Disbursement 31 December 2015
Completion 31 August 2014
Last repayment February 2030
1 Current Bank’s Borrowing Cost is LIBOR-16bp
Source Amount (UA billion)
Instrument
AfDB 1.70 Loan WB 1.93 Loan ECA 1.11 Loan GoRSA/Eskom 5.44 Equity TOTAL COST 10.18

Project Summary 1. PROJECT OVERVIEW
The project consists of the construction of a coal-fired base load power plant in Lephalale, Limpopo Province, comprising of six units with an installed capacity of 4,764 MW. Major contracts including civil works, the supply and installation of boiler and turbo-generators have been awarded. The construction of the power plant commenced in May 2008. The first unit will be commissioned by February 2012, and each subsequent unit will be commissioned at an interval of six months. The plant will deploy the super-critical boiler technology with increased plant efficiency, reduced coal consumption and reduced CO2 emissions. These units are planned as direct dry-cooled units such as those at the existing Matimba power station, thereby reducing water consumption requirement in significant ways compared to wet cooling technology.
The project is estimated to cost Euro 11.19 billion. The Bank is co-financing the project in partnership with the Export Credit Agencies (ECA) and the World Bank. The Bank’s loan estimated at Euro 1.86 billion will be lent to Eskom with sovereign guarantee of the government of South Africa. The loan will be utilised for funding contracts for the supply and installation of six boilers and turbo-generators. ECA will also contribute Euro 1.22 billion to fund the contracts for boilers and turbo-generators. The World Bank/IBRD is expected to fund 10 contracts including the civil works. The World Bank’s estimated loan of US$ 3 billion will also be directly lent to Eskom with sovereign guarantee of the government of South Africa.
2. NEED ASSESSMENT
Since 1994, the demand for electricity has grown by about 40% on the back of robust economic growth which has resulted in the depletion of Eskom’s surplus electricity generation capacity. In the absence of investment in generation capacity, the reserve margin fell from 25% in 1994 to only 8% in 2008 and inevitably resulted in load shedding in 2007-08. The Cabinet gave Eskom approval to make new investments in power generation in 2004. Eskom is implementing a large Capital Expenditure Programme (CAPEX) with the board approved budget of ZAR385 billion over the next five years to 2013. Eskom is building additional power stations (Medupi, Kusile, Ingula), major transmission lines and distribution networks, that will add approximately 16,000MW by 2017. These projects including Medupi will contribute to raising the reserve margin to about 15% as desired.
3. BANK’S ADDED VALUE The Bank considers the support of infrastructure development, especially within the power sector, as a pillar of its strategy in the country. The Bank’s participation is vital for the following reasons: (i) it will help in reducing the financing gap that currently exists, (ii) it will give confidence to other development partners and commercial banks for providing additional financing, and (iii) moreover, the Bank offers a loan with a long tenor compared to commercial banks. Increased electricity production capacity will enhance competitiveness of the economy in support of the Bank’s CSP. 4. KNOWLEDGE MANAGEMENT GoRSA has established the National Energy Regulator of South Africa (NERSA); and it is restructuring the Electricity Distribution Industry. To attract the Independent Power Producers, the status of System Operator in Eskom has been raised to be at par with other Managing Directors of Eskom. The Independent System Operator (ISO) will be responsible for preparing an Integrated Energy Resource Plan, undertaking dispatch functions and providing IPPs with open access to the transmission grid. This will facilitate private investment in the power sector. Moreover, Eskom has instituted an academy of learning with various faculties. Building of capacity through skill transfer and knowledge management is also integrally built into the contracts for the supply of boilers and turbo-generators.
iv

PERFORMANCE-BASED PROJECT LOGICAL FRAMEWORK
v
Hierarchy of Objectives Expected results and schedule Scope (Target
population) Performance indicators Indicative targets & schedule
(Existence of basic data?) Assumptions/Risks
SECTOR GOAL Develop national and regional energy resources in order to provide reliable and dependable electricity supply to economic sectors, social institutions and households in the country and the Southern Africa region.
IMPACTS (long-term results) 1. Sustained growth of economic activity. 2. Social institutions and households to
benefit from adequate and reliable power supply.
Beneficiaries: 1. Economic actors operating in South Africa. 2. Population of South Africa. 3. Neighboring countries
Impact Indicators: 1. Growth in power consumption from
economic sectors (mining, industrial, commercial and agricultural sectors).
2. Economic growth rate. 3. Levels of domestic and foreign
investment. Sources: - Government statistical information - Eskom annual report and statistics
Progress anticipated in the long term: 1. Power consumptions from economic
sectors increased from 253,213 GWh in 2008 to 300,506 GWh in 2014 to support the target of reducing poverty and unemployment by 50% by 2014.
2. Annual GDP growth rate of 6% in each year between 2010 and 2014.
Assumptions / Risk: 1. Availability of funds from
commercial and development financing institutions to part-finance Eskom’s investment program.
2. Continued financial support to Eskom from GoRSA.
3. Electricity tariffs set at levels that allow full cost recovery and sufficient cash generation for the implementation of ESKOM’s investment program.
PROJECT PURPOSE The objective of the Project is to increase the country’s generation capacity and improve reserve margin in order to adequately, efficiently and reliably serve electricity demand in the country and in the Southern Africa
Region.
IMPACTS (medium-term results) 1. Increased economic activity in mining,
industrial, commercial and agricultural sectors as a result of availability of electricity.
2. Improved public facilities (e.g. health & education) as a result of availability of electricity.
3. Increased free use of electricity for poor households.
4. Increased representation of women managers in Eskom
Beneficiaries: 1. Economic sectors. 2. Public and social
institutions. 3. Domestic users
nationally. 4. Eskom. 5. Neighboring countries
Outcome indicators: 1. Increase in domestic generating capacity
connected to the national grid. 2. Improvement in Eskom’s reserve margin Sources: - Government statistical information - Eskom annual report and statistics
Progress anticipated in the medium term: 1. Increase in domestic generating
capacity by 1957 MW in 2012 and 2331 MW in 2015. (Baseline generation capacity-43,000 MW)
2. Reserve Margin is improved from 8% in 2008 to 16% in 2015.
3. Increase in free basic electricity from 50 kWh per month (2008) to 70 kWh per month (2010)
4. Increase in women managers from 34.5% (2008) to 35.2% (2012)
Assumptions / Risk: 1. Government support. 2. Institutional capacity &
efficiency. 3. Good performance of
Eskom’s continuing operations
ACTIVITIES 1. Supply and installation of equipment and materials for the construction of the Medupi power plant. 2. Commissioning of the Medupi power plant FINANCIAL RESOURCES Total Project cost : UA 10.18 billion - AfDB : UA 1.70 billion - WB : UA 1.93 billion - ECA : UA 1.11 billion - GoRSA&Eskom : UA 5.44 billion
OUTPUTS (Short-term results) • New 4,764 MW coal-fired power plant,
located at a mine-mouth, connected to the national grid
Beneficiaries: 1. Eskom 2. Contractors and consultants 3. Local suppliers 4. Local labor 5. Neighboring countries
Indicator: 1. 6 Boilers (co-financed by AfDB) 2. 6 Turbo-generators (co-financed by
AfDB) 3. Main civil works 4. 1 Water Treatment Plant 5. Electrical Installation 6. Chimney and Silo 7. LP Services 8. Control and Instrumentation 9. Ash Dump and Dam 10. Coal stockyard 11. Flue Gas Desulphurization Plant Readiness 12. Associated transmission systems Sources: - Project quarterly reports
Progress anticipated in the short term: 1. First unit commissioned by February
2012 2. Next 5 units commissioned
sequentially at 6 month intervals
Assumptions / Risk: 1. Successful execution and integration of the works relating to associated components that are not being financed by the Bank 2. Financing provided by other lenders 3. Financing provided by ESKOM/GoSA Mitigation measures: 1. Experienced contractor and consultants hired to undertake the works 2. Financing already secured from ECAs 3. Tariff levels for 2009 has been increased by 25% and are under review for (2010-2012).

vi

1
REPORT AND RECOMMENDATION OF THE MANAGEMENT OF THE AFDB GROUP TO THE BOARD OF DIRECTORS ON A PROPOSED LOAN
TO ESKOM FOR THE MEDUPI POWER PROJECT Management submits the following Report and Recommendation on a proposed AfDB loan of UA 1.70 billion (Euro 1.86 billion) to Eskom to finance specific components of Medupi power project. 1. STRATEGIC THRUST & RATIONALE
1.1 Project linkages with country strategy and objectives 1.1.1 The Republic of South Africa is a middle-income country with a well diversified economy. The private sector plays a dominant role accounting for 70% of the country’s GDP and is also the main employer and exporter of commodities and manufactured goods. South Africa has in the past made limited use of donor resources and development assistance because it has ample resources and because of the ability of its private sector and parastatals to access national and international capital market at relatively competitive prices. 1.1.2 The government development agenda has evolved over time including ASGISA (2006) and Medium Term Strategic Framework (MTSF 2009-14) launched by the new administration in July 2009. The main thrusts, objectives and timeframes of both ASGISA (which earlier underlined the CSP) and the MTSF are basically the same. However, there are notable shifts in focus. The mission of the MTSF is to catapult the country into a higher and sustainable growth trajectory by 2014, with an expanded and more diversified economic base, with unemployment and poverty halved (compared to 2004) and with greater equity and social cohesion. In the medium term, as the global economy recovers, it is envisaged that real GDP growth of South Africa will gradually recover to 4.0% by 2011 from an estimated 1.2% in 2009. However, the infrastructure bottlenecks pose significant constraints to private investment in mining and manufacturing sector. Early in the energy crisis in January-February 2008, a near collapse of the grid forced mines to close for days, and losses from gold and platinum alone, which account for 25% of South Africa’s exports, were estimated at ZAR200 million per day during the closure.
1.1.3 The Bank’s CSP Update for South Africa is underpinned by the Medium Term Strategic Framework and includes three pillars, namely: (i) Enhancing Private Sector Competitiveness (ii) Partnership for Regional Integration and Development and (iii) Knowledge Management and Capacity Building. The broad areas of focus under pillar 1 are (i) support for improved infrastructure and (ii) financial intermediation for private sector development. Under Pillar 1, the Bank will support ongoing efforts by the government and its SOEs in responding to this emerging challenge. The proposed Medupi project is in conformity with the pillar 1 which will increase the capacity of Eskom to produce electricity by about 4,764 MW thereby providing reliable electricity supply, enhancing competitiveness of mining and manufacturing sectors and sustaining the economic growth in the country. As per the CSP update of the country, the proposed project is a priority operation in the indicative lending program for 2009-2012. 1.1.4 As such, the power project will ensure “improved reliability of energy supply”- in support of the goals set out in the CSP update 2009 for South Africa (2008-12). The project will also contribute to promoting the local content and skills development. Included in the contracts is a strong focus on requirement for local content (Competitive Supplier Development Program), to ensure that a large portion of the work is sourced locally. The focus on local development will leave a long term legacy in Lephalale and Limpopo province in South Africa.

2
1.2. Rationale for Bank’s involvement
1.2.1 South Africa was forced to resort to load shedding in 2008. To mitigate shortages and to meet medium term demand, Eskom has prepared an Integrated Strategic Electricity Expansion Plan (ISEP) to support the economic objectives of the government’s Medium Term Strategic Framework 2009-2014. It has reopened power plants which were previously decommissioned and is also building new power plants, namely Medupi thermal power plant (4764 MW), Kusile thermal power plant (4764 MW) and Ingula pump storage (1332 MW). Of the above, the Bank has been requested to fund the Medupi power project.
1.2.2 Determined by ISEP, Medupi has been studied at feasibility level utilising the locally available coal. The detailed design has been prepared. The project will consist of 6 units of super critical boilers and the turbo generators. The efficiency of the power plant will be 40% compared to 34% of the sub-critical technology. The plant will be pulverised coal fired, directly dry cooled and Flue Gas Desulphurization (FGD) ready. The construction of the project commenced in May 2008. Supported by an international consultancy firm, the construction of the power plant is being managed by Eskom. The unit 1 is expected to be commissioned in February 2012 and each of subsequent units will be commissioned at six month intervals. Increase in production capacity by 4764 MW will strengthen private sector competitiveness in the country.
1.2.3 Given the sheer volume of financial resources required (ZAR125.63 billion), it is quite challenging to fund Medupi project. In essence the project is being funded through a combination of measures (i) increase in tariff (revenues) (ii) issue of bonds (iii) GoRSA support (iv) funding from the Multilateral Development Banks and (v) the borrowing from the Export Credit Agencies. The Bank’s support to fund Medupi power project is required to fill the financing gap. The Bank’s comparative advantage lies in its ability to offer loans with a long tenor and an attractive interest rate compared to other sources. The Bank is cofinancing this project in partnership with the World Bank and the Export Credit Agencies. The Bank’s funding conforms to the Paris Declaration; accordingly a co-financed project is the way the Bank wants to go to ensure successful project implementation.
1.2.4 The Bank’s support is a follow up of the previous project, namely the corporate loan to Eskom which has been utilised to fund the CAPEX program of Eskom. The Bank’s support for the present project is greatly appreciated by the government in view of the current global financial and economic context which makes it difficult to raise funds on the market. Therefore, the Government’s request to fund Medupi power project deserves the support of the Bank. However, the Bank funding of this project does not crowd out the participation of the private sector since Eskom will need to raise financial resources to implement the CAPEX program estimated in excess of ZAR385 billion over the next five years.
1.3. Donors Coordination 1.3.1 The National Treasury coordinates the activities of different donors in conjunction with relevant sector agencies and ministries. South Africa puts a great deal of emphasis on mutual commitment to the implementation of the Paris and Accra Declarations regarding harmonization, alignment and managing for results. The Bank actively promotes cooperation between and among the development partners. The co-financing of lending operations and joint ESW are key activities that are coordinated with partners. Presently, the Bank is collaborating with the World Bank and the World Economic Forum on the preparation of the African Competitiveness Report. The Bank has discussed with the World Bank/IBRD and the Export Credit Agencies (Euler Hermes of Germany and COFACE of France) on the way forward to co-finance the Medupi power project.

3
1.3.2 During the Preparation and Appraisal Missions, meetings were held with the World Bank, KFW, Norwegian Embassy (which liaises with the Embassies of Denmark and Sweden), with a view to (i) devise a harmonized approach in the implementation of the Medupi project; and (ii) discuss developments in the power sector, particularly with regards to sector reforms, the diversification of energy sources and the renewable energy development catalysed by the Clean Technology Fund. It has been agreed that the Bank will co-finance the proposed project in partnership with the World Bank, the Export Credit Agencies and GoRSA/Eskom. In addition to this proposed project, the Bank is expected to cofinance the renewable energy projects to be determined in partnership with IBRD and IFC in order to utilise the concessionary financial resources made available by the Clean Technology Fund to GoRSA. 2. PROJECT DESCRIPTION
2.1 Project Objective The objective of the Project is to increase the country’s generation capacity and improve reserve margin in order to adequately, efficiently and reliably serve electricity demand in the country and in the Southern Africa Region.
2.2 Project components
The project components are summarised in Table 2.1 below:
Table 2.1: Project Components
(A = Civil Works, B = Equipment, C = Transmission, D = Development Costs)
Component
name Est. cost (UA
billion) Component description
A1 Civil works 1.23 The civil works of the power plant include buildings, drains, landscaping, sewers, cable trenches, fencing, roads and terraces
A2 Housing 0.52 The component provides for housing requirement for site staff during construction and for operation and maintenance staff after commissioning of the power plant.
B1 Boilers 2.99 Each of six boilers will be designed to generate 794 MWe at ambient conditions with a minimum of 736 MWe and a maximum of 801 MWe. The boilers will be the radiant water tube type operating under once through principle, under super critical conditions. The design and manufacture of pressure parts will conform to EN code of standards (EN12952). The design life of pressure parts shall be 200,000 hours, with expected plant life of 50 years.
B2 Turbines 1.93 Each of the turbine units will be of the tandem-compound impulse and/or reaction type with single reheat, as defined in IEC 45, and will operate at the nominal speed as indicated on the Data Sheet. The LP sections will comprise two double-flow cylinders, with coupled rotors. The turbine unit will be capable of delivering the required MCR load under the specified conditions when operating with a direct mechanical draught air-cooled condenser and with the final HP heater out of service.
B3 Electrical Equipment
0.40 This component covers the supply of six 794 MW, 22 kV AC, three-phase generators. The large 2 pole generator model has been chosen for Medupi.This includes all generator auxiliary equipment including but not limited to exciter, exciter controls, hydrogen, seal oil and cooling water system (if applicable).
B4 Control and Instrumentation
0.20 The boiler, turbine-generator set, and feed pump plant, and auxiliaries, will be controlled from the unit control desk and panel which will be situated in the unit control room. All operations required for cold, warm and hot starts will be performed from this control centre automatically, with facilities for alternative remote manual control of individual drives and sub-loops, which will still be subject to interlocks.
4
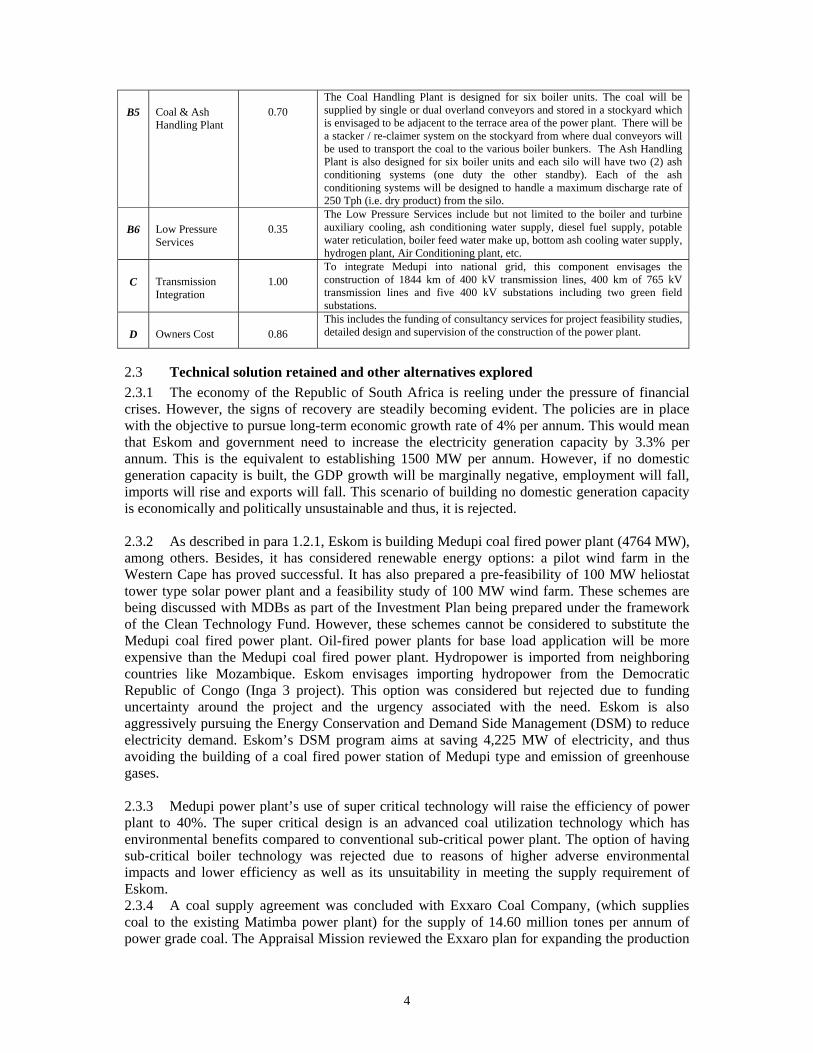
B5 Coal & Ash Handling Plant
0.70 The Coal Handling Plant is designed for six boiler units. The coal will be supplied by single or dual overland conveyors and stored in a stockyard which is envisaged to be adjacent to the terrace area of the power plant. There will be a stacker / re-claimer system on the stockyard from where dual conveyors will be used to transport the coal to the various boiler bunkers. The Ash Handling Plant is also designed for six boiler units and each silo will have two (2) ash conditioning systems (one duty the other standby). Each of the ash conditioning systems will be designed to handle a maximum discharge rate of 250 Tph (i.e. dry product) from the silo.
B6 Low Pressure Services
0.35 The Low Pressure Services include but not limited to the boiler and turbine auxiliary cooling, ash conditioning water supply, diesel fuel supply, potable water reticulation, boiler feed water make up, bottom ash cooling water supply, hydrogen plant, Air Conditioning plant, etc.
C Transmission Integration
1.00 To integrate Medupi into national grid, this component envisages the construction of 1844 km of 400 kV transmission lines, 400 km of 765 kV transmission lines and five 400 kV substations including two green field substations.
D Owners Cost 0.86 This includes the funding of consultancy services for project feasibility studies, detailed design and supervision of the construction of the power plant.
2.3 Technical solution retained and other alternatives explored 2.3.1 The economy of the Republic of South Africa is reeling under the pressure of financial crises. However, the signs of recovery are steadily becoming evident. The policies are in place with the objective to pursue long-term economic growth rate of 4% per annum. This would mean that Eskom and government need to increase the electricity generation capacity by 3.3% per annum. This is the equivalent to establishing 1500 MW per annum. However, if no domestic generation capacity is built, the GDP growth will be marginally negative, employment will fall, imports will rise and exports will fall. This scenario of building no domestic generation capacity is economically and politically unsustainable and thus, it is rejected. 2.3.2 As described in para 1.2.1, Eskom is building Medupi coal fired power plant (4764 MW), among others. Besides, it has considered renewable energy options: a pilot wind farm in the Western Cape has proved successful. It has also prepared a pre-feasibility of 100 MW heliostat tower type solar power plant and a feasibility study of 100 MW wind farm. These schemes are being discussed with MDBs as part of the Investment Plan being prepared under the framework of the Clean Technology Fund. However, these schemes cannot be considered to substitute the Medupi coal fired power plant. Oil-fired power plants for base load application will be more expensive than the Medupi coal fired power plant. Hydropower is imported from neighboring countries like Mozambique. Eskom envisages importing hydropower from the Democratic Republic of Congo (Inga 3 project). This option was considered but rejected due to funding uncertainty around the project and the urgency associated with the need. Eskom is also aggressively pursuing the Energy Conservation and Demand Side Management (DSM) to reduce electricity demand. Eskom’s DSM program aims at saving 4,225 MW of electricity, and thus avoiding the building of a coal fired power station of Medupi type and emission of greenhouse gases. 2.3.3 Medupi power plant’s use of super critical technology will raise the efficiency of power plant to 40%. The super critical design is an advanced coal utilization technology which has environmental benefits compared to conventional sub-critical power plant. The option of having sub-critical boiler technology was rejected due to reasons of higher adverse environmental impacts and lower efficiency as well as its unsuitability in meeting the supply requirement of Eskom. 2.3.4 A coal supply agreement was concluded with Exxaro Coal Company, (which supplies coal to the existing Matimba power plant) for the supply of 14.60 million tones per annum of power grade coal. The Appraisal Mission reviewed the Exxaro plan for expanding the production
5
capacity to meet the additional coal requirements for Medupi project. The feasibility study of the coal mine expansion has been prepared and funding secured. Exxaro will deliver first coal to Eskom from the existing facilities in November 2011 ahead of the February 2012 commissioning date of unit 1. The supply of coal will be ramped up to meet the requirements of subsequent units by expanding the existing coal producing facilities. 2.3.5 Due to limited availability of water in Lephalale area, dry cooling has been preferred to wet cooling. The consumption of water with dry cooled technology will be less than 0.12 L/ kWh compared to 1.9 L/kWh of wet cooled technology (excluding FGD). The Department of Water Affairs (DWA) has allocated water for the first three units of Medupi plant from Mokolo Dam reservoir and for the last three units from Crocodile West Water Transfer Scheme to be constructed by the Department of Water Affairs. The phase I of the Crocodile West Water Transfer Scheme will be completed in 2012; and phase II in 2015. Eskom will sign a user service contract with the Department of Water Affairs in December 2009 for off-taking additional water supplies from Mokolo dam. The user agreement for Crocodile West will be concluded in 2010 and will kick-off the construction of Crocodile West Water Transfer Scheme. 2.3.6 The feasibility study and design of the power transmission system has been done. To integrate Medupi into the national grid, Eskom envisages the construction of 1844 km of 400 kV transmission lines, 400 km of 765 kV transmission lines and five 400 kV substations including two green field substations. The power transmission system will be constructed in two phases: Phase 1 of the transmission system will be commissioned to be ready to evacuate power from February 2012. 2.3.7 The private implementation of power projects has been considered in accordance with a Cabinet Memo in September 2007. Eskom has been designated as the Single Buyer which will implement a Strategy which stipulates that 30% of the total new capacity to be built by the Independent Power Producers, while the remaining 70% will be built by Eskom. A proposal to install 1000 MW peaking plant by an IPP is being actively pursued. Interest from the private sector to develop a coal fired power plant is apparent and the enabling environment to support this strategy is in the process of being addressed. Following the announcement of the Renewable Energy Feed-in Tariffs (REFIT) and guidelines for technologies, namely wind, landfill gas, concentrated solar power, and small hydro, by the NERSA in March 2009, private sector has expressed willingness to develop 1000 MW of wind energy projects. These guidelines create an enabling environment for achieving government’s 10,000 GWh renewable energy target by 2013 and sustaining growth beyond the target.
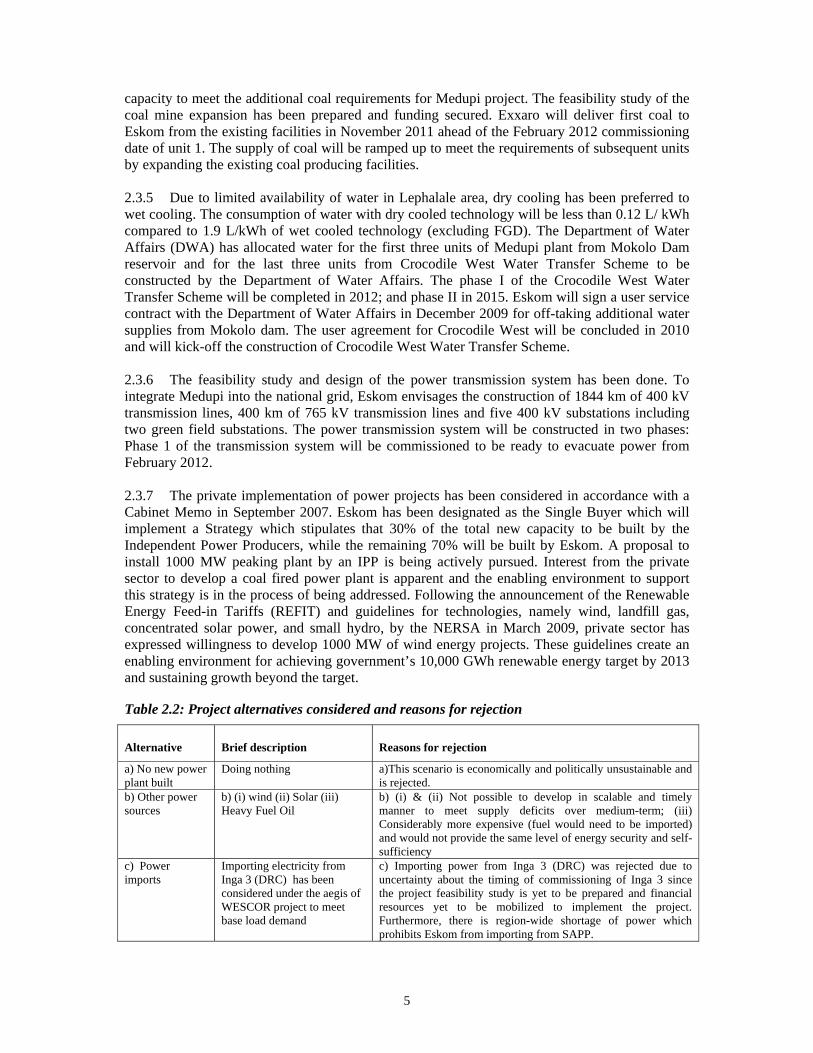
Table 2.2: Project alternatives considered and reasons for rejection
Alternative Brief description Reasons for rejection a) No new power plant built
Doing nothing a)This scenario is economically and politically unsustainable and is rejected.
b) Other power sources
b) (i) wind (ii) Solar (iii) Heavy Fuel Oil
b) (i) & (ii) Not possible to develop in scalable and timely manner to meet supply deficits over medium-term; (iii) Considerably more expensive (fuel would need to be imported) and would not provide the same level of energy security and self-sufficiency
c) Power imports
Importing electricity from Inga 3 (DRC) has been considered under the aegis of WESCOR project to meet base load demand
c) Importing power from Inga 3 (DRC) was rejected due to uncertainty about the timing of commissioning of Inga 3 since the project feasibility study is yet to be prepared and financial resources yet to be mobilized to implement the project. Furthermore, there is region-wide shortage of power which prohibits Eskom from importing from SAPP.

6
d) Super-critical boiler technology and plant size
d) A power plant of 4764 MW with 6 x 794 MW units with super-critical boiler technology was selected.
d) While a smaller plant size was originally considered, it was rejected because it did not meet Eskom’s supply requirement and did not support the supercritical boiler technology and economy of scale.
e) Private Sector Participation
An IPP to build a coal fired power plant
e) There is interest from the private sector to develop a coal fired power plant. However, implementation of the IPP program is pending the roll out of supportive framework which is under review.
2.4 Project type 2.4.1 This is an investment loan.
2.5 Project cost and financing arrangements 2.5.1 The estimated cost of the project including the power plant and transmission system is Euro 11.19 billion (UA 10.18 billion) including the foreign cost of Euro 2.31 billion (UA 2.10 billion) and local cost of Euro 8.88 billion (UA 8.08 billion).
Table 2.3: Project costs by Component (billions)
Component ZAR EURO UA
ESKOM Local Foreign Total Local Foreign Total Local Foreign Total Boilers 8.30 12.30 20.60 0.74 1.10 1.83 0.67 1.00 1.67 Turbines 5.40 8.60 14.00 0.48 0.77 1.25 0.44 0.70 1.13 Civil Works 8.61 0.13 8.74 0.77 0.01 0.78 0.70 0.01 0.71 Electrical Equipment 1.89 0.94 2.83 0.17 0.08 0.25 0.15 0.08 0.23 Control & Instrumentation 1.44 - 1.44 0.13 - 0.13 0.12 - 0.12 Coal & Ash 4.18 0.39 4.57 0.37 0.03 0.41 0.34 0.03 0.37 Low Pressure Services 2.15 0.25 2.40 0.19 0.02 0.21 0.17 0.02 0.19 Housing 4.16 - 4.16 0.37 - 0.37 0.34 - 0.34 Owners Development Costs 6.41 - 6.41 0.57 - 0.57 0.52 - 0.52 Transmission Integration 6.88 - 6.88 0.61 - 0.61 0.56 - 0.56 TOTAL ( Basic only ) 49.43 22.60 72.03 4.40 2.01 6.41 4.01 1.83 5.84 Contract Price Adjustment/Escalation 12.09 - 12.09 1.08 - 1.08 0.98 - 0.98 Cost Of Cover 2.59 - 2.59 0.23 - 0.23 0.21 - 0.21 Interest during Construction 28.36 - 28.36 2.53 - 2.53 2.30 - 2.30 Contingency 7.24 3.31 10.56 0.65 0.29 0.94 0.59 0.27 0.86 TOTAL PROJECT 99.71 25.92 125.63 8.88 2.31 11.19 8.08 2.10 10.18
2.5.2 The cost estimates for AfDB financed components and the category of expenditure excluding the cost of cover and the interest during construction is presented in Table 2.4 and Table 2.5 respectively below:
Table 2.4: Cost Estimates for AfDB funded components (billions)
Component Local Foreign TOTAL
ZAR USD UA € ZAR USD UA € ZAR USD UA €
ESKOM
Boilers 8.30 1.05 0.67 0.74 12.30 1.545 1.00 1.10 20.60 2.59 1.67 1.83
Turbines 5.40 0.60 0.44 0.48 8.60 1.08 0.70 0.77 14.00 1.76 1.13 1.25
TOTAL ( Basic only ) 13.70 1.72 1.11 1.22 20.90 2.63 1.69 1.86 34.60 4.36 2.80 3.08
Contract Price Adjustment / Escalation 7.12 0.67 0.43 0.63 - 0.23 0.15 - 7.12 0.90 0.58 0.63
Physical Contingency 1.50 0.19 0.12 0.13 1.20 0.15 0.10 0.11 2.70 0.34 0.22 0.24
TOTAL BOILERS & TURBINE 22.32 2.58 1.66 1.99 22.10 3.01 1.791 1.97 44.42 5.60 3.60 3.96

7
Table 2.5: Cost Estimates for AfDB funded Category of Expenditure (billions)
Categories of Expenditure Local Foreign TOTAL
ZAR USD UA € ZAR USD UA € ZAR USD UA €
Goods 13.70 1.72 1.11 1.22 20.90 2.63 1.69 1.86 34.60 4.36 2.80 3.08
Contract Price Adjustment / Escalation 7.12 0.67 0.43 0.63 - 0.23 0.15 - 7.12 0.90 0.58 0.63
Physical Contingency 1.50 0.19 0.12 0.13 1.20 0.15 0.10 0.11 2.70 0.34 0.22 0.24
TOTAL BOILERS & TURBINE 22.32 2.58 1.66 1.99 22.10 3.01 1.791 1.97 44.42 5.60 3.60 3.96
2.5.3 The financing plan for AfDB funded components is given below:
Table 2.6: Financing Plan for the AfDB funded components (billions)
Financiers ZAR USD EURO UA % of Total AfDB 20.90 2.63 1.86 1.70 47 ECA 13.70 1.73 1.22 1.11 31 Eskom 9.82 1.23 0.88 0.79 22 Total 44.42 5.59 3.96 3.60 100
2.5.4 The AfDB funding will be applied to the contracts for the supply and installation of the boilers and turbo-generators. The AfDB financial resources will be used to fund the expenditures incurred in both local and foreign costs in relation to the contracts for boilers and turbines from 2009/10 but will not be used for funding the import duties & taxes, cost of cover and the interest during construction.
2.6 Project’s target area and population 2.6.1 The project is situated in Lephalale Local Municipality (LLM) in the Limpopo Province. The total population of LLM is in the order of 100,000. The principal land uses include (i) agricultural land devoted mainly to game and cattle farming (ii) residential and industrial areas (iii) Grootegeluk Mine (iv) the existing Matimba Power Station (v) game farms and lodges and (vi) sewage works on the farms Zongezien and Nelsonskop. Although the project is located in Limpopo province, the project will feed into national electricity grid and the entire country will reap benefits through reliable power supply. 2.6.2 Since Eskom’s power system is an influential part of the Southern Africa Power Pool, the entire Southern Africa will benefit from the project. The Southern Africa Power Pool (SAPP) established in 1995 assists countries in exchanging electricity based on mutually acceptable bilateral agreements. These agreements specify the bilateral obligations as well as the electricity price and quantity to be sold / bought. The bilateral agreements are a major mainstay of the electricity trade representing 90-95% of the total electricity trade in the region. Eskom exports power to electric utilities in Lesotho, Namibia, Botswana, and Swaziland, while it imports from DRC and Zambia. Medupi power project will stabilise the electricity trade in the Southern Africa Region.
2.7 Participatory process for project identification, design and implementation 2.7.1 Public participation during the Scoping Phase of the ESIA was comprehensive and comprised advertising in national, regional and local newspapers, subsequent notifications in regional and local newspapers, holding several key stakeholder meetings, distributing a background information document and two subsequent revisions, a series of information letters, holding two sessions of public forums at three venues in the area and capturing all the responses received in two Issues Trails. The next stage of the public participation process involved the lodging of the draft ESIA Report in public libraries, municipal offices and on the Internet, and

8
hosting another round of public meetings. The purpose of the public meetings was to present the findings of the draft ESIA and to provide an opportunity for affected population to comment on these findings. In general the public is highly supportive of the project with expectation of benefits from additional employment during the construction and operation phases. 2.7.2 A public meeting was held during the Environmental Impact Report review period in order to inform affected persons and stakeholders of the outcomes of the EIA Report. In accordance with the requirements of the EIA Regulations, the public meeting was advertised 10 days prior to the public meeting within local newspapers in the predominant languages of the area. This advertisement was combined with the advert announcing the commencement of the project. Registered affected persons were informed of the planned public open day and meeting by fax or by e-mail. 2.7.3 On-going consultation with key stakeholders (e.g. local authorities, relevant government departments, local business etc.) and other identified affected populations ensured that they were kept informed regarding the EIA findings and proposed mitigation measures. Networking with affected persons will effectively continue throughout the duration of the project until the closure of the EIA phase. Key stakeholders and affected persons were engaged on an individual basis. During the environmental studies, consultations were held with individuals, businesses, institutions and organizations.2 The feedback received from these consultations has been incorporated in the project design. 2.7.4 Special attention was paid to consultations with affected landowners within the study area. Networking with affected persons continued through-out the duration of the EIA phase of the project. 2.8 Bank Group experience, lessons reflected in project design 2.8.1 The Bank Group operations in South Africa commenced in 1997, and as at the end of August 2009, the Bank had approved sixteen (16) operations, with a total commitment of UA 1,073.87 million. The ongoing operations as at end August 2009 amounted to UA 737.04 million, with a disbursement rate of 80 percent. 2.8.2 In November 2008, the Bank approved a non-sovereign corporate loan of USD500 million to support Eskom’s Capital Expenditure Program (CAPEX). The loan was fully disbursed in January 2009. Eskom utilised the loan proceeds towards implementing Medupi and Kusile power plants. 2.8.3 The Bank also contributed to funding regional projects. Specifically, the Bank co-financed a gas pipeline between Mozambique and South Africa in partnership with the World Bank, which has been successfully completed. 2.8.4 The Bank’s experience with power sector projects (fossil fuel fired generation, transmission, technical assistance) has been suitably incorporated in the project. As such, the following project features have been ascertained: (i) the executing agency has the adequate capacity to implement the project of this nature; (ii) there is a champion of the project; (iii) there is a strong country ownership of the project; (iv) experienced and qualified consultants are employed; (v) there has been adequate consultation with communities and stakeholders on issues related to the project design and safeguards; (vi) there is adequate human resource capacity to implement safeguards; (vii) there are adequate financial resources to implement the measures to 2 See Annex 9/B8.1.3

9
minimise the negative environmental and social impacts of the project; (viii) risks have been identified and can be mitigated; (ix) the financial management systems of the beneficiary are acceptable; and (x) the government is committed to undertake reforms for improving sector governance, structure and the efficiency of service delivery. 2.8.5 For a project of this kind, the past experience dictates that Bank supervision is adequately staffed with appropriate skills mix. At a minimum, the project will be supervised twice a year and a mid-term review will also be conducted. Moreover, the Project TM is being relocated to the ZAFO.
2.9 Key performance indicators 2.9.1 The Key Performance Indicators are presented in the Log Frame. The Medupi Power Project will result in the implementation of 4,764 MW coal-fired power plant, located at a mine-mouth, connected to the national grid. Attributed to AfDB funding are six super-critical boilers and six turbo-generators fully commissioned and operated to produce 4764 MW electricity at bus bar. Moreover, the increased electricity production capacity will help Eskom improve its reserve margin. It will also maintain Eskom’s capacity to export power to neighbouring countries. 3 PROJECT FEASIBILITY
3.1 Economic and Financial Performance
3.1.1 The financial and economic indicators for the Medupi Project are supportive to the project implementation as it results in value gains to both Eskom and the South African economy. The project has a FNPV of ZAR45.22 billion (real) and FIRR of 13.0% which is greater than the Eskom weighted average cost of capital of 7.4%. The ENPV has been computed at ZAR69.50 billion (real) and an EIRR of 17.4% which is well above the economic opportunity cost of 11%. 3.1.2 Table 3.1 summarizes the impact on performance arising from variance in key variables. Financially, the analysis has shown the outcome of the project to be relatively sensitive to an overrun in capital expenditure. The capital investment outlay is the largest cost burden to the project and it occurs upfront. Therefore, particular care should be exercised in limiting overruns. Analysis also reveals sensitivity to reduction in fuel prices to fire OCGT plants. The financial model has shown more resilience to other possible stresses such as increased coal costs, reduced load and exchange rate depreciation as Eskom has entered into forward exchange contracts. From an economic point of view, the analysis has revealed the economic benefits of the project as robust, but susceptible to increases in the fuel cost and exchange rate appreciation. The project is therefore most likely to contribute to significant gains to the South African economy. Table 3.1 Sensitivity Analysis
MILLION RANDS FNPV FIRR ENPV EIRR Base Case 45,219 13.0% 69,501 17.4%
Capital Expenditure +20% 30,274 10.3% 54,630 15.4% Fuel Cost (Coal) + 20% 40,555 12.5% 67,059 17.2% Load Factor -20% 30,975 12.4% 62,304 16.8% Fuel Cost -20% 36,814 12.1% 38,730 14.8% Exchange Rate -20% 35,155 11.1% 37,073 14.7%
Tariff Analysis
3.1.3 In 2006, a Multi-Year Price Determination (MYPD), incentive-based, methodology for price adjustments was introduced by NERSA to replace the annual rate of-return methodology in

10
the determination of electricity tariffs. Between January 1998 and March 2007, the real electricity tariff declined by 12% due to tariff increases that lagged behind inflation. However in 2008 and 2009, Eskom got tariff increases in excess of inflation from NERSA of 27.5% and 31.3% respectively resulting in the current average tariff of ZAR33.14 cents/kWh. The tariff computation is based on recovery of costs plus a return. However the generation assets are almost fully depreciated resulting in a small capital cost component in the current tariff which is not sufficient to allow for sustainable investment in the CAPEX programme. Therefore despite the latest increments, the current tariff still falls short of supporting the internal cash generation requirements of the CAPEX programme. In an effort to align the current average tariff to the long run marginal cost (LRMC) of producing electricity, and to provide clear signals to potential investors, NERSA provided the projected price path for electricity tariffs in June 2009 for the period until 2014. 3.1.4 The upper boundary price path assumes that the electricity tariff will increase by 60% p.a. (nominal) in 2011 and 2012, followed by a 30% (nominal) increase in 2013 which should bring the price to about ZAR80cents/KWh (real), which is in line with the LRMC of production for Eskom estimated at ZAR75 – 85 cents/KWh. 3.1.5 The bottom boundary price path assumes that the tariff will increase by 30% p.a. (nominal) over the next four years to 2014. This will result in a real price of about ZAR65 cents/KWh. It also assumes that in addition to the current government injection of ZAR60 billion, a further equity injection of ZAR100 billion will be disbursed to Eskom evenly starting in 2010. This government support package will reduce lending by ZAR33.3 billion per year while financing almost 50% of the next five year capital spending. The eventual price path will only become evident with the passage of time but will be driven by the Electricity Pricing Policy of December 2008. 3.1.6 Eskom is cognisant of the negative impact that the tariff increases are likely to have on the poor members of society. In its 2008 request for a rule change of the MYPD 1, Eskom proposed that one way to soften the impact of higher prices was to apply a lower price increase for the poor. This was applied by NERSA in the July 2008 and June 2009 increases. The lower price for the poor is subsidised by other users through slightly higher increases. This is however seen as an interim measure by NERSA until the implementation of inclining block rate tariffs for the protection of the poor in the MYPD 2. Government is also aiming to bring relief to low-income households through the national electricity basic services support tariff to ensure optimal socio-economic benefits from the national electrification programme. Qualifying customers are currently eligible for 50kWh of free electricity per month. There are policy discussions to increase this monthly allocation to 70 kWh.
3.2. Environmental and Social Impacts
Environment
3.2.1 The Project has been assigned Category 1. As required under the Department of Environment Affairs (DEA) regulation, Eskom in 2007 carried out comprehensive and independent Environmental Impacts Assessment (EIA) studies for the Medupi coal power plant and separate EIA studies for the associated facilities including the Phase I transmission lines from Medupi to Dinaledi and Marang substations and Medupi to Spitskop, Spitskop to Dinaledi. The EIA studies assessed all potential environmental impacts and identified appropriate mitigation measures associated with the proposed project construction and operation. The EIA studies have received the "Environmental Authorization" (EA) from DEA, in other words the environmental permits for the power plant and some of the transmission lines for the integration of Medupi into the national grid. Eskom has also received a permit from the former Department of Water Affairs
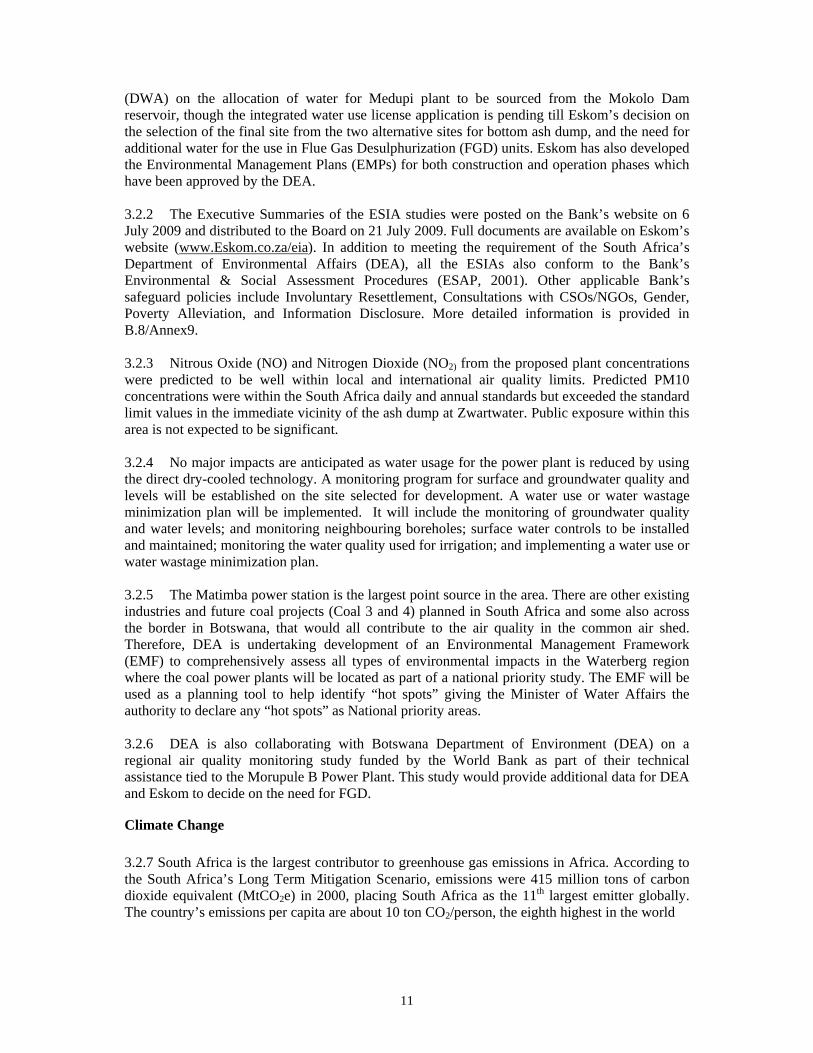
11
(DWA) on the allocation of water for Medupi plant to be sourced from the Mokolo Dam reservoir, though the integrated water use license application is pending till Eskom’s decision on the selection of the final site from the two alternative sites for bottom ash dump, and the need for additional water for the use in Flue Gas Desulphurization (FGD) units. Eskom has also developed the Environmental Management Plans (EMPs) for both construction and operation phases which have been approved by the DEA. 3.2.2 The Executive Summaries of the ESIA studies were posted on the Bank’s website on 6 July 2009 and distributed to the Board on 21 July 2009. Full documents are available on Eskom’s website (www.Eskom.co.za/eia). In addition to meeting the requirement of the South Africa’s Department of Environmental Affairs (DEA), all the ESIAs also conform to the Bank’s Environmental & Social Assessment Procedures (ESAP, 2001). Other applicable Bank’s safeguard policies include Involuntary Resettlement, Consultations with CSOs/NGOs, Gender, Poverty Alleviation, and Information Disclosure. More detailed information is provided in B.8/Annex9. 3.2.3 Nitrous Oxide (NO) and Nitrogen Dioxide (NO2) from the proposed plant concentrations were predicted to be well within local and international air quality limits. Predicted PM10 concentrations were within the South Africa daily and annual standards but exceeded the standard limit values in the immediate vicinity of the ash dump at Zwartwater. Public exposure within this area is not expected to be significant. 3.2.4 No major impacts are anticipated as water usage for the power plant is reduced by using the direct dry-cooled technology. A monitoring program for surface and groundwater quality and levels will be established on the site selected for development. A water use or water wastage minimization plan will be implemented. It will include the monitoring of groundwater quality and water levels; and monitoring neighbouring boreholes; surface water controls to be installed and maintained; monitoring the water quality used for irrigation; and implementing a water use or water wastage minimization plan. 3.2.5 The Matimba power station is the largest point source in the area. There are other existing industries and future coal projects (Coal 3 and 4) planned in South Africa and some also across the border in Botswana, that would all contribute to the air quality in the common air shed. Therefore, DEA is undertaking development of an Environmental Management Framework (EMF) to comprehensively assess all types of environmental impacts in the Waterberg region where the coal power plants will be located as part of a national priority study. The EMF will be used as a planning tool to help identify “hot spots” giving the Minister of Water Affairs the authority to declare any “hot spots” as National priority areas. 3.2.6 DEA is also collaborating with Botswana Department of Environment (DEA) on a regional air quality monitoring study funded by the World Bank as part of their technical assistance tied to the Morupule B Power Plant. This study would provide additional data for DEA and Eskom to decide on the need for FGD.
Climate Change 3.2.7 South Africa is the largest contributor to greenhouse gas emissions in Africa. According to the South Africa’s Long Term Mitigation Scenario, emissions were 415 million tons of carbon dioxide equivalent (MtCO2e) in 2000, placing South Africa as the 11th largest emitter globally. The country’s emissions per capita are about 10 ton CO2/person, the eighth highest in the world

12
3.2.8 Recognizing South Africa’s development needs, the mitigation strategy the Government has adopted envisages an increase in emissions over the short term, stabilized emissions by 2020-2025 followed by a decline in absolute terms by mid-century. Over the last few years South Africa has taken concrete steps towards realizing these long-term goals by ratifying international protocols on climate change and developing relevant strategies and the relevant regulatory framework, in particular:
• South Africa ratified the United Nations Framework Convention on Climate Change (UNFCCC) in August 1997 and acceded to the Kyoto Protocol in July 2002.
• South Africa developed a 2004 National Climate Change Response Strategy, which outlined a broad range of principles and policy measures of mitigation and adaptation to climate change;
• South Africa adopted a 2005 White Paper on Renewable Energy, which sets a target of 4% of electricity supply (equivalent to 10,000 GWh) from renewable energy sources by 2013;
• South Africa adopted a 2006 National Energy Efficiency Strategy (updated in 2009), which sets ambitious national targets for energy efficiency improvement (12% by the year 2015). A National Energy Efficiency Agency (NEEA) has been established to pursue this target through various energy conservation programs;
• In 2008 South Africa completed a major analytic study identifying the priority sectors for carbon mitigation. The Long-Term Mitigation Scenarios (LTMS) is a pioneering effort among developing countries to combine high-quality research with extensive stakeholder consultations. Based on this process South Africa has put forward aggressive LTMS recommending priority climate change mitigation strategies for South Africa;
• In 2009 the South African regulator, NERSA, implemented the REFIT program, which sets price for purchase of electricity produced by renewable energy projects such as wind, solar, etc.
3.2.9 The proposed power station for 4800 MWe with annual coal consumption of 17,117,436 tones, will contribute to the global warming 29,895 kilo tonnes of CO2, 0.342 kilo tonnes of N2O with equivalent CO2 0f 30,001 kilo tonnes per annum. This emission represents an increase in the energy sectors emissions by 9.2% and an increase in the country’s contribution to global warming by 7.3%. 3.2.10 Eskom is committed to reducing greenhouse gas (GHG) emissions through a strategy that includes: (i) diversification of the generation mix to lower-carbon emitting technologies, (ii) energy efficiency and demand side management measures to reduce electricity demand and GHG and other emissions, (iii) adaptation to the negative impacts of climate change, (iv) innovation through research, demonstration and development, (iv) investment through carbon market mechanism to participate in the Clean Development Mechanism (CDM), (vi) progress through advocacy, partnerships and collaboration3. 3.2.11 The Bank in collaboration with the World Bank and IFC is preparing an Investment Plan (IP) for South Africa to benefit from the Clean Technology Fund (CTF) to promote scaling up of large scale renewable energy projects. The Bank is expected to participate in the co-financing of a concentrating solar power project (total cost of ZAR6.5 billion) and a wind energy project (total cost of ZAR2.2 billion). The IP is scheduled to be presented at the next meeting of the CTF Trust Fund Committee in October 20094.
3 See Annex 9, B8.6.9.9 4 See Annex 9, B8.6.9.1- 8.6.9.8

13
Gender 3.2.12 South Africa has made significant progress on gender equality. Gender equality is enshrined in the constitution and a National Policy Framework for Women’s Empowerment and Gender Equality is in place. South Africa is third in the world (behind Rwanda and Sweden) in terms of political representation, with 45% of the National Assembly made up of women. This puts the country well on track to achieve the SADC target of 50% female representation by 2015. Female and male school enrolment at primary and secondary levels is almost at par and female enrolments and degrees surpass those of men in tertiary education. Despite these positive developments, however, women are still hugely disadvantaged in the labour market with very high unemployment figures particularly for black women and lower pay. The high incidence of gender-based violence further negatively affects women’s quality of life. Poverty in South Africa has a disproportionately female face with over 50% of individuals considered poor living in female headed households. Women in poor households can afford electricity only for lighting and not for heating and cooking, and they are not likely to reap the full improvement that electricity can bring to their lives. Negative impacts of the planned tariff increases are likely to be offset by the various social protection measures put in place by the government and NERSA (see para 3.1.6).
3.2.13 Part of the Eskom transformational agenda is to redress the position of women in the corporate environment by actively promoting women within the organization. As of March 2009 women employees constituted 28.8% of all employees and 34.5% at management level against a target of 35.2%. Despite this progress the percentage of women in municipal; electricity depots for example was only 2% in 2005 due to the fact that not enough black women are trained as engineers. Eskom is trying to redress this by identifying high-potential female employees in order to groom them for senior management positions. Medupi power project contribution to Black Women Organisations is estimated at ZAR 3.6 billion.
Social Impacts 3.2.14 The project benefits to South Africa go far beyond new generation capacity. The project impacts on (i) GDP (ii) new industries (iii) employment generation and poverty reduction (iv) regional integration. 3.2.15 The electricity consumption is positively correlated to economic growth in South Africa. The additional 4764 MW capacity supports the long-term growth objectives of the GoRSA. The project will increase GDP growth rate by 0.34% due to estimated capital expenditure in the country’s economy. 3.2.16 Medupi project will have substantial macro-economic foot print, providing support for new industries and creating jobs in the total value chain. The project’s contribution to BEE is R9.8 billion, to BWO is ZAR3.6 billion, to SME is ZAR3.6 billion and to Local Content is ZAR23.2 billion. The project implementation will also see the growth of downstream support industry as summarized below: i) Employment creation during the construction phase – The project will create a number of both temporary and permanent employment opportunities through the construction and implementation phases. Sourcing of construction workers from the local labour pool is likely to be limited to unskilled workers due to the highly technical nature of the work to be undertaken. At the peak of the construction phase the project will employ about 8 000 construction workers of which 60% will be sourced from Lephalale and surrounding areas. During operation the project will employ 1 000 unskilled workers.

14
ii) Local business opportunities - Project implementation will result in the growth of the downstream support industry in key sectors: Some 2000 jobs will be created for the expansion of the coal mine to supply the project. Project will result in the assembly of boiler and turbine main components in South Africa.
Up to 40% of the total spend (ZAR90 billion) will be spent locally. Businesses to provide food, laundry, maintenance and security will be established to serve the
workforce. Hotels – About ZAR1 billion will be spent in the 100%-150% expansion of the local industry
which will provide about 500 jobs. Local Transport – Medupi will require services of 30–35 buses at peak operation which will
result in the creation of 100 jobs. Vehicle Maintenance – More than 500 vehicles are expected to be maintained locally creating
employment for about 20 people. iii) Local infrastructure development - A total of ZAR2 billion will be spent in providing housing. A total of 1,850 houses are required, of which 900 will be constructed. The local sewerage plant will be upgraded at a cost of ZAR50 million. ZAR50 million will be spent on building 2 schools, a recruitment centre, fire station, social
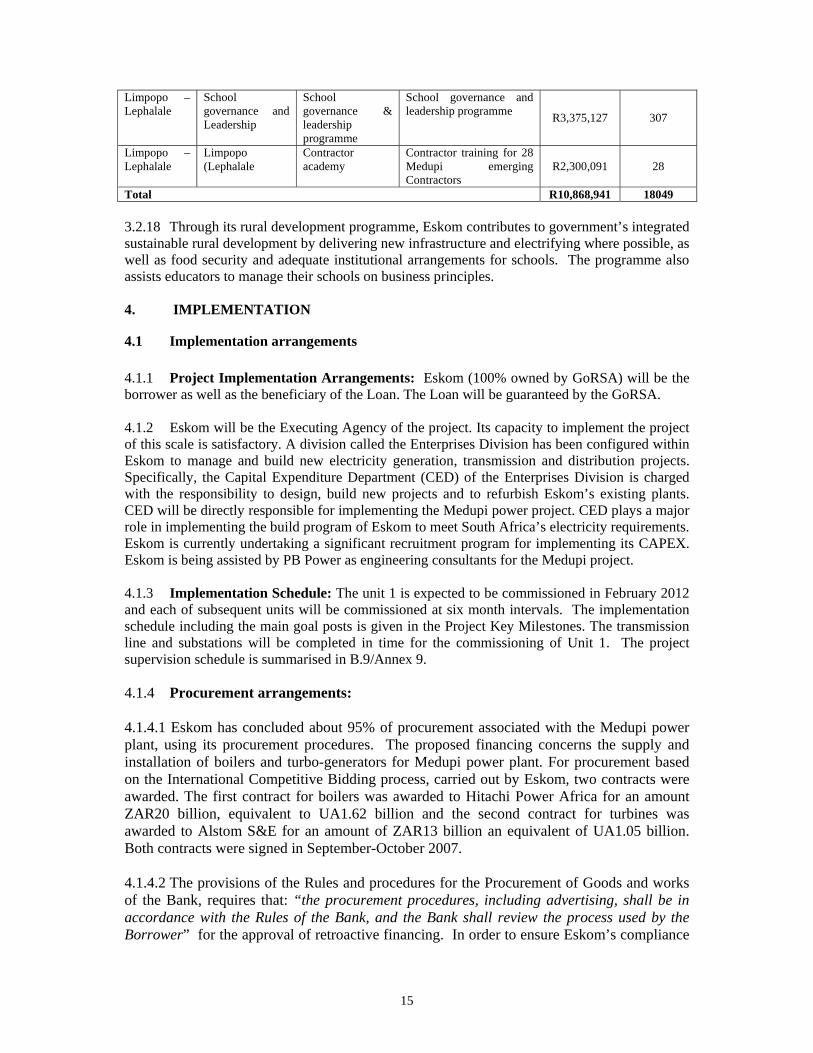
club, ICT centre and increased policing of the town. iv) National infrastructure development- The Richards Bay to Lephalale road and Lephalale bypass will be constructed at a cost of ZAR1 billion, creating 500 jobs to enable the transportation of plant components to site. A freight forwarding facility will be set up at Richards Bay at a cost of ZAR90 million employing 150 workers. 3.2.17 The Eskom Development Foundation was set up by Eskom to deliver on its corporate social investment objectives to enhance the quality of life in targeted communities whilst maximising the strategic impact of Eskom. The Development Foundation provides grants for economic development as well as donations for social projects/programs and has developed support programmes, presented in Figure 3.2, for the Lephalale community worth ZAR10.87 million.
Figure 3.2: Corporate Social Responsibility Programme in Lephalale
Province Project Description Scope of Eskom Intervention
Amount No. of Benefactors
Limpopo - Lephalale
Intel/Foundation Classroom Computers
Partnership with Intel to install classmate computers in primary schools around Lephalale
The Foundation covers the cost for the servers, teacher laptops, printers, wireless access points, hubs, cabling, classmate laptop charging trolleys, software licences for 5 years, education content training
R323,712 1714
Limpopo – Lephalale
Primary Schools Education Programme (NUMERACY)
Numeracy and Mathematics enhancement programme for primary schools
Numeracy and mathematics enhancement programme for primary schools
R2,458,067 8000
Limpopo – Lephalale
Primary Schools Education Programme (LITERACY)
Primary school language, literacy and communication
Primary school language, literacy and communication programme in 27 primary schools - 3 years
R2,411,943 8 000
15
Limpopo – Lephalale
School governance and Leadership
School governance & leadership programme
School governance and leadership programme R3,375,127 307
Limpopo – Lephalale
Limpopo (Lephalale
Contractor academy
Contractor training for 28 Medupi emerging Contractors
R2,300,091 28
Total R10,868,941 18049 3.2.18 Through its rural development programme, Eskom contributes to government’s integrated sustainable rural development by delivering new infrastructure and electrifying where possible, as well as food security and adequate institutional arrangements for schools. The programme also assists educators to manage their schools on business principles. 4. IMPLEMENTATION
4.1 Implementation arrangements 4.1.1 Project Implementation Arrangements: Eskom (100% owned by GoRSA) will be the borrower as well as the beneficiary of the Loan. The Loan will be guaranteed by the GoRSA. 4.1.2 Eskom will be the Executing Agency of the project. Its capacity to implement the project of this scale is satisfactory. A division called the Enterprises Division has been configured within Eskom to manage and build new electricity generation, transmission and distribution projects. Specifically, the Capital Expenditure Department (CED) of the Enterprises Division is charged with the responsibility to design, build new projects and to refurbish Eskom’s existing plants. CED will be directly responsible for implementing the Medupi power project. CED plays a major role in implementing the build program of Eskom to meet South Africa’s electricity requirements. Eskom is currently undertaking a significant recruitment program for implementing its CAPEX. Eskom is being assisted by PB Power as engineering consultants for the Medupi project. 4.1.3 Implementation Schedule: The unit 1 is expected to be commissioned in February 2012 and each of subsequent units will be commissioned at six month intervals. The implementation schedule including the main goal posts is given in the Project Key Milestones. The transmission line and substations will be completed in time for the commissioning of Unit 1. The project supervision schedule is summarised in B.9/Annex 9. 4.1.4 Procurement arrangements: 4.1.4.1 Eskom has concluded about 95% of procurement associated with the Medupi power plant, using its procurement procedures. The proposed financing concerns the supply and installation of boilers and turbo-generators for Medupi power plant. For procurement based on the International Competitive Bidding process, carried out by Eskom, two contracts were awarded. The first contract for boilers was awarded to Hitachi Power Africa for an amount ZAR20 billion, equivalent to UA1.62 billion and the second contract for turbines was awarded to Alstom S&E for an amount of ZAR13 billion an equivalent of UA1.05 billion. Both contracts were signed in September-October 2007. 4.1.4.2 The provisions of the Rules and procedures for the Procurement of Goods and works of the Bank, requires that: “the procurement procedures, including advertising, shall be in accordance with the Rules of the Bank, and the Bank shall review the process used by the Borrower” for the approval of retroactive financing. In order to ensure Eskom’s compliance

16
with the above provisions and the Bank’s basic principles of economy, efficiency, transparency and equal opportunity to eligible bidders, the Bank commissioned an independent review of the Eskom procurement processes. 4.1.4.3 The Bank was satisfied with conclusion of the review. Though some deviations and weaknesses from the Bank’s standards and procedures were noted, they did not alter the outcome of the process. In fact, considering that: (a) the design and construction phase of boilers and turbines is already well advanced; and (b) contracts signed by Eskom with Alstom and Hitachi were generally found cost-effective and contained sufficient safeguards to mitigate any risk that may negatively affect the deliverables of such contracts, the Procurement process followed by Eskom was globally found acceptable. 4.1.4.4 Nevertheless, the Bank has requested and Eskom has accepted to undertake the following actions, as additional fiduciary safeguards: i) The amendment of both the turbine and boilers contracts to include the Bank’s right to
audit all financed contracts in accordance with clause 1.14(e) of the Bank’s Rules and Procedures for Procurement of Goods and Works;
ii) Submission of a detailed analysis of contracts’ prices to satisfy the Bank that the boiler and turbine contract prices for Medupi were fair and reasonable with regards to the open market rates; and
iii) Presentation of an analysis of the application ASGISA (Accelerated Share Growth Initiative of South Africa), NIPP (National Industrial Participation Programme) and BEE (Black Economic Empowerment) within the framework of the boiler and turbine contracts for Medupi, in order to comply with the basic principles of national procurement policies. This process appears comparable to the domestic preference system provided under the Bank’s procurement rules.
In addition, it has also been agreed that for any amendment to the contracts (including the aggregate value of such contract amendments), that could result in an increase of the initial contract amount excluding the Cost Price Adjustment (CPA) by more than 15%, Eskom will submit such proposed amendment to the Bank for its review, comments and no objection. Further details are provided in section B5 of Annex 9. 4.1.5 Disbursement Arrangements: The disbursement methods to be applied for the Bank funded components of the project were presented to Eskom, which opted for the Special Account/Replenishment Method. In this regard, two Special Accounts will be used: one for the boilers contract and the other for turbo-generators. The modalities of disbursement and a Fund Flow Chart is given in Annex 9, section B4.5. However, the other disbursement methods will be applied should it become necessary in accordance with the Bank’s Disbursement Guidelines. 4.1.6 Financial Management, audit and reporting: An assessment of Eskom’s financial management arrangements for the implementation of the project concluded that they satisfy Bank requirements to ensure that the funds made available for the financing of the project are used economically and efficiently and for the purpose intended. Eskom is a well-established organization that has adequately qualified staff with proper systems in place for effective planning, budgeting, accounting and reporting the use of funds in the implementation of the Medupi project. A detailed financial management assessment is presented in section B4 Annex 9.
17
4.1.7 Eskom publishes annual financial statements audited by a firm of private independent auditors (currently joint venture of KPMG & SizweNtsaluba) to ensure transparency and accuracy. No problems have been reported by the external auditors in the audit report for the year ended 31 March 2009. Following the Bank’s requirements, a separate audit report will be produced for the Medupi project by the current auditors and sent to the Bank within six (6) months of the end of the respective fiscal year. The Terms of Reference (TOR) were provided to Eskom during the Appraisal Mission. The project audit will be carried out in accordance with TOR that have been approved by the Bank and include specific opinions on the project financial statements and statements of expenditures on use of the special account, internal control systems, procurement arrangements etc, with a detailed management letter. The first audited project financial statements and audit report is expected for the period to 31 March 2010.
4.2 Monitoring 4.2.1 The main deliverables of the project are six super critical boilers and turbo generators fully commissioned and operationalised to generate 4764 MW. The key project outcome is that Eskom will be able to offer electricity supply to customers with the improved availability and reliability. 4.2.2 The progress on project outputs during construction will be measured using the Consultant’s monthly reports which will indicate the progress of works relative to the work plan. During the commissioning phase, the contractors for the boiler and turbines will have to perform a number of tests which are required for commissioning of boilers and turbo-generators, which need to be passed. Separately, the achievement of the project outcomes will be measured using sector statistics compiled by Eskom. Finally, compliance with environmental and social guidelines will be assessed and confirmed by DEA. Quarterly Progress Reports (QPRs) detailing the progress of the Project’s implementation will be submitted to the Bank.
4.3 Governance 4.3.1 Eskom is regulated under licenses granted by the National Energy Regulator of South Africa (NERSA), originally under the Electricity Act (41 of 1987) – and latterly under the Electricity Regulation Act (4 of 2006) – and by the National Nuclear Regulator in terms of the National Nuclear Regulatory Act (47 of 1999). NERSA is charged with regulating the energy industry of South Africa, namely pipe gas, electricity, petroleum products in accordance with government policies, laws, regulation and the international best practices. 4.3.2 Eskom controls about 95% of electricity market in South Africa. It is a parastatal and is a vertically integrated company having monopoly on the bulk supply of electricity in the country. Eskom also operates and maintains the electricity grid. In 2003, Cabinet decided to increase private participation in the electricity industry. The Department of Energy is responsible for attracting IPP participation and assists in the preparation of the Integrated Energy Resource Plan for the country. 4.3.3 Eskom has revised its business model; done ring fencing of its operational units in preparation for restructuring of the electricity distribution industry. The electricity distribution in South Africa is done by both Eskom and municipalities. The performance of municipalities with respect to electricity distribution is unsatisfactory. In October 2006, Cabinet, recognising the fractured nature of the electricity distribution industry, approved the restructuring of the electricity distribution industry by merging the distribution system of Eskom and of the municipalities. The government’s proposed plan envisages the creation of six Regional Electricity Distributors (REDs) to be formed by combining the distribution networks of Eskom and municipalities. The REDS will be implemented by the Electricity Distribution Industry Holdings

18
(Pty) Ltd, as public entities, one of which has already been established at the Western Cape. Going forward, the acceleration of the restructuring process of and investment in the electricity distribution industry is needed. The critical next step is the drafting and enacting of the enabling legislation to improve the governance of the electricity distribution industry;
4.4 Sustainability 4.4.1 The project as conceptualized is technically sound, socially acceptable and environmentally sustainable. All project components including the power plant, high voltage transmission lines and substations will be based on standard state of the art technology. 4.4.2 Eskom is a world class utility which is generating, transmitting and partially distributing electricity in South Africa. Eskom has been building and operating coal fired power plants for a long time. It has gained necessary expertise, competence and know how of building power plants. As regards the implementation of Medupi, it is being assisted by international consultants. 4.4.3 The Medupi power plant employs super-critical boiler and dry cooling technologies which contribute to sustainable economy, not harmful to the environment. Eskom is committed to climate change mitigation initiatives. 4.4.4 The GoRSA is committed to the sustainability of Eskom and besides financial support, has instituted various support initiatives, such as (i) the strategic importance of Eskom to undertake its expansion programme and keep the cost of electricity reasonable, (ii) the involvement of NERSA, National Treasury and DPE in enacting supportive policies, (iii) Eskom’s integral role in the restructuring of the distribution function, and (iv) the government’s recognition of a dividend moratorium during the expansion period.
4.5 Risk management 4.5.1 Eskom Holdings has a fully integrated risk management (IRM) programme and strives to comply with the requirements of King II, the DPE Risk Management Framework and the broad guidelines of international benchmarks such as the Integrated Risk Management of South Africa (IRMSA) Code of Practice, the Committee Sponsoring Organisations of the Treadway Commission (COSO), and other international risk guidelines. The major risks and mitigating measures during project implementation are outlined below:
(a) Mobilization of financing for the project: The total project cost of ZAR125.63 billion will be financed by the AfDB (17%), World Bank (19%), and ECAs (11%) and the balance of ZAR67.92 billion (53%) will be funded by Eskom. The GoRSA has committed itself to supporting the CAPEX programme through a subordinated debt of ZAR60 billion (of which ZAR10 billion was received in the FY 2008-09) and guarantees of ZAR176 billion (ZAR150 billion not yet used). Eskom expects to raise debt of ZAR30 - 40 billion per annum (net) over the next five years. Additional funding for this project and the build programme is expected to come from internally generated funds. NERSA has provided an indicative electricity tariff price path over the next four years which is aimed at ensuring that Eskom is able to generate funds internally, retain its investment grade status and is able to raise funds on the market.
(b) Construction of Power Plant: The power plant involves 38 contract packages to be executed all in a confined space. The interfacing of various packages poses a potential risk to timely completion of the project. To mitigate this risk, Eskom uses the Interface Management software which plans the construction packages in an integrated sequential manner and combines the up-front engineering and physical construction with visualisation of the project design in the three dimensional setting. With this type of technology, construction risk is materially minimised.
19
(c) Construction of the Associated Transmission Infrastructure: The transmission infrastructure necessary for the evacuation of power generated at Medupi is already under construction and on schedule to be completed in time for commissioning of unit 1 in February 2012. Towards this end, the construction of the transmission system has been split into several packages to be implemented in parallel by different contractors. However, the main risk is the environmental and social management including the resettlement and compensation of the affected parties. To address these risks, Medupi loop into Matimba-Spitskop transmission line is under construction to evacuate power from Unit 1 from February 2012. This arrangement will also provide the electricity for commissioning of Medupi power plant. (d) Water resources: The Department of Water Affairs has allocated water for Medupi plant from the Mokolo Dam reservoir. Due to limited availability of water in Lephalale area, Eskom has already taken several risk mitigation measures, which are described in para 2.2.5. (e) Coal supplies: The appraisal mission confirmed that the coal for power generation will be supplied by a coal mining company called EXXARO. The details are presented in para 2.2.4.
(f) Emissions and air quality: One of the key risks will arise from the proximity of the proposed power plant to the existing Matimba Power Plant. The existing Matimba Power Plant does not have Sulphur Dioxide (SO2) and Nitrous Oxides (NOx) abatement measures in place. Ambient SO2 levels resulting from the new power station can cause health effects in the Marapong residential area. The mitigation measures are described in para 3.2.5 and 3.2.6.
(g) Climate change Mitigation: Risk mitigation measures are described in para 3.2.10-3.2.11.
(h) Human resources: Eskom has to grow its staff complement not only to build new generation and network capacity but also to operate and maintain both existing and new plants. Eskom has been losing its critical and scarce skills to a highly competitive labor market. The Group was forced to review its remuneration strategy in 2008 in order to attract and retain staff, particularly those with scarce and critical skills.
4.6 Knowledge Building 4.6.1 GoRSA has established the National Energy Regulator of South Africa (NERSA); and it is restructuring the Electricity Distribution Industry. To attract the Independent Power Producers, the status of System Operator in Eskom has been raised to be at par with other Managing Directors of Eskom. The Independent System Operator (ISO) will be responsible for preparing an Integrated Energy Resource Plan, undertaking dispatch functions and providing IPPs with open access to the transmission grid. This will promote private investment in the power sector.
4.6.2 In the year to March 2009, Eskom spent ZAR283 million on training for staff and instituted an academy of learning with six faculties: engineering, apprenticeship, services, project management, leadership and finance. Building of capacity through skill transfer and knowledge management is also integrally built into the contracts for the supply of boilers and turbo-generators.

20
5. LEGAL INSTRUMENTS AND AUTHORITY
5.1. Legal instrument The legal instruments used for the project is: • A Loan agreement to be entered into between Eskom and AfDB • A Guarantee Agreement to be entered into between the Bank and the Government of the
Republic of South Africa
5.2. Conditions associated with Bank’s intervention
(A) Conditions Precedent to Entry into Force of the Loan
The entry into force of the Loan Agreement and the Guarantee Agreement shall be subject to the fulfilment by the Borrower and the Guarantor of the provisions of Section 12.01 of the General Conditions Applicable to Loan Agreements and Guarantee Agreements of the Bank. (B) Conditions Precedent to First Disbursement of the Loan
The first disbursement of the Loan shall be subject to the fulfilment by the Borrower and the Guarantor of the appropriate provisions of Section 12.02 (i), 12.02(ii) and the following operational conditions: i) Evidence satisfactory to the Bank of the opening of the Special Accounts for each of the
following contracts: (a) boilers (b) turbo-generators; and ii) Evidence satisfactory to the Bank that loans from co-financiers are being processed. 5.3 Compliance with Bank Policies
This project complies with all applicable Bank policies, particularly the Public Sector Lending Policies, the Strategic Framework for Enhancing Bank Group Support to Middle Income Countries (MICs), Integrated Environmental and Social Assessment Procedures, Bank’s Policy on Resettlement and Involuntary Displacement, and Bank’s crosscutting themes of Gender, Governance, Poverty and consultations with stakeholders. 6. RECOMMENDATION The Management recommends that the Board of Directors approve the proposed loan of UA 1.70 billion (Euro 1.86 billion) to Eskom for the purposes and subject to the conditions stipulated in this report and in the Loan Agreement.

Annex 1 South Africa Eskom Medupi Power Project
Country’s comparative socio-economic indicators
South Africa
Develo- ping
Countries
Develo- ped
Countries
Year Africa
Basic Indicators Area ( '000 Km²) 1 221 30 323 80 976 54 658 Total Population (millions) 2008 49 986 5,521 1,229 Urban Population (% of Total) 2008 60.8 39.1 44.2 74.6 Population Density (per Km²) 2008 40.0 32.6 66.6 23.1 GNI per Capita (US $) 2007 5 760 1 226 2 405 38 579 Labor Force Participation - Total (%) 2005 36.1 42.3 45.6 54.6 Labor Force Participation - Female (%) 2005 38.7 41.1 39.7 44.9 Gender -Related Development Index Value 2005 0.667 0.482 0.694 0.911 Human Develop. Index (Rank among 174 2006 125 n.a. n.a. n.a. Popul. Living Below $ 1 a Day (% of 2005 … 34.3 25.0 … Demographic Indicators Population Growth Rate - Total (%) 2008 1.0 2.3 1.4 0.3 Population Growth Rate - Urban (%) 2008 1.8 3.3 2.5 0.6 Population < 15 years (%) 2008 30.8 56.0 40.0 16.6 Population >= 65 years (%) 2008 4.4 4.5 3.3 15.6 Dependency Ratio (%) 2008 56.8 78.0 52.8 49,O Sex Ratio (per 100 female) 2008 97.2 100.7 96.7 106.0 Female Population 15-49 years (% of total 2008 27.2 48.5 53.3 47.2 Life Expectancy at Birth - Total (years) 2008 51.6 54.3 65.8 77.1 Life Expectancy at Birth - Female (years) 2008 53.1 55.5 67.6 80.6 Crude Birth Rate (per 1,000) 2008 22.0 35.8 22.2 11.2 Crude Death Rate (per 1,000) 2008 15.2 12.4 8.1 10.1 Infant Mortality Rate (per 1,000) 2008 47.9 81.8 51.4 6.3 Child Mortality Rate (per 1,000) 2008 69.5 134.5 77.4 7.9 Total Fertility Rate (per woman) 2008 2.5 4.6 2.7 1.6 Maternal Mortality Rate (per 100,000) 2003 110.0 683.0 450.0 9.0 Women Using Contraception (%) 2003 50.6 29.7 61.0 75.0 Health & Nutrition Indicators Physicians (per 100,000 people) 2007 75.3 39.6 78.0 287.0 Nurses (per 100,000 people)* 2007 329.3 120.4 98.0 782.0 Births attended by Trained Health Personnel 2003 92.0 51.2 59.0 99.0 Access to Safe Water (% of Population) 2006 93.0 64.3 84.0 100.0 Access to Health Services (% of Population) 2005 … 61.7 80.0 100.0 Access to Sanitation (% of Population) 2006 59.0 37.6 53.0 100.0 Percent. of Adults (aged 15-49) Living with 2007 18.6 4.5 1.3 0.3 Incidence of Tuberculosis (per 100,000) 2007 18.6 315.8 275.0 19.0 Child Immunization Against Tuberculosis (%) 2007 77.0 83.0 89.0 99.0 Child Immunization Against Measles (%) 2007 83.0 83.1 81.0 93.0 Underweight Children (% of children under 5 2003 9.0 25.2 27.0 0.1 Daily Calorie Supply per Capita 2004 3 004 2 436 2 675 3 285 Public Expenditure on Health (as % of GDP) 2007 3.1 2.4 1.8 6.3 Education Indicators Gross Enrolment Ratio (%) Primary School - Total 2008 98.0 99.6 106.0 101.0 Primary School - Female 2008 92.9 92.1 103.0 101.0 Secondary School - Total 2008 85.0 43.5 60.0 101.5 Secondary School - Female 2008 96.4 40.8 58.0 101.0 Primary School Female Teaching Staff (% of 2004 76.1 47.5 51.0 82.0 Adult Illiteracy Rate - Total (%) 2007 12.0 38.0 21.0 1.0 Adult Illiteracy Rate - Male (%) 2007 11.1 29.0 15.0 1.0 Adult Illiteracy Rate - Female (%) 2007 12.8 47.0 27.0 1.0 Percentage of GDP Spent on Education 2007 5.4 4.5 3.9 5.9 Environmental Indicators Land Use (Arable Land as % of Total Land 2005 12.1 6.0 9.9 11.6 Annual Rate of Deforestation (%) 2005 … 0.7 0.4 -0.2 Annual Rate of Reforestation (%) 2005 … 10.9 … … Per Capita CO2 Emissions (metric tons) 2006 9.2 1.0 1.9 12.3 Sources : AFDB Statistics Department Databases; World Bank: World Development Indicators; Last Updated: September 2009
UNAIDS; UNSD; WHO, UNICEF, WRI, UNDP; Country Reports. Note : n.a. : Not Applicable ; … : Data Not Available.
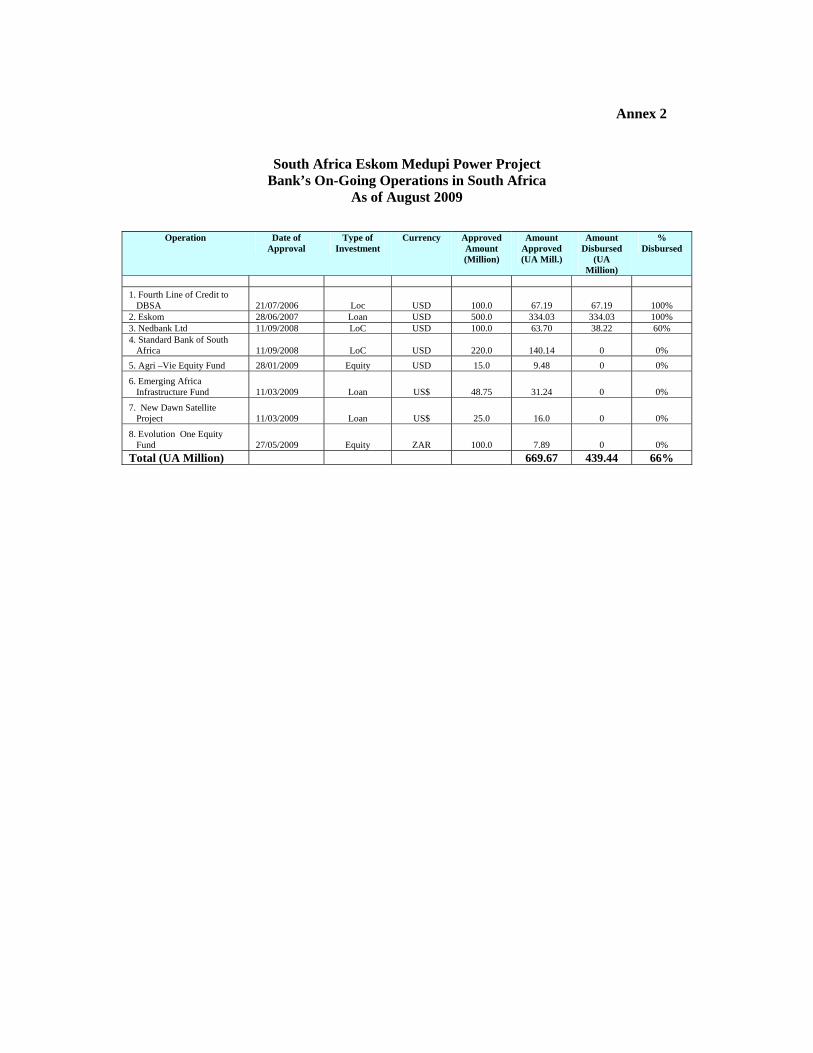
Annex 2
South Africa Eskom Medupi Power Project Bank’s On-Going Operations in South Africa
As of August 2009
Operation Date of Approval
Type of Investment
Currency Approved Amount (Million)
Amount Approved (UA Mill.)
Amount Disbursed
(UA Million)
% Disbursed
1. Fourth Line of Credit to
DBSA 21/07/2006 Loc USD 100.0 67.19 67.19 100%2. Eskom 28/06/2007 Loan USD 500.0 334.03 334.03 100%3. Nedbank Ltd 11/09/2008 LoC USD 100.0 63.70 38.22 60%4. Standard Bank of South
Africa 11/09/2008 LoC USD 220.0 140.14 0 0%5. Agri –Vie Equity Fund 28/01/2009 Equity USD 15.0 9.48 0 0%
6. Emerging Africa Infrastructure Fund 11/03/2009 Loan US$ 48.75 31.24 0 0%
7. New Dawn Satellite Project 11/03/2009 Loan US$ 25.0 16.0 0 0%
8. Evolution One Equity Fund 27/05/2009 Equity ZAR 100.0 7.89 0 0%
Total (UA Million) 669.67 439.44 66%

Annex 3
South Africa Eskom Medupi Power Project Bank’s Cumulative Operations in South Africa
since 1997
s/n Project Name Project Amount (Million)
Currency Approval Date Amount
Approved (UA Mill)
Amount Disbursed (UA Mill)
Undisbursed Amount (UA Mill)
% Disburs
ed
1a First LoC to DBSA 70 US$ 09.09.1998 53.85 53.85 - 100 1b First LOC to DBSA 340 ZAR 09.09.1998 51.03 51.03 - 100 2 Second LoC to DBSA 500 ZAR 10.11.1999 61.81 61.81 - 100 3 Third LoC to DBSA 100 US$ 16.07.2003 72.26 72.26 - 100 4 Fourth Loc to DBSA 100 US$ 21.07.2006 67.19 67.19 - 100 5 First LoC to IDC 100 US$ 28.06.2000 74.25 74.25 - 100 6 Second LOC to IDC 357.5 ZAR 05.11.2004 18.87 18.87 - 100
7 Programme to Support SME Franchising 48.35 ZAR 19.05.2004 4.77 4.77 - 100
8 Loan to ESKOM 500 US$ 28.06.2007 334.03 334.03 - 100 9 LoC to Nedbank 100 US$ 11.09.2008 63.7 38.22 25.48 60
10 LoC to Standard Bank 220 US$ 11.09.2008 140.14 82.82 57.32 59.1 11 Agri-Vie Equity Fund 15 US$ 28.01.2009 9.48 - 9.48 0 12 New Dawn Satellite Project 25 US$ 11.03.2009 16 - 16 0 13 Emerging Africa Inf. Fund 48.8 US$ 11.03.2009 31.24 - 31.24 0 14 Evolution One Equity Fund 100 ZAR 27.05.2009 7.89 - 7.89 0
15 Integrated Water Harvest Project (Africa Water Facility) 0.374 Euro 14.04.2009 0.343 - 0.343
16 LoC to Standard Bank of South Africa Ltd. (Global Trade Facility Program)
100 US$ 07.09.2009 67 - 67 0
Total 1073.83 859.09 147.74 80

Annex 4
South Africa Medupi Project Map of South Africa showing key generation and transmission projects (proposed and
existing)
BLOEMFONTEI
DE AAR
KOMATIPOORT
RICHARD'S BAY
WITBANKNamibia
Botswana
Mozambiqu
Swaziland
CAPE
DURBAN
EAST
PORT ELIZABETH
DE AAR
Mercury
Perseus
Hydra
Gamma
Omega
Kudu
200
200
2009
765400
Medupi2009/10 for integration of Medupi
Power Station
Marang
Dinaledi
Grassridge
Eros
Delphi
Neptune2010
2007
BEAUFORT
Juno
Bloemfontein
2010
2010
2010
2011
Beta
Kappa
Ariadne
Melmoth
Umtata
2010
Majuba
200
2010
PRETORI