sourcing strategy best practices – bringing spend … milo & patrick baranowsky st. louis, mo...
TRANSCRIPT
Christopher Milo & Patrick Baranowsky
St. Louis, MOJune 2009
Sourcing Strategy Best Practices –Bringing Spend Analysis to the DoD
June 2009 ISPA/SCEA Professional Development and Training Workshop
Presented at the 2009 ISPA/SCEA Joint Annual Conference and Training Workshop - www.iceaaonline.com

1
Agenda
Purpose and Benefits
History
Frameworks
Case Study: Commercial SATCOM Spend Analysis
Presented at the 2009 ISPA/SCEA Joint Annual Conference and Training Workshop - www.iceaaonline.com

2
Agenda
Purpose and Benefits
History
Frameworks
Case Study: Commercial SATCOM Spend Analysis
Presented at the 2009 ISPA/SCEA Joint Annual Conference and Training Workshop - www.iceaaonline.com

3
I know my organization is spending millions of dollars, but…What goods or services are being purchased?
Who are my suppliers?
Who are my consumers?
Are expenditures consistent with policy?
Are expenditures cost effective?
What trends are being experienced?
How many different contracts are being utilized and to buy what goods or services?
Are buying patterns leveraging or diluting buying power?
These types of questions are faced by any organization procuringgoods or services and developing acquisition and sourcing strategies
Presented at the 2009 ISPA/SCEA Joint Annual Conference and Training Workshop - www.iceaaonline.com
4
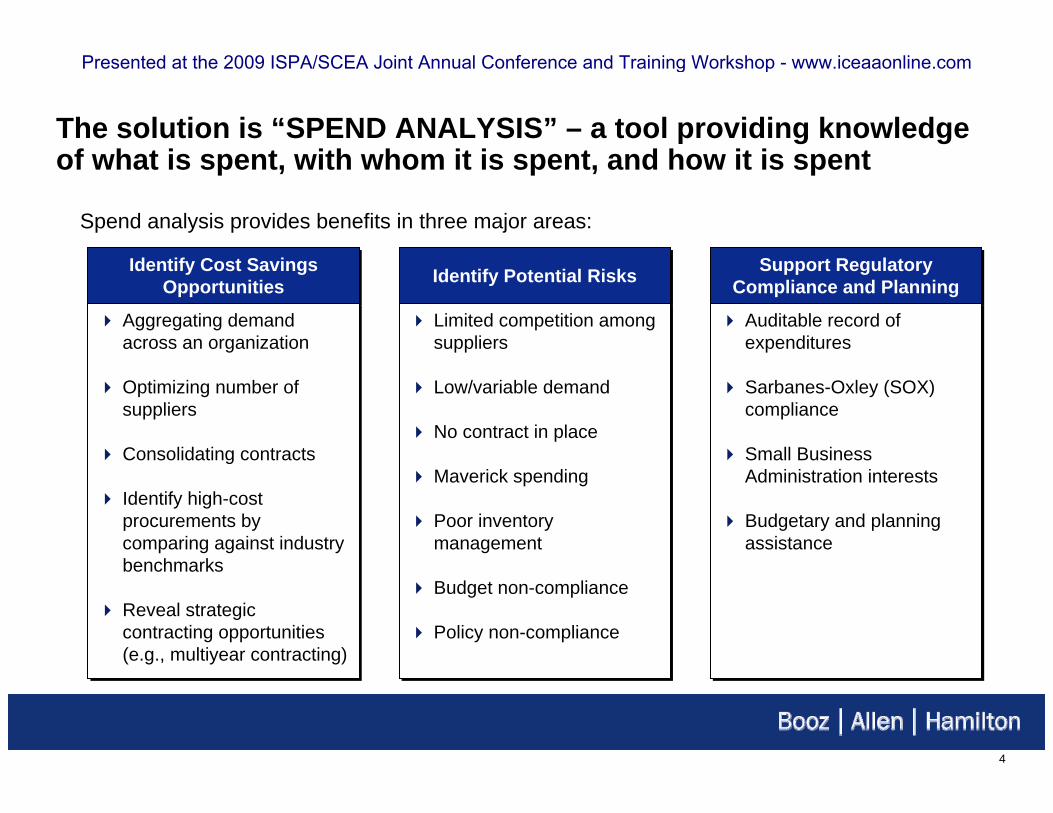
The solution is “SPEND ANALYSIS” – a tool providing knowledge of what is spent, with whom it is spent, and how it is spent
Spend analysis provides benefits in three major areas:
Identify Cost Savings Opportunities
Identify Cost Savings Opportunities
Aggregating demand across an organization
Optimizing number of suppliers
Consolidating contracts
Identify high-cost procurements by comparing against industry benchmarks
Reveal strategic contracting opportunities (e.g., multiyear contracting)
Aggregating demand across an organization
Optimizing number of suppliers
Consolidating contracts
Identify high-cost procurements by comparing against industry benchmarks
Reveal strategic contracting opportunities (e.g., multiyear contracting)
Identify Potential RisksIdentify Potential Risks
Limited competition among suppliers
Low/variable demand
No contract in place
Maverick spending
Poor inventory management
Budget non-compliance
Policy non-compliance
Limited competition among suppliers
Low/variable demand
No contract in place
Maverick spending
Poor inventory management
Budget non-compliance
Policy non-compliance
Support Regulatory Compliance and Planning
Support Regulatory Compliance and Planning
Auditable record of expenditures
Sarbanes-Oxley (SOX) compliance
Small Business Administration interests
Budgetary and planning assistance
Auditable record of expenditures
Sarbanes-Oxley (SOX) compliance
Small Business Administration interests
Budgetary and planning assistance
Presented at the 2009 ISPA/SCEA Joint Annual Conference and Training Workshop - www.iceaaonline.com

5
Agenda
Purpose and Benefits
History
Frameworks
Case Study: Commercial SATCOM Spend Analysis
Presented at the 2009 ISPA/SCEA Joint Annual Conference and Training Workshop - www.iceaaonline.com
6
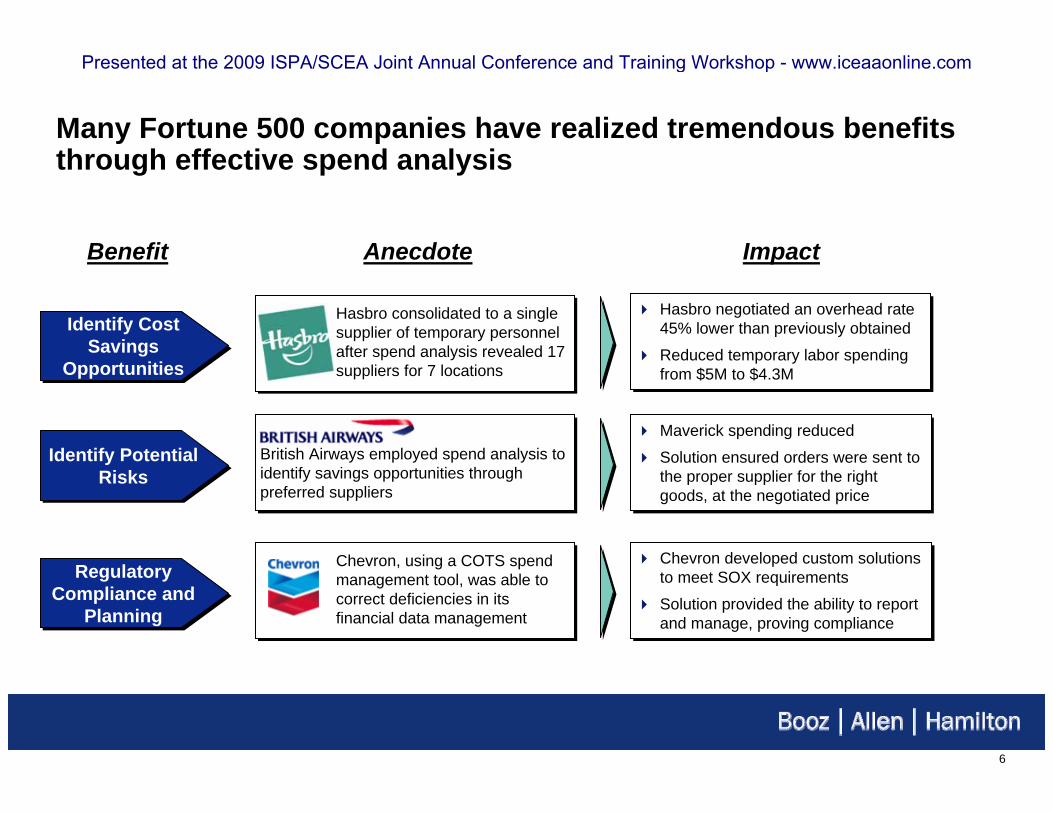
Many Fortune 500 companies have realized tremendous benefits through effective spend analysis
Hasbro negotiated an overhead rate 45% lower than previously obtained
Reduced temporary labor spending from $5M to $4.3M
Hasbro negotiated an overhead rate 45% lower than previously obtained
Reduced temporary labor spending from $5M to $4.3M
Maverick spending reduced
Solution ensured orders were sent to the proper supplier for the right goods, at the negotiated price
Maverick spending reduced
Solution ensured orders were sent to the proper supplier for the right goods, at the negotiated price
Chevron developed custom solutions to meet SOX requirements
Solution provided the ability to report and manage, proving compliance
Chevron developed custom solutions to meet SOX requirements
Solution provided the ability to report and manage, proving compliance
Identify Cost Savings
Opportunities
Identify Cost Savings
Opportunities
Identify Potential Risks
Identify Potential Risks
Regulatory Compliance and
Planning
Regulatory Compliance and
Planning
Benefit Anecdote Impact
Chevron, using a COTS spend management tool, was able to correct deficiencies in its financial data management
British Airways employed spend analysis to identify savings opportunities through preferred suppliers
Hasbro consolidated to a single supplier of temporary personnel after spend analysis revealed 17 suppliers for 7 locations
Presented at the 2009 ISPA/SCEA Joint Annual Conference and Training Workshop - www.iceaaonline.com
7
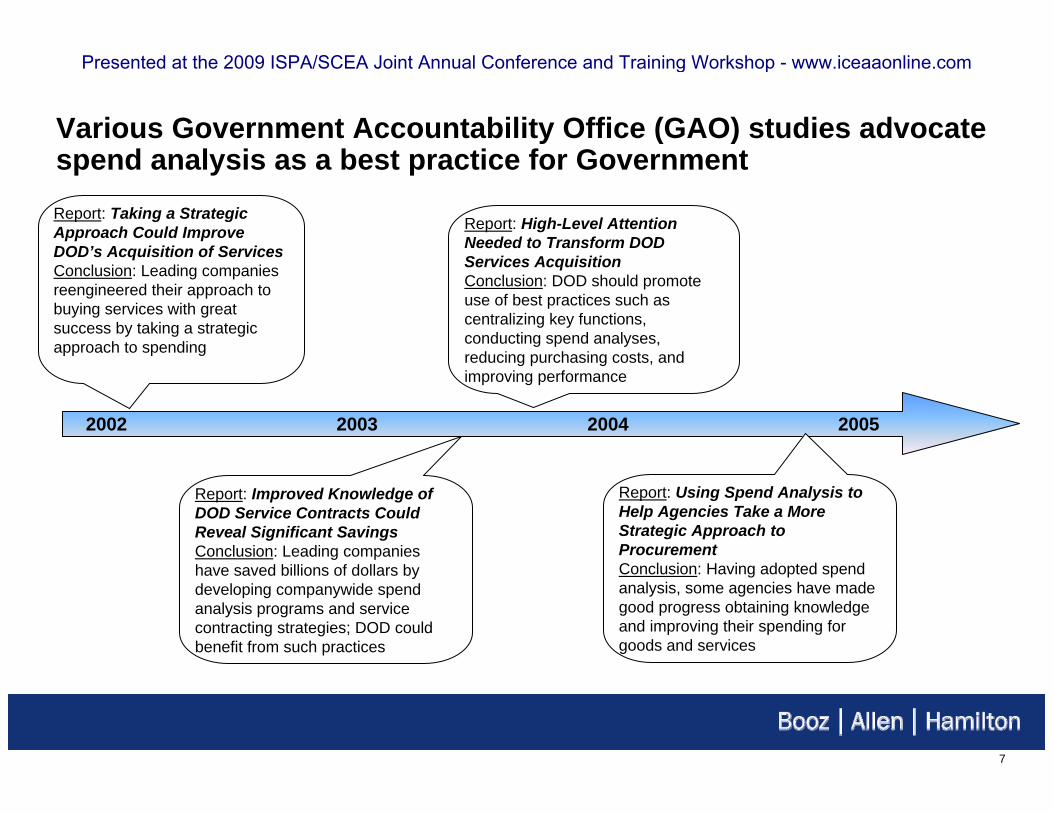
Various Government Accountability Office (GAO) studies advocate spend analysis as a best practice for Government
2002 2003 2004 2005
Report: Taking a Strategic Approach Could Improve DOD’s Acquisition of ServicesConclusion: Leading companies reengineered their approach to buying services with great success by taking a strategic approach to spending
Report: Improved Knowledge of DOD Service Contracts Could Reveal Significant SavingsConclusion: Leading companies have saved billions of dollars by developing companywide spend analysis programs and service contracting strategies; DOD could benefit from such practices
Report: High-Level Attention Needed to Transform DOD Services AcquisitionConclusion: DOD should promote use of best practices such as centralizing key functions, conducting spend analyses, reducing purchasing costs, and improving performance
Report: Using Spend Analysis to Help Agencies Take a More Strategic Approach to ProcurementConclusion: Having adopted spend analysis, some agencies have made good progress obtaining knowledge and improving their spending for goods and services
Presented at the 2009 ISPA/SCEA Joint Annual Conference and Training Workshop - www.iceaaonline.com

8
Recent DoD, OMB, and Congressional direction require continual data collection and spend analyses as part of the Government’s strategic sourcing effort
“Each agency’s CAO, CFO, and CIO are responsible for the overall development and implementation of the agency strategic sourcing effort, which begins with a spend analysis and identification of commodities for which strategic sourcing should be implemented.”
“[Senior Officials shall] monitor required data collection and conduct periodic spend analyses.”
“The Secretary of Defense shall, as part of the effort of the DoD to develop a revised strategy…perform a complete spend analysis of the acquisitions of the Department...”
October 2, 2006 – DoD provides revised services acquisition policy – including spend analysis language – to be included in the next revision to the DoD Instruction 5000.2
May 20, 2005 – Office of Management and Budget (OMB) releases memo outlining strategic sourcing efforts and the role of spend analysis in support of these efforts
January 6, 2006 – Congress directs DoD to perform a complete spend analysis of its commercial SATCOM procurement
Presented at the 2009 ISPA/SCEA Joint Annual Conference and Training Workshop - www.iceaaonline.com
9
Agenda
Purpose and Benefits
History
Frameworks
Case Study: Commercial SATCOM Spend Analysis
Presented at the 2009 ISPA/SCEA Joint Annual Conference and Training Workshop - www.iceaaonline.com

10
The basic spend analysis framework consists of five steps
Sources of spending identified across enterprise
Spending databases identified
Identify Data Sources
Collect and Aggregate
DataCleanse Data Enrich Data Analyze Data
Data collected from internal and external sources
Data combined into logical format to facilitate later steps
Data made consistent (e.g., names, units)
Questionable data identified and resolved
Data categorized appropriately
Obtain missing data
Merge any additional useful data (e.g., contract info)
“Slice and dice”data identifying useful trends and patterns
Different permutations of this basic framework exist, but at thecore, essentially the same tasks are executed
Presented at the 2009 ISPA/SCEA Joint Annual Conference and Training Workshop - www.iceaaonline.com

11
Identifying a complete set of spend data sources is critical to producing useful results
ObjectiveObjective
Identify the complete set of all possible spend data sources across the enterprise
Identify the complete set of all possible spend data sources across the enterprise
ChallengesChallenges
Disparate data sources
Numerous buyers across the enterprise
Data sources external to the enterprise
Disparate data sources
Numerous buyers across the enterprise
Data sources external to the enterprise
Best PracticesBest Practices
Start with most obvious sources such as Accounts Payable, General Ledger, ERP, and purchasing systems
Interview those responsible for purchasing to identify additional sources
Start with most obvious sources such as Accounts Payable, General Ledger, ERP, and purchasing systems
Interview those responsible for purchasing to identify additional sources
Identify Data Sources
Collect and Aggregate
DataCleanse Data Enrich Data Analyze Data
Presented at the 2009 ISPA/SCEA Joint Annual Conference and Training Workshop - www.iceaaonline.com
12
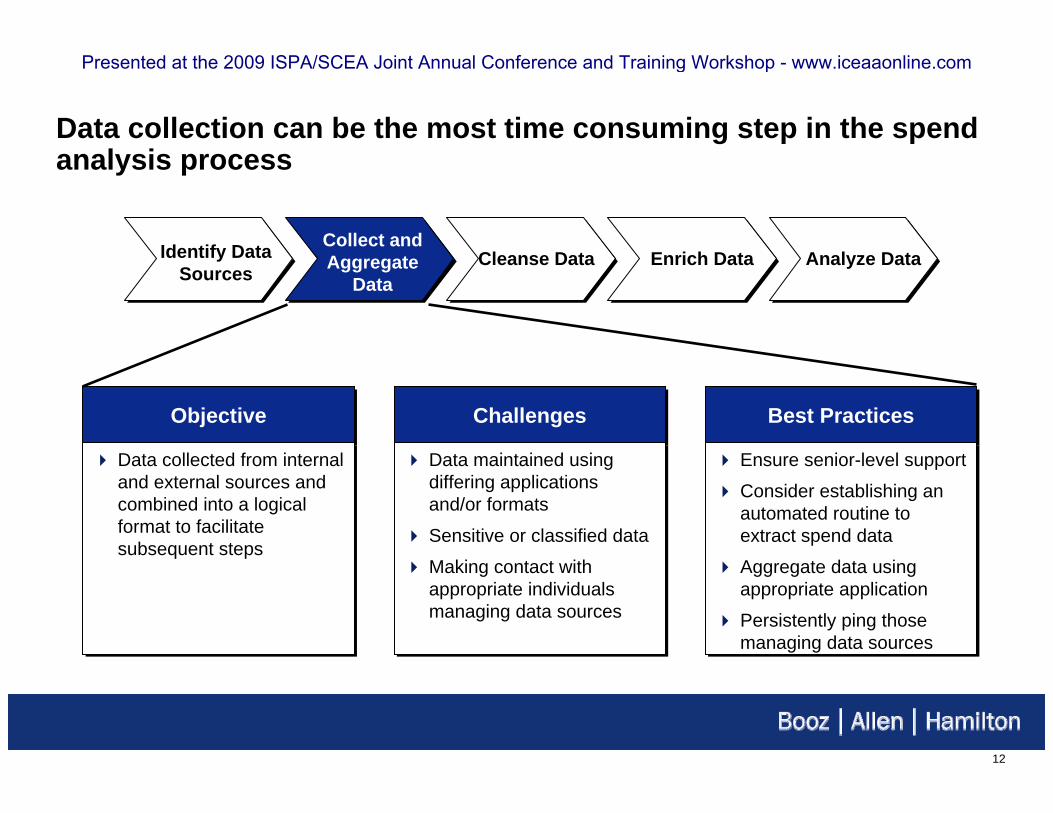
Data collection can be the most time consuming step in the spendanalysis process
Identify Data Sources
Collect and Aggregate
DataCleanse Data Enrich Data Analyze Data
ObjectiveObjective
Data collected from internal and external sources and combined into a logical format to facilitate subsequent steps
Data collected from internal and external sources and combined into a logical format to facilitate subsequent steps
ChallengesChallenges
Data maintained using differing applications and/or formats
Sensitive or classified data
Making contact with appropriate individuals managing data sources
Data maintained using differing applications and/or formats
Sensitive or classified data
Making contact with appropriate individuals managing data sources
Best PracticesBest Practices
Ensure senior-level support
Consider establishing an automated routine to extract spend data
Aggregate data using appropriate application
Persistently ping those managing data sources
Ensure senior-level support
Consider establishing an automated routine to extract spend data
Aggregate data using appropriate application
Persistently ping those managing data sources
Presented at the 2009 ISPA/SCEA Joint Annual Conference and Training Workshop - www.iceaaonline.com

13
Cleansing data is necessary – data integrity directly impacts the quality and effectiveness of spend analysis
Identify Data Sources
Collect and Aggregate
DataCleanse Data Enrich Data Analyze Data
ObjectiveObjective
Ensure consistency across all data and identify and resolve questionable data
Ensure consistency across all data and identify and resolve questionable data
ChallengesChallenges
Inconsistent data
Duplicative data
Inaccurate data
Incomplete/missing data
Miscategorized data
Inconsistent data
Duplicative data
Inaccurate data
Incomplete/missing data
Miscategorized data
Best PracticesBest Practices
Employ tools that can help identify missing or “dirty data”
Employ subject matter experts when cleansing data
Establish repeatable cleansing process
Employ tools that can help identify missing or “dirty data”
Employ subject matter experts when cleansing data
Establish repeatable cleansing process
Presented at the 2009 ISPA/SCEA Joint Annual Conference and Training Workshop - www.iceaaonline.com
14
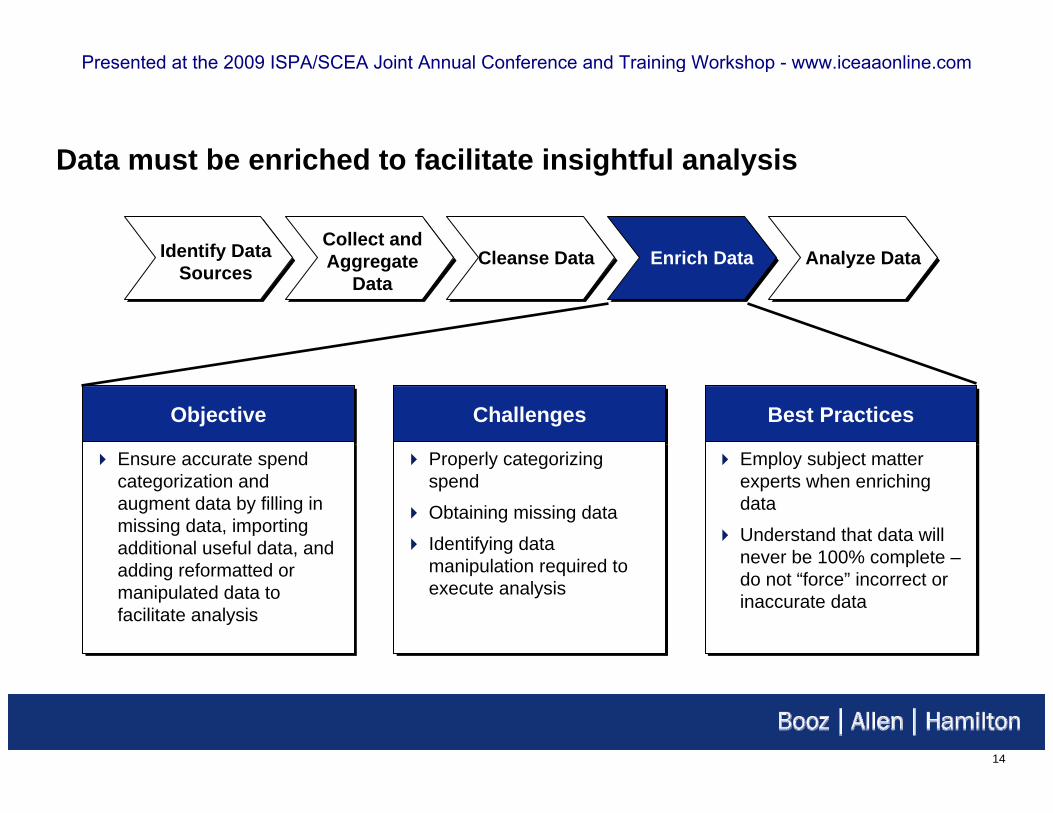
Data must be enriched to facilitate insightful analysis
Identify Data Sources
Collect and Aggregate
DataCleanse Data Enrich Data Analyze Data
ObjectiveObjective
Ensure accurate spend categorization and augment data by filling in missing data, importing additional useful data, and adding reformatted or manipulated data to facilitate analysis
Ensure accurate spend categorization and augment data by filling in missing data, importing additional useful data, and adding reformatted or manipulated data to facilitate analysis
ChallengesChallenges
Properly categorizing spend
Obtaining missing data
Identifying data manipulation required to execute analysis
Properly categorizing spend
Obtaining missing data
Identifying data manipulation required to execute analysis
Best PracticesBest Practices
Employ subject matter experts when enriching data
Understand that data will never be 100% complete –do not “force” incorrect or inaccurate data
Employ subject matter experts when enriching data
Understand that data will never be 100% complete –do not “force” incorrect or inaccurate data
Presented at the 2009 ISPA/SCEA Joint Annual Conference and Training Workshop - www.iceaaonline.com
15
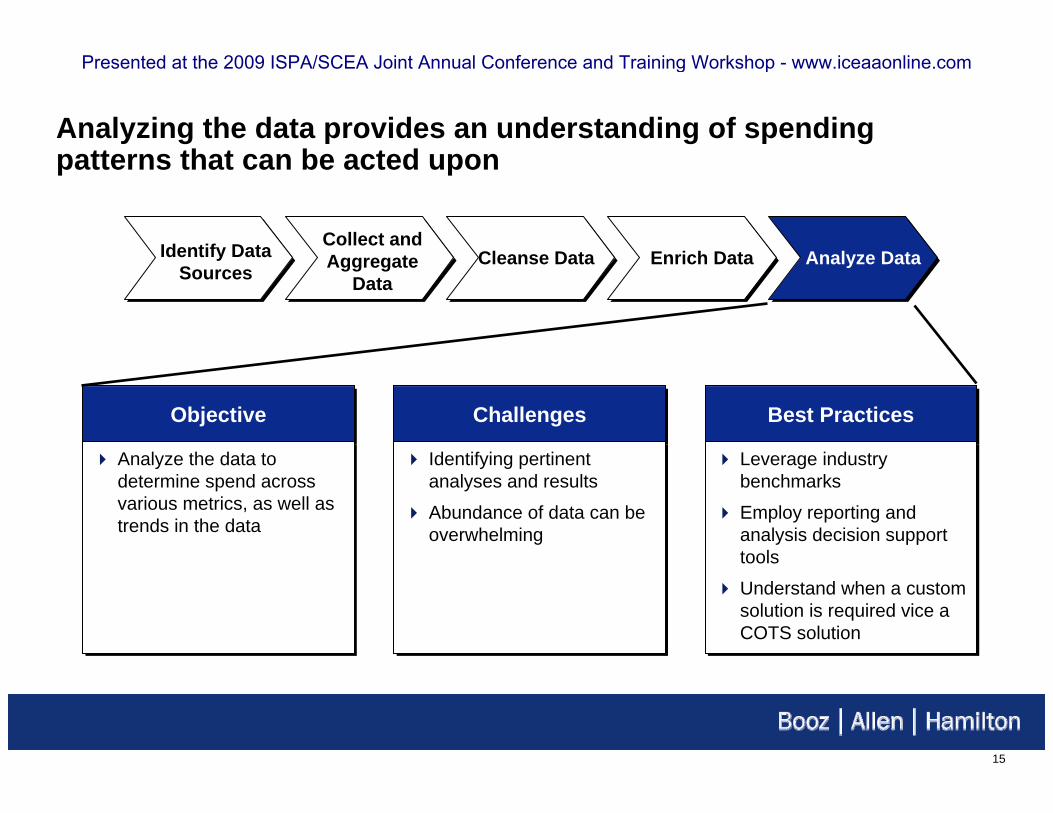
Analyzing the data provides an understanding of spending patterns that can be acted upon
Identify Data Sources
Collect and Aggregate
DataCleanse Data Enrich Data Analyze Data
ObjectiveObjective
Analyze the data to determine spend across various metrics, as well as trends in the data
Analyze the data to determine spend across various metrics, as well as trends in the data
ChallengesChallenges
Identifying pertinent analyses and results
Abundance of data can be overwhelming
Identifying pertinent analyses and results
Abundance of data can be overwhelming
Best PracticesBest Practices
Leverage industry benchmarks
Employ reporting and analysis decision support tools
Understand when a custom solution is required vice a COTS solution
Leverage industry benchmarks
Employ reporting and analysis decision support tools
Understand when a custom solution is required vice a COTS solution
Presented at the 2009 ISPA/SCEA Joint Annual Conference and Training Workshop - www.iceaaonline.com
16
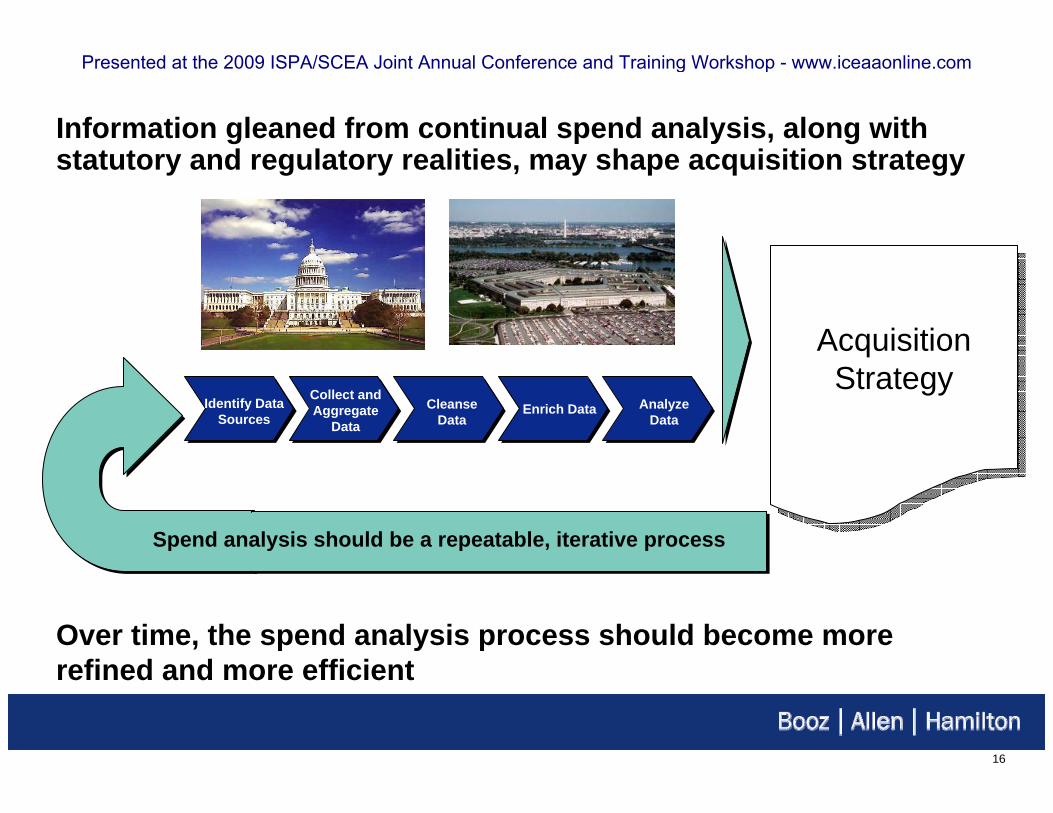
Information gleaned from continual spend analysis, along with statutory and regulatory realities, may shape acquisition strategy
Identify Data Sources
Collect and Aggregate
DataCleanse
DataEnrich Data Analyze
Data
Acquisition Strategy
Acquisition Strategy
Spend analysis should be a repeatable, iterative process
Over time, the spend analysis process should become more refined and more efficient
Presented at the 2009 ISPA/SCEA Joint Annual Conference and Training Workshop - www.iceaaonline.com

17
Agenda
Purpose and Benefits
History
Frameworks
Case Study: Commercial SATCOM Spend Analysis
Presented at the 2009 ISPA/SCEA Joint Annual Conference and Training Workshop - www.iceaaonline.com

18
In Section 818 of the National Defense Authorization Act (NDAA) for Fiscal Year 2006 DoD was tasked by Congress to perform a spend analysis of commercial SATCOM acquisitions
Perform a complete spend analysis of all commercial SATCOM services by the DoD from fiscal year 2000 through fiscal year 2005 and report on an acquisition strategy– Based on the spend analysis– Considers aggregating purchases and leveraging purchasing power– Includes multiyear contracting, or a statement of rationale why multiyear is not used– Proposes any required legislative action
Report due to Congress within five months of enactment of NDAA– Fifty percent of DISA’s Fiscal Year 2007 budget to be withheld until report submitted to
Congress
Presented at the 2009 ISPA/SCEA Joint Annual Conference and Training Workshop - www.iceaaonline.com

19
Several misconceptions existed among various DoD and commercial stakeholders regarding DISA’s procurement of commercial SATCOM
DSTS-G contract vehicle is inflexible –multiyear contracting options could offer additional cost savings
DSTS-G contract vehicle is inflexible –multiyear contracting options could offer additional cost savings
DISA’s excessive fees make it more expensive than other contracting alternatives
DISA’s excessive fees make it more expensive than other contracting alternatives
DISA’s fixed satellite services contract vehicle, the DISN Satellite Transmission Services – Global (DSTS-G), with an intermediary procuring bandwidth on behalf of DoD is more expensive than other contracting alternatives
DISA’s fixed satellite services contract vehicle, the DISN Satellite Transmission Services – Global (DSTS-G), with an intermediary procuring bandwidth on behalf of DoD is more expensive than other contracting alternatives
Misconception Spend Analysis Objectives
Compare cost of multiyear versus multiple year versus single yearCompare cost of multiyear versus multiple year versus single year
Compare cost savings achieved using DSTS-G to fees imposed by DISACompare cost savings achieved using DSTS-G to fees imposed by DISA
Compare DSTS-G costs to other contract vehicles, as well as market averages
Identify drivers and prevalence of cost discrepancies
Compare DSTS-G costs to other contract vehicles, as well as market averages
Identify drivers and prevalence of cost discrepancies
Presented at the 2009 ISPA/SCEA Joint Annual Conference and Training Workshop - www.iceaaonline.com

20
A robust spend data call effort was executed to collect the requisite data
Prepare data collection template– Identified 44 data elements vital to satisfying spend analysis objectives
Broad data call– DD350 and INPUT databases leveraged to identify data call recipients– Direct data call sent to over 200 DoD contracting offices– ASD(NII) officially tasked the heads of the CC/S/As to distribute data call – Top contracting offices identified contacted directly to request response
Data collection and consolidation– 73 responses were collected, representing over a billion dollars in spend over 6 fiscal years
Comprehensive data cleansing/enriching– Validate to ensure relevancy, accuracy and completeness– Standardize nomenclature– Verify content with SMEs as needed
Commercial Satellite Communications
Information Request
Presented at the 2009 ISPA/SCEA Joint Annual Conference and Training Workshop - www.iceaaonline.com

21
Effective analytics required informed, market specific analyses dependent upon industry technology and client goals
Appropriate spend/quantity segmentation– E.g., geography, buyer, supplier, technical
specifications, product type
Time phasing of services provisioned– E.g., spend vs. obligations
Appropriate cost normalization– Provide a means for apples to apples comparison
Rigorous analysis– Identify spend/usage profile, trends over time, cost-
effective procurement avenues
…
Service Characteristics
Mar
ket M
echa
nism
sPur
chas
e Inf
o
Band
C Ku …
Location
ASIA
EU R
Long…
Term Usage
Shor
t
Surg
e
Preemption…Fi
scal
Y
ear
Buy
ing
Ent
itySu
pplie
r
…
FY00
FY05
AB
Quanti
ty
Cost
…
AB
…
NOTIONAL
NOTIONAL
100,000’s of possible combinations exist… and each combination may require hundreds of
calculations
With regressions, cross-segmentations, and cross-correlations within a framework dimension, billions
of calculations are possible!
Presented at the 2009 ISPA/SCEA Joint Annual Conference and Training Workshop - www.iceaaonline.com

22
A systematic approach was needed to make sense of all possible analytic avenues and meet client objectives
Spend & Usage ProfileSpend & Usage Profile
Determine broad expenditure and consumption profile
Identify where primary spend is, for what, by whom
Determine broad expenditure and consumption profile
Identify where primary spend is, for what, by whom
Comparative AnalyticsComparative Analytics
Assess pricing across suppliers, programs, or contract vehicles
Determine most cost effective procurement avenues
Assess pricing across suppliers, programs, or contract vehicles
Determine most cost effective procurement avenues
Strategic AnalysesStrategic Analyses
Determine cost drivers and formulate cost estimating relationships
Identify opportunities for consolidation and leveraging of buying power
Determine cost drivers and formulate cost estimating relationships
Identify opportunities for consolidation and leveraging of buying power
Sum of Cost satopCostType Vendor 1 Vendor 2 Vendor 3HNA$ 1,411,294$ 1,882,104$ LTerm$ 1,335,000$ M&C$ 18,728$ 1,057,845$ 1,221,708$ Other$ 796,840$ 37,116$ 530,854$ PEquip$ 33,150$ 60,379$ 13,133$ Space$ 58,456,630$ 194,553,487$ 413,008,287$ Total$ 104,521,496$ 200,210,654$ 457,348,653$ TP$ 1,898,091$ 3,168,547$ 5,018,954$ TPEyrs 45$ 147$ 212$ Grand Total 165,724,979$ 400,499,470$ 880,358,907$
2000 2001 2002 2003 2004 2005
y = -151571x + 2E+062345678
0.00 2.00 4.00 6.00 8.00 10.00 12.00 14.00
Presented at the 2009 ISPA/SCEA Joint Annual Conference and Training Workshop - www.iceaaonline.com
23
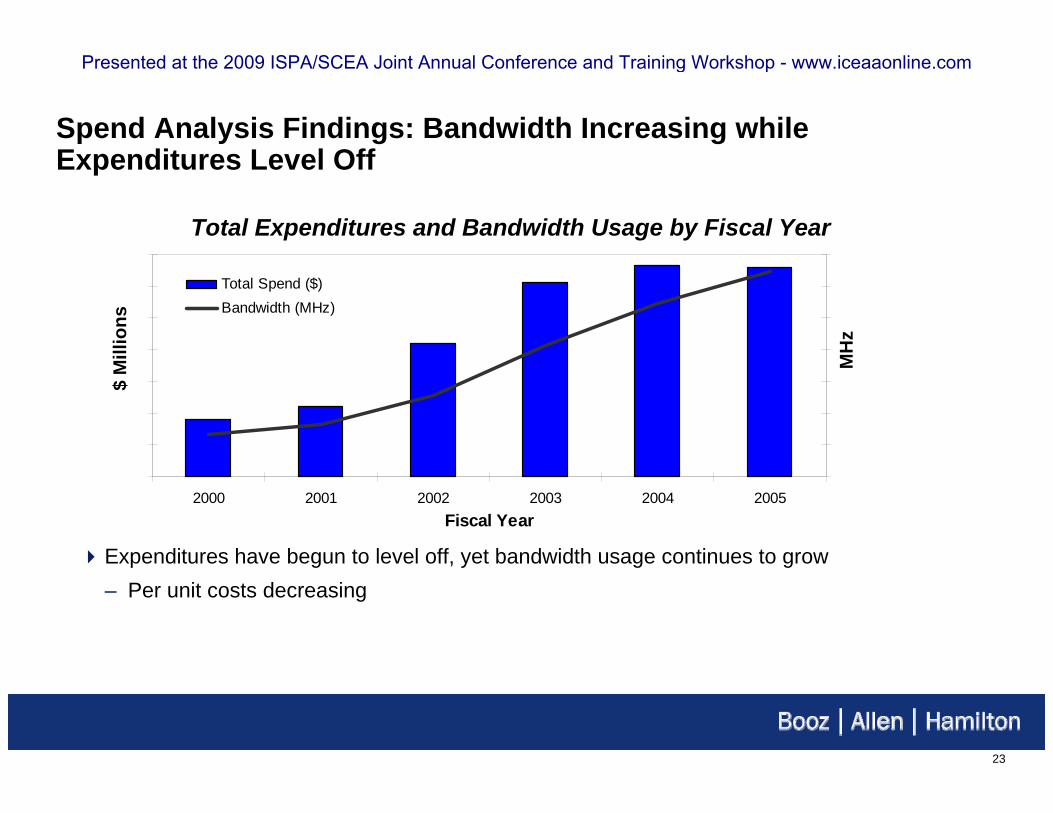
Spend Analysis Findings: Bandwidth Increasing while Expenditures Level Off
Expenditures have begun to level off, yet bandwidth usage continues to grow– Per unit costs decreasing
2000 2001 2002 2003 2004 2005Fiscal Year
Total Spend ($)Bandwidth (MHz)
Total Expenditures and Bandwidth Usage by Fiscal Year
$ M
illio
ns
MH
z
Presented at the 2009 ISPA/SCEA Joint Annual Conference and Training Workshop - www.iceaaonline.com

24
Spend Analysis Findings: DSTS-G is Effective, Realizing Prices Below Market Averages and Other Contract Vehicles
DSTS-G contract vehicle has historically realized better pricing than other DoD vehicles and market averages
DSTS-G leverages its competitive construct and DoD’s buying power to achieve pricing efficiencies
While average transponder equivalent (TPE) cost and bandwidth volume remained flat for non-DSTS-G procurements…
…the increase in DSTS-G bandwidth volume has correlated to a decrease in TPE cost
Commercial MarketDSTS-G
DSTS-G MHz
$ M
illio
ns
MH
z
MH
z
$ M
illio
ns Commercial MarketOther DoD
Other DoD MHz
Presented at the 2009 ISPA/SCEA Joint Annual Conference and Training Workshop - www.iceaaonline.com
25
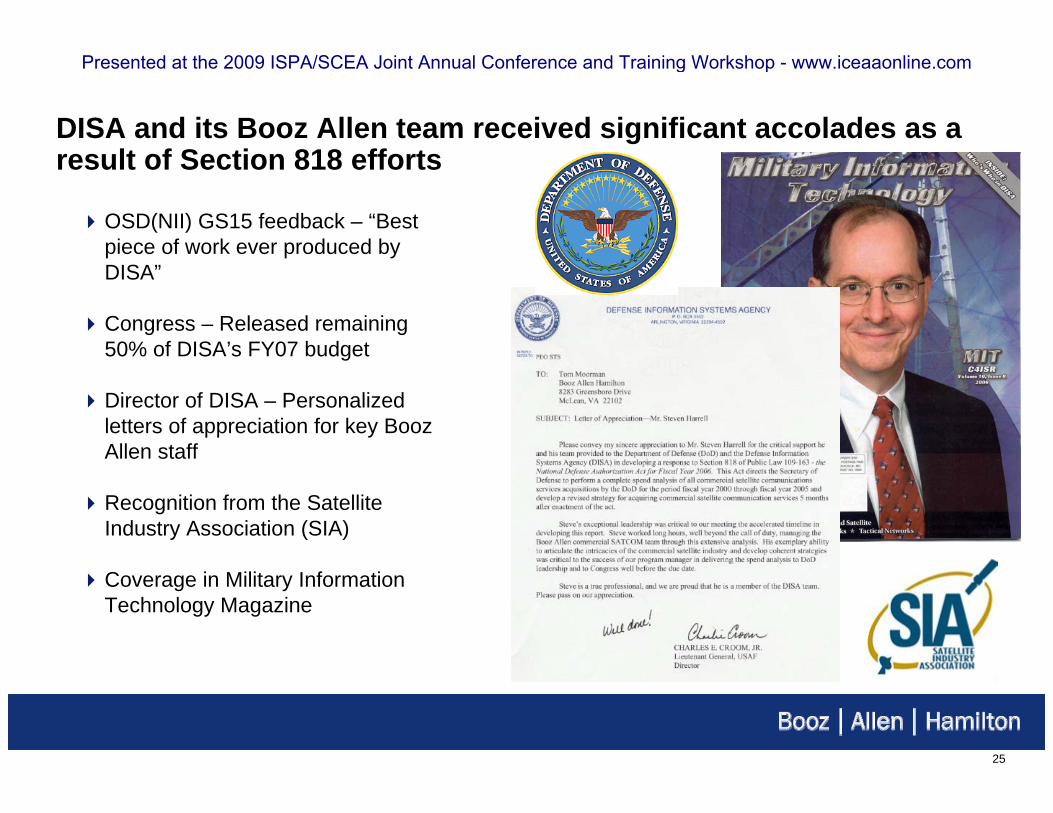
DISA and its Booz Allen team received significant accolades as aresult of Section 818 efforts
OSD(NII) GS15 feedback – “Best piece of work ever produced by DISA”
Congress – Released remaining 50% of DISA’s FY07 budget
Director of DISA – Personalized letters of appreciation for key Booz Allen staff
Recognition from the Satellite Industry Association (SIA)
Coverage in Military Information Technology Magazine
Presented at the 2009 ISPA/SCEA Joint Annual Conference and Training Workshop - www.iceaaonline.com
26
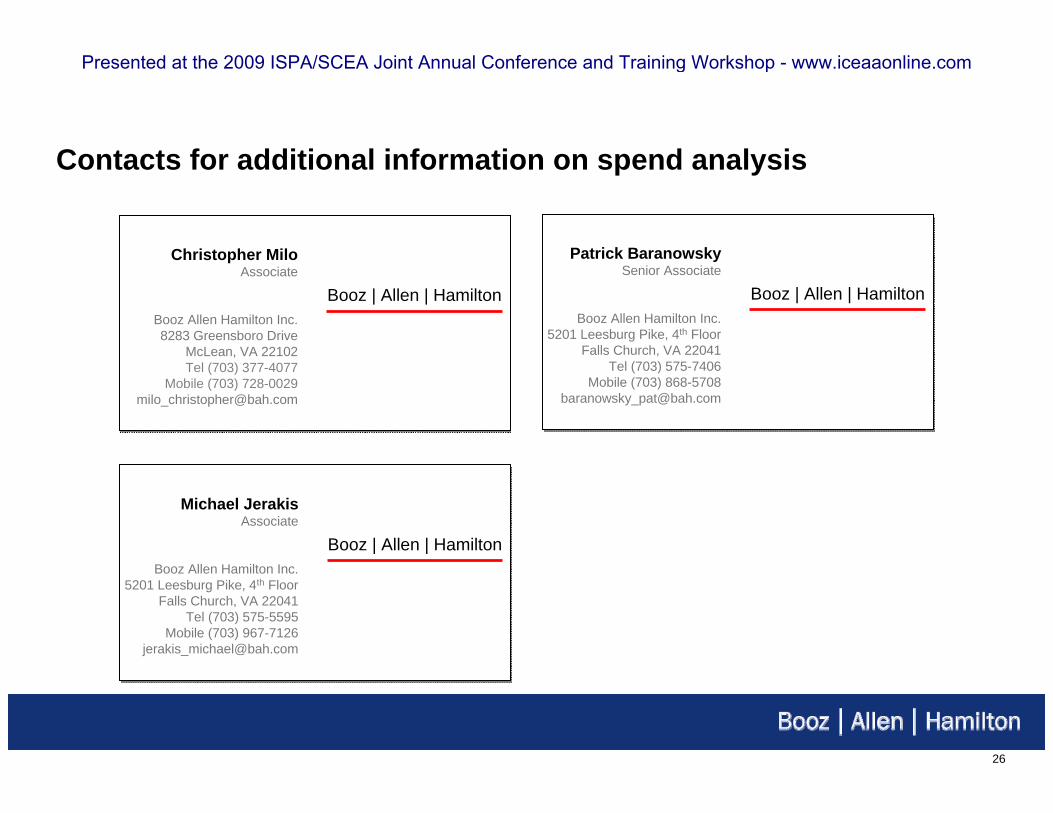
Contacts for additional information on spend analysis
Booz | Allen | Hamilton
Patrick BaranowskySenior Associate
Booz Allen Hamilton Inc.5201 Leesburg Pike, 4th Floor
Falls Church, VA 22041Tel (703) 575-7406
Mobile (703) [email protected]
Booz | Allen | Hamilton
Christopher MiloAssociate
Booz Allen Hamilton Inc.8283 Greensboro Drive
McLean, VA 22102Tel (703) 377-4077
Mobile (703) [email protected]
Booz | Allen | Hamilton
Michael JerakisAssociate
Booz Allen Hamilton Inc.5201 Leesburg Pike, 4th Floor
Falls Church, VA 22041Tel (703) 575-5595
Mobile (703) [email protected]
Presented at the 2009 ISPA/SCEA Joint Annual Conference and Training Workshop - www.iceaaonline.com