sources, types and composition of municipal solid waste...
TRANSCRIPT
3/4/2018
1
Chapter 3
Sources, Types
and Composition of
Municipal Solid Waste (MSW)
Management of MSW
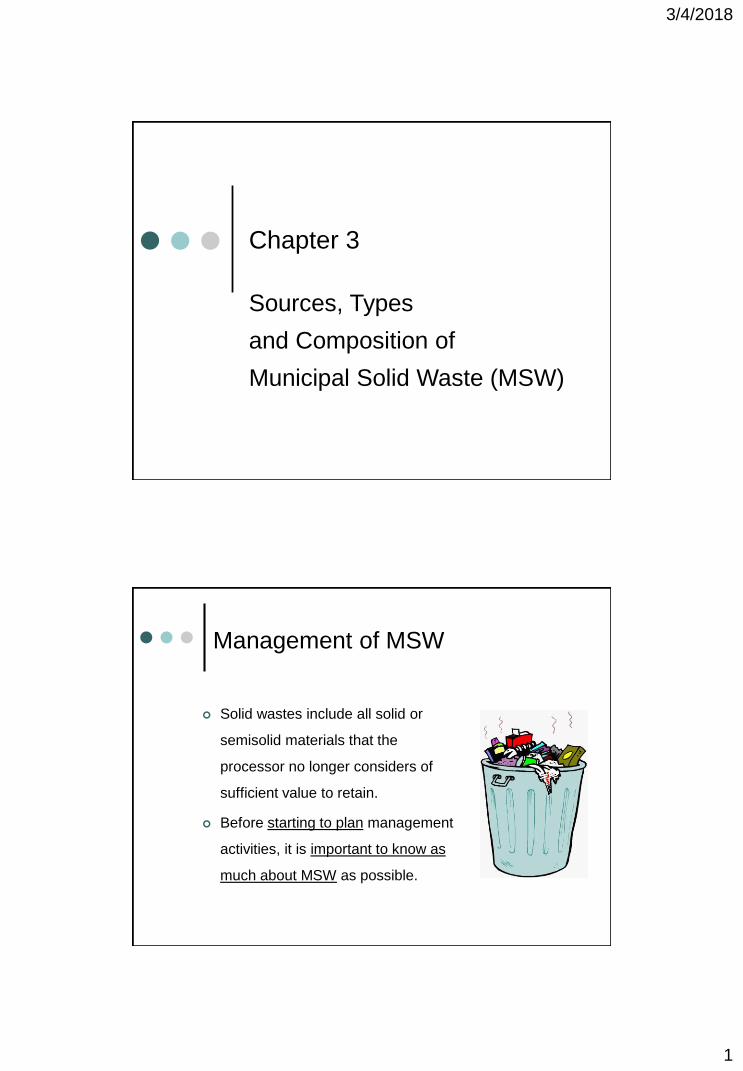
Solid wastes include all solid or
semisolid materials that the
processor no longer considers of
sufficient value to retain.
Before starting to plan management
activities, it is important to know as
much about MSW as possible.
3/4/2018
2
Important Questions
Important questions that must be answered include the
following questions;
What types and quantities of MSW will be received?
At what rates will these types arrive?
What types and quantities of materials have already been
removed for reuse and recycling?
What properties does MSW have as it is received?
How do the properties of MSW vary: hourly, daily, weekly,
and seasonally?
How do the properties of MSW change during
processing?
What are properties of MSW that are of economic value?
Which hazardous objects must be removed?
What contaminants should be removed?
What test and measurements can be performed to obtain
answers to the above questions?
What range of variations should be expected in the
measured quantities and with what level of confidence?
Important Questions

3/4/2018
3
Sources of Solid Wastes
Residential
Commercial
Institutional
Construction & Demolition
Municipal Services
Mining
Industrial
Agricultural
Municipal Solid Waste
(MSW)
Sources of SW within a communityTextbook, Table 3-1 pp.41
Source Typical Waste Generators Types of Solid Wastes
Residential Single and multifamily dwellings
Food wastes, paper, cardboard, plastics, textiles,
leather, yard wastes, wood, glass, metals, ashes,
special wastes (e.g., bulky items, consumer electronics,
white goods, batteries, oil, tires), and household
hazardous wastes).
IndustrialLight and heavy manufacturing, fabrication,
construction sites, power and chemical plants
Housekeeping wastes, packaging, food wastes,
construction and demolition materials, hazardous
wastes, ashes, special wastes.
CommercialStores, hotels, restaurants, markets, office
buildings, etc.
Paper, cardboard, plastics, wood, food wastes, glass,
metals, special wastes, hazardous wastes.
Institutional Schools, hospitals, prisons, government centers. Same as commercial
Construction &
Demolition
New construction sites, road repair, renovation
sites, demolition of buildingsWood, steel, concrete, dirt, etc.
Municipal services
Street cleaning, landscaping, parks, beaches,
other recreational areas, water and wastewater
treatment plants.
Street sweepings; landscape and tree trimmings;
general wastes from parks, beaches, and other
recreational areas; sludge.
Manufacturing
Processes
Heavy and light manufacturing, refineries,
chemical plants, power plants, mineral extraction
and processing.
Industrial process wastes, scrap materials, off-
specification products, slay, tailings.
AgriculturalCrops, orchards, vineyards, dairies, feedlots,
farms.
Spoiled food wastes, agricultural wastes, hazardous
wastes (e.g., pesticides).

3/4/2018
4
Sources of SW in USA
1,4%
11,9%
57,3%
19,1%
9,9%
0,4%
Construction & Demolition
Agricultural
Mining
Industrial
Municipal
Sludge
Source: USEPA
Types and Sources of SW in EU
31%
31%
16%
15%
6%
1%
Construction & Demolition
Agriculture & Forestry
Mining & Quarrying
Manufacturing
Municipal
Energy Production
Source: Eurostat

3/4/2018
5
Distribution of components of MSWTextbook, Table 3-3 pp.48
Waste CategoryPercent by weight
Range Typical
Residential and commercial
(excluding special and hazardous wastes)
50-75 62.0
Special (bulky items, consumer electronics, white goods,
yard wastes collected seperately, batteries, oil, and tires)
Hazardous
3-12
0.01-1.0
5.0
0.1
Institutional 3-5 3.4
Construction and Demolition 8-20 14.0
Municipal Services
Street and alley cleanings
Tree and landscaping
Parks and recreational areas
Catch basin
2-5
2-5
1.5-3
0.5-1.2
3.8
3.0
2.0
0.7
Treatment Plant Sludges 3-8 6
TOTAL 100
Distribution of MSW in USA
Treatment plant
6,1%
Construction
and demolition
14,1%
Municipal
services 9,1%
Residential &
commercial
62,6%
Institutional
3,0%
Special
5,0%

3/4/2018
6
Sources of MSW in ISTANBUL
Residential
Commercial (including open markets)
Street cleanings
Tourism activities (Eminönü, Beyoğlu)
Parks and recreational areas
Coal ash (still some …)
Construction & demolition ??
Composition of Solid Wastes
Distribution for components in MSW vary with;
o Location
o Season
o Economic conditions

3/4/2018
7
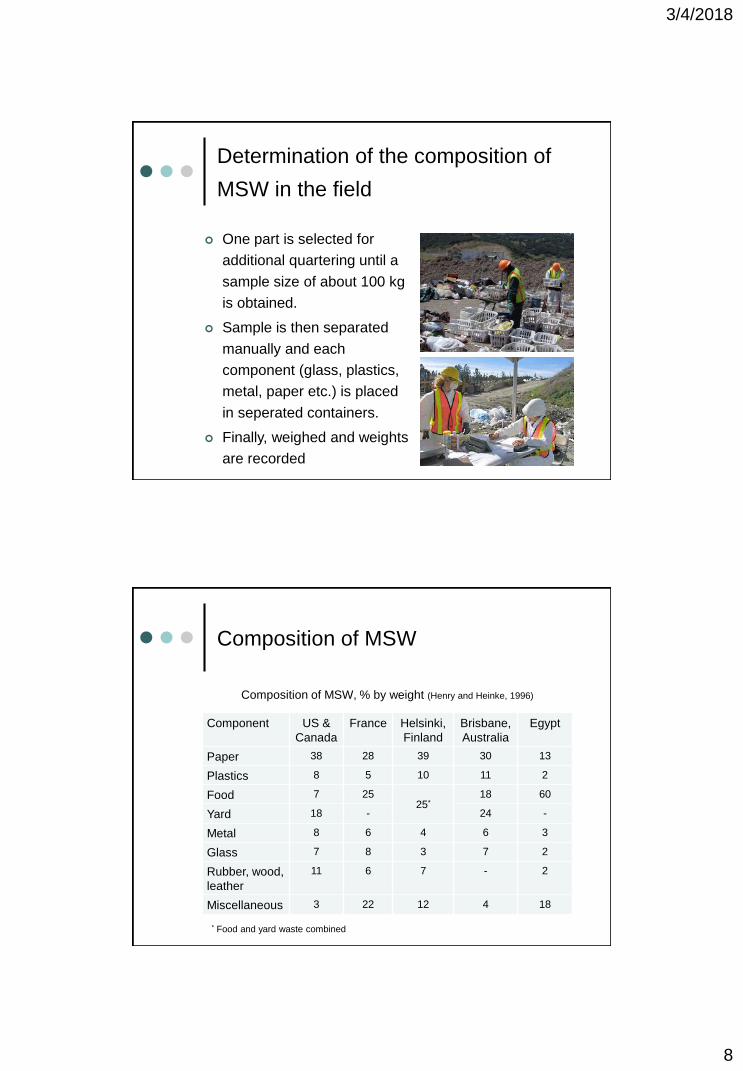
Determination of the composition of
MSW in the field
Because of heterogeneous
nature of MSW, determination
of its composition is not easy.
Generalized field procedures,
based on common sense and
random sampling techniques
are used.
Determination of the composition of
MSW in the field
A representative
residential sample
might be a truckload
resulting from a
typical weekday
collection route in a
residential area.
To obtain a sample for analysis, the load is first
quartered.
3/4/2018
8
Determination of the composition of
MSW in the field
One part is selected for
additional quartering until a
sample size of about 100 kg
is obtained.
Sample is then separated
manually and each
component (glass, plastics,
metal, paper etc.) is placed
in seperated containers.
Finally, weighed and weights
are recorded
Composition of MSW
Component US &
Canada
France Helsinki,
Finland
Brisbane,
Australia
Egypt
Paper 38 28 39 30 13
Plastics 8 5 10 11 2
Food 7 2525*
18 60
Yard 18 - 24 -
Metal 8 6 4 6 3
Glass 7 8 3 7 2
Rubber, wood,
leather
11 6 7 - 2
Miscellaneous 3 22 12 4 18
Composition of MSW, % by weight (Henry and Heinke, 1996)
* Food and yard waste combined
3/4/2018
9
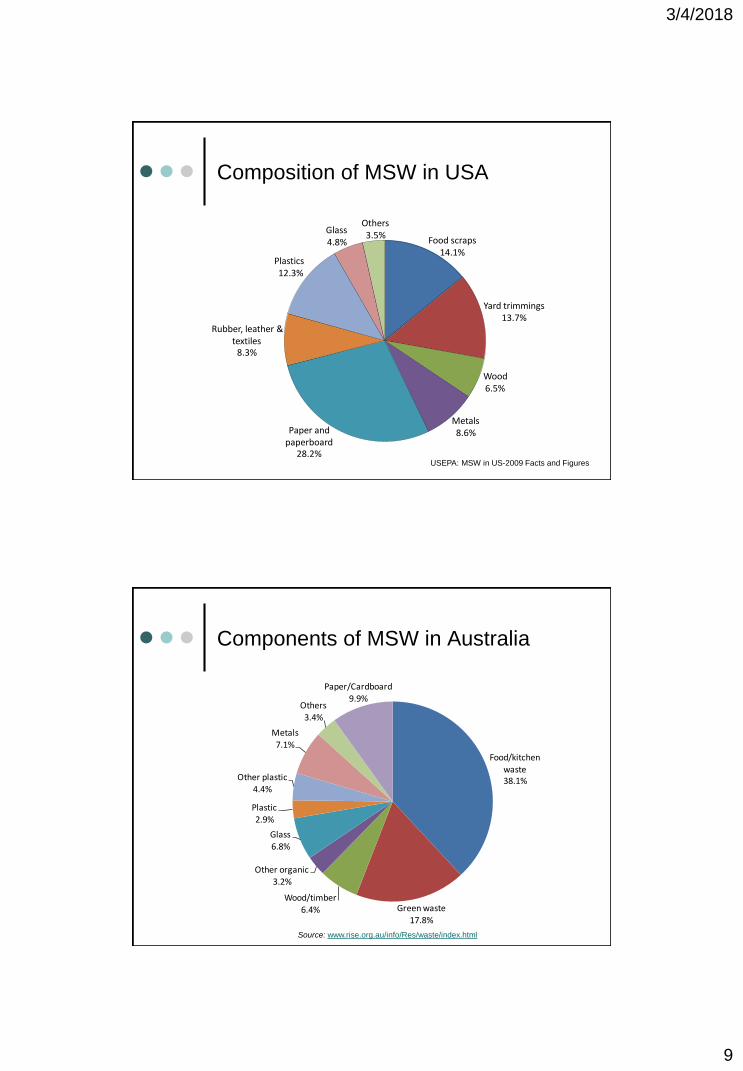
Composition of MSW in USA
Food scraps14.1%
Yard trimmings13.7%
Wood6.5%
Metals8.6%Paper and
paperboard28.2%
Rubber, leather & textiles
8.3%
Plastics12.3%
Glass4.8%
Others3.5%
USEPA: MSW in US-2009 Facts and Figures
Components of MSW in Australia
Source: www.rise.org.au/info/Res/waste/index.html
Food/kitchen waste38.1%
Green waste
17.8%
Wood/timber
6.4%
Other organic3.2%
Glass
6.8%
Plastic2.9%
Other plastic4.4%
Metals7.1%
Others
3.4%
Paper/Cardboard9.9%

3/4/2018
10
Composition of MSW in Türkiye
Source: Katı Atık Ana Planı Projesi, 2006
o Seasonal Changes
o Weekly and Daily Variations
o Source Type
o Family Size
o Collection Practice
o Infrastructure
o Population Density
o Economy
o Statistical Properties
Factors Affecting Generation Rates
3/4/2018
11
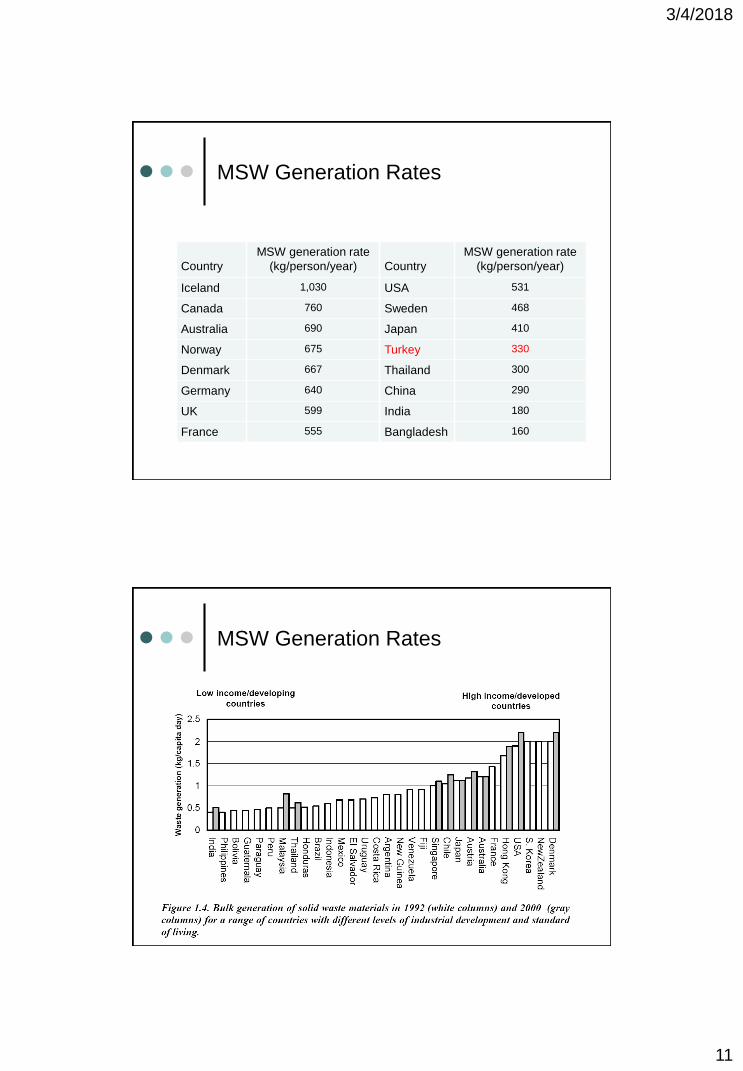
Country
MSW generation rate
(kg/person/year) Country
MSW generation rate
(kg/person/year)
Iceland 1,030 USA 531
Canada 760 Sweden 468
Australia 690 Japan 410
Norway 675 Turkey 330
Denmark 667 Thailand 300
Germany 640 China 290
UK 599 India 180
France 555 Bangladesh 160
MSW Generation Rates
MSW Generation Rates

3/4/2018
12
MSW Generation and Composition
in Europe
MSW generation rates and composition at different prosperity levels
in European cities.
Beigl P, Wassermann G, Schneider F and Salhofer S. Forecasting Municipal Solid Waste Generation in
Major European Cities, iEMSs 2004 Int. Conference, 14-17 June, Osnabrück, Germany
MSW Generation Rates in Asia
Source: Human Development Index, 2002
http://www.grida.no/publications/vg/waste/
3/4/2018
13
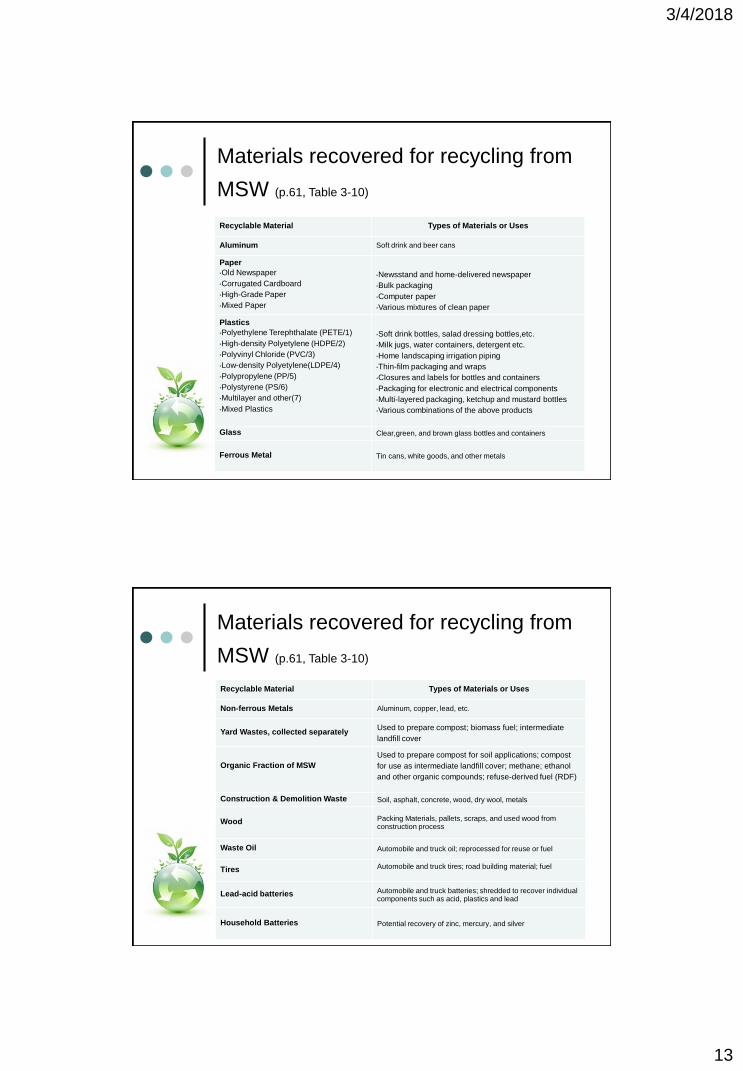
Materials recovered for recycling from
MSW (p.61, Table 3-10)
Recyclable Material Types of Materials or Uses
Aluminum Soft drink and beer cans
Paper
•Old Newspaper
•Corrugated Cardboard
•High-Grade Paper
•Mixed Paper
•Newsstand and home-delivered newspaper
•Bulk packaging
•Computer paper
•Various mixtures of clean paper
Plastics
•Polyethylene Terephthalate (PETE/1)
•High-density Polyetylene (HDPE/2)
•Polyvinyl Chloride (PVC/3)
•Low-density Polyetylene(LDPE/4)
•Polypropylene (PP/5)
•Polystyrene (PS/6)
•Multilayer and other(7)
•Mixed Plastics
•Soft drink bottles, salad dressing bottles,etc.
•Milk jugs, water containers, detergent etc.
•Home landscaping irrigation piping
•Thin-film packaging and wraps
•Closures and labels for bottles and containers
•Packaging for electronic and electrical components
•Multi-layered packaging, ketchup and mustard bottles
•Various combinations of the above products
Glass Clear,green, and brown glass bottles and containers
Ferrous Metal Tin cans, white goods, and other metals
Recyclable Material Types of Materials or Uses
Non-ferrous Metals Aluminum, copper, lead, etc.
Yard Wastes, collected separatelyUsed to prepare compost; biomass fuel; intermediate
landfill cover
Organic Fraction of MSW
Used to prepare compost for soil applications; compost
for use as intermediate landfill cover; methane; ethanol
and other organic compounds; refuse-derived fuel (RDF)
Construction & Demolition Waste Soil, asphalt, concrete, wood, dry wool, metals
Wood Packing Materials, pallets, scraps, and used wood fromconstruction process
Waste Oil Automobile and truck oil; reprocessed for reuse or fuel
Tires Automobile and truck tires; road building material; fuel
Lead-acid batteries Automobile and truck batteries; shredded to recover individualcomponents such as acid, plastics and lead
Household Batteries Potential recovery of zinc, mercury, and silver
Materials recovered for recycling from
MSW (p.61, Table 3-10)

3/4/2018
14
Example 3.1 Impact of food waste grinders and
waste recyling on distribution of waste components
in residential MSW
Assess the impact of the use of food waste grinders & waste
recycling on the percentage distribution of the components
found in residental MSW. Assume the following data apply:
1. Use of waste food grinders
a. Households in the US that have food waste grinders = 20 %
b. Percentage of the total amount of food waste that is ground
up and discharged to the local sewer = 25 %
2. Waste recyling
a. Percentage of the total amount of residental MSW that is
now recycled, excluding food waste that is ground up = 11 %
b. Percentage distribution by weight of waste components now
recycled and not included in as collected waste distribution.
Paper = 50 %; Cardboard = 10 %; Plastic = 6 %; Yard
wastes = 8 %; Tin cans = 4%; Glass = 18 %; Aluminum = 1
%; Nonferrous metal = 3 %
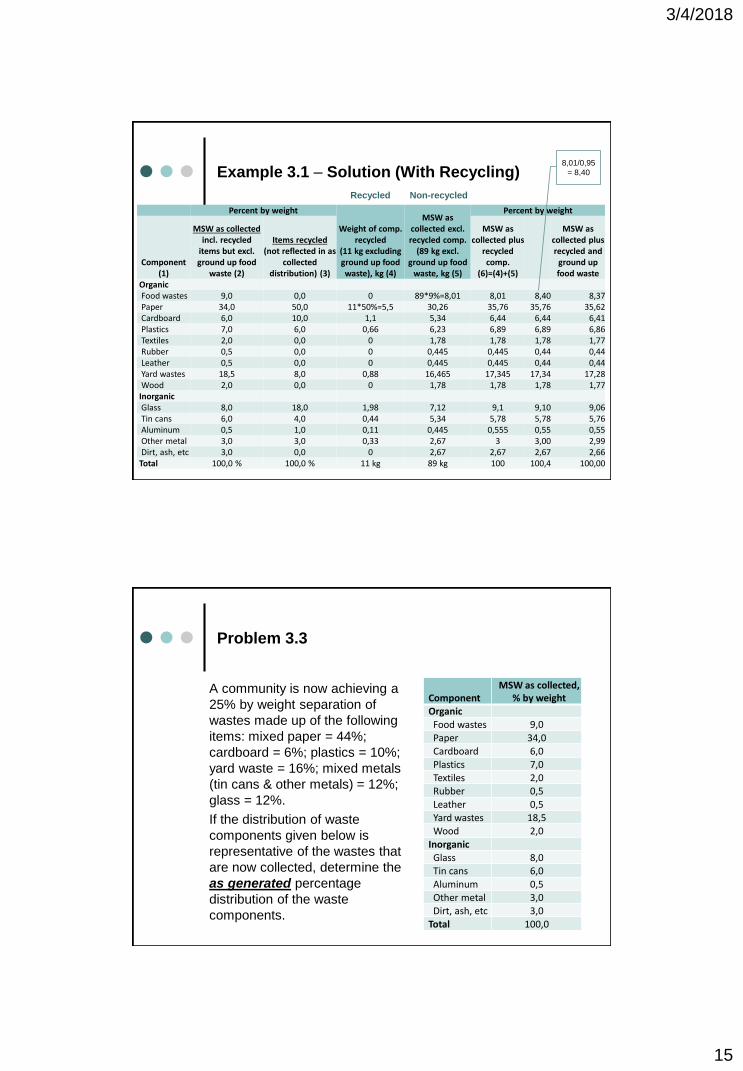
Example 3.1 – Solution (Without Recycling)
Percent by weight
ComponentMSW as collected
MSW as collected plus ground up food waste
Organic (1) (2) (2)/100,5Food wastes 9,0 9/0,95=9,47≈9,5 9,45Paper 34,0 34,0 33,83Cardboard 6,0 6,0 5,97Plastics 7,0 7,0 6,97Textiles 2,0 2,0 1,99Rubber 0,5 0,5 0,50Leather 0,5 0,5 0,50Yard wastes 18,5 18,5 18,41Wood 2,0 2,0 1,99
InorganicGlass 8,0 8,0 7,96Tin cans 6,0 6,0 5,97Aluminum 0,5 0,5 0,50Other metal 3,0 3,0 2,99Dirt, ash, etc 3,0 3,0 2,99
Total 100,0 100,5 100,00
1-(0,2*0,25)=0,95
3/4/2018
15
Percent by weight
Weight of comp.recycled
(11 kg excluding ground up food waste), kg (4)
MSW as collected excl.recycled comp.
(89 kg excl.ground up food
waste, kg (5)
Percent by weight
Component (1)
MSW as collectedincl. recycled
items but excl. ground up food
waste (2)
Items recycled(not reflected in as
collected distribution) (3)
MSW as collected plus
recycled comp.
(6)=(4)+(5)
MSW as collected plus recycled and
ground up food waste
OrganicFood wastes 9,0 0,0 0 89*9%=8,01 8,01 8,40 8,37Paper 34,0 50,0 11*50%=5,5 30,26 35,76 35,76 35,62Cardboard 6,0 10,0 1,1 5,34 6,44 6,44 6,41Plastics 7,0 6,0 0,66 6,23 6,89 6,89 6,86Textiles 2,0 0,0 0 1,78 1,78 1,78 1,77Rubber 0,5 0,0 0 0,445 0,445 0,44 0,44Leather 0,5 0,0 0 0,445 0,445 0,44 0,44Yard wastes 18,5 8,0 0,88 16,465 17,345 17,34 17,28Wood 2,0 0,0 0 1,78 1,78 1,78 1,77InorganicGlass 8,0 18,0 1,98 7,12 9,1 9,10 9,06Tin cans 6,0 4,0 0,44 5,34 5,78 5,78 5,76Aluminum 0,5 1,0 0,11 0,445 0,555 0,55 0,55Other metal 3,0 3,0 0,33 2,67 3 3,00 2,99Dirt, ash, etc 3,0 0,0 0 2,67 2,67 2,67 2,66Total 100,0 % 100,0 % 11 kg 89 kg 100 100,4 100,00
Recycled Non-recycled
Example 3.1 – Solution (With Recycling) 8,01/0,95
= 8,40
Problem 3.3
A community is now achieving a
25% by weight separation of
wastes made up of the following
items: mixed paper = 44%;
cardboard = 6%; plastics = 10%;
yard waste = 16%; mixed metals
(tin cans & other metals) = 12%;
glass = 12%.
If the distribution of waste
components given below is
representative of the wastes that
are now collected, determine the
as generated percentage
distribution of the waste
components.
ComponentMSW as collected,
% by weightOrganicFood wastes 9,0
Paper 34,0Cardboard 6,0Plastics 7,0Textiles 2,0Rubber 0,5Leather 0,5Yard wastes 18,5Wood 2,0
InorganicGlass 8,0Tin cans 6,0Aluminum 0,5Other metal 3,0Dirt, ash, etc 3,0
Total 100,0

3/4/2018
16
Solution 3.3
Component
MSW as collected(excl. separated
comp.), %
Comp. separated forrecycling, %
Weight of comp.separated
(25 kg)
Weight of MSW excl. separated comp. (75 kg)
As genarated MSWincl. separated
comp., %OrganicFood wastes 9,0 6,75 6,75Paper 34,0 44,0 11,0 25,50 36,50Cardboard 6,0 6,0 1,5 4,50 6,00Plastics 7,0 10,0 2,5 5,25 7,75Textiles 2,0 1,50 1,50Rubber 0,5 0,38 0,38Leather 0,5 0,38 0,38Yard wastes 18,5 16,0 4,0 13,88 17,88Wood 2,0 1,50 1,50InorganicGlass 8,0 12,0 3,0 6,00 9,00Tin cans
9,5 12,0 3,0 7,13 10,13AluminumOther metalDirt, ash, etc 3,0 2,25 2,25Total 100,0% 100,0% 25,0 kg 75,00 kg 100,00%
75 kg x 9%25 kg x 44%
Problem 3.4
A community is proposing a 50%
rate of separation by weight
wastes made up of the following
items: mixed paper = 40%;
cardboard = 8%; plastics = 8%;
yard waste = 24%; tin cans = 8%;
glass = 12%.
Determine the as collected
percentage distribution for the
residual waste components
assuming the distribution of waste
components given below is
representative of the wastes that
are now generated.
ComponentMSW as generated,
% by weightOrganicFood wastes 8,0
Paper 35,8Cardboard 6,4Plastics 6,9Textiles 1,8Rubber 0,4Leather 0,4Yard wastes 17,3Wood 1,8
InorganicGlass 9,1Tin cans 5,8Aluminum 0,6Other metal 3,0Dirt, ash, etc 2,7
Total 100,0

3/4/2018
17
Solution 3.4
Component
MSW as generated incl.
recycled comp., %
Weight of MSW comp.
(100 kg)
Comp. separated,
%
Weight of comp. separated
(50kg)
Weight of MSW excl. separated comp. (50 kg)
As collected MSW comp.,
%OrganicFood wastes 8,0 8,0 8,0 16Paper 35,8 35,8 40,0 20,0 15,8 31,6Cardboard 6,4 6,4 8,0 4,0 2,4 4,8Plastics 6,9 6,9 8,0 4,0 2,9 7,8Textiles 1,8 1,8 1,8 3,6Rubber 0,4 0,4 0,4 0,8Leather 0,4 0,4 0,4 0,8Yard wastes 17,3 17,3 24,0 12,0 5,3 10,6Wood 1,8 1,8 1,8 3,6InorganicGlass 9,1 9,1 12,0 6,0 3,1 6,2Tin cans 5,8 5,8 8,0 4,0 1,8 3,6Aluminum 0,6 0,6 0,6 1,2Other metal 3,0 3,0 3,0 6,0Dirt, ash, etc 2,7 2,7 2,7 5,4Total 100,0% 100,0 kg 100,0% 50,0 kg 50,0 kg 100,0%