source parameters of microearthquakes from the 1.5 … · parameters is to fit a theoretical source...
TRANSCRIPT
PROCEEDINGS, Thirtieth Workshop on Geothermal Reservoir Engineering Stanford University, Stanford, California, January 31-February 2, 2005 SGP-TR-176
SOURCE PARAMETERS OF MICROEARTHQUAKES FROM THE 1.5 KM DEEP PYHÄSALMI ORE MINE, FINLAND
Volker Oye and Michael Roth
NORSAR
Instituttveien 25 2007 Kjeller, Norway
e-mail: [email protected]
ABSTRACT
The Pyhäsalmi ore mine in Finland is instrumented with 6 three-component and 12 one-component geophones in a depth between 1.2 and 1.4 km. The monitoring network (Integrated Seismic System International Ltd.) has been operational in a triggered mode since January 2003, and about 24,000 events were recorded until August 2004. About two third of the events are identified as production blasts from the mining operations, while the remaining 8000 seismic events are induced by stress changes that are related to the ongoing production. We have developed a microseismic monitoring software that automatically determines microearthquake hypocenters and their source parameters. The recorded microseismic events occur throughout the mining area and they cluster in newly excavated tunnel systems. In moment magnitude (Mw), they vary from about –1.8 to 1.2, while the bulk of events have Mw from –1.5 to –0.5. We estimate the seismic moment and the corner frequency using a spectral integration method and alternatively we fit a theoretical Brune’s shape spectra to the stacked spectra. For two clusters of microseismic events we apply the multiple empirical Green’s function method (MEGF), which allows us to determine source parameters without assuming path and site effects. We determined the ratio between the radiated seismic energy and the seismic moment and obtained a value of about 5·10-7 for a magnitude range from Mw –1.2 to 0. Compared to tectonic seismic events analyzed in other studies, our results for the energy-to-moment ratio are lower by about two orders of magnitude. This discrepancy may partly be explained by a more tensile fault mechanism of the mining events compared to earthquakes that are dominated by shear faulting.
INTRODUCTION
For more than 30 years seismic installations in mines have contributed to optimize the mining process and to improve hazard mitigation (McGarr and Simpson, 1997). Within the last decade the quality of in-mine instruments has significantly improved (Mendecki, 1997). Due to that fact, mining seismology can now contribute more reliably to the investigation of scaling relations (Aki, 1967; Abercrombie and Leary, 1993; Ide et al., 2003). Only little data of earthquakes smaller than Mw 2 is available from conventional seismological databases. Therefore mining induced seismicity, which covers a magnitude range down to about Mw –2, plays a major role in the study of scaling relations, i.e.: is the rupture process of small earthquakes fundamentally different to the one of large earthquakes? Mining induced seismicity is mainly related to the excavation and the associated stress changes in the rock formation, whereas microseismicity at geothermal energy sites is mainly related to the fluid pressure changes the associated stress changes (McGarr 1994; Richardson and Jordan, 2002; Michelet et al., 2004). Nevertheless, there are many similarities between these two types of microseismic data. The majority of the microseismic events are in the same magnitude range, i.e. from about Mw -2 to 2. The receivers are usually installed in boreholes in order to keep the source-to-receiver distances short and to avoid high attenuation in near surface rocks. In the following we introduce the mining site and the concepts and applications of our data processing/analysis to the microseismic data recorded in the Pyhäsalmi ore mine.
THE PYHÄSALMI ORE MINE
Geology The Pyhäsalmi ore mine with a depth of 1.5 km is located in central Finland and is the deepest of its
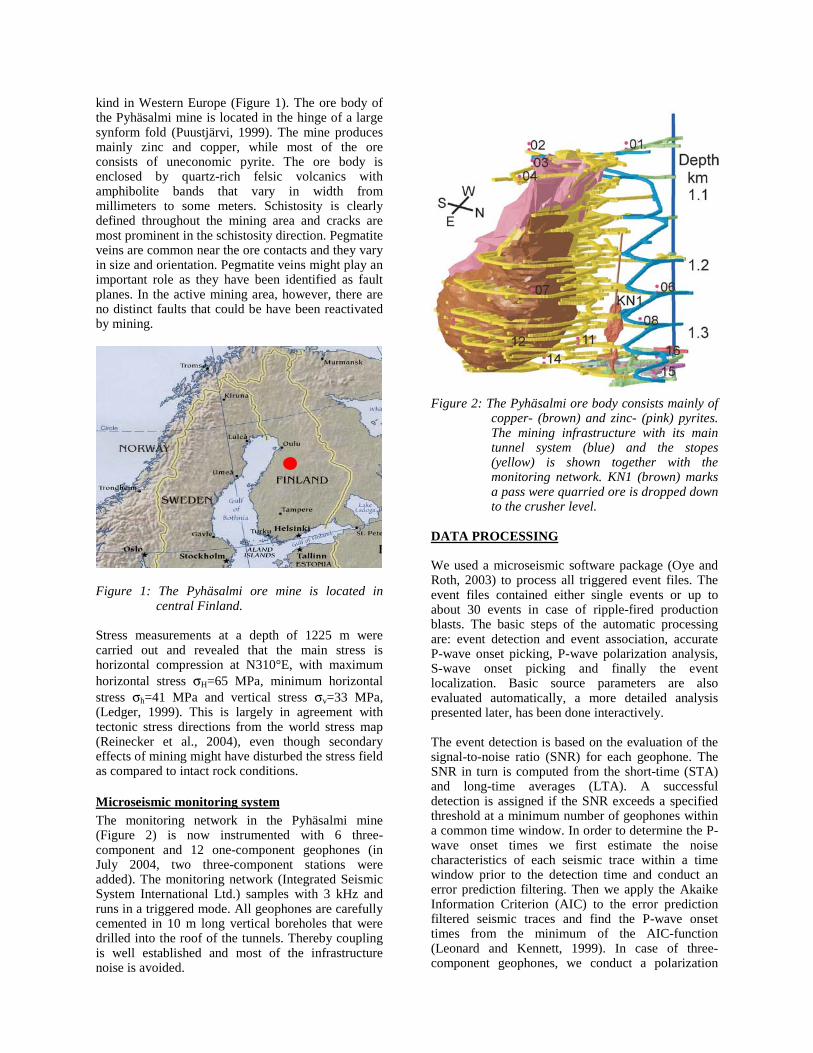
kind in Western Europe (Figure 1). The ore body of the Pyhäsalmi mine is located in the hinge of a large synform fold (Puustjärvi, 1999). The mine produces mainly zinc and copper, while most of the ore consists of uneconomic pyrite. The ore body is enclosed by quartz-rich felsic volcanics with amphibolite bands that vary in width from millimeters to some meters. Schistosity is clearly defined throughout the mining area and cracks are most prominent in the schistosity direction. Pegmatite veins are common near the ore contacts and they vary in size and orientation. Pegmatite veins might play an important role as they have been identified as fault planes. In the active mining area, however, there are no distinct faults that could be have been reactivated by mining.
Figure 1: The Pyhäsalmi ore mine is located in
central Finland. Stress measurements at a depth of 1225 m were carried out and revealed that the main stress is horizontal compression at N310°E, with maximum horizontal stress σH=65 MPa, minimum horizontal stress σh=41 MPa and vertical stress σv=33 MPa, (Ledger, 1999). This is largely in agreement with tectonic stress directions from the world stress map (Reinecker et al., 2004), even though secondary effects of mining might have disturbed the stress field as compared to intact rock conditions.
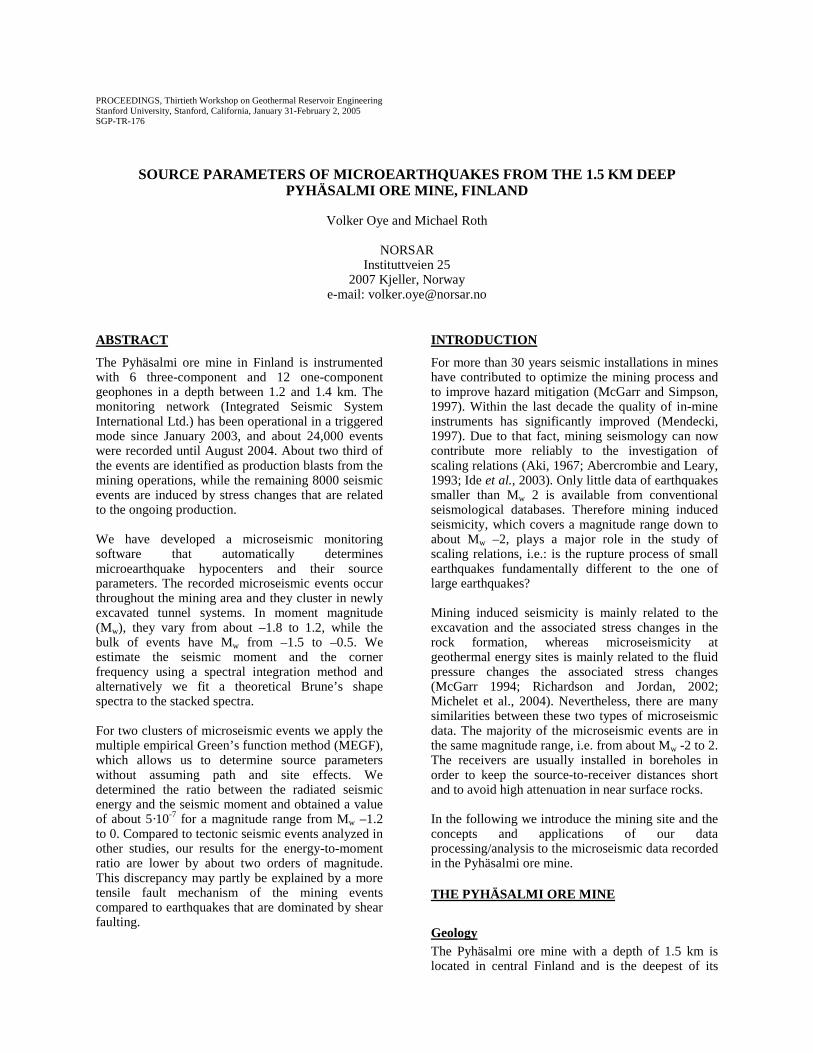
Microseismic monitoring system The monitoring network in the Pyhäsalmi mine (Figure 2) is now instrumented with 6 three-component and 12 one-component geophones (in July 2004, two three-component stations were added). The monitoring network (Integrated Seismic System International Ltd.) samples with 3 kHz and runs in a triggered mode. All geophones are carefully cemented in 10 m long vertical boreholes that were drilled into the roof of the tunnels. Thereby coupling is well established and most of the infrastructure noise is avoided.
Figure 2: The Pyhäsalmi ore body consists mainly of
copper- (brown) and zinc- (pink) pyrites. The mining infrastructure with its main tunnel system (blue) and the stopes (yellow) is shown together with the monitoring network. KN1 (brown) marks a pass were quarried ore is dropped down to the crusher level.
DATA PROCESSING We used a microseismic software package (Oye and Roth, 2003) to process all triggered event files. The event files contained either single events or up to about 30 events in case of ripple-fired production blasts. The basic steps of the automatic processing are: event detection and event association, accurate P-wave onset picking, P-wave polarization analysis, S-wave onset picking and finally the event localization. Basic source parameters are also evaluated automatically, a more detailed analysis presented later, has been done interactively. The event detection is based on the evaluation of the signal-to-noise ratio (SNR) for each geophone. The SNR in turn is computed from the short-time (STA) and long-time averages (LTA). A successful detection is assigned if the SNR exceeds a specified threshold at a minimum number of geophones within a common time window. In order to determine the P-wave onset times we first estimate the noise characteristics of each seismic trace within a time window prior to the detection time and conduct an error prediction filtering. Then we apply the Akaike Information Criterion (AIC) to the error prediction filtered seismic traces and find the P-wave onset times from the minimum of the AIC-function (Leonard and Kennett, 1999). In case of three-component geophones, we conduct a polarization

analysis of the P-wave signal and rotate the three channels into the ray coordinate system. Thereby we enhance the SNR for the S-wave signal on the two components perpendicular to the ray direction and then we pick the S-wave onset similar to the P-wave onset. A screenshot of the automatic P- and S-wave onset picking and P-wave polarization analysis is shown in Figure 3. The hypocenters can be determined either for any 3D velocity model by using a directed grid search inversion, or for homogenous velocity models using a fast master-event location approach. In this study we used a homogenous velocity model, but we will also include the 3D velocity model at a later stage. Input parameters for the hypocenter inversion can include all or a selection of P- and S-wave onset times, S-P wave difference travel times, azimuth and incidence angles.
SOURCE PARAMETER DETERMINATION
The general form of the source displacement spectrum used in this study is
( )[ ]γγ1
0
1
)(n
ff
c
f
+
Ω=Ω , Eq. (1)
Where Ω0 is the low-frequency spectral level, f the frequency, fc the corner frequency, n the high-frequency level fall-off rate and γ a constant. Our data was fitted best with the classical Brune spectrum, where n=2 and γ=1 (Brune, 1970; Brune,
1971). We determine the source parameters from the S-wave signal, since it is the most energetic part of the seismograms. In order to estimate the displacement spectrum we take a time window of 200 ms that starts at the S-wave onset and encloses most of the S-wave coda. Both ends of the time window are extended with cosine tapered time windows of 20 ms. The seismogram segments are then Fourier-transformed and compensated for geometrical spreading and intrinsic attenuation. There is no need to correct the spectra for the instrument response since it is flat for frequencies above 10 Hz and our signals are usually above the noise level from about 15-20 Hz up to the Nyquist frequency. We then stack the compensated spectra in order to cancel out effects of the radiation pattern.
Spectral integration technique One method to determine source parameters, which is well suited for automatic processing, is to use integrals of spectra, because it is a quick and robust technique (Andrews, 1986; Snoke, 1987). The corrected and stacked amplitude spectra (D:displacement; V: velocity; A: acceleration) are squared and integrated from 15 Hz (f1) up to 90% of the Nyquist frequency (f2=1350 Hz):
∫=2
1
22 )(2
f
f
X dffXS Eq. (2)
with X = ( D, V, A). The integration of the velocity spectrum provides a
Figure 3: Automatic processing of an 8 second event file containing ripple-fired production blasts. Left: Seismic traces of one and three component geophones are shown with their automatic P- (red) and S-wave picks (green). Top right: Polarization angles azimuth and incidence for all events. Each green circle represents an event, the red filled circles show the angles for each three-component geophone. Lower right: Automatic locations of the 14 ripple-fired events.

measure of the radiated seismic energy Erad
24 Vrad SE πρβ= Eq. (3)
where ρ= 4000 kg/m3 is the average density of the ore body. For a Brune type spectrum, only 20% of the radiated seismic energy is represented by frequencies smaller than the corner frequency. Since our data has high sampling rates, this is not a major concern, but for events with high corner frequencies (above about 200 Hz) this effect becomes significant. We therefore compensated for missing energy for frequencies above our upper integration limit by an extrapolation of the Brune shape model (Ide and Beroza, 2001). The Brune spectrum in Eq. (1) is defined by the corner frequency
2
2
2
1
D
Vc S
Sf
π= Eq. (4)
and the low frequency spectral level (Andrews, 1986)
2
322
0 4V
D
S
S=Ω . Eq. (5)
The seismic moment can be determined from Ω0 by (e.g. Andrews, 1986)
CM 03
0 4 Ω= πρβ Eq. (6)
with C = 52 as the root mean square radiation
pattern for S waves. The Brune stress drop as defined by Eshelby (1957) can also be expressed by integrals of spectra (e.g. Snoke, 1987)
43
2
52
30
34.22
167
D
VB S
S
Cr
M ρσ ==∆ . Eq. (7)
Fitting of source spectra An alternative approach to determine source parameters is to fit a theoretical source spectrum to the stacked and corrected displacement spectra (e.g., Abercrombie, 1995; Prejean and Ellsworth, 2001). We hold the intrinsic attenuation Q constant and invert for Ω0 and fc using a Levenberg-Marquart algorithm. The best fit of the spectra was achieved with a constant Q of 350 and using the classical Brune spectrum. Figure 4 also shows results of other Q values and using different theoretical displacement spectra (Boatwright model: n=2, γ=2 and Haskell model n=3, γ=2/3).
Figure 4: Stacked displacement spectra for three
microearthquakes. Constant Q corrections are 200: red, 350: green, 800: blue. The theoretical spectra are in black with Brune: solid, Boatwright: dashed, Haskell: dash-dotted. The best fit is achieved with Q=350 and the classical Brune spectrum.
RESULTS
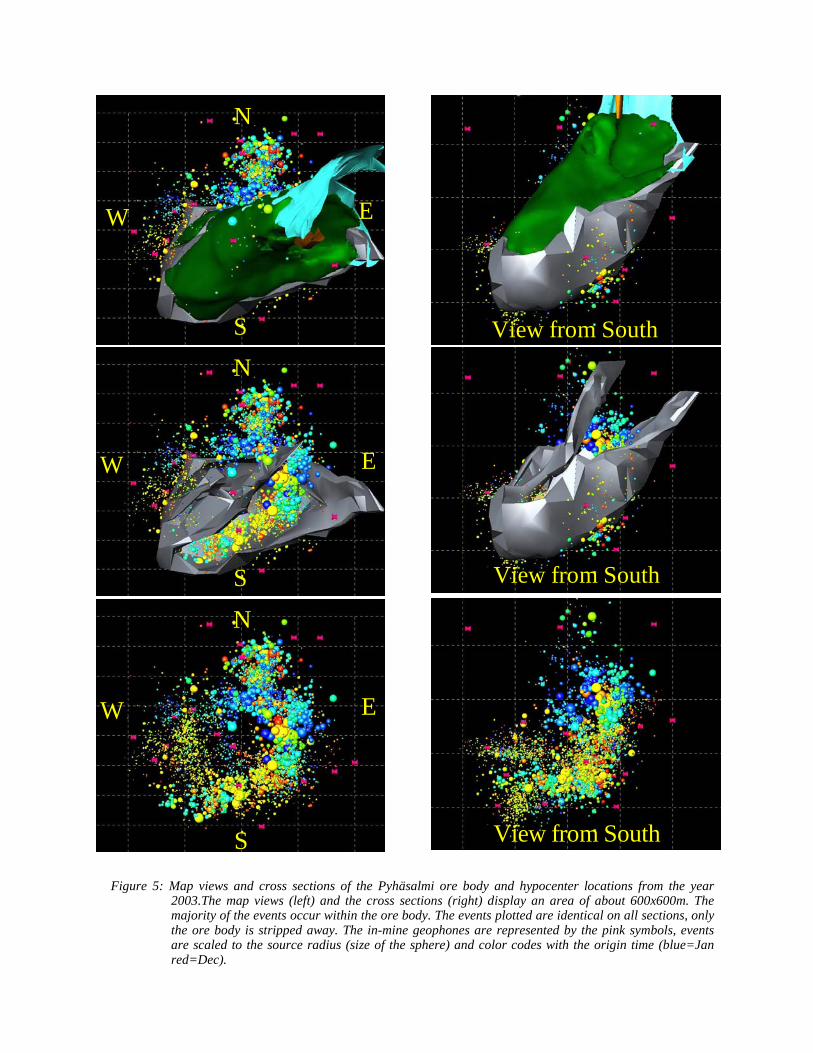
Automatically located hypocenters The automatic monitoring of the Pyhäsalmi ore mine shows that the majority of events, whether they are mining blasts or induced seismic events, originate within the active mining area. The hypocenters of about 5000 events from the year 2003 with location errors smaller than 15m are displayed in Figure 5. One cluster of events is located to the north of the ore body and this seismic activity is related to an open ore pass (KN1 in Figure 2) that is used to dump the ore down to the crusher level. This particular pass has been expanding from 3 to about 30 m length. Most of the other events are directly related to mining. The largest events are usually mining blasts with magnitudes around Mw 1, while most of the smaller ones are rockbursts and microseismic events. In Figure 5, the origin time of the events is color-coded and shows that the main seismic activity moves with the most active mining activity.
N
S
W E
N
S
W E
N
S
W E
N
S
W E
N
S
W E
N
S
W E
View from SouthView from South
View from SouthView from South
View from SouthView from South
Figure 5: Map views and cross sections of the Pyhäsalmi ore body and hypocenter locations from the year 2003.The map views (left) and the cross sections (right) display an area of about 600x600m. The majority of the events occur within the ore body. The events plotted are identical on all sections, only the ore body is stripped away. The in-mine geophones are represented by the pink symbols, events are scaled to the source radius (size of the sphere) and color codes with the origin time (blue=Jan red=Dec).

Selected tectonic microearthquakes In order to study scaling relations, we focus the analysis on tectonic microearthquakes. Further restrictions on the selection criteria as the SNR ratio (> 3), number of traces that report a detection (> 12), location error (< 10 m), rms time residual (< 5 ms) and a visual control of the onset quality lead to a much smaller data set of about 1500 events. Most interesting are the events around the ore pass (C1 in Figure 6). The mining company reported that the ore pass was expanding to the North. Our locations for events along ore pass agree with this observation as they first occur only in the South and then also occur further to the North.
Figure 6: Map view of about 1500 visually inspected
seismic events within the Pyhäsalmi ore mine. The installed geophones are indicated in red with numbers attached (three-component: triangles, vertical component: diamonds). The color scale in the main pictures represents the location error (blue: 5 m to red: 30 m). Most events occur in the cluster C1, close to the ore pass KN1, indicated as a black line in the inset. The color scale in the inset represents origin time (blue to red) indicating the extension of the pass to the north.
Using a constant Q of 350 and fitting the classical Brune shape model, our data in general supports the scaling relation between the seismic moment and the corner frequency M0fc
3 = constant (Figure 7). Also the bulk of the events have a Brune stress drop from about 0.01 to 1 MPa. However, there are variations from about 0.002 to 30 MPa in the Brune stress drop, which indicates that there are significant deviations from the constant stress drop model. The radiated seismic energy Erad is related to the velocity spectrum and the ratio of Erad/M0 is therefore
often used as a scaling parameter for the source dynamics. Our results for Erad/M0 varies between about 5·10-8 to 5·10-6, and seems to increase slightly with Mw. Equivalently, the apparent stress σapp varies from about 0.0025 to 0.25 MPa.
Figure 7: Corner frequency versus seismic moment
for about 1500 tectonic events. Data points shown are determined using constant Q=350 and fitting a Brune shape spectrum. Lines of constant M0fc
3 indicate constant stress drops.
DISCUSSION AND CONCLUSIONS
Source parameters are often determined using frequency independent Q and without accounting for site and path effects. In order to avoid these potential error sources we apply the multiple empirical Green’s function method (MEGF) (Hough, 1997) to a selection of 38 events within the clusters C1 and C2 (Figure 6). These events cover a magnitude range from Mw –1.2 to 0. Within each cluster, we calculate theoretical spectral ratios between all events and fit them to the measured spectral ratios. We also calculated frequency dependent attenuation curves for each receiver and recalculated the radiated seismic energy (Oye et al., 2005). Then we determined the ratio Erad/M0 and obtained a value that is more or less constant at about 5·10-7 over a magnitude range from Mw –1.2 to 0. Compared to the approach of a constant Q model, the results determined by the MEGF approach are much more reliable, since site and path effects as well as frequency dependent Q are eliminated. However, the amount of data available for this approach is limited, since the events must be close to each other and there must be significant differences in event size. Figure 8 shows our results in a composite picture with many other studies, mainly for larger earthquakes. Our results of Erad/M0 plot about two orders of magnitude below most others. However, following the trend of the data from Richardson and Jordan (2002), which are also mining induced earthquakes, a drop in the Erad/M0 ratio is obvious. This discrepancy to the results of most tectonic earthquakes may partly be explained by a more tensile fault mechanism of
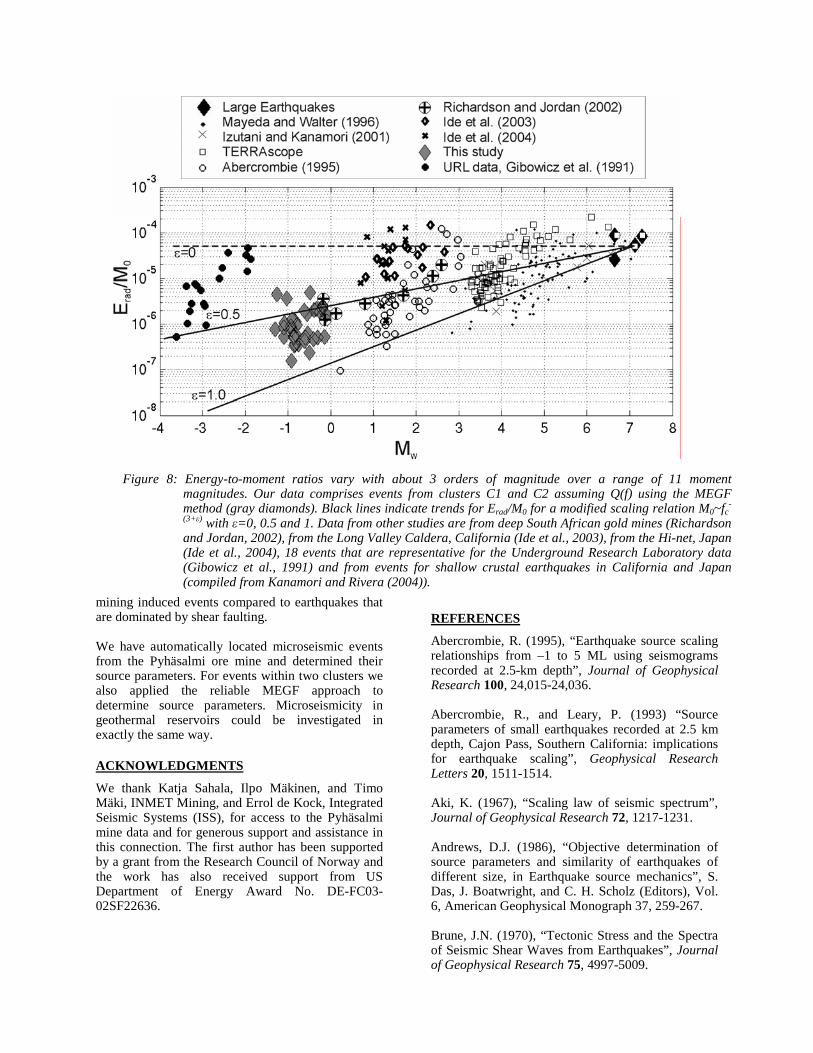
mining induced events compared to earthquakes that are dominated by shear faulting. We have automatically located microseismic events from the Pyhäsalmi ore mine and determined their source parameters. For events within two clusters we also applied the reliable MEGF approach to determine source parameters. Microseismicity in geothermal reservoirs could be investigated in exactly the same way.
ACKNOWLEDGMENTS
We thank Katja Sahala, Ilpo Mäkinen, and Timo Mäki, INMET Mining, and Errol de Kock, Integrated Seismic Systems (ISS), for access to the Pyhäsalmi mine data and for generous support and assistance in this connection. The first author has been supported by a grant from the Research Council of Norway and the work has also received support from US Department of Energy Award No. DE-FC03-02SF22636.
REFERENCES
Abercrombie, R. (1995), “Earthquake source scaling relationships from –1 to 5 ML using seismograms recorded at 2.5-km depth”, Journal of Geophysical Research 100, 24,015-24,036. Abercrombie, R., and Leary, P. (1993) “Source parameters of small earthquakes recorded at 2.5 km depth, Cajon Pass, Southern California: implications for earthquake scaling”, Geophysical Research Letters 20, 1511-1514. Aki, K. (1967), “Scaling law of seismic spectrum”, Journal of Geophysical Research 72, 1217-1231. Andrews, D.J. (1986), “Objective determination of source parameters and similarity of earthquakes of different size, in Earthquake source mechanics”, S. Das, J. Boatwright, and C. H. Scholz (Editors), Vol. 6, American Geophysical Monograph 37, 259-267. Brune, J.N. (1970), “Tectonic Stress and the Spectra of Seismic Shear Waves from Earthquakes”, Journal of Geophysical Research 75, 4997-5009.
Figure 8: Energy-to-moment ratios vary with about 3 orders of magnitude over a range of 11 moment magnitudes. Our data comprises events from clusters C1 and C2 assuming Q(f) using the MEGF method (gray diamonds). Black lines indicate trends for Erad/M0 for a modified scaling relation M0~fc
-
(3+ε) with ε=0, 0.5 and 1. Data from other studies are from deep South African gold mines (Richardson and Jordan, 2002), from the Long Valley Caldera, California (Ide et al., 2003), from the Hi-net, Japan (Ide et al., 2004), 18 events that are representative for the Underground Research Laboratory data (Gibowicz et al., 1991) and from events for shallow crustal earthquakes in California and Japan (compiled from Kanamori and Rivera (2004)).
Brune, J.N. (1971), Correction, Journal of Geophysical Research 76, 5002. Eshelby, J. D. (1957), “The determination of the elastic field of an ellipsoidal inclusion and related problems”, Proceedings of the Royal Society of London 241, 376-396. Gibbowicz, S., Young, R., Talebi, S., and Rawlence, D. (1991), “Source parameters of seismic events at the Underground Research Laboratory in Manitoba, Canada: scaling relations for events with moment-magnitude smaller than –2”, Bulletin of the Seismological Society of America, 81, 1157-1182. Hough, S. E. (1997), “Empirical Green’s function analysis: Taking the next step”, Journal of Geophysical Research, 102, 5369-5384. Ide, S, and Beroza, G. C. (2001), “Does apparent stress vary with earthquake size?”, Geophysical Research Letters, 28, 3349-3352. Ide, S., Beroza, G. C., Prejean, S. G., and Ellsworth, W. L. (2003), “Apparent break in earthquake scaling due to path and site effects on deep borehole recordings”, Journal of Geophysical Research, 108, 2271, doi:10.1029/2001JB001617. Ide, S, Matsubara, M., and Obara, K. (2004), “Exploitation of high-sampling Hi-net data to study seismic energy scaling: The aftershocks of the 2000 Western Tottori, Japan, earthquake”, Earth Planets Space, 56, 859-871. Kanamori, H., and Rivera, L. (2004), “Static and dynamic scaling relations for earthquakes and their implications for rupture speed and stress drop”, Bulletin of the Seismological Society of America, 94, 314-319. Ledger, A. (1999), “Stress measurement in the 1125 m level, Outokumpu Mining Pyhäsalmi Mine Oy, Rock Mechanics Technology Ltd. Pyhäsalmi Mine Oy”, Internal report. 7 p. Leonard, M., and Kennett, B. L. N. (1999), “Multi-component autoregressive techniques for the analysis of seismograms”, Physics of the Earth and Planetory Interior, 113, 247-263. McGarr, A., and Simpson, D. (1997), “Keynote lecture: A broad look at induced and triggered seismicity”, Rockbursts and Seismicity in Mines, Gibowicz, S., and Lasocki (Editors), Balkema, Rotterdam, 385-396.
Mendecki, A. J. (Editor) (1997), “Seismic Monitoring in Mines”, Chapman& Hall, London, 262 pp. Oye, V., Bungum, H., and Roth, M. (2005), “Source parameters and scaling relations for mining related seismicity within the Pyhäsalmi ore mine, Finland”, submitted to Bulletin of the Seismological Society of America. Oye, V., and Roth, M. (2003), “Automated seismic event location for hydrocarbon reservoirs”, Computers and Geosciences, 29, 851-863. Prejean, S. G., and Ellsworth, W. L. (2001), “Observations of earthquake source parameters at 2 km depth in the Long Valley Caldera, Eastern California”, Bulletin of the Seismological Society of America, 91, 165-177. Puustjärvi, H., (1999), “Pyhäsalmi Modeling Project, Section B. Geology, Technical Report, Geological Survey of Finland, and Outokumpu Mining Oy”, 66 pp. Reinecker, J., Heidbach,m O., Tingay, M., Connolly, P., and Müller, B. (2004), “The 2004 release of the World Stress Map” (available online at www.world-stress-map.org). Richardson, E., and Jordan, T. H. (2002), “Seismicity in deep gold mines of South Africa: implications for tectonic earthquakes”, Bulletin of the Seismological Society of America, 92, 1766-1782. Snoke, J. A. (1987), “Stable determination of (Brune) stress drops”, Bulletin of the Seismological Society of America, 77, 530-538.