sound of music - olli.illinois.eduolli.illinois.edu/downloads/courses/2020 spring courses/sound of...
TRANSCRIPT

Sound of MusicHow It Works
Session 1Building Blocks
OLLI at Illinois
Spring 2020D. H. Tracy
This pdf handout does not contain the
animations or sounds of the original presentation.

Course Outline
1. Building Blocks: Some basic concepts
2. Resonance: Building Sounds
3. Hearing and the Ear
4. Musical Scales
5. Musical Instruments
6. Singing and Musical Notation
7. Harmony and Dissonance; Chords
8. Combining the Elements of Music
1/27/20 Sound of Music 1 4

Session 1 Outline: Building Blocks
1/27/20 Sound of Music 1 5

Jargon
• We’ll try to avoid Jargon (as much as possible)
• Music has a very long history
– Vocabulary, concepts, notation, even instruments have deep roots
– Lots of baggage…Legacy terminology
– Potential for obscuration or confusion!
1/27/20 Sound of Music 1 6

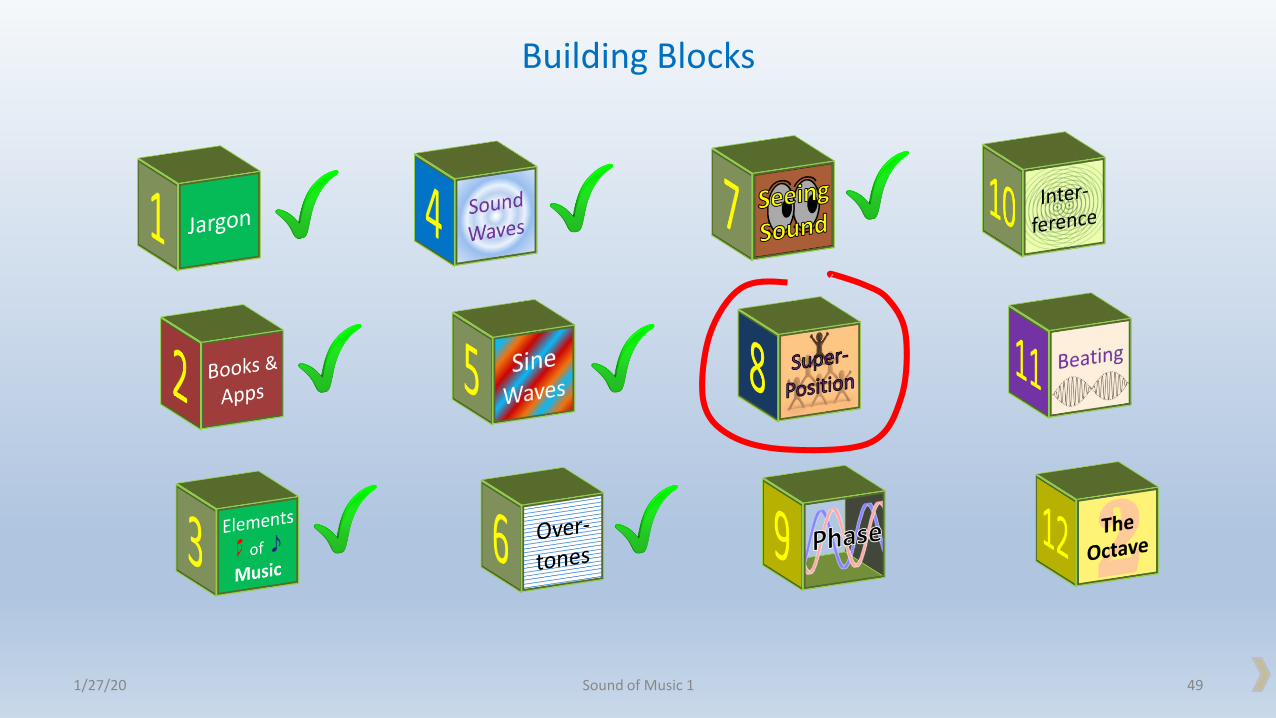
Building Blocks
1/27/20 Sound of Music 1 7
Demo
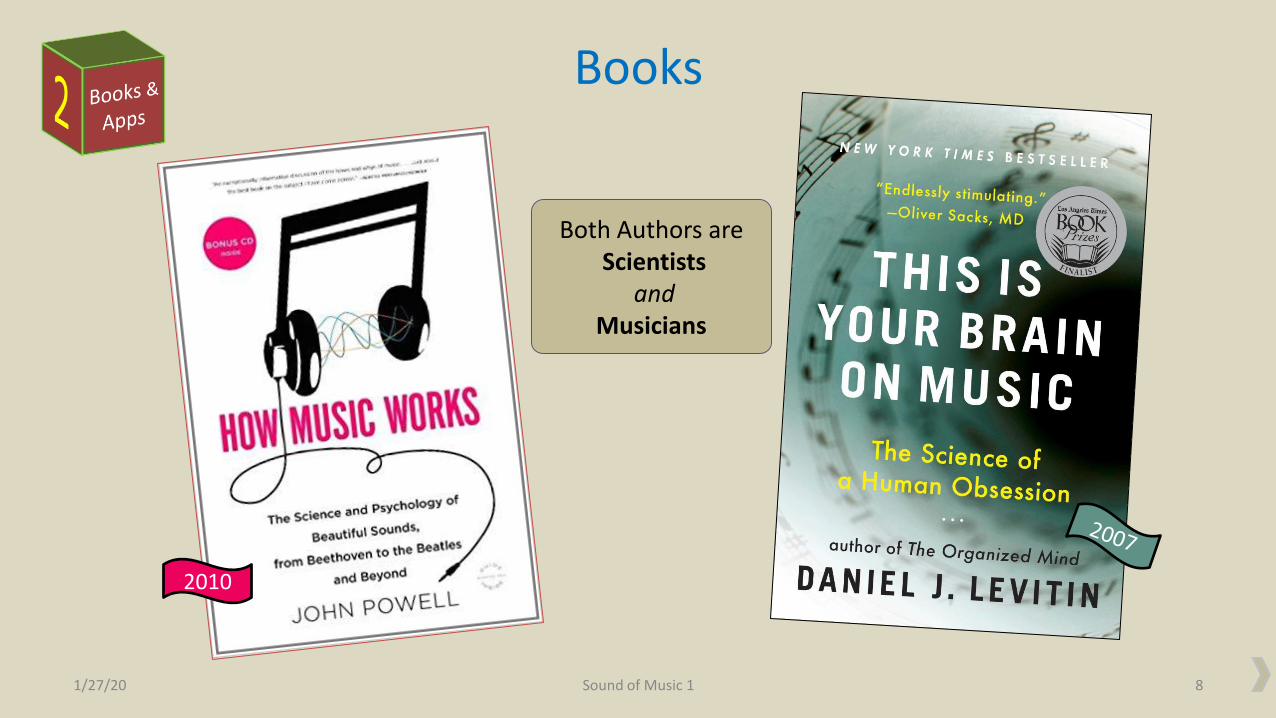
Books
1/27/20 Sound of Music 1 8
2010
Both Authors areScientists
andMusicians

More Books
1/27/20 Sound of Music 1 9
2008
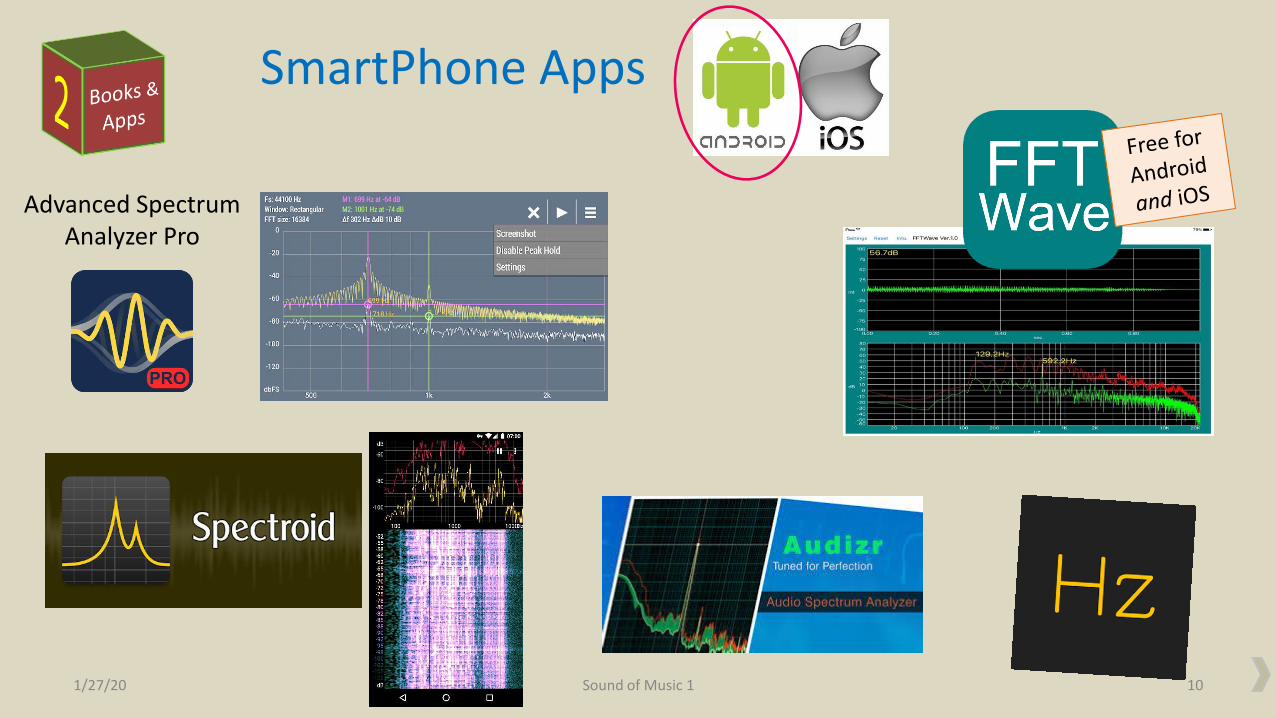
SmartPhone Apps
1/27/20 Sound of Music 1 10
Advanced Spectrum Analyzer Pro

SmartPhone Apps
1/27/20 Sound of Music 1 11
Advanced Spectrum Analyzer Pro
Toon(iOS)
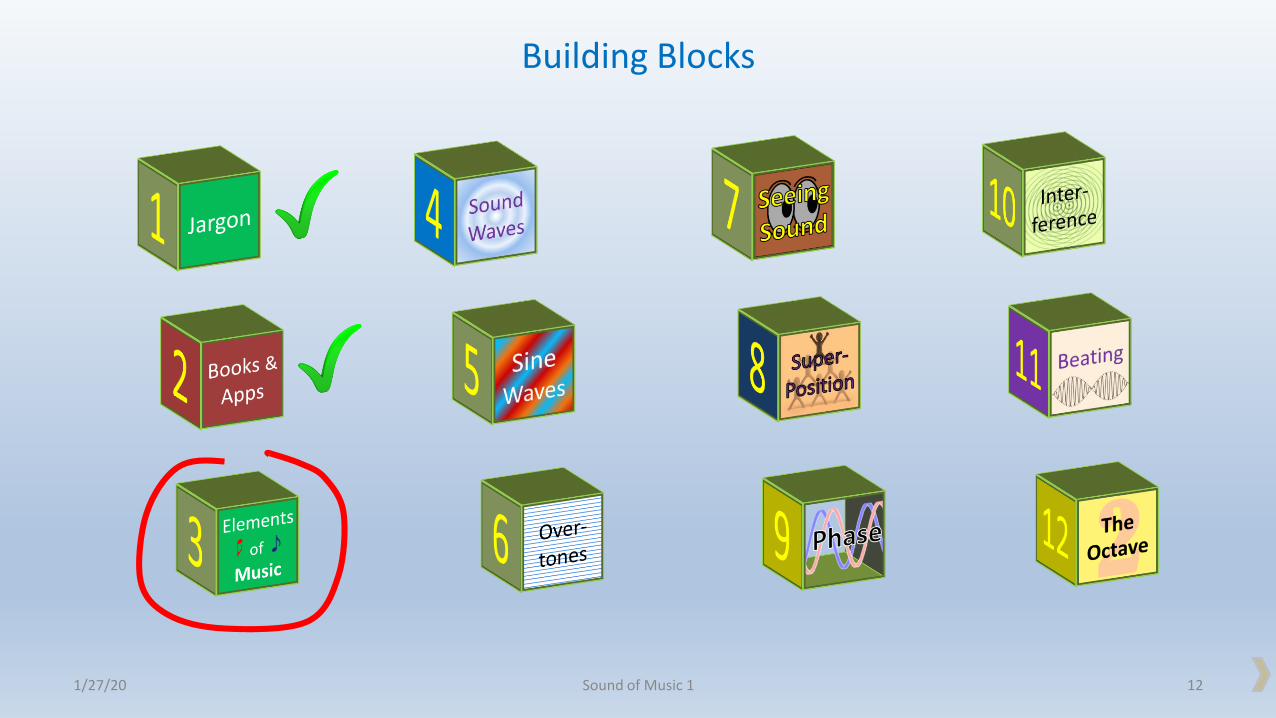
Building Blocks
1/27/20 Sound of Music 1 12
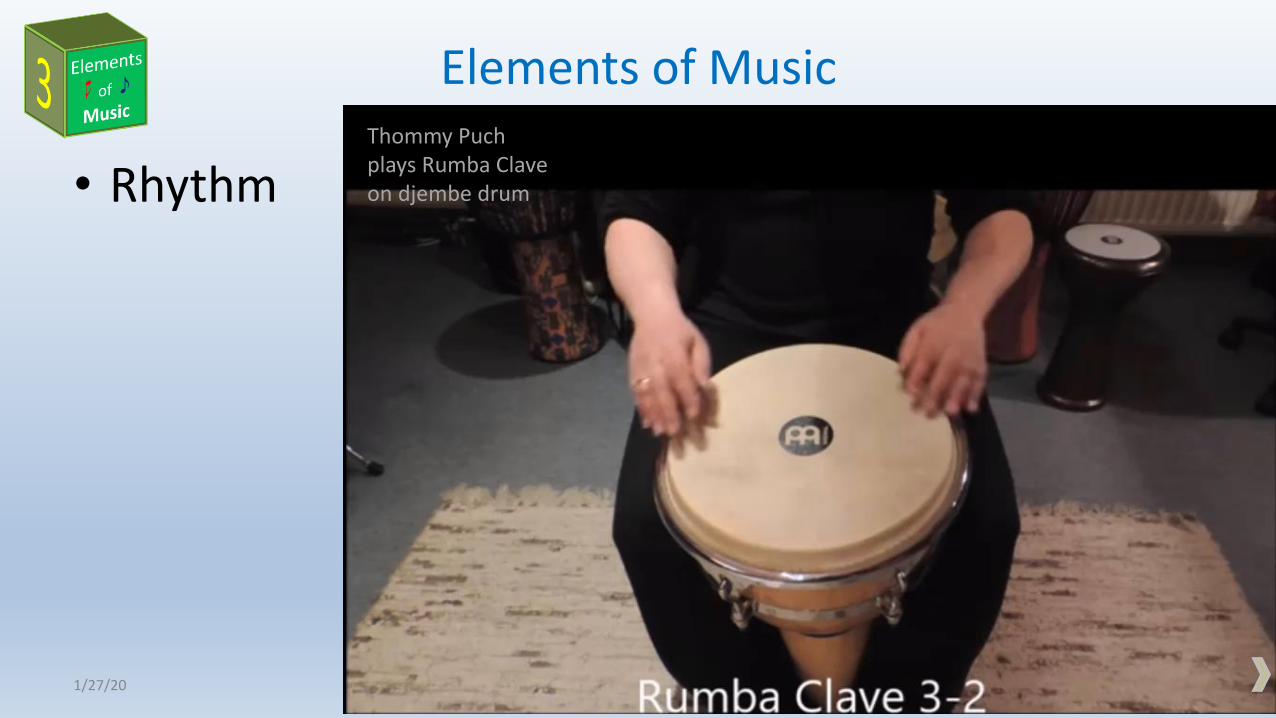
Elements of Music
• Rhythm
1/27/20 Sound of Music 1 13
Thommy Puchplays Rumba Clave on djembe drum

Elements of Music
• Rhythm
• Melody
1/27/20 Sound of Music 1 14
Tchaikovsky Swan Lake Easy Notes Sheet Music for Violin Flute Oboe
TchaikovskyOpus 20 Swan Theme A minor

Beethoven Pathetique – Piano Sonata #8
Elements of Music
• Rhythm
• Melody
• Harmony
1/27/20 Sound of Music 1 15
Harmony refers to notesplayed simultaneously

Vince Guaraldi -- Linus and Lucy
Beethoven Pathetique – Piano Sonata #8
ABBA Waterloo
Elements of Music
• Rhythm
• Melody
• Harmony
1/27/20 Sound of Music 1 21
Elements of Music
• Rhythm
• Melody
• Harmony
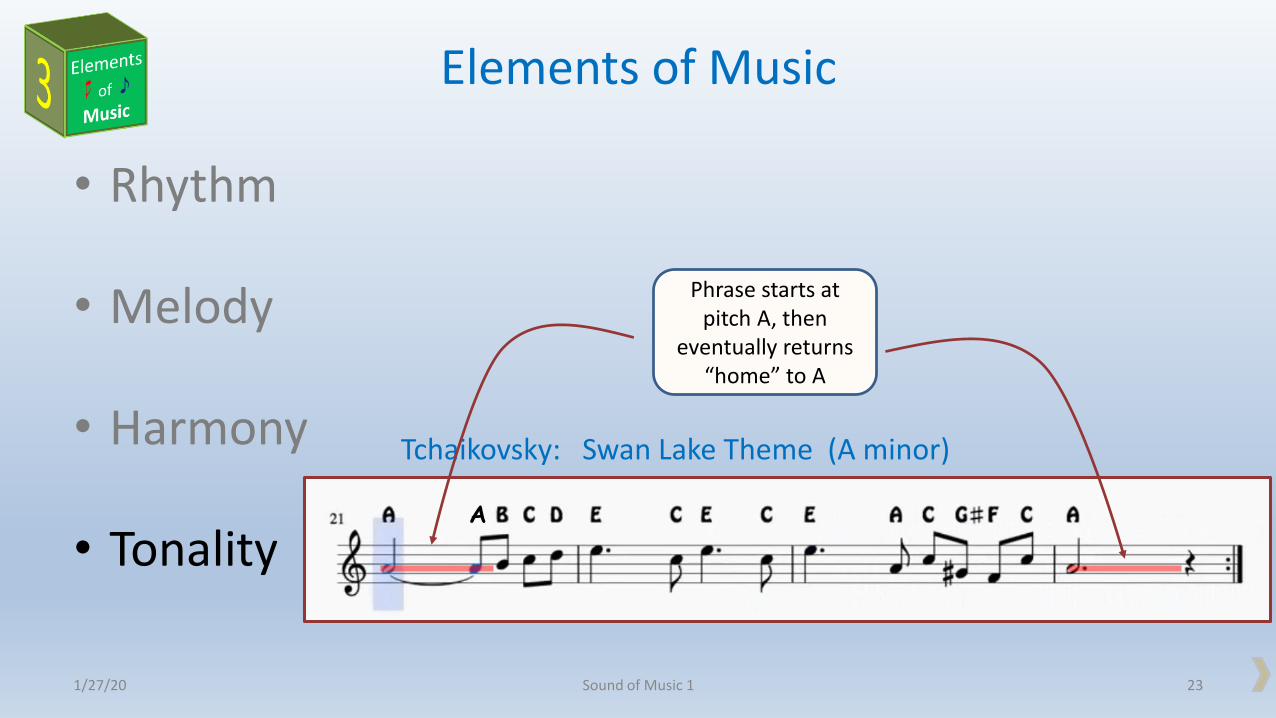
• Tonality
1/27/20 Sound of Music 1 23
Tchaikovsky: Swan Lake Theme (A minor)
A
Phrase starts at pitch A, then
eventually returns “home” to A
Building Blocks
1/27/20 Sound of Music 1 24

1/27/20 Sound of Music 1 25
Sound Waves in Air
Institute of Sound & Vibration Research, Southampton Univ.
Velocity:
1000 ft/sec(300 m/s)

1/27/20 Sound of Music 1 26
Velocity:
1000 ft/sec(300 m/s)
Sound Waves in Air
Institute of Sound & Vibration Research, Southampton Univ.
Longitudinal WaveAir molecules move
back and forth along direction of wave
propagation
Air Pressure bobs up and down as waves pass by
any point

Sound Wave Reflection
1/27/20 Sound of Music 1 27
Hard Wall

Sound Wave Diffraction
1/27/20 Sound of Music 1 28
When hole is small compared to wavelength, more diffraction

Building Blocks
1/27/20 Sound of Music 1 29

Types of Sound Waves
1/27/20 Sound of Music 1 30
Non-periodic
Periodic
~ 1/20 sec
3.8ms
Sine

0 0.01 0.02 0.03 0.04 0.05
100 Hz
200 Hz
300 Hz
303 Hz
400 Hz
500 Hz
600 Hz
800 Hz
1000 Hz
2000 Hz
4000 Hz
Sine Waves Characterized by Frequency
1/27/20 Sound of Music 1 31
Frequency:
Vibrations per Secondor
Cycles Per Second
1857-1894
As of 1960, officially changed to
Hertz

0 0.01 0.02 0.03 0.04 0.05
100 Hz
200 Hz
300 Hz
303 Hz
400 Hz
500 Hz
600 Hz
800 Hz
1000 Hz
2000 Hz
4000 Hz
Sine Waves Characterized by Frequency
1/27/20 Sound of Music 1 32
100 Hz
200 Hz
300 Hz
303 Hz
400 Hz
500 Hz
600 Hz
800 Hz
1000 Hz
2000 Hz
4000 Hz

0 0.01 0.02 0.03 0.04 0.05
100 Hz
200 Hz
300 Hz
303 Hz
400 Hz
500 Hz
600 Hz
800 Hz
1000 Hz
2000 Hz
4000 Hz
Sine Waves Characterized by Frequency
1/27/20 Sound of Music 1 33
Your perception of PitchCorrelates with Frequency
Sinusoidal Sound Wavesare also known as
Simple Tones orPure Tones

0 0.01 0.02 0.03 0.04 0.05
100 Hz
200 Hz
300 Hz
303 Hz
400 Hz
500 Hz
600 Hz
800 Hz
1000 Hz
2000 Hz
4000 Hz
Sine Waves Characterized by Frequency
1/27/20 Sound of Music 1 34
Your perception of PitchCorrelates with Frequency
Sinusoidal Sound Wavesare also known as
Simple Tones or Pure Tones
These Pure Tones are rarein music and natureMostly Electronic

0 0.01 0.02 0.03 0.04 0.05
100 Hz
200 Hz
300 Hz
303 Hz
400 Hz
500 Hz
600 Hz
800 Hz
1000 Hz
2000 Hz
4000 Hz
Sine Waves Characterized by Wavelength
1/27/20 Sound of Music 1 35Institute for Vibration & Sound Research, Southampton
f
0 0.01 0.02 0.03 0.04 0.05
100 Hz
200 Hz
300 Hz
303 Hz
400 Hz
500 Hz
600 Hz
800 Hz
1000 Hz
2000 Hz
4000 Hz
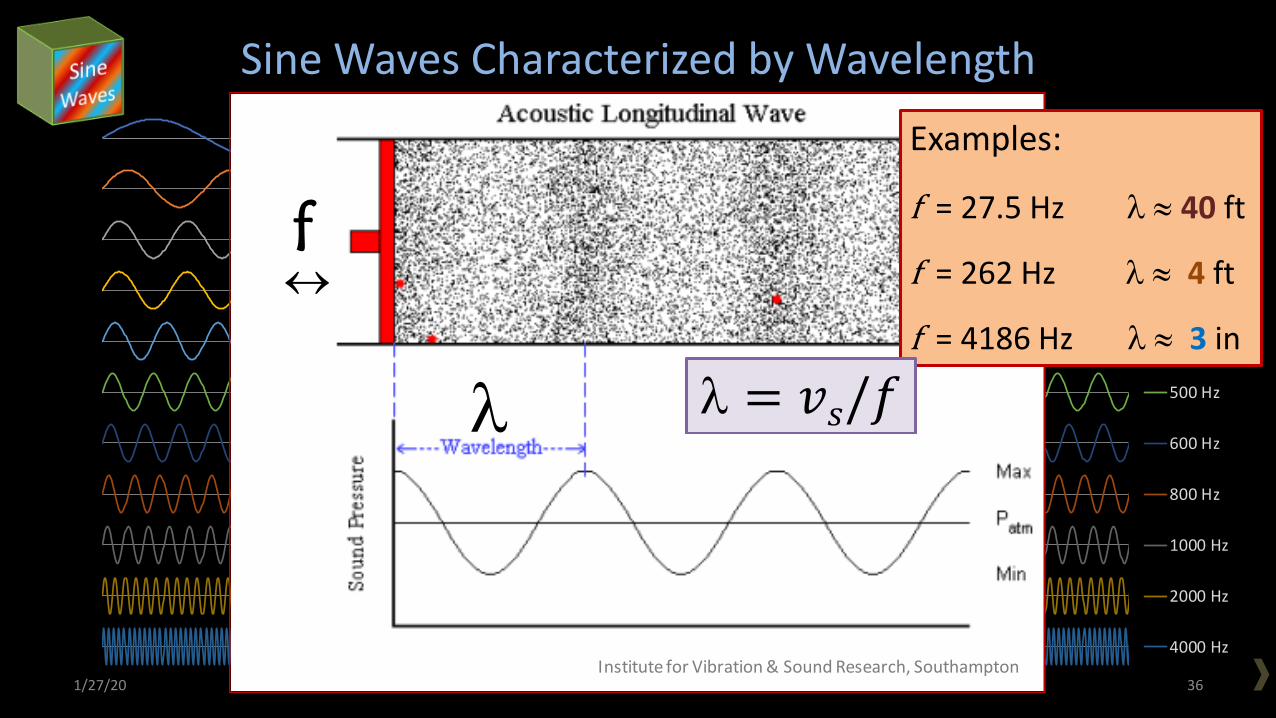
Sine Waves Characterized by Wavelength
1/27/20 Sound of Music 1 36Institute for Vibration & Sound Research, Southampton
f
Examples:
f = 27.5 Hz 40 ft
f = 262 Hz 4 ft
f = 4186 Hz 3 in

0 0.01 0.02 0.03 0.04 0.05
100 Hz
200 Hz
300 Hz
303 Hz
400 Hz
500 Hz
600 Hz
800 Hz
1000 Hz
2000 Hz
4000 Hz
Sine Waves Characterized by Wavelength
1/27/20 Sound of Music 1 37
Examples:
f = 27.5 Hz 40 ft
f = 262 Hz 4 ft
f = 4186 Hz 3 in

Building Blocks
1/27/20 Sound of Music 1 38

Real Musical Notes are not Pure Sine Waves
• Complex tones
– Fundamental frequency f0
– Several (or many) higher frequencies(Overtones or Partials)
• Usually multiples of f0 called
Harmonics
1/27/20 Sound of Music 1 39
Complex Tone

Real Musical Notes are not Pure Sine Waves
• Complex tones
– Fundamental frequency f0
– Several (or many) higher frequencies(Overtones or Partials)
• Usually multiples of f0 called
Harmonics
1/27/20 Sound of Music 1 40
Complex Tone
Fundamental Tone
2nd Harmonic
3rd Harmonic
4th Harmonic
5th Harmonic
6th Harmonic
7th Harmonic

Musical Instruments and Nature Rarely Make Sine Waves
2/2/2017 Hear All About It 41

Building Blocks
1/27/20 Sound of Music 1 42

Visualization of Sound
Two main approaches:
• Waveform Display
• Spectrum Display
1/27/20 Sound of Music 1 43
0 0.005 0.01 0.015 0.02 0.025 0.03
Sou
nd
Pre
ssu
re →
Time (seconds)
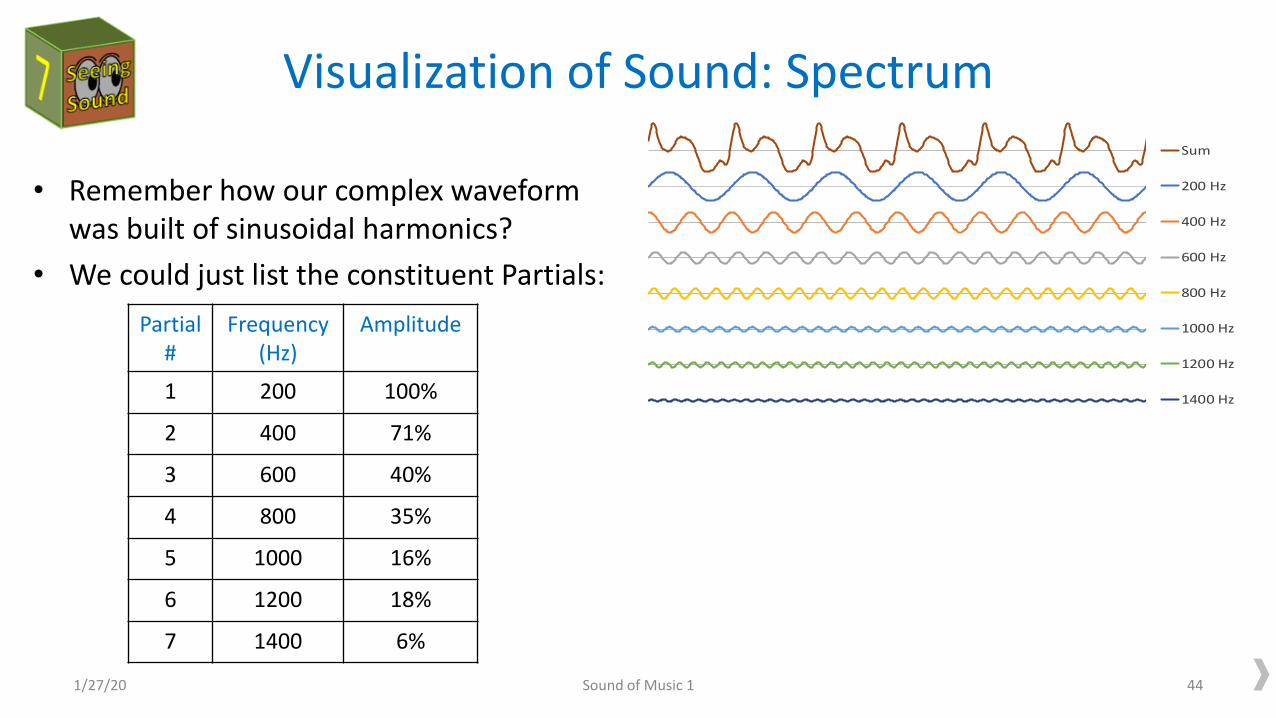
Visualization of Sound: Spectrum
0 0.005 0.01 0.015 0.02 0.025 0.03
Sum
200 Hz
400 Hz
600 Hz
800 Hz
1000 Hz
1200 Hz
1400 Hz
• Remember how our complex waveform was built of sinusoidal harmonics?
• We could just list the constituent Partials:
1/27/20 Sound of Music 1 44
Partial #
Frequency (Hz)
Amplitude
1 200 100%
2 400 71%
3 600 40%
4 800 35%
5 1000 16%
6 1200 18%
7 1400 6%

Visualization of Sound: Spectrum
0 0.005 0.01 0.015 0.02 0.025 0.03
Sum
200 Hz
400 Hz
600 Hz
800 Hz
1000 Hz
1200 Hz
1400 Hz
• Remember how our complex waveform was built of sinusoidal harmonics?
• We could just list the constituent Partials:
1/27/20 Sound of Music 1 45
Partial #
Frequency (Hz)
Amplitude
1 200 100%
2 400 71%
3 600 40%
4 800 35%
5 1000 16%
6 1200 18%
7 1400 6%
0
0.2
0.4
0.6
0.8
1
1.2
0 200 400 600 800 1000 1200 1400
Am
pli
tud
e →
Frequency (Hz)
Frequency Spectrum of Our Complex Tone
P1
P2
P3 P4
P5 P6P7
…Or draw a graph of the Table

Visualization of Sound
Two main approaches:
• Waveform Display
• Spectrum Display
1/27/20 Sound of Music 1 46
0 0.005 0.01 0.015 0.02 0.025 0.03
Sou
nd
Pre
ssu
re →
Time (seconds)
0
0.2
0.4
0.6
0.8
1
1.2
0 200 400 600 800 1000 1200 1400
Am
pli
tud
e →
Frequency (Hz)
Frequency Spectrum of Our Complex Tone

Visualization of Sound
Two main approaches:
• Waveform Display
• Spectrum Display
1/27/20 Sound of Music 1 47
0 0.005 0.01 0.015 0.02 0.025 0.03
Sou
nd
Pre
ssu
re →
Time (seconds)
0
0.2
0.4
0.6
0.8
1
1.2
0 200 400 600 800 1000 1200 1400
Am
pli
tud
e →
Frequency (Hz)
Frequency Spectrum of Our Complex Tone
0
200
400
600
800
1000
1200
1400
1600
1 1 2 2
Fre
qu
en
cy (H
z) →
200 Hz Fundamental + Harmonics
F
H2
H3
H4
H5
H6
H7
Amplitudes Indicated
by color or line width

Visualization of Sound
1/27/20 Sound of Music 1 48
Demo failed due to software problem
Building Blocks
1/27/20 Sound of Music 1 49

Superposition of Sound Waves
1/27/20 Sound of Music 1 50
• Waves pass through one another without disruption
• Where they overlap, Superposition applies:--Pressures add up
Two sound sources of different frequencies

Superposition of Sound Waves
1/27/20 Sound of Music 1 51
• Waves pass through one another without disruption
• Where they overlap, Superposition applies:--Pressures add up
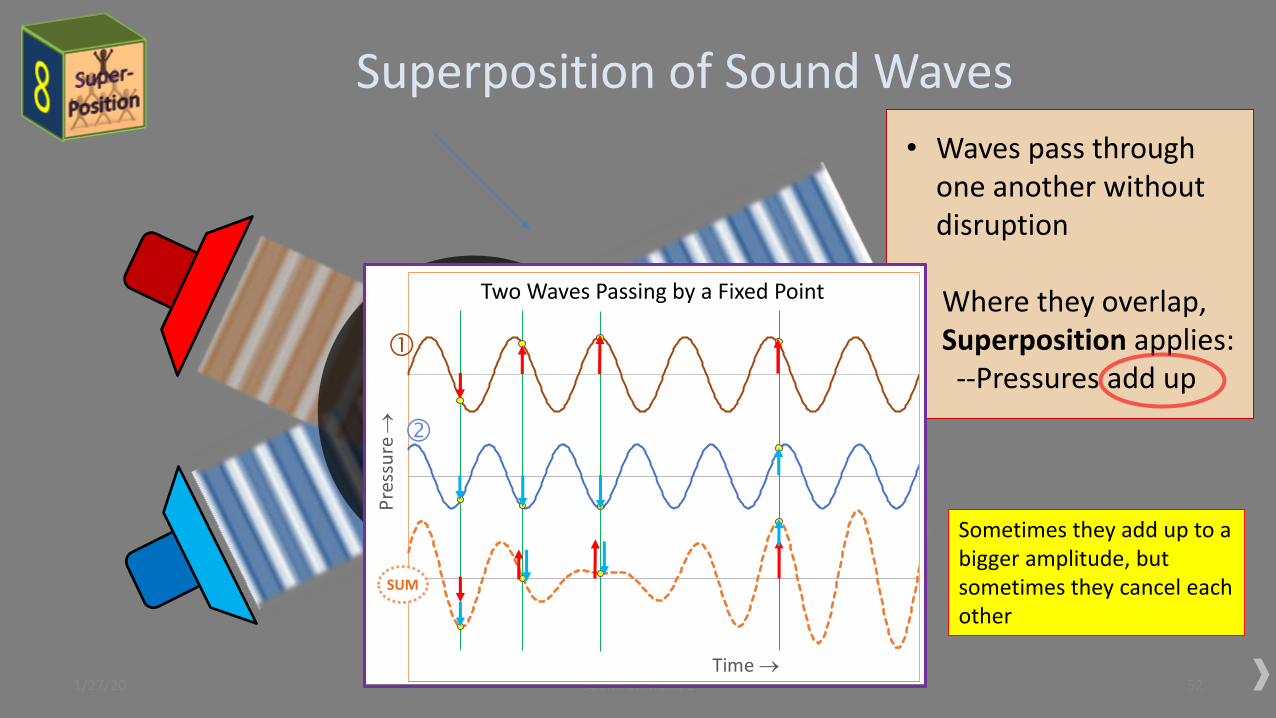
Superposition of Sound Waves
1/27/20 Sound of Music 1 52
• Waves pass through one another without disruption
• Where they overlap, Superposition applies:--Pressures add up
0 0.005 0.01 0.015 0.02 0.025 0.03
Pre
ssu
re →
Time →
Two Waves Passing by a Fixed Point
SUM
Sometimes they add up to a bigger amplitude, but sometimes they cancel each other

Building Blocks
1/27/20 Sound of Music 1 54

Phase: Delayed Waves
1/27/20 Sound of Music 1 550 0.005 0.01 0.015 0.02
Phase Shifted Waves
0°
30°
90°
180°
270°
360°
360b
• Phase refers to time shifts between waves of the same or similar frequency
• Measured in Degrees360 = Full Cycle
Green wave is shifted by 360, or a full wave cycle.
Therefore looks just like the original Blue wave.

Building Blocks
1/27/20 Sound of Music 1 56

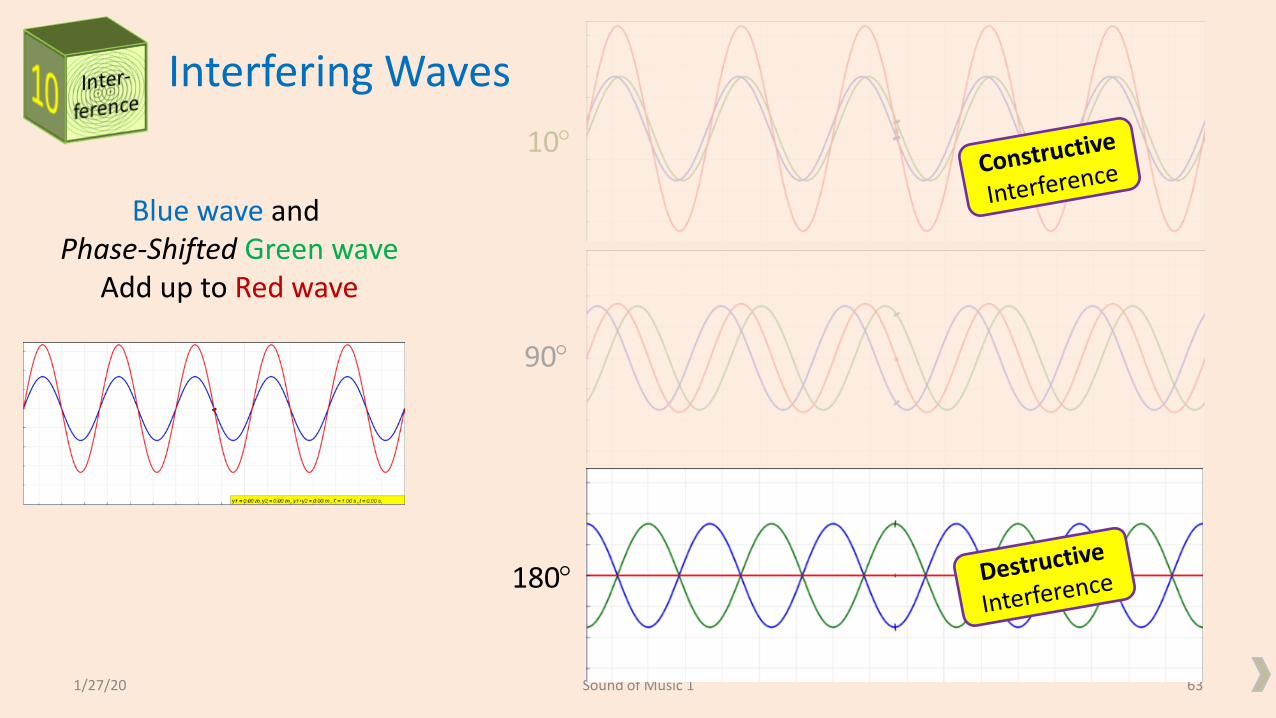
Interfering Waves
1/27/20 Sound of Music 1 58
Blue wave andPhase-Shifted Green wave
Add up to Red wave
10
90
180

Interfering Waves
1/27/20 Sound of Music 1 59
Blue wave andPhase-Shifted Green wave
Add up to Red wave
10
90
180

Interfering Waves
1/27/20 Sound of Music 1 61
Blue wave andPhase-Shifted Green wave
Add up to Red wave
10
90
180
Demo
2 Speakers emitting 329 Hz Sine Waves

Interfering Waves
1/27/20 Sound of Music 1 62
Blue wave andPhase-Shifted Green wave
Add up to Red wave
10
90
180
Interfering Waves
1/27/20 Sound of Music 1 63
Blue wave andPhase-Shifted Green wave
Add up to Red wave
10
90
180

Interfering Waves
1/27/20 Sound of Music 1 64
Blue wave andPhase-Shifted Green wave
Add up to Red wave
10
90
180

Building Blocks
1/27/20 Sound of Music 1 65
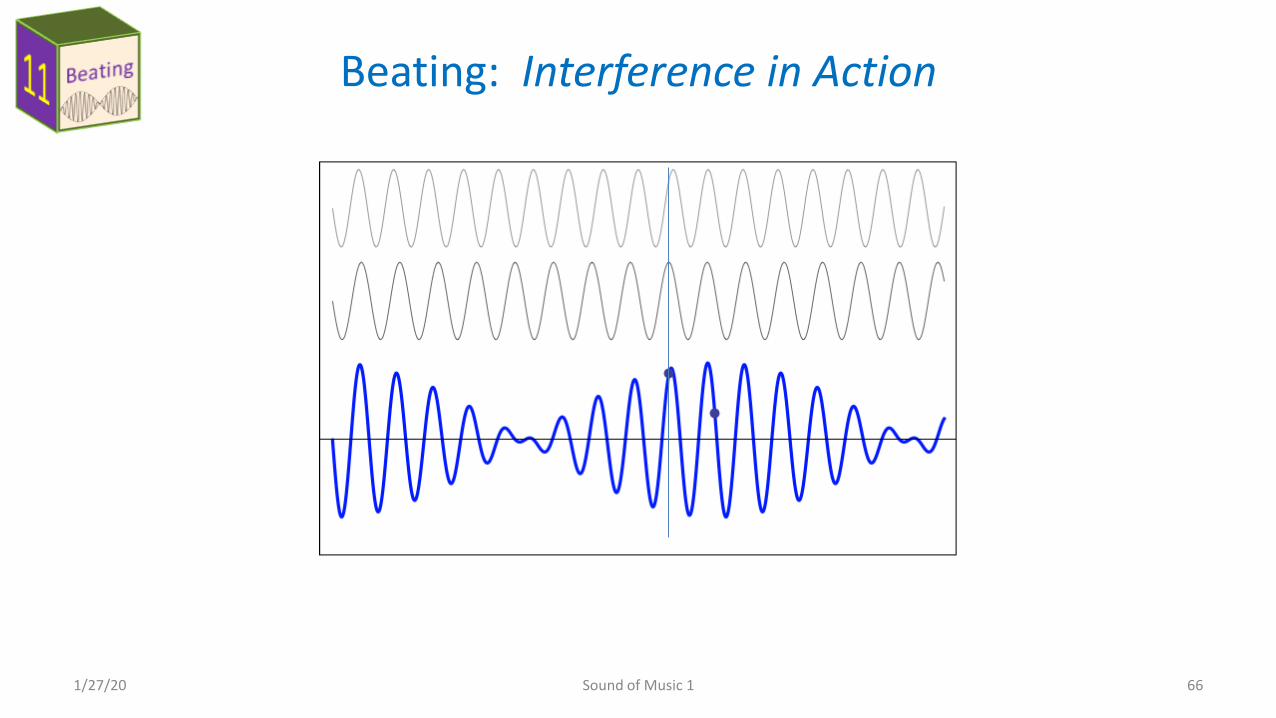
Beating: Interference in Action
1/27/20 Sound of Music 1 66

Beating: Interference in Action
1/27/20 Sound of Music 1 67
Higher Frequency
Lower Frequency
Time → e
1
1
12
11
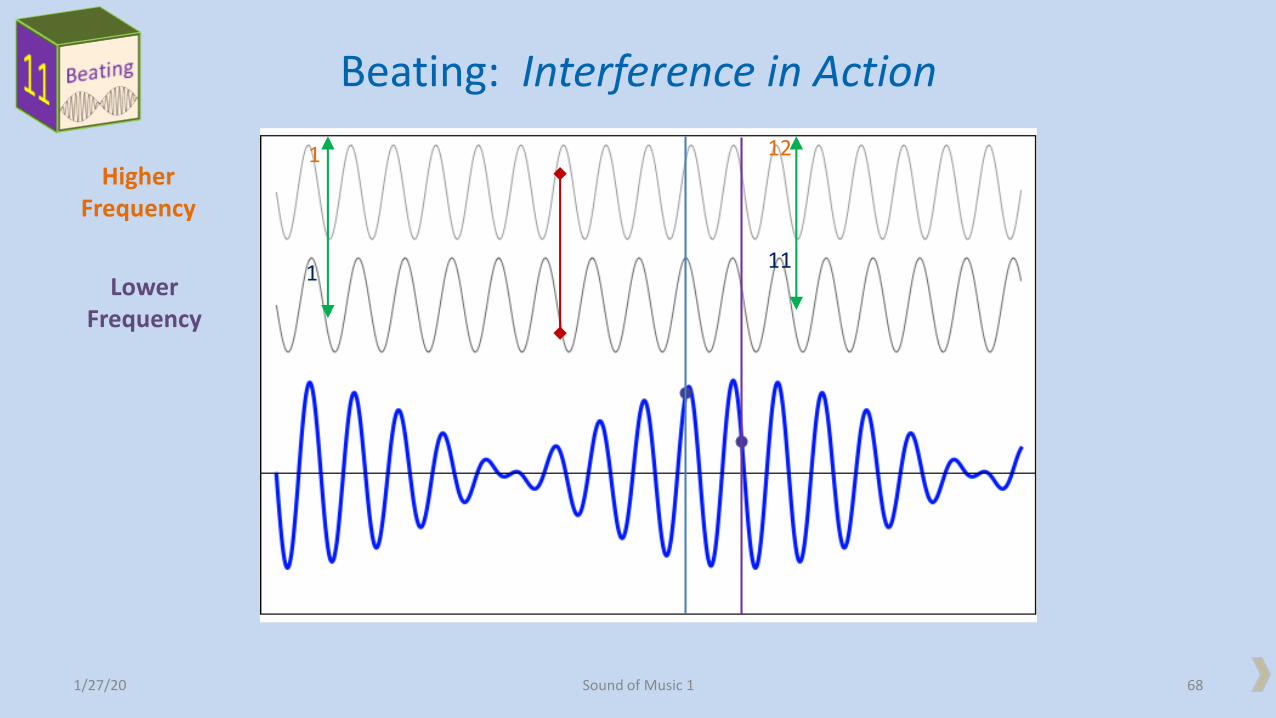
1/27/20 Sound of Music 1 68
Higher Frequency
Lower Frequency
1
1
12
11
Beating: Interference in Action

1/27/20 Sound of Music 1 70
Higher Frequency
Lower Frequency
Beating: Interference in Action
Demo
329 Hz + 330 Hz gives 1 Hz Beat,
etc.

1/27/20 Sound of Music 1 71
Beating: Interference in Action
Another Example:3 Simultaneous Tones:
440 Hz441 Hz443 Hz
Hear complex beat pattern (1Hz, 2 Hz and 3 Hz)

Building Blocks
1/27/20 Sound of Music 1 72

The Octave: Doubling the Frequency
• Doubling or Halving the Frequency has special significance in all musical traditions.
• A musical Note and its Octave (i.e. double f ) sound especially good together.
2:1 is the most harmonious ratio
• If a Note with Fundamental Frequency f exists in a musical tradition,
then so does its Octave 2f .
1/27/20 Sound of Music 1 73

The Octave: Doubling the Frequency
1/27/20 Sound of Music 1 74
0
200
400
600
800
1000
1200
1400
1600
1800
1 1 2 2 3 3 4
Fre
qu
en
cy (H
z) →
200 & 400 Hz Fundamentals + Harmonics
200 Hz
400 Hz 410 Hz 420 Hz
200+
402
200+
410
200+
420
200+
400
402 Hz
These tones have 12 harmonics
200+
403
All the partials (Fundamental and harmonics) of the 400 Hz note were already in the 200 Hz note! So they sound good together.
Nice! Beats! Harsh! Harsher!
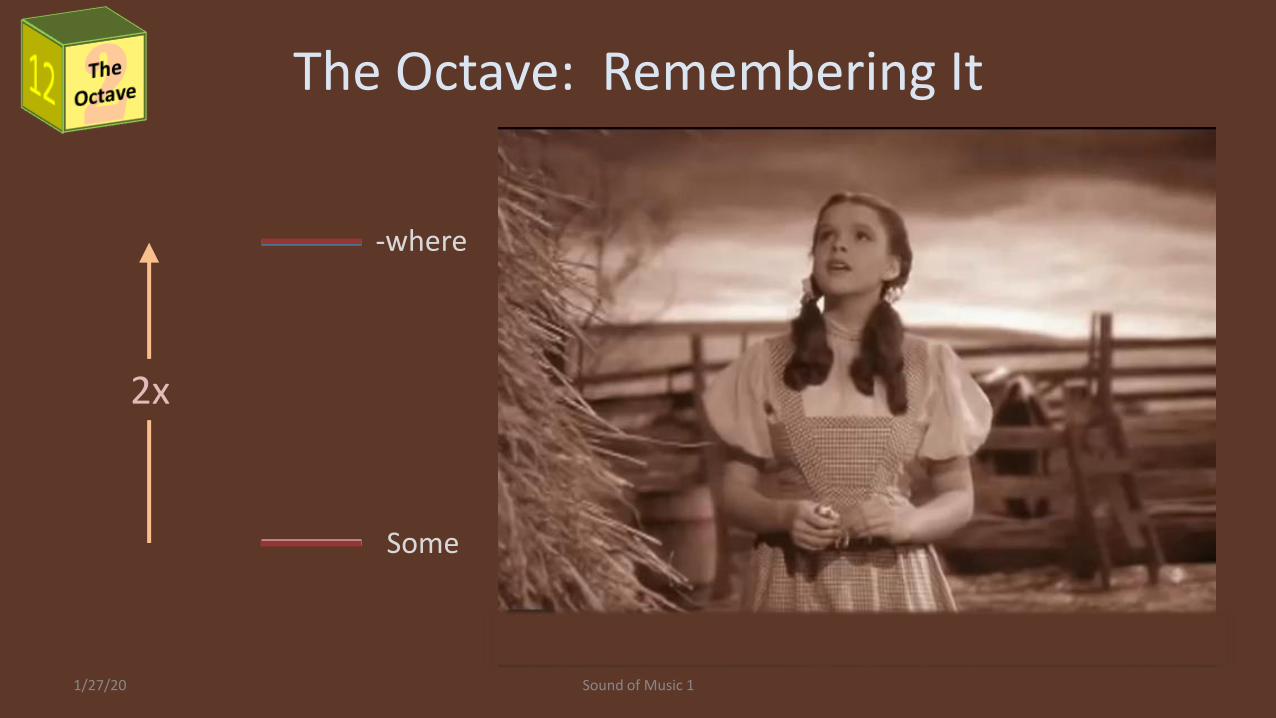
The Octave: Remembering It
1/27/20 Sound of Music 1
2x
Some
-where

The Octave: Remembering It
1/27/20 Sound of Music 1
2x
Some
-where Somewhere Over the Rainbow…

The Octave: Remembering It
1/27/20 Sound of Music 1
G3-> G4

Course Outline
1. Building Blocks: Some basic concepts
2. Resonance: Building Sounds
3. Hearing and the Ear
4. Musical Scales
5. Musical Instruments
6. Singing and Musical Notation
7. Harmony and Dissonance; Chords
8. Combining the Elements of Music
1/27/20 Sound of Music 1 78