sound investment + time + patience = wealth creation
TRANSCRIPT

June 30, 2021
HDFC FLEXI CAP FUND
SOUND INVESTMENT + TIME + PATIENCE =
WEALTH CREATIONA SIP of ` 10,000@ invested in HDFC Flexi Cap Fund
would be ` 9.69 crore today^
@ Assuming `10,000 invested systematically on the first Business Day of every month since January 01, 1995 (Scheme Inception Date). ^ As on June 30, 2021. Past performance may or may not be sustained in the future. Refer complete performance details on Page no. 8.

2 June 2021
Fund ManagerAn employee of the asset management company such as a mutual fund or life insurer, who manages investments of the scheme. He is usually part of a larger team of fund managers and research analysts.
Application Amount for Fresh SubscriptionThis is the minimum investment amount for a new investor in a mutual fund scheme.
Minimum Additional AmountThis is the minimum investment amount for an existing investor in a mutual fund scheme.
Yield to MaturityThe Yield to Maturity or the YTM is the rate of return anticipated on a bond if held until maturity. YTM is expressed as an annual rate. The YTM factors in the bond’s current market price, par value, coupon interest rate and time to maturity.
SIPSIP or systematic investment plan works on the principle of making periodic investments of a fixed sum. It works similar to a recurring bank deposit. For instance, an investor may opt for an SIP that invests Rs 500 every 15th of the month in an equity fund for a period of three years.
NAVThe NAV or the net asset value is the total asset value per unit of the mutual fund after deducting all related and permissible expenses. The NAV is calculated at the end of every business day. It is the value at which the investor enters or exits the mutual fund.
BenchmarkA group of securities, usually a market index, whose performance is used as a standard or benchmark to measure investment performance of mutual funds, among other investments. Some typical benchmarks include the NIFTY, SeNSex, BSe200, BSe500, 10-Year Gsec.
IDCW OptionIn line with applicable SeBI guidelines, with effect from April 1, 2021, the name of "Dividend Option" under the Schemes stand revised as "Income Distribution cum Capital Withdrawal (IDCW) Option". IDCW Option may offer Payout and Reinvestment Sub-options / facilities. Investors may note that the amounts can be distributed out of investor’s capital (Equalization Reserve), which is part of sale price that represents realized gains.
Dividend / IDCW"Dividend" / "IDCW" means income distributed on Mutual Fund Units from the distributable surplus, which may include a portion of the investor’s capital {i.e. part of Sale Price (viz. price paid by the investor for purchase of Units) representing retained realized gains (equalisation reserve) in the Scheme books}.
Exit Loadexit load is charged at the time an investor redeems the units of a mutual fund. The exit load is reduced from the prevailing NAV at the time of redemption. The investor will receive redemption proceed at net value of NAV less Exit Load. For instance if the NAV is Rs. 100 and the exit load is 1%, the investor will receive Rs. 99.
Modified DurationModified duration is the price sensitivity and the percentage change in price for a unit change in yield.
Standard DeviationStandard deviation is a statistical measure of the range of an investment’s performance. When a mutual fund has a high standard deviation, its means its range of performance is wide, implying greater volatility. Sharpe Ratio
The Sharpe Ratio, named after its founder, the Nobel Laureate William Sharpe, is a measure of risk-adjusted returns. It is calculated using standard deviation and excess return to determine reward per unit of risk. Beta Ratio (Portfolio Beta)
Beta is a measure of an investment’s volatility vis-a-vis the market. Beta of less than 1 means that the security will be less volatile than the market. A beta of greater than 1 implies that the security’s price will be more volatile than the market. Average portfolio PE (Average P/E)
It is price to earnings ratio of the stocks calculated for the entire portfolio on a weighted average basis. Average portfolio price to book ratio (Average P/BV)
It is price to book value of the stocks calculated for the entire portfolio on a weighted average basis. Average portfolio dividend yield (Average Dividend Yield)
It is dividend yield of the stocks calculated for the entire portfolio on a weighted average basis. Net Equity
Net equity level is the net equity exposure percentage adjusted for any derivative positions in stocks or index for hedging or rebalancing purpose. R Squared
It is a statistical measure of how closely the portfolio returns are correlated with its benchmark. AUM
AUM or assets under management refers to the recent / updated cumulative market value of investments managed by a mutual fund or any investment firm. Holdings
The holdings or the portfolio is a mutual fund’s latest or updated reported statement of investments/securities. These are usually displayed in terms of percentage to net assets or the rupee value or both. The objective is to give investors an idea of where their money is being invested by the fund manager. Nature of Scheme
The investment objective and underlying investments determine the nature of the mutual fund scheme. For instance, a mutual fund that aims at generating capital appreciation by investing in stock markets is an equity fund or growth fund. Likewise, a mutual fund that aims at capital preservation by investing in debt markets is a debt fund or income fund. each of these categories may have sub-categories. Rating Profile
Mutual funds invest in securities after evaluating their creditworthiness as disclosed by the ratings. A depiction of the mutual fund in various investments based on their ratings becomes the rating profile of the fund. Typically, this is a feature of debt funds.
HOW TO READ FACTSHEET
Sharpe RatioSharpe Ratio is a risk to reward ratio, it measures portfolio returns generated in excess to the investment in risk-free asset, for per unit of total risk taken. While, positive Sharpe ratio indicates, portfolio compensating investors with excess returns (over risk-free rate) for the commensurate risk taken; negative Sharpe ratio indicates, investors are better off investing in risk-free assets.
BetaBeta (ß) of a portfolio is a number indicating the relation between portfolio returns with that of the market index i.e. it measure the volatility, or systematic risk, of a portfolio in comparison to the market as a whole.
Standard DeviationA statistical measure that defines expected volatility/risk associated with a portfolio. This explains the variation/deviation from the average returns delivered by the portfolio. A higher standard deviation means higher volatility (risk) and a lower standard deviation means lower volatility.
Risk Free ReturnThe theoretical rate of return of an investment with safest (zero risk) investment in a country.
4 Indexation Benefit
l Long Term Capital Gains (holding period of over 3 years) from Debt Mutual Funds are taxed at 20% plus applicable surcharge and cess with the benefit of indexation.
l Government notifies Cost Inflation Index (CII) for each financial year taking into consideration the prevailing inflation levels.
l The cost of acquistion for computation of tax is adjusted for inflation using CII, thereby reducing the capital gains from tax perspective.
l An investment made into a debt fund towards the end of a financial year (say, in March 2020) and held for a little over 3 years (say, in April 2023) would be eligible for application of CII over 5 financial years, resulting in 4 indexation benefit.
Total Expense RatioTotal expenses charged to scheme for the month expressed as a percentage to average monthly net assets.
Tracking ErrorTracking error indicates how closely the portfolio return is tracking the benchmark Index return. It measures the deviation between portfolio return and benchmark index return. A lower tracking error indicates portfolio closely tracking benchmark index and higher tracking error indicates portfolio returns with higher deviation from benchmark index returns.
Average MaturityWeighted average maturity of the securities in scheme.
Portfolio Yield (Yield To Maturity)Weighted average yield of the securities in scheme portfolio.
Portfolio Turnover RatioPortfolio Turnover Ratio is the percentage of a fund’s holdings that have changed in a given year. This ratio measures the fund’s trading activity, which is computed by taking the lesser of purchases or sales and dividing by average monthly net assets.
Modified DurationA formula that expresses the measurable change in the value of a security in response to a change in interest rates. Modified duration of portfolio can be used to anticipate the change in market value of portfolio for every change in portfolio yield.
Macaulay Duration (Duration)Macaulay Duration (Duration) measures the price volatility of fixed income securities. It is often used in the comparison of interest rate risk between securities with different coupons and different maturities. It is defined as the weighted average time to cash flows of a bond where the weights are nothing but the present value of the cash flows themselves. It is expressed in years/days. The duration of a fixed income security is always shorter than its term to maturity, except in the case of zero coupon securities where they are the same.
GLOSSARY

June 2021 3
Market Review
Market Review continued on next page
Source for various data points: Bloomberg, NSDL, CMIE, RBI, Kotak Institutional Research, Worldometers.info, World Bank, Daily valuation provided by ICRA/CRISIL.
Macroeconomic Update
The rebound in global economy continued at a healthy pace led by advanced economies. Economic indicators from US hints that recovery is getting entrenched and has been better than expected supported by fast pace vaccination, lifting of restrictions and improvement in job market. Eurozone, which was lagging in vaccination till a few months ago, has also rapidly ramped up its pace of vaccination. The recent data from Eurozone and UK shows that the recovery momentum is improving with broad based improvement in both manufacturing and services sector. While growth momentum in China moderated a tad, it still remains at a reasonable level. The outlook on global growth remains optimistic on back of easing restrictions, accommodative fiscal and monetary policy, lower trending unemployment, high household savings, improving consumer sentiments, etc. On the domestic front, India gradually resumed its path of recovery as the new cases of Covid-19 dropped sharply in June 2021 after peaking in mid-May 2021. Thus, June 2021 saw revival in economic activity which is likely to pick up further momentum in coming months. Update on COVID-19: The aggregate number of Covid-19 cases worldwide rose to ~183 million as on 30 June 2021 from over 171 million a month ago. The net additions during the month reduced to ~12 million compared to ~18 million in May 2021. In general, new cases in many of the advanced economies like US, Europe etc. declined while cases rose in Emerging economies like Russia, Brazil, South Africa, Indonesia, etc. Notably, UK, which has vaccinated substantial proportion of its population with at least one dose of vaccine, witnessed a renewed surge in new cases during last week of June 2021 as the new mutated version of the virus spread rapidly. Most major economies including India have stepped up its vaccination efforts and are likely to cover significant proportion of its population by end of 2021.
% of population Given 1+ dose fully vaccinated Population (in million)
China 85 15 1,439U.K. 67 49 68Canada 67 20 38Israel 62 57 9Germany 55 37 84U.S. 54 47 331EU 50 33 448Brazil 35 12 213Mexico 24 15 129India 20 4 1,380Russia 16 10 146Indonesia 11 5 274
Source: Bloomberg, JM Financials
In India, the total cases rose to over 30 million as on 30 June 2021 from ~28 million as of end of last month, thus adding only ~2 million new cases in June 2021 as compared to ~9 million new cases in May 2021. The strong recovery rate resulted in active cases plunging to ~0.5 million only as of 30 June 2021 as compared to ~2 million as on 31 May 2021. Further, the death rate stood at 1.3% compared to global average of ~2.2%. The vaccination drive picked up pace as central government took over the responsibility of vaccinating entire adult population in India starting 21 June 2021. While supply of vaccines still remains a constraint, it is expected to ease over next couple of months as the vaccine producers’ scale up their capacity.
India
Source: Bloomberg
Recovery picks up pace as the restrictions are eased in most states: After moderating in May 2021, the high frequency indicators in June 2021 indicate gradual normalisation of economic activity. Most indicators showed sequential improvement and the pace of contraction has either narrowed or improved vis-à-vis May 2021. Further, the impact on manufacturing
sectors was also visibly lower than on services. The activity levels still remain below the levels seen in Q4FY21 due to phase wise unlocking approach followed by States.
Indicators Units Apr-20
Sep-20
Dec-20
Mar-21
Apr-21
May-21
Jun-21
Retail registration- Auto@ 2W
2 year CAGR,
%
-52.5 -10.3 -2.1 -5.7 -19.1 -46.1 -14.7PV -68.5 7.2 12.4 16.6 -1.9 -37.4 0.8MHCV -65.5 -49.9 -25.5 -9.7 -15.9 -46.1 -23.0LCV -51.8 -8.0 -13.7 -3.1 -15.8 -51.6 -19.0Tractors -60.8 38.7 18.7 21.8 3.1 -34.8 15.6
Gross GST collection -44.1 0.5 10.3 7.8 11.4 1.2 -3.6Average E-Way bill generated -44.5 9.3 13.3 13.9 5.8 -14.2 19.6Power demand (2Yr CAGR) NA 1.5 2.1 -22.5 -26.7 -4.7 -1.5IMPS Spending 8.9 40.7 41.1 36.2 33.1 21.5 28.1Railway Freight Tonnage -18.3 3.9 6.5 4.4 5.1 4.6 5.4Railway Freight Earnings -21.8 4.2 2.7 0.9 2.4 2.5 2.2Manufacturing PMI* Index 27.4 56.8 56.4 55.4 55.5 50.8 48.1Services PMI* Index 5.4 49.8 52.3 54.6 54.0 46.4 41.2Unemployment % 23.5 6.7 9.1 6.5 8.0 11.9 9.2Labour Force Participation Rate % 35.6 40.7 40.6 40.2 40.0 40.0 39.6
Given the nationwide lockdown during last year, 2year CAGR is being used to eliminate the base effect.Source: Raildrishti.com, MOFSL, gstn.org.in, www.icegate.gov.in, CMIE, PIB, RBI, vaahan.parivahan.gov.in,*Number >50 reflects expansions and number <50 reflects contraction compared to previous month@ - June 2021 figures are preliminary data and are subject to revision. The considerable fall in the Covid-19 cases and expected improvement in vaccination rollout bodes well for the economic outlook. Further, the forecast of normal monsoon, likely return of pent up demand, reopening of services sector, likely improvement in manufacturing capacity utilisation, adequate liquidity, etc. also makes us optimistic on sequential improvement in growth. Centre’sfiscaldeficitnarrowssharplysupportedbyrevenue,likelytoremainwithinbudgetestimate: Cumulative fiscal deficit in 2MFY22 came in at ~8.2% of budgeted estimate (BE) as compared to ~58% last year. The significantly lower fiscal deficit was driven by broad based improvement in tax collections. Direct taxes were higher on account of additional collection under Vivaad se Vishwas scheme and lower refund of taxes. Indirect taxes also remain buoyant on back of duties from auto fuels, better GST collection and higher import duties. Non- Tax receipt jumped on receipt of RBI’s dividend of INR 991 billion (Last year: Nil in first two months). Total expenditure rose, led by increase in capital spend but was partially offset by lower revenue spend on account of cost control and higher spend in last year due to front loading under PM-KISAN Yojana and MNREGA spending.
FYTDending May-19 May-20 May-21 Change(YoY)
2YR CAGR
Gross tax revenue 2,146 1,261 3,127 147.9% 20.7%Total Direct Tax 617 527 1,188 125.5% 38.8%Total Indirect Tax 1,529 734 1,938 164.1% 12.6%Less: Share of States & others 992 923 791 -14.3% -10.7%
Net Tax collection 1,153 339 2,336 590.0% 42.3%Non- Tax Revenue 284 108 1,164 976.2% 102.4%Total Revenue Receipts 1,438 447 3,500 683.5% 56.0%Total Capital Receipts 31 8 48 478.8% 25.2%Total Receipts 1,468 455 3,548 679.8% 55.4%
Total Revenue Expenditures 4,653 4,566 4,150 -9.1% -5.6%Total Capital Expenditures 477 552 630 14.0% 14.9%Total Expenditures 5,130 5,118 4,780 -6.6% -3.5%
GrossFiscalDeficit -3,662 -4,663 -1,232 -73.6% -42.0%FiscalDeficitas%ofBE 52.0% 58.6% 8.2%
Risk of fiscal slippage in FY22 appears low, despite recent announcements of fiscal stimulus to support the economy. This is because government was conservative in preparing the budget estimates for FY22. Revenues are expected to be higher than budget estimates provided there is no significant deterioration of economic activity from hereon. Further, there is reasonable cushion available on expenditure side too as government cleared the Food Corporation of India’s due on account of food subsidy (INR 550 billion) in FY21, which was earlier planned to be paid in FY22. RetailInflationjumpsunexpectedlyinMay2021,likelytoremainatelevatedlevelin near term: May 2021 CPI came in at 6.3%, ~100 bps higher than the consensus estimates. The rise was broad based with most components registering a sharp increase. Food prices witnessed a sharp increase especially in pulses, edible oil, fruits and protein items like egg, meat, fish etc. Fuel & light increased owing to adverse base effect and increase in crude oil and its derivatives. Core CPI also inched up sharply on account of broad based increase in prices of clothing, footwear, health care, recreation, personal and household goods and services. While the reasons for increase are debatable, few components of CPI are likely to

4 June 2021
have witnessed increase due to supply side disruptions, base effects and lower data collection on account of lockdowns.
YoY,% Apr-21 May-21 Changein%CPI 4.2 6.3 2.1Food & beverages 2.6 5.2 2.6Fuel and Light 8.0 11.6 3.6Housing 3.7 3.9 0.1Core CPI@ 5.3 6.6 1.3
Source: CMIE; @-CPI excluding food, fuel, transportation & housing
CPI is likely to remain at elevated level in near term and there are risks of it breaching the RBI's forecasts. Further, the faster recovery in demand, supply chain disruption, rise in international commodity prices, etc. can also keep CPI at elevated levels. Government steps like reducing import duties on palm oil, allowing free imports of pulses, imposed stock limits on pulses on millers, wholesalers, retailers, etc. should bring some relief.
WPIinchesupinMay2021,likelytomoderategoingforward: WPI inflation rose to 12.9% in May 2021, up from 10.5% in April 2021 and -3.4% in May 2020. While a large part of increase was on account of adverse base effect, sequential momentum of WPI remained strong too. The food prices took a breather after rising over the past few months. Other than base effect, higher fuel prices on account of increase in crude oil prices, higher manufacturing goods inflation driven by sharp rise in Input prices like those of metals, rubber, textiles, chemicals, furniture, etc. also contributed to rise.
YoY,% Apr-21 May-21 Change(%)WPI 10.5 12.9 2.4
Primary articles 10.2 9.6 -0.5Food articles 4.9 4.3 -0.6Crude petroleum and gas 79.6 56.1 -23.5
Fuel and power 20.9 37.6 16.7Mineral oils 45.3 81.2 35.8Electricity -2.5 5.8 8.3
Manufactured products 9.0 10.8 1.8Core WPI (WPI ex food and fuel) 8.5 10.6 2.1
Source: CMIE
WPI is likely to moderate sequentially over medium term as the base effect fades, however, given the higher international commodity prices it is likely to remain at elevated levels in near term.
TradeDeficitwidens, likely tonormalise as the economic activitynormalises: Lowering of Covid related restrictions resulted in trade deficit inching up to USD 9.4 billion in June 2021 after a sharp fall in May 2021 to USD 6.3 billion. Bulk of the widening of trade deficit was caused by higher Oil and gold imports. The Non-Oil Non Gold (NONG) exports remained resilient and rose ~7% m-o-m supported by buoyant global trade and higher prices. The increase in exports was led by higher exports of engineering goods and chemicals. On the other hand, NONG imports also inched up driven by higher imports of electronic goods, pharma, fertilisers and metal products.
AmountinUSDbillion May-21 Jun-21# ChangeTrade Deficit / (Surplus) 6.3 9.4 -3.1
Net Oil imports 4.1 6.7 -2.6Net Gold imports* 0.0 0.7 -0.7Deficit ex of oil and gold 2.2 1.9 0.3
Source: CMIE, Ministry of Commerce; # - preliminary data, * includes net imports of gold, silver and precious stones adjusted for gems and jewellery exports;
The trade deficit is likely to widen further as the Covid restrictions are lifted and aggregate demand improves. Current account surplus in FY21, is expected to turn into deficit again in FY22 but within a reasonable range. Outlook of Balance of Payment remains comfortable as capital inflows can remain robust owing to ample global liquidity.
Commodityprices continue to trendhigher:Global commodity prices showed a mixed trend during the month wherein crude oil prices, aluminium and lead prices rose further while Steel, Zinc and Copper moderated from the peak seen in past couple of months. Oil prices rose by over 8% owing to sharp rise in demand forecasts on the back of strong global recovery especially in US and Europe. Further, the supply constraints imposed by OPEC+ also supported the prices. Decline in metal prices was primarily due to announcement by Chinese authorities to release metals from its national reserves to cool down prices. Gold prices have fallen largely driven by a hawkish tilt from the US Federal Reserve and a strengthening USD.
Change Market price (USD)* Jun-21 (m-o-m) FYTD22^Brent Crude (Per barrel) 75.1 8.4 18.2Gold (per ounce) 1,770 (7.2) 3.7Steel (per tonne) 915 (2.1) 20.4Zinc (per tonne) 2,946 (3.1) 5.4Copper (per tonne) 9,385 (7.6) 6.0Aluminium (per tonne) 2,510 2.1 14.7Lead (per tonne) 2,320 5.0 18.6
Source: Bloomberg; *Market prices as on June 30, 2021; ̂ change in prices in FY22, m-o-m- Month on Month
Summary and Conclusion
While the surge in Covid-19 cases was steep in the second wave, the economic impact of the same has been substantially lower than the first wave. While recovery momentum faced some headwinds in past couple of months, we expect the situation to improve supported by drop in number of Covid-19 cases, easing restrictions and pent up demand. Further, a substantial proportion of population will be vaccinated in India by end of this year which is likely to support the rebound. June 2021 month saw a reasonable improvement in activity from May 2021, although it was still below levels seen in H2FY21. For FY 21-22, we expect a muted impact on overall economic activity if there are no further shocks on account of Covid-19. The rebound should also be aided by accommodative monetary policy and Central Government’s thrust on capital spending. Further, focussed policy measures to support Covid-19 impacted sectors should also cushion the impact. To summarise, we remain optimistic on growth outlook in FY22 on back of favourable base effect, supportive fiscal and monetary policy and buoyant global environment. Further, external position remains supportive with likelihood of moderate CAD, capital inflows and comfortable forex reserves.
Equity Market Update
Indian equities moved within a range during the month and NIFTY 50 ended ~1% up compared to last month. Equity movement were guided by recovery in growth, receding of 2nd wave in India, strong Q4FY21 results, elevated commodity prices, etc. This was partially offset by higher than expected inflation print in US, intermittent concerns over premature tapering of bond purchases by US Fed, rise in oil prices, etc. Midcaps and Smallcaps outperformed the largecaps during the month. Sectoral performance was mixed as Information Technology, Healthcare, Consumer staples and Capital goods delivered positive returns while Banking, Power and Oil & Gas ended the month in negative.
Global equities performance was mixed with most major indices in US and Europe ending the month in positive while in Asian markets like Japan, China, Hongkong etc. delivering a negative return. The tables below give the details of performance of key domestic and global indices.
%ChangeinIndices Jun-21 FYTD22^S&P BSE India Auto 1.0 6.8 S&P BSE India Bankex (2.5) 4.8 S&P BSE India Capital Goods 2.0 8.8 S&P BSE India FMCG 2.9 5.0 S&P BSE India Healthcare 4.3 20.0 S&P BSE India Metal (1.1) 30.1 S&P BSE India Power (2.2) 11.3 S&P BSE India Oil & Gas (1.8) 9.1 S&P BSE India IT 9.2 13.5 S&P BSE SENSEX 1.0 6.0NIFTY50 0.9 7.0NIFTY Midcap 100 4.6 13.8NIFTY Smallcap 5.0 20.0
%Change Jun-21 FYTD22^S&P 500 2.2 8.2 FTSE 0.2 4.8 DAX 0.7 3.5 CAC 0.9 7.3 Nikkei (0.2) (1.3)Hang Seng (1.1) 1.6 KOSPI 2.9 7.7 Shanghai (0.7) 4.3 MSCI Emerging Market Index (0.1) 4.4
^ returns for FY22
FPIs bought net equity worth USD 2.4 billion in June 2021 as compared net seller of USD 0.4 billion a month ago. On a cumulative basis, FPIs has bought net equity of USD 0.6 billion in Q1FY22 vis-à-vis USD 3.9 billion in Q1FY21.
Domestic equity oriented mutual funds registered net inflows of INR 11,845 crore in May 2021 compared with a net inflows of INR 4,221 crore a month ago. In first 2 months of FY22, domestic mutual funds have recorded net inflows of over INR 16,000 crores compared to net inflows of ~INR 9,000 crores last year.
In general, the corporate profitability in Q4FY21 was strong aided by good demand recovery, rise in realisation, cost rationalisation, etc. Specifically, lower provisioning in banks, improvement in execution in Infrastructure, higher spreads in metals, etc. supported earnings. Q4FY21 results of sectors like Auto, Banks, Chemicals and Metals were better than expected whereas of Utilities, NBFCs, Infrastructure and capital goods were largely in line with expectations. Results of Consumer staples, consumer durables and Pharma sectors were relatively below expectations.
MarketrallybecomesbroadbasedinCY21: NIFTY 50 in last 12 months or so has seen significant rally after bottoming out in March. While from the low base the rally seems sharp one should view it in the context that NIFTY 50 returns in last 10 and 15 years are largely
Market Review Contd...
Market Review continued on next page
Source for various data points: Bloomberg, NSDL, CMIE, RBI, Kotak Institutional Research, Worldometers.info, World Bank, Daily valuation provided by ICRA/CRISIL.

June 2021 5
in line with nominal GDP growth during that period. Another important aspect to be noted is that movement in NIFTY 50 has been relatively concentrated during CY18-CY20 with top 5 stocks accounting for bulk of the returns. However, the rally became broad based in CY21 with share of top 5 stocks in returns dropping in H1CY21 (refer table below). Further, the broader market also outperformed NIFTY 50 in CY21 supported by outperformance in midcaps and small caps (refer chart below).
CY NIFTY50Returns
Top5contributors CY NIFTY50
ReturnsTop5
contributors2005 39.1 48.9 2014 33.4 38.82006 46.2 45.8 2015 (2.8) n.a.2007 57.1 47.7 2016 4.5 72.82008 (51.2) n.a. 2017 30.3 48.42009 77.9 38.1 2018 4.6 152.22010 19.5 53.5 2019 13.5 81.32011 (23.6) n.a. 2020 16.1 81.72012 29.9 49.8 H12021 13.2 43.02013 8.5 102.3
n.a. – not applicable
57 0%
59.0%
61.0%
63.0%
65.0%NIFTY Market Cap to Total Market Capitalisation Average
450 %
47.0%
49.0%
51.0%
53.0%
55.0%
57.0%
59.0%
61.0%
63.0%
65.0%NIFTY Market Cap to Total Market Capitalisation Average
Broad Market outperforming NIFTY
outperforming
45.0%
47.0%
49.0%
51.0%
53.0%
55.0%
57.0%
59.0%
61.0%
63.0%
65.0%NIFTY Market Cap to Total Market Capitalisation Average
Broad Market outperforming NIFTY
outperforming
Jun-04
Jun-05
Jun-06
Jun-07
Jun-08
Jun-09
Jun-10
Jun-11
Jun-12
Jun-13
Jun-14
Jun-15
Jun-16
Jun-17
Jun-18
Jun-19
Jun-20
Jun-21
Source: Bloomberg
While rally has become broad based recently, there is still considerable divergence in valuations across sectors compared to their long term averages. The same has been presented in the table below:
PriceToEarnings Price to BookCurrent# LTA Discount /
Premium^ Current# LTA Discount / Premium^
Auto 24.1 16.6 45.0 3.1 2.8 10.0Consumer staples* 56.3 41.4 36.2 12.1 15.0 -19.7Consumer Discretionary 70.2 44.6 57.3 15.8 10.5 50.7Oil and gas 14.2 11.3 25.9 1.4 1.4 2.5Cement 31.2 23.2 34.4 3.2 2.5 25.4IT services 27.1 18.0 50.1 7.5 4.5 65.1Pharma 27.7 22.7 21.9 3.9 4.0 -2.3Private Banks 2.7 2.5 5.4 2.6 2.5 4.8Metals 8.0 10.2 -21.9 1.7 1.5 12.9Tobacco 15.5 24.0 -35.5 3.9 6.9 -43.7PSU Banks 10.2 11.9 -14.5 1.0 1.1 -4.9Electric utilities 8.6 10.6 -18.9 1.0 1.1 -6.9
# - as on 30 June 2021. *ex tobacco; ̂ to Long term (LT) average. Cells in green are sectors which are trading at premium while in red are ones which are trading at discount relative to long term average. All are figures are calculated based on 12 months forward estimates.Source: Kotak Institutional Equities. Stocks are part of Kotak Institutional Equities universe. Oil & Gas PE valuations are high due to one company. Excluding that company, the multiple for Oil & Gas stood at 7x vs 10 year average of 9x.
2nd Wave and Equity markets: The resurgence in Covid cases over the past quarter has had minimal impact on equity market performance. Interestingly, NIFTY 50 has risen by ~7% since end-March 2021 despite strict lockdowns imposed by most states. This is probably because of multiple reasons. Firstly, the impact of manufacturing and goods mobility was relatively lower compared to first wave as the lockdowns were more localised. Further, firms were better geared to adapt to Covid protocols during the 2nd wave. More importantly, bearing of lockdowns on corporate earnings is likely to be limited and that too transitory on bulk of sectors in NIFTY 50. This is also reflected in the broad based earnings revisions and upgrades in NIFTY 50 earnings (refer adjacent chart) since the downgrades seen post lockdown in Q1FY21.
Broad Based Earnings Upgrade
Source: Kotak Institutional Equities
Specifically, impact on FMCG / Pharma / Telecom / Utilities / IT etc. is likely to be limited. Further, global cyclical sectors like metals, oil & gas, etc. are not materially impacted due to local conditions. Additionally, large players in financial services stand to gain from lower provisioning costs, competitive technology leading to cost savings and possible increase in market share. While sectors like Auto and other discretionary spends might get impacted but their weights in NIFTY 50 are relatively low. Interestingly, global experiences of equities in US, UK, Eurozone, etc. during the 2nd and 3rd wave was also similar and impact on equities was limited.
Outlook
As on 30 June 2021, NIFTY 50 was trading near 19.3x FY23E price to earnings ratio. In our view, these are reasonable multiples, especially given the low interest rate environment and healthy earnings growth. Further, the gap between 10Y Gsec and 1YForward NIFTY 50 Earning yield* stood at 1.4, below its 10-year average of 1.7. *Earning yield = 1/(one year forward P/E).
10Y GSec and NIFTY Earning Yield
-2.0
2.0
6.0
10.0
Jun-
11
Jun-
12
Jun-
13
Jun-
14
Jun-
15
Jun-
16
Jun-
17
Jun-
18
Jun-
19
Jun-
20
Jun-
21
(%) Gap
Earnings yields (%)India 10-y G-Sec yields (%)
Source: Kotak Institutional Equities
Further, though NIFTY 50 is trading near all-time highs, if one views the 10 year CAGR of NIFTY 50, returns are largely similar to growth in India’s nominal GDP.
In view of the above, in our opinion, markets hold promise over the medium to long term and there is still good value in select pockets of the market. Improvement in corporate profitability, fall in Covid-19 cases and relaxations in restrictions, easy financial conditions and low cost of capital, comfortable external sector, supportive monetary and fiscal measures, etc. also bode well for equities.
Thus, there is merit in increasing allocation to equities in a phased manner or in staying invested with a medium to long term view and in line with individual risk appetite. Resurgence of spread of Covid-19, premature unwinding of fiscal and monetary stimulus, higher than expected NPAs, etc. are key risks in the near term.
Market Review Contd...
Market Review continued on next page
Source for various data points: Bloomberg, NSDL, CMIE, RBI, Kotak Institutional Research, Worldometers.info, World Bank, Daily valuation provided by ICRA/CRISIL.

6 June 2021
Market Review Contd...
Source for various data points: Bloomberg, NSDL, CMIE, RBI, Kotak Institutional Research, Worldometers.info, World Bank, Daily valuation provided by ICRA/CRISIL.
Debt Market Update
The fixed income markets traded within a narrow range in June 2021 with 10-year Gsec yields ending the month at 6.05%, up 3 bps compared to May 2021. The movement in yields was influenced by dovish commentary of RBI and announcement of G-SAP 2.0 of INR 1.2 lakh crore, range bound movement in treasury yields, etc. While the CPI came in higher than expected and oil prices also continue to inch up, the impact on the 10Y yield was relatively lower on account of continuous RBI intervention. The table below gives a summary view of movement of key rates and liquidity.
May-21 Jun-21 Change(%)
10Yr Benchmark G-Sec Yield^ (%) 6.02 6.05 0.03AAA 10Year Corporate Bond Yields#, & (%) 6.81 6.88 0.07AAA 10Y corporate bond spread against 10Y benchmark@ (bps) 79 83 0.04
Average net liquidity absorbed / (infused) by RBI* (INR billion) (approx.) 4,628 4,788 3.5
MIBOR Overnight Rate (%) 3.39 3.36 -0.03^ - bi-annual yield; # - annualised yield; & - Average yield of 6.49% NABARD maturing on 30-Dec-2030 provided by Independent valuation agencies has been taken. @ - Spreads calculated by subtracting non-annualised Gsec yields from annualised corporate bond yields. * - Average net daily liquidity infused / absorbed through Liquidity Adjustment Facility, exports refinance, marginal standing facility and term repos/reverse repos.
Average net interbank liquidity surplus was relatively stable compared to last month despite being a seasonally weak month (due to payment of advance taxes). This was supported by liquidity infusion by RBI through G-SAP 1.0 for forex purchases by RBI.
Net FPI flows in debt turned negative to USD 0.5 billion during the month from being marginally positive (USD 34 million only) in May 2021. Cumulatively in Q1FY22, FPIs net outflows into debt stood at USD 0.2 billion compared to net outflows of USD3.7 billion during Q1FY21.
Outlook
The MPC minutes released by RBI for its June 2021 meeting were largely in line with expectations. Most of the members expressed concerns over GDP growth owing to resurgence of 2nd wave of Covid-19. The members also expressed their concerns on higher than expected Inflation prints, however, they acknowledged that the current spike is attributed largely to supply side disruption and hence can be transitory as aggregate demand conditions remains weak.
Since early 2021, overall environment has turned adverse towards yields. Rise in crude prices, surge in 10Y US treasury yields, higher than anticipated government borrowings, elevated CPI and Core CPI, etc. are likely to sustain and keep upward pressure on yields especially at the longer end. Additionally, high SLR holding of banks and signs of improvement in economic activity can also push yields higher. Further, with June 2021 inflation print surprising on the upside can result in RBI deliberating on calibrated withdrawal of liquidity (through VRRR, raising reverse repo, etc.) which can put pressure on risks to shorter end of the curve as well and thus, reducing the term premia to a certain extent.
To counter these factors, RBI has proactively kept liquidity in large surplus and kept benign financial conditions. Further, it has also often intervened through unconventional tools like LTRO, TLTROs, G-SAP, OMOs, Operation TWIST, etc. These measures have been effective and it has been able to stall the rise of 10Y Gsec yields despite multiple adverse factors. The dovish commentary and future guidance coupled with systematic liquidity infusion done by RBI indicates that these interventions will continue in near future. This should keep yields from rising sharply especially at the medium to longer end. Further, comfortable external position, muted credit growth, ample global and domestic liquidity, weakness in growth due to 2nd wave of Covid-19, etc. can also cap sharp rise in yields.
In view of the above, we expect yields to trade with a marginal upward bias at the medium to longer end of the curve while yields at the shorter end of the curve can rise at a faster pace. Thus, we continue to recommend investments into short to medium duration debt funds, preferably, in a staggered manner in line with individual risk appetite.
Spread of AA over AAA Corporate bonds
Long Term Average spread of AA over AAA over 10 years
Credit environment still warrants caution, measures undertaken by RBI so far have eased the spreads on AAA rated bonds significantly but opportunities continue to exist in select pockets of non-AAA rated bonds as credit spreads are still trading at attractive levels. Hence, allocation to credit oriented schemes or funds with some non-AAA exposure can be maintained / increased in a phased manner, in line with individual risk appetite.
GLOSSARYCPI Consumer Price IndexFPI Foreign Portfolio InvestmentGDP Gross Domestic ProductG-SAP Government Securities Acquisition ProgrammeIMPS Immediate Payment SystemLCV Light Commercial VehicleLTRO Long Term Repo OperationMHCV Medium and Heavy Commercial VehicleM-o-M Month on MonthMNREGA Mahatma Gandhi National Rural Employment Guarantee ActMPC Monetary Policy CommitteeNBFC Non-Banking Financial CompanyNPA Non-Performing AssetsOMO Open Market OperationOPEC Organisation of the Petroleum Exporting CountriesPMI Purchasing Managers’ IndexPSU Public Sector UndertakingPV Passenger VehicleSLR Statutory Liquidity RatioTLTRO Targeted Long Term Repo OperationVRRR Variable Rate Reverse RepoWPI Wholesale Price IndexY-o-Y Year on Year

7 June 2021
CONTENTS
PAGE NO.
WEALTH CREATION
HDFC Flexi Cap Fund ......................................................................... 8
HDFC Capital Builder Value Fund ........................................................ 9
HDFC Top 100 Fund ........................................................................... 10
HDFC Mid-Cap Opportunities Fund ..................................................... 11
HDFC Small Cap Fund ........................................................................ 12
HDFC Large and Mid Cap Fund (erstwhile HDFC Growth Opportunities Fund) ...................................... 13
HDFC Focused 30 Fund ...................................................................... 14
HDFC Infrastructure Fund .................................................................. 15
HDFC Balanced Advantage Fund ........................................................ 16-17
HDFC Hybrid Equity Fund ................................................................... 18-19
HDFC Multi-Asset Fund ...................................................................... 20-21
HDFC NIFTY 50 ETF ............................................................................ 22
HDFC Index Fund - NIFTY 50 Plan ....................................................... 23
HDFC SENSEx ETF .............................................................................. 24
HDFC Index Fund - SeNSex Plan ......................................................... 25
HDFC Gold ETF .................................................................................. 62
HDFC Gold Fund ................................................................................ 63
HDFC Banking ETF ............................................................................. 64
HDFC Dividend Yield Fund ................................................................. 65
HDFC Housing Opportunities Fund ..................................................... 66
HDFC Asset Allocator Fund of Funds ................................................... 67
TAx SAVINGS
HDFC Taxsaver .................................................................................. 26
RETIREMENT PLANNING
HDFC Retirement Savings Fund - Equity Plan ....................................... 29
HDFC Retirement Savings Fund - Hybrid Equity Plan ............................ 30-31
HDFC Retirement Savings Fund - Hybrid Debt Plan .............................. 32
PAGE NO.
CHILDREN'S FUTURE
HDFC Children’s Gift Fund ................................................................. 27-28
REGULAR INCOME
HDFC Equity Savings Fund ................................................................. 33-34
HDFC Hybrid Debt Fund ..................................................................... 35-36
HDFC Arbitrage Fund ......................................................................... 37-38
HDFC Corporate Bond Fund ............................................................... 39-40
HDFC Credit Risk Debt Fund ............................................................... 41-42
HDFC Banking and PSU Debt Fund ..................................................... 43-44
HDFC Gilt Fund.................................................................................. 45
HDFC Dynamic Debt Fund .................................................................. 46
HDFC Income Fund ........................................................................... 47
HDFC Medium Term Debt Fund .......................................................... 48-49
HDFC Short Term Debt Fund .............................................................. 50-51
HDFC Low Duration Fund ................................................................... 52-53
HDFC Money Market Fund ................................................................. 54
HDFC Floating Rate Debt Fund ........................................................... 55-56
HDFC Ultra Short Term Fund .............................................................. 57-58
HDFC Liquid Fund .............................................................................. 59-60
HDFC Overnight Fund ........................................................................ 61
Performance details of schemes managed by respective fund managers ............................................. 68
Scheme performance summary - Regular Plans ................................. 69-72
Scheme performance summary - Direct Plans .................................... 73-80
Performance of Permitted Category FPI Portfolio ............................... 80
Dividend History ............................................................................... 81-82
Disclaimer ....................................................................................... 83
GOAL BASED SOLUTIONS
WEALTH CREATION These schemes aim to increase wealth over the long term by investing predominantly in equity instruments and are suitable for investors with high risk appetite and relatively higher investment horizon.
TAx SAVINGS This scheme is eligible to provide tax deduction under Section 80C and also aims to increase wealth over the long term. This is an ideal solution for investors who would like to create wealth and save tax.
CHILDREN'S FUTURE This scheme aims to help you achieve your specific financial goal of planning for child’s future expenses like higher education, etc.
RETIREMENT PLANNING These schemes aim to help you achieve your specific financial goal of retirement planning.
REGULAR INCOME These schemes aim to provide stable income and are ideal for investors with low to medium risk appetite who wish to receive regular income to meet their periodic expenses.
Disclaimer: Investors are requested to note that the above goal based solutions should not be construed as financial planning solution/recommendation by the Fund/AMC. It does not in any manner, indicate or imply either the quality of any particular Scheme or guarantee any specific performance/returns. Such solutions must be tailored to investor’s individual situation and objectives and therefore, investors should consult their financial advisors to ascertain whether a product is suitable for them.

June 2021 8
SIP PERFORMANCE ^ - Regular Plan - Growth OptionSince Inception
SIP15 year
SIP10 year
SIP5 year
SIP3 year
SIP1 year
SIPTotal Amount Invested (` ‘000) 3,180.00 1,800.00 1,200.00 600.00 360.00 120.00 Mkt Value As on June 30, 2021 (` ‘000) 96,914.56 5,623.01 2,534.75 886.17 504.50 158.79 Returns (%) 20.90 13.94 14.31 15.61 23.24 65.40 Benchmark Returns (%) # 15.11 13.24 15.18 17.53 25.01 54.41 Additional Benchmark Returns (%) ## 13.98 12.71 14.36 17.15 22.62 46.03
Assuming ` 10,000 invested systematically on the first Business Day of every month over a period of time. CAGR returns are computed after accounting for the cash flow by using xIRR method (investment internal rate of return) for Regular Plan - Growth Option. The above investment simulation is for illustrative purposes only and should not be construed as a promise on minimum returns and safeguard of capital.
Face Value per Unit: ` 10 unless otherwise specified, + Industry Classification as recommended by AMFI, Data is as of June 30, 2021 unless otherwise specified.
PERFORMANCE ^ - Regular Plan - Growth OptionDate Period Scheme
Returns (%)
Benchmark Returns
(%)#
Additional Benchmark
Returns (%) ##
Value of ` 10,000 investedScheme (`) Benchmark
(`)#Additional
Benchmark (`)##
Jun 30, 20 Last 1 Year 66.01 60.77 54.58 16,601 16,077 15,458Jun 29, 18 Last 3 Years 14.43 15.00 15.00 14,993 15,220 15,220Jun 30, 16 Last 5 Years 14.01 15.40 15.08 19,273 20,473 20,191Jan 01, 95 Since Inception 18.43 12.08 11.51 886,778 205,522 179,553
Returns greater than 1 year period are compounded annualized (CAGR). N.A. Not Available. For performance of other schemes managed by Prashant Jain, please refer page 68. Different plans viz. Regular Plan and Direct Plan have a different expense structure. The expenses of the Direct Plan under the Scheme will be lower to the extent of the distribution expenses / commission charged in the Regular Plan. As NIFTY 50 TRI data is not available since inception of the scheme, additional benchmark performance is calculated using composite CAGR of NIFTY 50 PRI values from January 1, 1995 to June 29, 1999 and TRI values since June 30, 1999. For Performance of Direct Plan, refer page no. 73. For FPI Portfolio, refer page no. 80.
This product is suitable for investors who are seeking ~
l to generate long-term capital appreciation / income
l investment predominantly in equity & equity related instruments
VeryHigh
Low to
Moderate
Low
Moderate ModeratelyHigh High
RISKOMETERInvestors understand that their principal will be at
very high risk
~ Investors should consult their financial advisers, if in doubt about whether the product is suitable for them. ^Past performance may or may not be sustained in the future. Since Inception Date = Date of First allotment in the Scheme / Plan.
Load is not taken into consideration for computation of performance.
(An open ended dynamic equity scheme investingacross large cap, mid cap, small cap stocks)
Company Industry+ % to NAVEqUITY & EqUITY RELATED
• State Bank of India Banks 9.94• ICICI Bank Ltd. Banks 7.69• Infosys Ltd. Software 6.27• Larsen and Toubro Ltd. Construction Project 5.48• NTPC Ltd. Power 5.26• Coal India Ltd. Minerals/Mining 4.31• Reliance Industries Ltd. Petroleum Products 3.85• Axis Bank Ltd. Banks 3.66• ITC Ltd. Consumer Non Durables 3.66• Power Finance Corporation Ltd. Finance 3.18Bharti Airtel Ltd. Telecom - Services 3.09ReC Ltd. Finance 2.89Lupin Ltd. Pharmaceuticals 2.82HDFC Bank Ltd. Banks 2.75Sun Pharmaceutical Industries Ltd. Pharmaceuticals 2.43Tata Motors Ltd. Auto 2.10Bharat Petroleum Corporation Ltd. Petroleum Products 2.09CeSC Ltd. Power 1.60Bank of Baroda Banks 1.45Power Grid Corporation of India Ltd. Power 1.26Hindustan Petroleum Corporation Ltd. Petroleum Products 1.19Cipla Ltd. Pharmaceuticals 1.16Kalpataru Power Transmission Ltd. Power 1.11SBI Life Insurance Company Ltd. Insurance 1.09Hindustan Aeronautics Ltd. Aerospace & Defense 1.07Indian Railways Finance Corporation Ltd. Finance 1.07GAIL (India) Ltd. Gas 1.04Bharat Dynamics Ltd. Aerospace & Defense 0.99Max Healthcare Institute Ltd. Healthcare Services 0.98Aurobindo Pharma Ltd. Pharmaceuticals 0.96BeML Ltd. Industrial Capital Goods 0.96Varroc engineering Ltd. Auto Ancillaries 0.92SBI Cards and Payment Services Ltd. Finance 0.91CG Power and Industrial Solutions Ltd. Industrial Capital Goods 0.87HCL Technologies Ltd. Software 0.85ABB India Ltd. Industrial Capital Goods 0.80Cummins India Ltd. Industrial Products 0.74Praj Industries Ltd. Industrial Capital Goods 0.74Mahindra & Mahindra Ltd. Auto 0.72Tata Communications Ltd. Telecom - Services 0.72
Company Industry+ % to NAVOil & Natural Gas Corporation Ltd. Oil 0.67Bajaj Auto Ltd. Auto 0.65Wipro Ltd. Software 0.62SKF India Ltd. Industrial Products 0.51Maruti Suzuki India Ltd. Auto 0.49WABCO India Ltd. Auto Ancillaries 0.41Ramco Systems Ltd. Software 0.38Time Technoplast Ltd. Industrial Products 0.34Bharat electronics Ltd. Aerospace & Defense 0.26Hindustan Construction Company Ltd. Construction Project 0.20Simplex Infrastructures Ltd. Construction 0.09Sub Total 99.29Preference SharesZee entertainment enterprises Ltd. entertainment @Sub Total @Total 99.29Cash, Cash equivalents and Net Current Assets 0.71Grand Total 100.00• Top Ten Holdings, @ Less than 0.01%
PORTFOLIO
Industry Allocation of Equity Holding (% of Net Assets)
0.090.670.981.041.091.331.592.323.373.663.813.964.31
5.687.137.378.058.129.23
25.49
0 5 10 15 20 25 30
ConstructionOil
Healthcare ServicesGas
InsuranceAuto Ancillaries
Industrial ProductsAerospace & Defense
Industrial Capital GoodsConsumer Non Durables
Telecom - Services
AutoMinerals/Mining
Construction ProjectPetroleum Products
PharmaceuticalsFinance
SoftwarePowerBanks
KEY FACTS
INVESTMENT OBJECTIVETo generate capital appreciation / income from a portfolio, predominantly invested in equity & equity related instruments.There is no assurance that the investment objective of the Scheme will be realized.
FUND MANAGER § ¥
Prashant Jain (since June 20, 2003)
Total Experience: Over 27 years
INCEPTION DATE (Date of Allotment)January 1, 1995
NAV (AS ON JUNE 30, 2021) NAV PER UNIT (`)Regular Plan - Growth Option 886.778Regular Plan - IDCW Option 52.314Direct Plan - Growth Option 944.096Direct Plan - IDCW Option 58.124
ASSETS UNDER MANAGEMENT (`) IN CROREAs on June 30, 2021 25,493.82Average for Month of June 2021 25,599.42
qUANTITATIVE DATAPortfolio Turnover Ratio (Last 1 year) 35.92%Risk Ration Standard Deviation 7.316%n Beta 1.062n Sharpe Ratio* 0.154Computed for the 3-yr period ended June 30, 2021. Based on month-end NAV. * Risk free rate: 3.36%(Source: FIMMDA MIBOR)
TOTAL ExPENSE RATIO (As on June 30, 2021)Including Additional expenses and Goods and Service Tax on Management FeesRegular: 1.74% Direct: 1.13%
#BENCHMARK INDEx: NIFTY 500 (Total Returns Index)##ADDL. BENCHMARK INDEx: NIFTY 50 (Total Returns Index)
ExIT LOADl In respect of each purchase / switch-in of Units, an Exit Load
of 1.00% is payable if Units are redeemed / switched-out within 1 year from the date of allotment.
l No Exit Load is payable if Units are redeemed / switched-out after 1 year from the date of allotment.
For further details, please refer to para ‘Exit Load’ on Pg 68.
PLANS & OPTIONSRegular Plan, Direct Plan. Under Each Plan: Growth & Income Distribution cum Capital Withdrawal (IDCW) Option. The IDCW Option offers following Sub-Options: Payout of Income Distribution cum Capital Withdrawal (IDCW) Option; and Re-investment of Income Distribution cum Capital Withdrawal (IDCW) Option.
MINIMUM APPLICATION AMOUNTPurchase : ` 5,000 and any amount thereafter.Additional Purchase : ` 1,000 and any amount thereafter.
SEGMENT-WISE BREAK-UP OF EqUITY HOLDING (% OF NET ASSETS)Large Cap 78.09%Mid Cap 11.43%Small Cap 9.78%¥ Dedicated Fund Manager for Overseas Investments: Mr. Sankalp Baid (since January 22, 2021) (Total Experience: Over 13 years).
§ Date of migration from Zurich India Mutual Fund (Close of business hours - June 19, 03).
CATEGORY OF SCHEME: FLExI CAP FUND
HDFC Flexi Cap Fund

9 June 2021
Company Industry+ % to NAVEqUITY & EqUITY RELATED• Infosys Ltd. Software 8.82• ICICI Bank Ltd. Banks 8.56• HDFC Bank Ltd. Banks 8.55• Axis Bank Ltd. Banks 5.73• Bharti Airtel Ltd. Telecom - Services 3.57• State Bank of India Banks 3.54• NTPC Ltd. Power 2.43• Larsen and Toubro Ltd. Construction Project 2.23• Sun Pharmaceutical
Industries Ltd. Pharmaceuticals 2.18• HCL Technologies Ltd. Software 1.85Bharat Petroleum Corporation Ltd. Petroleum Products 1.74SBI Life Insurance Company Ltd. Insurance 1.65Tata Steel Ltd. Ferrous Metals 1.61MphasiS Ltd. Software 1.58United Breweries Ltd. Consumer Non Durables 1.51Cipla Ltd. Pharmaceuticals 1.43Godrej Consumer Products Ltd. Consumer Non Durables 1.41Tata Motors Ltd. Auto 1.41Lupin Ltd. Pharmaceuticals 1.39UTI Asset Management Company Ltd. Capital Markets 1.29Housing Development Finance Corporation Ltd.£ Finance 1.24ITC Ltd. Consumer Non Durables 1.24Max Healthcare Institute Ltd. Healthcare Services 1.24Ambuja Cements Ltd. Cement & Cement
Products 1.18Bharat electronics Ltd. Aerospace & Defense 1.12UltraTech Cement Ltd. Cement & Cement
Products 1.12Maruti Suzuki India Ltd. Auto 1.08Tech Mahindra Ltd. Software 1.08United Spirits Ltd. Consumer Non Durables 1.07The Phoenix Mills Ltd. Construction 1.00Radico Khaitan Ltd. Consumer Non Durables 0.98L&T Technology Services Ltd. Software 0.96Bajaj Auto Ltd. Auto 0.95Voltas Ltd. Consumer Durables 0.93Mahindra & Mahindra Ltd. Auto 0.91TCI express Ltd. Transportation 0.89GAIL (India) Ltd. Gas 0.88CeSC Ltd. Power 0.86Ashoka Buildcon Ltd. Construction 0.85Aditya Birla Fashion and Retail Ltd. Retailing 0.84Bosch Ltd. Auto Ancillaries 0.84Dilip Buildcon Ltd. Construction 0.83Hindustan Petroleum Corporation Ltd. Petroleum Products 0.76Cholamandalam Investment & Finance Finance 0.75VIP Industries Ltd. Consumer Durables 0.75Chambal Fertilizers & Chemicals Ltd. Fertilisers 0.74Multi Commodity exchange of India Ltd. Capital Markets 0.74Equitas Small Finance Bank Ltd. Banks 0.71Mishra Dhatu Nigam Ltd. Ferrous Metals 0.68endurance Technologies Ltd. Auto Ancillaries 0.67Muthoot Finance Ltd. Finance 0.67
Company Industry+ % to NAVGujarat Pipavav Port Ltd. Transportation 0.63Bharat Dynamics Ltd. Aerospace & Defense 0.62Central Depository Services (India) Ltd. Capital Markets 0.59Indoco Remedies Ltd. Pharmaceuticals 0.59Petronet LNG Ltd. Gas 0.56Prestige estates Projects Ltd. Construction 0.54Coal India Ltd. Minerals/Mining 0.46Apollo Tyres Ltd. Auto Ancillaries 0.45Bajaj electricals Ltd. Consumer Durables 0.43Varroc engineering Ltd. Auto Ancillaries 0.43Advanced enzyme Technologies Ltd.
Consumer Non Durables 0.38
Inox Leisure Ltd. entertainment 0.38Gabriel India Ltd. Auto Ancillaries 0.26Jamna Auto Industries Ltd. Auto Ancillaries 0.20Sadbhav Infrastructure Project Ltd. (Corporate Guarantee of Sadbhav engineering Ltd.) Construction Project 0.13Sub Total 97.69UNITS ISSUED BY REIT & INVITUNITS ISSUED BY INVITPOWeRGRID Infrastructure Investment Trust Power 0.44Sub Total 0.44Total 0.44Cash, Cash equivalents and Net Current Assets 1.87Grand Total 100.00• Top Ten Holdings, £ Co-sponsor
PORTFOLIO
SIP PERFORMANCE ^ - Regular Plan - Growth Option
Since Inception SIP
15 year SIP
10 year SIP
5 year SIP
3 year SIP
1 year SIP
Total Amount Invested (` ‘000) 3,290.00 1,800.00 1,200.00 600.00 360.00 120.00 Mkt Value As on June 30, 2021 (` ‘000) 57,641.13 5,695.65 2,563.03 855.88 492.01 152.65 Returns (%) 17.13 14.09 14.52 14.20 21.42 54.44 Benchmark Returns (%) # N.A. 13.24 15.18 17.53 25.01 54.41 Additional Benchmark Returns (%) ## 13.65 12.71 14.36 17.15 22.62 46.03
Assuming ` 10,000 invested systematically on the first Business Day of every month over a period of time. CAGR returns are computed after accounting for the cash flow by using xIRR method (investment internal rate of return). The above investment simulation is for illustrative purposes only and should not be construed as a promise on minimum returns and safeguard of capital.
PERFORMANCE ^ - Regular Plan - Growth OptionDate Period Scheme
Returns (%)
Benchmark Returns
(%)#
Additional Benchmark
Returns (%) ##
Value of ` 10,000 invested
Scheme (`) Benchmark (`)#
Additional Benchmark
(`)##Jun 30, 20 Last 1 Year 61.91 60.77 54.58 16,191 16,077 15,458Jun 29, 18 Last 3 Years 10.09 15.00 15.00 13,349 15,220 15,220Jun 30, 16 Last 5 Years 12.98 15.40 15.08 18,416 20,473 20,191Feb 01, 94 Since Inception 14.22 N.A. 10.94 383,876 N.A. 172,596
Returns greater than 1 year period are compounded annualized (CAGR). N.A. Not Available. For performance of other schemes managed by Amit B. Ganatra, please refer page 68. Different plans viz. Regular Plan and Direct Plan have a different expense structure. The expenses of the Direct Plan under the Scheme will be lower to the extent of the distribution expenses / commission charged in the Regular Plan. As NIFTY 50 TRI data is not available since inception of the scheme, additional benchmark performance is calculated using composite CAGR of NIFTY 50 PRI values from February 1, 1994 to June 29, 1999 and TRI values since June 30, 1999. For Performance of Direct Plan, refer page no. 78.
Face Value per Unit: ` 10 unless otherwise specified, + Industry Classification as recommended by AMFI, Data is as of June 30, 2021 unless otherwise specified.
This product is suitable for investors who are seeking ~
l to generate long-term capital appreciation / income in the long term
l investment primarily in undervalued stocks
VeryHigh
Low to
Moderate
Low
Moderate ModeratelyHigh High
RISKOMETERInvestors understand that their principal will be at
very high risk
~ Investors should consult their financial advisers, if in doubt about whether the product is suitable for them. ^Past performance may or may not be sustained in the future. Since Inception Date = Date of First allotment in the Scheme / Plan.
Load is not taken into consideration for computation of performance.
(An open ended equity scheme following a value investment strategy)HDFC Capital Builder Value Fund
Industry Allocation of Equity Holding (% of Net Assets)
0.380.440.460.740.841.241.441.521.651.742.112.292.302.362.502.622.662.853.223.293.574.35
5.596.59
14.2927.09
0 5 10 15 20 25 30Entertainment
Units issued by InvITMinerals/Mining
FertilisersRetailing
Healthcare ServicesGas
TransportationInsurance
Aerospace & DefenseConsumer Durables
Ferrous MetalsCement & Cement Products
Construction ProjectPetroleum Products
Capital MarketsFinance
Auto AncillariesConstruction
PowerTelecom - Services
AutoPharmaceuticals
Consumer Non DurablesSoftware
Banks
KEY FACTS
INVESTMENT OBJECTIVE
To achieve capital appreciation/income in the long term by primarily investing in undervalued stocks.
There is no assurance that the investment objective of the Scheme will be realized.
FUND MANAGER ¥
Amit B. Ganatra (since May 21, 2020)
Total Experience: Over 17 years
INCEPTION DATE (Date of Allotment)
February 1, 1994
NAV (AS ON JUNE 30, 2021) NAV PER UNIT (`)
Regular Plan - Growth Option 383.876Regular Plan - IDCW Option 25.831Direct Plan - Growth Option 413.714Direct Plan - IDCW Option 29.224
ASSETS UNDER MANAGEMENT (`) IN CRORE
As on June 30, 2021 4,870.65Average for Month of June 2021 4,852.45
qUANTITATIVE DATA
Portfolio Turnover Ratio (Last 1 year) 70.34%
Risk Ration Standard Deviation 6.910%n Beta 1.037n Sharpe Ratio* 0.112
Computed for the 3-yr period ended June 30, 2021. Based on month-end NAV. * Risk free rate: 3.36%(Source: FIMMDA MIBOR)
TOTAL ExPENSE RATIO (As on June 30, 2021)Including Additional expenses and Goods and Service Tax on Management Fees
Regular: 2.06% Direct: 1.09%
#BENCHMARK INDEx: NIFTY 500 (Total Returns Index)
##ADDL. BENCHMARK INDEx: NIFTY 50 (Total Returns Index)
ExIT LOAD
l In respect of each purchase / switch-in of Units, an Exit Load of 1.00% is payable if Units are redeemed / switched-out within 1 year from the date of allotment.
l No Exit Load is payable if Units are redeemed / switched-out after 1 year from the date of allotment.
For further details, please refer to para ‘Exit Load’ on Pg 68.
PLANS & OPTIONS
Regular Plan, Direct Plan. Under Each Plan: Growth & Income Distribution cum Capital Withdrawal (IDCW) Option. The IDCW Option offers following Sub-Options: Payout of Income Distribution cum Capital Withdrawal (IDCW) Option; and Re-investment of Income Distribution cum Capital Withdrawal (IDCW) Option.
MINIMUM APPLICATION AMOUNT
Purchase : ` 5,000 and any amount thereafter.Additional Purchase : ` 1,000 and any amount thereafter.
¥ Dedicated Fund Manager for Overseas Investments: Mr. Sankalp Baid (since January 22, 2021) (Total Experience: Over 13 years).
CATEGORY OF SCHEME: VALUE FUND

June 2021 10
CATEGORY OF SCHEME: LARGE-CAP FUND
Face Value per Unit: ` 10 unless otherwise specified, + Industry Classification as recommended by AMFI, Data is as of June 30, 2021 unless otherwise specified.
KEY FACTS
INVESTMENT OBJECTIVETo provide long-term capital appreciation/income by investing predominantly in Large-Cap companies.There is no assurance that the investment objective of the Scheme will be realized.
FUND MANAGER § ¥
Prashant Jain (since June 20, 2003)
Total Experience: Over 27 years
INCEPTION DATE (Date of Allotment)October 11, 1996
NAV (AS ON JUNE 30, 2021) NAV PER UNIT (`)Regular Plan - Growth Option 624.771Regular Plan - IDCW Option 47.515Direct Plan - Growth Option 659.646Direct Plan - IDCW Option 52.043
ASSETS UNDER MANAGEMENT (`) IN CROREAs on June 30, 2021 20,049.52Average for Month of June 2021 20,218.22
qUANTITATIVE DATAPortfolio Turnover Ratio (Last 1 year) 27.55%Risk Ration Standard Deviation 6.732%n Beta 1.027n Sharpe Ratio* 0.141Computed for the 3-yr period ended June 30, 2021. Based on month-end NAV. * Risk free rate: 3.36%(Source: FIMMDA MIBOR)
TOTAL ExPENSE RATIO (As on June 30, 2021)Including Additional expenses and Goods and Service Tax on Management FeesRegular: 1.75% Direct: 1.20%
#BENCHMARK INDEx: NIFTY 100 (Total Returns Index)
##ADDL. BENCHMARK INDEx: S&P BSe SeNSex (Total Returns Index)
ExIT LOADl In respect of each purchase / switch-in of Units, an Exit Load
of 1.00% is payable if Units are redeemed / switched-out within 1 year from the date of allotment.
l No Exit Load is payable if Units are redeemed / switched-out after 1 year from the date of allotment.
For further details, please refer to para ‘Exit Load’ on Pg 68.
PLANS & OPTIONSRegular Plan, Direct Plan. Under Each Plan: Growth & Income Distribution cum Capital Withdrawal (IDCW) Option. The IDCW Option offers following Sub-Options: Payout of Income Distribution cum Capital Withdrawal (IDCW) Option; and Re-investment of Income Distribution cum Capital Withdrawal (IDCW) Option.
MINIMUM APPLICATION AMOUNTPurchase : ` 5,000 and any amount thereafter.Additional Purchase : ` 1,000 and any amount thereafter.
SEGMENT-WISE BREAK-UP OF EqUITY HOLDING (% OF NET ASSETS)Large Cap 92.10%Mid Cap 6.18% Small Cap 0.93%§ Date of migration from Zurich India Mutual Fund (Close
of business hours - June 19, 03).¥ Dedicated Fund Manager for Overseas Investments: Mr. Sankalp Baid (since January 22, 2021) (Total Experience: Over 13 years).
This product is suitable for investors who are seeking ~
l to generate long-term capital appreciation / income
l investment predominantly in Large-Cap companies
VeryHigh
Low to
Moderate
Low
Moderate ModeratelyHigh High
RISKOMETERInvestors understand that their principal will be at
very high risk
~ Investors should consult their financial advisers, if in doubt about whether the product is suitable for them.
SIP PERFORMANCE ^ - Regular Plan - Growth OptionSince Inception
SIP15 year
SIP10 year
SIP5 year
SIP3 year
SIP1 year
SIPTotal Amount Invested (` ‘000) 2,970.00 1,800.00 1,200.00 600.00 360.00 120.00 Mkt Value As on June 30, 2021 (` ‘000) $$ 49,131.20 5,150.67 2,372.35 846.85 478.97 150.93 Returns (%) $$ 18.79 12.92 13.08 13.77 19.49 51.40 Benchmark Returns (%) # N.A. 13.12 14.65 16.83 22.62 46.94 Additional Benchmark Returns (%) ## 14.74 12.86 14.57 17.48 22.01 42.32
Assuming ` 10,000 invested systematically on the first Business Day of every month over a period of time. CAGR returns are computed after accounting for the cash flow by using xIRR method (investment internal rate of return) for Regular Plan - Growth Option. The above investment simulation is for illustrative purposes only and should not be construed as a promise on minimum returns and safeguard of capital.
PERFORMANCE ^ - Regular Plan - Growth OptionDate Period Scheme
Returns (%) $$
Benchmark Returns
(%)#
Additional Benchmark
Returns (%) ##
Value of ` 10,000 investedScheme (`)
$$Benchmark
(`)#Additional
Benchmark (`)##
Jun 30, 20 Last 1 Year 54.89 54.02 52.38 15,489 15,402 15,238Jun 29, 18 Last 3 Years 12.66 14.56 15.32 14,309 15,045 15,350Jun 30, 16 Last 5 Years 13.00 15.08 15.58 18,432 20,189 20,639Oct 11, 96 Since Inception 19.15 N.A. 13.84 761,788 N.A. 246,710
Returns greater than 1 year period are compounded annualized (CAGR). N.A. Not Available. $$ All Dividends declared prior to the splitting of the Scheme into IDCW & Growth Options are assumed to be reinvested in the units of the Scheme at the then prevailing NAV (ex-dividend) NAV). For performance of other schemes managed by Prashant Jain, please refer page 68. Different plans viz. Regular Plan and Direct Plan have a different expense structure. The expenses of the Direct Plan under the Scheme will be lower to the extent of the distribution expenses / commission charged in the Regular Plan. For Performance of Direct Plan, refer page no. 73. For FPI Portfolio, refer page no. 80.
^Past performance may or may not be sustained in the future. Since Inception Date = Date of First allotment in the Scheme / Plan. Load is not taken into consideration for computation of performance.
(An open ended equity scheme predominantly investing in large cap stocks)HDFC Top 100 Fund
Company Industry+ % to NAVEqUITY & EqUITY RELATED• HDFC Bank Ltd. Banks 7.83• ICICI Bank Ltd. Banks 7.09• State Bank of India Banks 6.70• Infosys Ltd. Software 6.61• Reliance Industries Ltd. Petroleum Products 6.18• Housing Development
Finance Corporation Ltd.£ Finance 5.07• NTPC Ltd. Power 3.89• Larsen and Toubro Ltd. Construction Project 3.83• Tata Consultancy Services Ltd. Software 3.64• Axis Bank Ltd. Banks 3.53Coal India Ltd. Minerals/Mining 3.38ITC Ltd. Consumer Non Durables 3.33Bharti Airtel Ltd. Telecom - Services 3.08Lupin Ltd. Pharmaceuticals 2.60Hindustan Petroleum Corporation Ltd. Petroleum Products 2.52Tata Motors Ltd. Auto 2.40Sun Pharmaceutical Industries Ltd. Pharmaceuticals 2.04Power Finance Corporation Ltd. Finance 2.02ReC Ltd. Finance 1.92Bharat Petroleum Corporation Ltd. Petroleum Products 1.87SBI Life Insurance Company Ltd. Insurance 1.36HCL Technologies Ltd. Software 1.34GAIL (India) Ltd. Gas 1.02Maruti Suzuki India Ltd. Auto 0.99Ambuja Cements Ltd. Cement & Cement
Products 0.96CeSC Ltd. Power 0.93Cipla Ltd. Pharmaceuticals 0.90Oil & Natural Gas Corporation Ltd. Oil 0.89Mahindra & Mahindra Ltd. Auto 0.85Dr Reddys Laboratories Ltd. Pharmaceuticals 0.81Power Grid Corporation of India Ltd. Power 0.81Wipro Ltd. Software 0.81Tata Communications Ltd. Telecom - Services 0.80SBI Cards and Payment Services Ltd. Finance 0.77Siemens Ltd. Industrial Capital Goods 0.74Tech Mahindra Ltd. Software 0.73Aurobindo Pharma Ltd. Pharmaceuticals 0.64Bajaj Auto Ltd. Auto 0.64ICICI Prudential Life Insurance Company Ltd. Insurance 0.63Indian Oil Corporation Ltd. Petroleum Products 0.52Hindustan Aeronautics Ltd. Aerospace & Defense 0.37
Company Industry+ % to NAVBank of India Banks 0.33ABB India Ltd. Industrial Capital Goods 0.28Bank of Baroda Banks 0.27Hero MotoCorp Ltd. Auto 0.27InterGlobe Aviation Ltd. Transportation 0.26NHPC Ltd. Power 0.23Bharat electronics Ltd. Aerospace & Defense 0.16Container Corporation of India Ltd. Transportation 0.14Indus Towers Ltd. Telecom - equipment
& Accessories 0.11ICICI Lombard General Insurance Company Ltd. Insurance 0.08LIC Housing Finance Ltd. Finance 0.03Sub Total 99.20Preference SharesZee entertainment enterprises Ltd. entertainment @Sub Total @Total 99.20Cash, Cash equivalents and Net Current Assets 0.80Grand Total 100.00• Top Ten Holdings, £ Co-sponsor, @ Less than 0.01%
PORTFOLIO
Industry Allocation of Equity Holding (% of Net Assets)
0.110.400.530.890.961.021.022.073.333.383.833.885.155.866.99
9.8111.09
13.1325.75
0 5 10 15 20 25 30
Telecom - Equipment & AccessoriesTransportation
Aerospace & DefenseOil
Cement & Cement ProductsGas
Industrial Capital GoodsInsurance
Consumer Non DurablesMinerals/Mining
Construction ProjectTelecom - Services
AutoPower
PharmaceuticalsFinance
Petroleum ProductsSoftware
Banks

11 June 2021
Company Industry+ / Rating % to NAVEqUITY & EqUITY RELATED• Balkrishna Industries Ltd. Auto Ancillaries 5.69• Cholamandalam Investment
& Finance Finance 5.32• Aarti Industries Ltd. Chemicals 4.19• Sundram Fasteners Ltd. Auto Ancillaries 3.87• Bharat Electronics Ltd. Aerospace & Defense 3.70• Max Financial Services Ltd. Insurance 3.49• Atul Ltd. Chemicals 2.89• Crompton Greaves Consumer
electricals Ltd. Consumer Durables 2.78• Ipca Laboratories Ltd. Pharmaceuticals 2.56• Carborundum Universal Ltd. Industrial Products 2.06Tata Consumer Products Ltd. Consumer Non Durables 2.05Indian Hotels Company Ltd. Leisure Services 2.04Persistent Systems Ltd. Software 2.03Supreme Industries Ltd. Industrial Products 1.99City Union Bank Ltd. Banks 1.87Tata Chemicals Ltd. Chemicals 1.85Apollo Tyres Ltd. Auto Ancillaries 1.82Aurobindo Pharma Ltd. Pharmaceuticals 1.78SKF India Ltd. Industrial Products 1.75Tube Investments of India Ltd. Auto Ancillaries 1.74Max Healthcare Institute Ltd. Healthcare Services 1.64Jindal Steel & Power Ltd. Ferrous Metals 1.62Shriram Transport Finance Company Ltd. Finance 1.62Redington (India) Ltd. Trading 1.61AIA engineering Ltd. Industrial Products 1.47KNR Construction Ltd. Construction 1.46Cholamandalam Financial Holdings Ltd. Finance 1.44KeC International Ltd. Power 1.39VST Industries Ltd. Consumer Non Durables 1.29Oracle Financial Services Software Ltd. Software 1.27Glenmark Pharmaceuticals Ltd. Pharmaceuticals 1.26exide Industries Ltd. Auto Ancillaries 1.22The Federal Bank Ltd. Banks 1.20Nippon Life India Asset Management Ltd. Capital Markets 1.19Dilip Buildcon Ltd. Construction 1.17Voltas Ltd. Consumer Durables 1.11Gujarat Fluorochemicals Ltd. Chemicals 1.04ReC Ltd. Finance 1.00Power Finance Corporation Ltd. Finance 0.94RBL Bank Ltd. Banks 0.94Solar Industries India Ltd. Chemicals 0.94Blue Star Ltd. Consumer Durables 0.78Mahindra & Mahindra Financial Services Ltd. Finance 0.75Greenlam Industries Ltd. Consumer Durables 0.73Vardhman Textiles Ltd. Textiles - Cotton 0.67Indian Bank Banks 0.65Schaeffler India Ltd. Industrial Products 0.64Symphony Ltd. Consumer Durables 0.60Karur Vysya Bank Ltd. Banks 0.57Coforge Ltd. Software 0.56
Company Industry+ / Rating % to NAVDelta Corp Ltd. Leisure Services 0.56Greenpanel Industries Ltd. Consumer Durables 0.56RITeS Ltd. engineering Services 0.52Trent Ltd. Retailing 0.52Greenply Industries Ltd. Consumer Durables 0.51Navneet education Ltd. Printing & Publication 0.50Cummins India Ltd. Industrial Products 0.49WABCO India Ltd. Auto Ancillaries 0.47Edelweiss Financial Services Ltd. Finance 0.42Union Bank of India Banks 0.38Jagran Prakashan Ltd. Media 0.37Dhanuka Agritech Ltd. Pesticides 0.35Mahindra Holidays & Resorts Ind Ltd. Leisure Services 0.33Arvind Ltd. Textile Products 0.32Vesuvius India Ltd. Industrial Products 0.32Whirlpool of India Ltd. Consumer Durables 0.23Inox Wind energy Ltd. Chemicals 0.04Arvind Fashions Ltd. Retailing 0.03GFL Ltd. entertainment 0.02Sub Total 95.18Preference SharesZee entertainment enterprises Ltd. entertainment @Sub Total @Total 95.18Cash, Cash equivalents and Net Current Assets 4.82Grand Total 100.00• Top Ten Holdings, @ Less than 0.01%
CATEGORY OF SCHEME: MID CAP FUND
KEY FACTS
INVESTMENT OBJECTIVETo provide long-term capital appreciation/income by investing predominantly in Mid-Cap companies.There is no assurance that the investment objective of the Scheme will be realized.
FUND MANAGER ¥
Chirag Setalvad (since June 25, 2007)
Total Experience: Over 21 years
INCEPTION DATE (Date of Allotment)June 25, 2007
NAV (AS ON JUNE 30, 2021) NAV PER UNIT (`)Regular Plan - Growth Option 82.607Regular Plan - IDCW Option 34.062Direct Plan - Growth Option 88.516Direct Plan - IDCW Option 44.560
ASSETS UNDER MANAGEMENT (`) IN CROREAs on June 30, 2021 29,507.59Average for Month of June 2021 29,295.18
qUANTITATIVE DATAPortfolio Turnover Ratio (Last 1 year) 10.72%Risk Ration Standard Deviation 7.454%n Beta 0.902n Sharpe Ratio* 0.155Computed for the 3-yr period ended June 30, 2021. Based on month-end NAV. * Risk free rate: 3.36%(Source: FIMMDA MIBOR)
TOTAL ExPENSE RATIO (As on June 30, 2021)Including Additional expenses and Goods and Service Tax on Management FeesRegular: 1.66% Direct: 1.06%
#BENCHMARK INDEx: NIFTY Midcap 100 (Total Returns Index) ##ADDL. BENCHMARK INDEx: NIFTY 50 (Total Returns Index)
ExIT LOADl In respect of each purchase / switch-in of Units, an Exit Load
of 1.00% is payable if Units are redeemed / switched-out within 1 year from the date of allotment.
l No Exit Load is payable if Units are redeemed / switched-out after 1 year from the date of allotment.
For further details, please refer to para ‘Exit Load’ on Pg 68.
PLANS & OPTIONSRegular Plan, Direct Plan. Under Each Plan: Growth & Income Distribution cum Capital Withdrawal (IDCW) Option. The IDCW Option offers following Sub-Options: Payout of Income Distribution cum Capital Withdrawal (IDCW) Option; and Re-investment of Income Distribution cum Capital Withdrawal (IDCW) Option.
MINIMUM APPLICATION AMOUNTPurchase : ` 5,000 and any amount thereafter.Additional Purchase : ` 1,000 and any amount thereafter.
SEGMENT-WISE BREAK-UP OF EqUITY HOLDING (% OF NET ASSETS)Large Cap 3.83%Mid Cap 67.46% Small Cap 23.87%
¥ Dedicated Fund Manager for Overseas Investments: Mr. Sankalp Baid (since January 22, 2021) (Total Experience: Over 13 years).
SIP PERFORMANCE ^ - Regular Plan - Growth Option
Since Inception SIP
10 year SIP
5 year SIP
3 year SIP
1 year SIP
Total Amount Invested (` ‘000) 1,690.00 1,200.00 600.00 360.00 120.00 Mkt Value As on June 30, 2021 (` ‘000) 7,160.02 3,215.03 938.51 546.33 161.15 Returns (%) 18.67 18.74 17.96 29.12 69.68 Benchmark Returns (%) # 15.24 16.90 18.62 31.67 80.34 Additional Benchmark Returns (%) ## 12.90 14.36 17.15 22.62 46.03
Assuming ` 10,000 invested systematically on the first Business Day of every month over a period of time. CAGR returns are computed after accounting for the cash flow by using xIRR method (investment internal rate of return) for Regular Plan - Growth Option. The above investment simulation is for illustrative purposes only and should not be construed as a promise on minimum returns and safeguard of capital.
PERFORMANCE ^ - Regular Plan - Growth Option
Date Period Scheme Returns
(%)
Benchmark Returns
(%)#
Additional Benchmark
Returns (%) ##
Value of ` 10,000 invested
Scheme (`) Benchmark (`)#
Additional Benchmark
(`)##
Jun 30, 20 Last 1 Year 73.24 84.97 54.58 17,324 18,497 15,458Jun 29, 18 Last 3 Years 14.62 15.13 15.00 15,068 15,273 15,220Jun 30, 16 Last 5 Years 15.47 15.50 15.08 20,537 20,566 20,191Jun 25, 07 Since Inception 16.25 12.92 11.07 82,607 54,980 43,593
Returns greater than 1 year period are compounded annualized (CAGR). For performance of other schemes managed by Chirag Setalvad, please refer page 68. Different plans viz. Regular Plan and Direct Plan have a different expense structure. The expenses of the Direct Plan under the Scheme will be lower to the extent of the distribution expenses / commission charged in the Regular Plan. For Performance of Direct Plan, refer page no. 73.
Face Value per Unit: ` 10 unless otherwise specified, + Industry Classification as recommended by AMFI, Data is as of June 30, 2021 unless otherwise specified.
This product is suitable for investors who are seeking ~
l to generate long-term capital appreciation / income
l investment predominantly in Mid-Cap companies
VeryHigh
Low to
Moderate
Low
Moderate ModeratelyHigh High
RISKOMETERInvestors understand that their principal will be at
very high risk
~ Investors should consult their financial advisers, if in doubt about whether the product is suitable for them. ^Past performance may or may not be sustained in the future. Since Inception Date = Date of First allotment in the Scheme / Plan.
Load is not taken into consideration for computation of performance.
(An open ended equity scheme predominantly investing in mid cap stocks)HDFC Mid-Cap Opportunities Fund
PORTFOLIO
Industry Allocation of Equity Holding (% of Net Assets)
0.020.320.350.370.500.520.550.671.191.391.611.621.64
2.632.933.343.493.703.86
5.605.61
7.308.72
10.9511.49
14.81
0 2 4 6 8 10 12 14 16Entertainment
Textile ProductsPesticides
MediaPrinting & PublicationEngineering Services
RetailingTextiles - CottonCapital Markets
PowerTrading
Ferrous MetalsHealthcare Services
ConstructionLeisure Services
Consumer Non DurablesInsurance
Aerospace & DefenseSoftware
PharmaceuticalsBanks
Consumer DurablesIndustrial Products
ChemicalsFinance
Auto Ancillaries

June 2021 12
Company Industry+ % to NAVEqUITY & EqUITY RELATED• Firstsource Solutions Ltd. Software 7.50• Bajaj Electricals Ltd. Consumer Durables 5.05• Sonata Software Ltd. Software 4.87• Persistent Systems Ltd. Software 4.58• Chambal Fertilizers &
Chemicals Ltd. Fertilisers 3.20• eClerx Services Ltd. Software 2.84• PNC Infratech Ltd. Construction 2.73• Finolex Industries Ltd. Industrial Products 2.34• KEC International Ltd. Power 2.21• KEI Industries Ltd. Industrial Products 2.14Vardhman Textiles Ltd. Textiles - Cotton 2.06Radico Khaitan Ltd. Consumer Non Durables 2.03Kirloskar Ferrous Industries Ltd. Ferrous Metals 2.01Gujarat Fluorochemicals Ltd. Chemicals 1.92Aster DM Healthcare Ltd. Healthcare Services 1.90Tata Metaliks Ltd. Ferrous Metals 1.74Suprajit engineering Ltd. Auto Ancillaries 1.65Nilkamal Ltd. Industrial Products 1.59Great eastern Shipping Company Ltd. Transportation 1.58Sharda Cropchem Ltd. Pesticides 1.57Bajaj Consumer Care Ltd. Consumer Non Durables 1.54SKF India Ltd. Industrial Products 1.51emami Ltd. Consumer Non Durables 1.49Advanced enzyme Technologies Ltd.
Consumer Non Durables 1.48
La Opala RG Ltd. Consumer Durables 1.47Redington (India) Ltd. Trading 1.46Procter & Gamble Health Ltd. Pharmaceuticals 1.45Kalpataru Power Transmission Ltd. Power 1.44Unichem Laboratories Ltd. Pharmaceuticals 1.30T. V. Today Network Ltd. entertainment 1.27Equitas Small Finance Bank Ltd. Banks 1.23Bank of Baroda Banks 1.21The Federal Bank Ltd. Banks 1.19Delta Corp Ltd. Leisure Services 1.16DCB Bank Ltd. Banks 1.15Repco Home Finance Ltd. Finance 1.12Astral Poly Technik Ltd. Industrial Products 1.06Insecticides (India) Ltd. Pesticides 1.02Transport Corporation of India Ltd. Transportation 0.99NRB Bearing Ltd. Industrial Products 0.98Carborundum Universal Ltd. Industrial Products 0.95Shaily engineering Plastics Ltd. Industrial Products 0.92LG Balakrishnan & Bros Ltd. Auto Ancillaries 0.89Chalet Hotels Ltd. Leisure Services 0.86Indian Bank Banks 0.85Gabriel India Ltd. Auto Ancillaries 0.83
Company Industry+ % to NAVAurobindo Pharma Ltd. Pharmaceuticals 0.80IFGL Refractories Ltd. (Erst IFGL Exports Ltd.) Industrial Products 0.80Goodyear India Ltd. Auto Ancillaries 0.76eIH Ltd. Leisure Services 0.75engineers India Ltd. Construction Project 0.71Power Mech Projects Ltd. Construction Project 0.60Inox Leisure Ltd. entertainment 0.59Sadbhav engineering Ltd. Construction Project 0.54Oriental Carbon & Chemicals Ltd. Chemicals 0.46Multi Commodity exchange of India Ltd. Capital Markets 0.45GNA Axles Ltd. Auto Ancillaries 0.41D B Corp Ltd. Media 0.40Greenlam Industries Ltd. Consumer Durables 0.39Vesuvius India Ltd. Industrial Products 0.38Apar Industries Ltd. Industrial Capital Goods 0.34Jagran Prakashan Ltd. Media 0.21Greenply Industries Ltd. Consumer Durables 0.19Atul Auto Ltd. Auto 0.06Taj GVK Hotels & Resorts Ltd. Leisure Services 0.05Sub Total 95.22Cash, Cash equivalents and Net Current Assets 4.78Grand Total 100.00• Top Ten Holdings
CATEGORY OF SCHEME: SMALL CAP FUND
KEY FACTS
INVESTMENT OBJECTIVETo provide long-term capital appreciation /income by investing predominantly in Small-Cap companies.There is no assurance that the investment objective of the Scheme will be realized.
FUND MANAGER § ¥
Chirag Setalvad (since June 28, 2014)
Total Experience: Over 21 years
INCEPTION DATE (Date of Allotment)April 3, 2008
NAV (AS ON JUNE 30, 2021) NAV PER UNIT (`)Regular Plan - Growth Option 66.023Regular Plan - IDCW Option 31.588Direct Plan - Growth Option 72.278Direct Plan - IDCW Option 41.397
ASSETS UNDER MANAGEMENT (`) IN CROREAs on June 30, 2021 12,459.51Average for Month of June 2021 12,062.08
qUANTITATIVE DATAPortfolio Turnover Ratio (Last 1 year) 6.42%Risk Ration Standard Deviation 8.275%n Beta 0.824n Sharpe Ratio* 0.153Computed for the 3-yr period ended June 30, 2021. Based on month-end NAV. * Risk free rate: 3.36%(Source: FIMMDA MIBOR)
TOTAL ExPENSE RATIO (As on June 30, 2021)Including Additional expenses and Goods and Service Tax on Management FeesRegular: 1.83% Direct: 0.84%
#BENCHMARK INDEx: NIFTY Smallcap 100 (Total Returns Index)##ADDL. BENCHMARK INDEx: NIFTY 50 (Total Returns Index)
ExIT LOADl In respect of each purchase / switch-in of Units, an Exit Load
of 1.00% is payable if Units are redeemed / switched-out within 1 year from the date of allotment.
l No Exit Load is payable if Units are redeemed / switched-out after 1 year from the date of allotment.
For further details, please refer to para ‘Exit Load’ on Pg 68.
PLANS & OPTIONS
Regular Plan, Direct Plan. Under Each Plan: Growth & Income Distribution cum Capital Withdrawal (IDCW) Option. The IDCW Option offers following Sub-Options: Payout of Income Distribution cum Capital Withdrawal (IDCW) Option; and Re-investment of Income Distribution cum Capital Withdrawal (IDCW) Option.
MINIMUM APPLICATION AMOUNTPurchase : ` 5,000 and any amount thereafter.Additional Purchase : ` 1,000 and any amount thereafter.
SEGMENT-WISE BREAK-UP OF EqUITY HOLDING (% OF NET ASSETS)Large Cap 0.80%Mid Cap 10.98%Small Cap 83.45%§ Date of migration from Morgan Stanley Mutual Fund
(Close of business hours - June 27, 14)¥ Dedicated Fund Manager for Overseas Investments: Mr. Sankalp Baid (since January 22, 2021) (Total Experience: Over 13 years).
SIP PERFORMANCE ^ - Regular Plan - Growth Option
Since Inception SIP
10 year SIP
5 year SIP
3 year SIP
1 year SIP
Total Amount Invested (` ‘000) 1,590.00 1,200.00 600.00 360.00 120.00 Mkt Value As on June 30, 2021 (` ‘000) 5,758.72 3,280.68 1,032.43 592.83 183.28 Returns (%) 17.88 19.11 21.89 35.31 111.17 Benchmark Returns (%) # 13.27 14.56 17.69 35.36 102.69 Additional Benchmark Returns (%) ## 13.42 14.36 17.15 22.62 46.03
Assuming ` 10,000 invested systematically on the first Business Day of every month over a period of time. CAGR returns are computed after accounting for the cash flow by using xIRR method (investment internal rate of return) for Regular Plan - Growth Option. The above investment simulation is for illustrative purposes only and should not be construed as a promise on minimum returns and safeguard of capital.
PERFORMANCE ^ - Regular Plan - Growth Option
Date Period Scheme Returns
(%)
Benchmark Returns
(%)#
Additional Benchmark
Returns (%) ##
Value of ` 10,000 invested
Scheme (`) Benchmark (`)#
Additional Benchmark
(`)##
Jun 30, 20 Last 1 Year 106.63 112.73 54.58 20,663 21,273 15,458Jun 29, 18 Last 3 Years 15.11 11.89 15.00 15,263 14,017 15,220Jun 30, 16 Last 5 Years 18.72 11.94 15.08 23,597 17,584 20,191Apr 03, 08 Since Inception 15.31 8.91 10.75 66,023 30,985 38,663
Returns greater than 1 year period are compounded annualized (CAGR). For performance of other schemes managed by Chirag Setalvad, please refer page 68. Different plans viz. Regular Plan and Direct Plan have a different expense structure. The expenses of the Direct Plan under the Scheme will be lower to the extent of the distribution expenses / commission charged in the Regular Plan. For Performance of Direct Plan, refer page no. 73.
Face Value per Unit: ` 10 unless otherwise specified, + Industry Classification as recommended by AMFI, Data is as of June 30, 2021 unless otherwise specified.
This product is suitable for investors who are seeking ~
l to generate long-term capital appreciation / income
l investment predominantly in Small-Cap companies
VeryHigh
Low to
Moderate
Low
Moderate ModeratelyHigh High
RISKOMETERInvestors understand that their principal will be at
very high risk
~ Investors should consult their financial advisers, if in doubt about whether the product is suitable for them. ^Past performance may or may not be sustained in the future. Since Inception Date = Date of First allotment in the Scheme / Plan.
Load is not taken into consideration for computation of performance.
(An open ended equity scheme predominantly investing in small cap stocks)HDFC Small Cap Fund
PORTFOLIO
Industry Allocation of Equity Holding (% of Net Assets)
0.060.340.450.611.121.461.851.861.902.062.382.572.592.732.823.203.553.653.754.54
5.636.547.10
12.6719.79
0 5 10 15 20 25Auto
Industrial Capital GoodsCapital Markets
MediaFinanceTrading
Construction ProjectEntertainment
Healthcare ServicesTextiles - Cotton
ChemicalsTransportation
PesticidesConstruction
Leisure ServicesFertilisers
PharmaceuticalsPower
Ferrous MetalsAuto Ancillaries
BanksConsumer Non Durables
Consumer DurablesIndustrial Products
Software
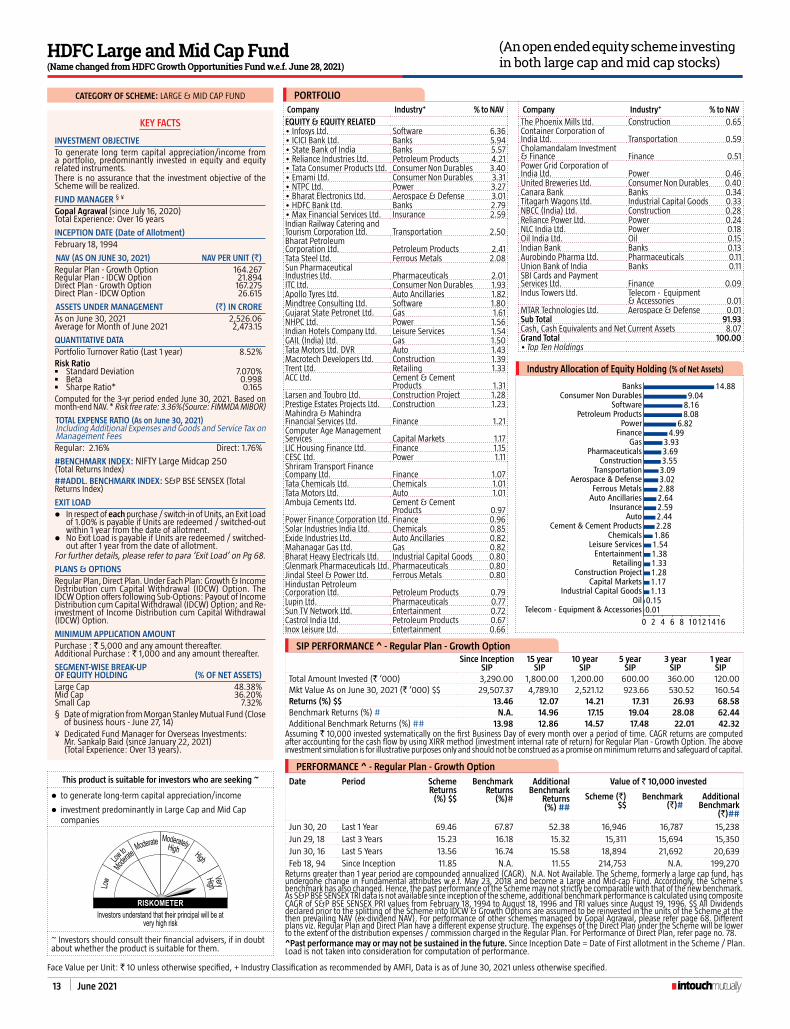
13 June 2021
CATEGORY OF SCHEME: LARGE & MID CAP FUND
KEY FACTS
INVESTMENT OBJECTIVETo generate long term capital appreciation/income from a portfolio, predominantly invested in equity and equity related instruments. There is no assurance that the investment objective of the Scheme will be realized.
FUND MANAGER § ¥
Gopal Agrawal (since July 16, 2020)
Total Experience: Over 16 years
INCEPTION DATE (Date of Allotment)February 18, 1994
NAV (AS ON JUNE 30, 2021) NAV PER UNIT (`)Regular Plan - Growth Option 164.267Regular Plan - IDCW Option 21.894Direct Plan - Growth Option 167.275Direct Plan - IDCW Option 26.615
ASSETS UNDER MANAGEMENT (`) IN CROREAs on June 30, 2021 2,526.06Average for Month of June 2021 2,473.15
qUANTITATIVE DATAPortfolio Turnover Ratio (Last 1 year) 8.52%Risk Ration Standard Deviation 7.070%n Beta 0.998n Sharpe Ratio* 0.165Computed for the 3-yr period ended June 30, 2021. Based on month-end NAV. * Risk free rate: 3.36%(Source: FIMMDA MIBOR)
TOTAL ExPENSE RATIO (As on June 30, 2021)Including Additional expenses and Goods and Service Tax on Management FeesRegular: 2.16% Direct: 1.76%
#BENCHMARK INDEx: NIFTY Large Midcap 250 (Total Returns Index)##ADDL. BENCHMARK INDEx: S&P BSe SeNSex (Total Returns Index)
ExIT LOADl In respect of each purchase / switch-in of Units, an Exit Load
of 1.00% is payable if Units are redeemed / switched-out within 1 year from the date of allotment.
l No Exit Load is payable if Units are redeemed / switched-out after 1 year from the date of allotment.
For further details, please refer to para ‘Exit Load’ on Pg 68.
PLANS & OPTIONSRegular Plan, Direct Plan. Under Each Plan: Growth & Income Distribution cum Capital Withdrawal (IDCW) Option. The IDCW Option offers following Sub-Options: Payout of Income Distribution cum Capital Withdrawal (IDCW) Option; and Re-investment of Income Distribution cum Capital Withdrawal (IDCW) Option.
MINIMUM APPLICATION AMOUNTPurchase : ` 5,000 and any amount thereafter.Additional Purchase : ` 1,000 and any amount thereafter.
SEGMENT-WISE BREAK-UP OF EqUITY HOLDING (% OF NET ASSETS)Large Cap 48.38%Mid Cap 36.20%Small Cap 7.32%§ Date of migration from Morgan Stanley Mutual Fund (Close
of business hours - June 27, 14)¥ Dedicated Fund Manager for Overseas Investments: Mr. Sankalp Baid (since January 22, 2021) (Total Experience: Over 13 years).
PERFORMANCE ^ - Regular Plan - Growth Option
Date Period Scheme Returns
(%) $$
Benchmark Returns
(%)#
Additional Benchmark
Returns (%) ##
Value of ` 10,000 invested
Scheme (`) $$
Benchmark (`)#
Additional Benchmark
(`)##
Jun 30, 20 Last 1 Year 69.46 67.87 52.38 16,946 16,787 15,238Jun 29, 18 Last 3 Years 15.23 16.18 15.32 15,311 15,694 15,350Jun 30, 16 Last 5 Years 13.56 16.74 15.58 18,894 21,692 20,639Feb 18, 94 Since Inception 11.85 N.A. 11.55 214,753 N.A. 199,270
Returns greater than 1 year period are compounded annualized (CAGR). N.A. Not Available. The Scheme, formerly a large cap fund, has undergone change in Fundamental attributes w.e.f. May 23, 2018 and become a Large and Mid-cap Fund. Accordingly, the Scheme’s benchmark has also changed. Hence, the past performance of the Scheme may not strictly be comparable with that of the new benchmark. As S&P BSe SeNSex TRI data is not available since inception of the scheme, additional benchmark performance is calculated using composite CAGR of S&P BSE SENSEx PRI values from February 18, 1994 to August 18, 1996 and TRI values since August 19, 1996. $$ All Dividends declared prior to the splitting of the Scheme into IDCW & Growth Options are assumed to be reinvested in the units of the Scheme at the then prevailing NAV (ex-dividend NAV). For performance of other schemes managed by Gopal Agrawal, please refer page 68. Different plans viz. Regular Plan and Direct Plan have a different expense structure. The expenses of the Direct Plan under the Scheme will be lower to the extent of the distribution expenses / commission charged in the Regular Plan. For Performance of Direct Plan, refer page no. 78.
Face Value per Unit: ` 10 unless otherwise specified, + Industry Classification as recommended by AMFI, Data is as of June 30, 2021 unless otherwise specified.
This product is suitable for investors who are seeking ~
l to generate long-term capital appreciation/income
l investment predominantly in Large Cap and Mid Cap companies
VeryHigh
Low to
Moderate
Low
Moderate ModeratelyHigh High
RISKOMETERInvestors understand that their principal will be at
very high risk
~ Investors should consult their financial advisers, if in doubt about whether the product is suitable for them.
^Past performance may or may not be sustained in the future. Since Inception Date = Date of First allotment in the Scheme / Plan. Load is not taken into consideration for computation of performance.
(An open ended equity scheme investing in both large cap and mid cap stocks)
Company Industry+ % to NAVEqUITY & EqUITY RELATED• Infosys Ltd. Software 6.36• ICICI Bank Ltd. Banks 5.94• State Bank of India Banks 5.57• Reliance Industries Ltd. Petroleum Products 4.21• Tata Consumer Products Ltd. Consumer Non Durables 3.40• Emami Ltd. Consumer Non Durables 3.31• NTPC Ltd. Power 3.27• Bharat Electronics Ltd. Aerospace & Defense 3.01• HDFC Bank Ltd. Banks 2.79• Max Financial Services Ltd. Insurance 2.59Indian Railway Catering and Tourism Corporation Ltd. Transportation 2.50Bharat Petroleum Corporation Ltd. Petroleum Products 2.41Tata Steel Ltd. Ferrous Metals 2.08Sun Pharmaceutical Industries Ltd. Pharmaceuticals 2.01ITC Ltd. Consumer Non Durables 1.93Apollo Tyres Ltd. Auto Ancillaries 1.82Mindtree Consulting Ltd. Software 1.80Gujarat State Petronet Ltd. Gas 1.61NHPC Ltd. Power 1.56Indian Hotels Company Ltd. Leisure Services 1.54GAIL (India) Ltd. Gas 1.50Tata Motors Ltd. DVR Auto 1.43Macrotech Developers Ltd. Construction 1.39Trent Ltd. Retailing 1.33ACC Ltd. Cement & Cement
Products 1.31Larsen and Toubro Ltd. Construction Project 1.28Prestige estates Projects Ltd. Construction 1.23Mahindra & Mahindra Financial Services Ltd. Finance 1.21Computer Age Management Services Capital Markets 1.17LIC Housing Finance Ltd. Finance 1.15CeSC Ltd. Power 1.11Shriram Transport Finance Company Ltd. Finance 1.07Tata Chemicals Ltd. Chemicals 1.01Tata Motors Ltd. Auto 1.01Ambuja Cements Ltd. Cement & Cement
Products 0.97Power Finance Corporation Ltd. Finance 0.96Solar Industries India Ltd. Chemicals 0.85exide Industries Ltd. Auto Ancillaries 0.82Mahanagar Gas Ltd. Gas 0.82Bharat Heavy electricals Ltd. Industrial Capital Goods 0.80Glenmark Pharmaceuticals Ltd. Pharmaceuticals 0.80Jindal Steel & Power Ltd. Ferrous Metals 0.80Hindustan Petroleum Corporation Ltd. Petroleum Products 0.79Lupin Ltd. Pharmaceuticals 0.77Sun TV Network Ltd. entertainment 0.72Castrol India Ltd. Petroleum Products 0.67Inox Leisure Ltd. entertainment 0.66
Company Industry+ % to NAVThe Phoenix Mills Ltd. Construction 0.65Container Corporation of India Ltd. Transportation 0.59Cholamandalam Investment & Finance Finance 0.51Power Grid Corporation of India Ltd. Power 0.46United Breweries Ltd. Consumer Non Durables 0.40Canara Bank Banks 0.34Titagarh Wagons Ltd. Industrial Capital Goods 0.33NBCC (India) Ltd. Construction 0.28Reliance Power Ltd. Power 0.24NLC India Ltd. Power 0.18Oil India Ltd. Oil 0.15Indian Bank Banks 0.13Aurobindo Pharma Ltd. Pharmaceuticals 0.11Union Bank of India Banks 0.11SBI Cards and Payment Services Ltd. Finance 0.09Indus Towers Ltd. Telecom - equipment
& Accessories 0.01MTAR Technologies Ltd. Aerospace & Defense 0.01Sub Total 91.93Cash, Cash equivalents and Net Current Assets 8.07Grand Total 100.00• Top Ten Holdings
PORTFOLIO
Industry Allocation of Equity Holding (% of Net Assets)
0.010.15
1.131.171.281.331.381.541.862.282.442.592.642.883.023.093.553.693.93
4.996.82
8.088.169.04
14.88
0 2 4 6 8 10121416Telecom - Equipment & Accessories
OilIndustrial Capital Goods
Capital MarketsConstruction Project
RetailingEntertainment
Leisure ServicesChemicals
Cement & Cement ProductsAuto
InsuranceAuto AncillariesFerrous Metals
Aerospace & DefenseTransportation
ConstructionPharmaceuticals
GasFinance
PowerPetroleum Products
SoftwareConsumer Non Durables
Banks
SIP PERFORMANCE ^ - Regular Plan - Growth OptionSince Inception
SIP15 year
SIP10 year
SIP5 year
SIP3 year
SIP1 year
SIPTotal Amount Invested (` ‘000) 3,290.00 1,800.00 1,200.00 600.00 360.00 120.00 Mkt Value As on June 30, 2021 (` ‘000) $$ 29,507.37 4,789.10 2,521.12 923.66 530.52 160.54 Returns (%) $$ 13.46 12.07 14.21 17.31 26.93 68.58 Benchmark Returns (%) # N.A. 14.96 17.15 19.04 28.08 62.44 Additional Benchmark Returns (%) ## 13.98 12.86 14.57 17.48 22.01 42.32
Assuming ` 10,000 invested systematically on the first Business Day of every month over a period of time. CAGR returns are computed after accounting for the cash flow by using xIRR method (investment internal rate of return) for Regular Plan - Growth Option. The above investment simulation is for illustrative purposes only and should not be construed as a promise on minimum returns and safeguard of capital.
HDFC Large and Mid Cap Fund (Name changed from HDFC Growth Opportunities Fund w.e.f. June 28, 2021)

June 2021 14
CATEGORY OF SCHEME: FOCUSED FUND
KEY FACTS
INVESTMENT OBJECTIVE
To generate long term capital appreciation/income by investing in equity & equity related instruments of up to 30 companies.
There is no assurance that the investment objective of the Scheme will be realized.
FUND MANAGER ¥
Gopal Agrawal (since July 16, 2020)
Total Experience: Over 16 years
INCEPTION DATE (Date of Allotment)
September 17, 2004
NAV (AS ON JUNE 30, 2021) NAV PER UNIT (`)
Regular Plan - Growth Option 97.223Regular Plan - IDCW Option 16.214Direct Plan - Growth Option 104.820Direct Plan - IDCW Option 18.618
ASSETS UNDER MANAGEMENT (`) IN CRORE
As on June 30, 2021 733.42Average for Month of June 2021 730.66
qUANTITATIVE DATA
Portfolio Turnover Ratio (Last 1 year) 17.36%
Risk Ration Standard Deviation 7.063%n Beta 1.027n Sharpe Ratio* 0.094Computed for the 3-yr period ended June 30, 2021. Based on month-end NAV. * Risk free rate: 3.36%(Source: FIMMDA MIBOR)
TOTAL ExPENSE RATIO (As on June 30, 2021)Including Additional expenses and Goods and Service Tax on Management Fees
Regular: 2.61% Direct: 1.50%
#BENCHMARK INDEx: NIFTY 500 (Total Returns Index)
##ADDL. BENCHMARK INDEx: S&P BSe SeNSex (Total Returns Index)
ExIT LOAD
l In respect of each purchase / switch-in of Units, an Exit Load of 1.00% is payable if Units are redeemed / switched-out within 1 year from the date of allotment.
l No Exit Load is payable if Units are redeemed / switched-out after 1 year from the date of allotment.
For further details, please refer to para ‘Exit Load’ on Pg 68.
PLANS & OPTIONS
Regular Plan, Direct Plan. Under Each Plan: Growth & Income Distribution cum Capital Withdrawal (IDCW) Option. The IDCW Option offers following Sub-Options: Payout of Income Distribution cum Capital Withdrawal (IDCW) Option; and Re-investment of Income Distribution cum Capital Withdrawal (IDCW) Option.
MINIMUM APPLICATION AMOUNT
Purchase : ` 5,000 and any amount thereafter.Additional Purchase : ` 1,000 and any amount thereafter.
¥ Dedicated Fund Manager for Overseas Investments: Mr. Sankalp Baid (since January 22, 2021) (Total Experience: Over 13 years).
SIP PERFORMANCE ^ - Regular Plan - Growth Option
Since Inception SIP
15 year SIP
10 year SIP
5 year SIP
3 year SIP
1 year SIP
Total Amount Invested (` ‘000) 2,020.00 1,800.00 1,200.00 600.00 360.00 120.00
Mkt Value As on June 30, 2021 (` ‘000) 5,789.24 4,310.99 2,156.08 796.42 476.58 152.92
Returns (%) 11.46 10.84 11.28 11.28 19.13 54.92
Benchmark Returns (%) # 13.53 13.24 15.18 17.53 25.01 54.41
Additional Benchmark Returns (%) ## 13.44 12.86 14.57 17.48 22.01 42.32
Assuming ̀ 10,000 invested systematically on the first Business Day of every month over a period of time. CAGR returns are computed after accounting for the cash flow by using xIRR method (investment internal rate of return) for Regular Plan - Growth Option. The above investment simulation is for illustrative purposes only and should not be construed as a promise on minimum returns and safeguard of capital.
PERFORMANCE ^ - Regular Plan - Growth Option
Date Period Scheme Returns
(%)
Benchmark Returns
(%)#
Additional Benchmark
Returns (%) ##
Value of ` 10,000 invested
Scheme (`) Benchmark (`)#
Additional Benchmark
(`)##
Jun 30, 20 Last 1 Year 54.07 60.77 52.38 15,407 16,077 15,238
Jun 29, 18 Last 3 Years 8.63 15.00 15.32 12,826 15,220 15,350
Jun 30, 16 Last 5 Years 9.53 15.40 15.58 15,768 20,473 20,639
Sep 17, 04 Since Inception 14.50 15.58 15.88 97,223 113,730 118,851
Returns greater than 1 year period are compounded annualized (CAGR). For performance of other schemes managed by Gopal Agrawal, please refer page 68. Different plans viz. Regular Plan and Direct Plan have a different expense structure. The expenses of the Direct Plan under the Scheme will be lower to the extent of the distribution expenses / commission charged in the Regular Plan. For Performance of Direct Plan, refer page no. 78.
Face Value per Unit: ` 10 unless otherwise specified, + Industry Classification as recommended by AMFI, Data is as of June 30, 2021 unless otherwise specified.
This product is suitable for investors who are seeking ~
l to generate long-term capital appreciation / income
l investments in equity & equity related instruments of up to 30 companies
VeryHigh
Low to
Moderate
Low
Moderate ModeratelyHigh High
RISKOMETERInvestors understand that their principal will be at
very high risk
~ Investors should consult their financial advisers, if in doubt about whether the product is suitable for them. ^Past performance may or may not be sustained in the future. Since Inception Date = Date of First allotment in the Scheme / Plan.
Load is not taken into consideration for computation of performance.
[An open ended equity scheme investing in maximum 30 stocks in large-cap, mid-cap and small-cap category (i.e. Multi-Cap)]HDFC Focused 30 Fund
Company Industry+ / Rating % to NAV
EqUITY & EqUITY RELATED
• ICICI Bank Ltd. Banks 8.86
• State Bank of India Banks 7.69
• HDFC Bank Ltd. Banks 7.05
• Infosys Ltd. Software 6.31
• Reliance Industries Ltd. Petroleum Products 5.76
• Larsen and Toubro Ltd. Construction Project 5.63
• Axis Bank Ltd. Banks 4.22
• NTPC Ltd. Power 3.88
• Bharat Petroleum Corporation Ltd. Petroleum Products 3.40
• ITC Ltd. Consumer Non Durables 3.40
Bharat electronics Ltd. Aerospace & Defense 3.25
Bharti Airtel Ltd. Telecom - Services 2.90
Lupin Ltd. Pharmaceuticals 2.79
Hindustan Petroleum Corporation Ltd. Petroleum Products 2.60
Power Grid Corporation of India Ltd. Power 2.53
Tata Steel Ltd. Ferrous Metals 2.39
Burger King India Ltd. Leisure Services 2.10
ACC Ltd. Cement & Cement Products 2.06
Ambuja Cements Ltd. Cement & Cement Products 1.97
Garden Reach Shipbuilders & engineers Ltd. Aerospace & Defense 1.97
Kalpataru Power Transmission Ltd. Power 1.86
Gujarat Pipavav Port Ltd. Transportation 1.72
Avenue Supermarts Ltd. Retailing 1.68
GAIL (India) Ltd. Gas 1.63
MTAR Technologies Ltd. Aerospace & Defense 1.37
Company Industry+ / Rating % to NAV
SBI Cards and Payment Services Ltd. Finance 1.36
Indigo Paints Ltd. Consumer Non Durables 1.31
Hindustan Aeronautics Ltd. Aerospace & Defense 1.25
WABCO India Ltd. Auto Ancillaries 0.95
Nazara Technologies Ltd. entertainment 0.92
Sub Total 94.81
Cash, Cash equivalents and Net Current Assets 5.19
Grand Total 100.00
• Top Ten Holdings
PORTFOLIO
Industry Allocation of Equity Holding (% of Net Assets)
0.92
0.95
1.36
1.63
1.68
1.72
2.10
2.39
2.79
2.90
4.03
4.71
5.63
6.31
7.84
8.27
11.76
27.82
0 5 10 15 20 25 30
Entertainment
Auto Ancillaries
Finance
Gas
Retailing
Transportation
Leisure Services
Ferrous Metals
Pharmaceuticals
Telecom - Services
Cement & Cement Products
Consumer Non Durables
Construction Project
Software
Aerospace & Defense
Power
Petroleum Products
Banks

15 June 2021
CATEGORY OF SCHEME: THEMATIC FUND
KEY FACTS
INVESTMENT OBJECTIVE
To seek long-term capital appreciation/income by investing predominantly in equity and equity related securities of companies engaged in or expected to benefit from the growth and development of infrastructure.There is no assurance that the investment objective of the Scheme will be realized.
FUND MANAGER ¥
Rakesh Vyas (since June 01, 2019)
Total Experience: Over 15 years
INCEPTION DATE (Date of Allotment)
March 10, 2008
NAV (AS ON JUNE 30, 2021) NAV PER UNIT (`)
Regular Plan - Growth Option 18.178Regular Plan - IDCW Option 10.851Direct Plan - Growth Option 19.441Direct Plan - IDCW Option 14.914
ASSETS UNDER MANAGEMENT (`) IN CRORE
As on June 30, 2021 573.41Average for Month of June 2021 577.44
qUANTITATIVE DATA
Portfolio Turnover Ratio (Last 1 year) 22.88%
Risk Ration Standard Deviation 9.765%n Beta 1.360n Sharpe Ratio* 0.049
Computed for the 3-yr period ended June 30, 2021. Based on month-end NAV. * Risk free rate: 3.36%(Source: FIMMDA MIBOR)
TOTAL ExPENSE RATIO (As on June 30, 2021)Including Additional expenses and Goods and Service Tax on Management Fees
Regular: 2.56% Direct: 1.91%
#BENCHMARK INDEx: NIFTY 500 (Total Returns Index)##ADDL. BENCHMARK INDEx: NIFTY 50 (Total Returns Index)
ExIT LOAD
l In respect of each purchase / switch-in of Units, an Exit Load of 1.00% is payable if Units are redeemed / switched-out within 1 year from the date of allotment.
l No Exit Load is payable if Units are redeemed / switched-out after 1 year from the date of allotment.
For further details, please refer to para ‘Exit Load’ on Pg 68.
PLANS & OPTIONS
Regular Plan, Direct Plan. Under Each Plan: Growth & Income Distribution cum Capital Withdrawal (IDCW) Option. The IDCW Option offers following Sub-Options: Payout of Income Distribution cum Capital Withdrawal (IDCW) Option; and Re-investment of Income Distribution cum Capital Withdrawal (IDCW) Option.
MINIMUM APPLICATION AMOUNT
Purchase : ` 5,000 and any amount thereafter.Additional Purchase : ` 1,000 and any amount thereafter.
¥ Dedicated Fund Manager for Overseas Investments: Mr. Sankalp Baid (since January 22, 2021) (Total Experience: Over 13 years).
SIP PERFORMANCE ^ - Regular Plan - Growth Option
Since Inception SIP
10 year SIP
5 year SIP
3 year SIP
1 year SIP
Total Amount Invested (` ‘000) 1,600.00 1,200.00 600.00 360.00 120.00 Mkt Value As on June 30, 2021 (` ‘000) 2,480.68 1,668.56 705.23 468.17 167.22 Returns (%) 6.32 6.42 6.41 17.86 80.81 Benchmark Returns (%) # 14.04 15.18 17.53 25.01 54.41 Additional Benchmark Returns (%) ## 13.37 14.36 17.15 22.62 46.03
Assuming ` 10,000 invested systematically on the first Business Day of every month over a period of time. CAGR returns are computed after accounting for the cash flow by using xIRR method (investment internal rate of return) for Regular Plan - Growth Option. The above investment simulation is for illustrative purposes only and should not be construed as a promise on minimum returns and safeguard of capital.
PERFORMANCE ^ - Regular Plan - Growth Option
Date Period Scheme Returns
(%)
Benchmark Returns
(%)#
Additional Benchmark
Returns (%) ##
Value of ` 10,000 invested
Scheme (`) Benchmark (`)#
Additional Benchmark
(`)##
Jun 30, 20 Last 1 Year 72.50 60.77 54.58 17,250 16,077 15,458Jun 29, 18 Last 3 Years 3.28 15.00 15.00 11,018 15,220 15,220Jun 30, 16 Last 5 Years 3.17 15.40 15.08 11,691 20,473 20,191Mar 10, 08 Since Inception 4.59 10.99 10.64 18,178 40,078 38,438
Returns greater than 1 year period are compounded annualized (CAGR). For performance of other schemes managed by Rakesh Vyas, please refer page 68. Different plans viz. Regular Plan and Direct Plan have a different expense structure. The expenses of the Direct Plan under the Scheme will be lower to the extent of the distribution expenses / commission charged in the Regular Plan. For Performance of Direct Plan, refer page no. 78.
Face Value per Unit: ` 10 unless otherwise specified, + Industry Classification as recommended by AMFI, Data is as of June 30, 2021 unless otherwise specified.
This product is suitable for investors who are seeking ~
l to generate long-term capital appreciation / income
l investment predominantly in equity and equity related securities of companies engaged in or expected to benefit from the growth and development of infrastructure
VeryHigh
Low to
Moderate
Low
Moderate ModeratelyHigh High
RISKOMETERInvestors understand that their principal will be at
very high risk
~ Investors should consult their financial advisers, if in doubt about whether the product is suitable for them.
^Past performance may or may not be sustained in the future. Since Inception Date = Date of First allotment in the Scheme / Plan. Load is not taken into consideration for computation of performance.
(An open ended equity scheme following infrastructure theme)HDFC Infrastructure Fund
Company Industry+ % to NAV
EqUITY & EqUITY RELATED
• State Bank of India Banks 8.47
• ICICI Bank Ltd. Banks 7.87
• Larsen and Toubro Ltd. Construction Project 6.90
• JMC Projects (India) Ltd. Construction 5.85
• NTPC Ltd. Power 5.80
• J.Kumar Infraprojects Ltd. Construction 5.33
• Coal India Ltd. Minerals/Mining 5.28
• Hindustan Construction Company Ltd. Construction Project 4.06
• Gujarat Pipavav Port Ltd. Transportation 3.62
• Dilip Buildcon Ltd. Construction 3.24
Bharti Airtel Ltd. Telecom - Services 3.16
CeSC Ltd. Power 3.12
Centum electronics Ltd. Industrial Capital Goods 3.05
Ashoka Buildcon Ltd. Construction 2.57
Dynamatic Technologies Ltd. Industrial Capital Goods 2.31
Axis Bank Ltd. Banks 2.15
HDFC Bank Ltd. Banks 1.83
Ambuja Cements Ltd. Cement & Cement Products 1.81
SBI Cards and Payment Services Ltd. Finance 1.65
Tata Steel Ltd. Ferrous Metals 1.64
Power Finance Corporation Ltd. Finance 1.57
ReC Ltd. Finance 1.55
Repco Home Finance Ltd. Finance 1.48
Birla Corporation Ltd. Cement & Cement Products 1.37
Inox Leisure Ltd. entertainment 1.31
Reliance Industries Ltd. Petroleum Products 1.17
MTAR Technologies Ltd. Aerospace & Defense 1.15
Premier explosives Ltd. Chemicals 1.13
Bharat Petroleum Corporation Ltd. Petroleum Products 0.79
Indigo Paints Ltd. Consumer Non Durables 0.72
MeP Infrastructure Developers Ltd. Transportation 0.66
Company Industry+ % to NAV
Sadbhav Infrastructure Project Ltd. (Corporate Guarantee of Sadbhav engineering Ltd.) Construction Project 0.66
Hindalco Industries Ltd. Non - Ferrous Metals 0.53
RITeS Ltd. engineering Services 0.49
Simplex Infrastructures Ltd. Construction 0.48
Texmaco Rail & engineering Ltd. Industrial Capital Goods 0.48
Computer Age Management Services Capital Markets 0.47
Prestige estates Projects Ltd. Construction 0.25
Sub Total 95.97
Cash, Cash equivalents and Net Current Assets 4.03
Grand Total 100.00
• Top Ten Holdings
PORTFOLIO
Industry Allocation of Equity Holding (% of Net Assets)
0.470.490.530.721.131.151.311.641.96
3.163.18
4.285.285.846.25
8.9211.62
17.7220.32
0 5 10 15 20 25
Capital MarketsEngineering ServicesNon - Ferrous Metals
Consumer Non DurablesChemicals
Aerospace & DefenseEntertainmentFerrous Metals
Petroleum ProductsTelecom - Services
Cement & Cement ProductsTransportation
Minerals/MiningIndustrial Capital Goods
FinancePower
Construction ProjectConstruction
Banks

June 2021 16
Face Value per Unit: ` 10 unless otherwise specified, + Industry Classification as recommended by AMFI, Data is as of June 30, 2021 unless otherwise specified. ....Contd on next page
Note: @@Effective close of business hours of June 1, 2018, HDFC Prudence Fund merged with HDFC Growth Fund (HDFC Balanced Advantage Fund after changes in fundamental attributes). As the portfolio characteristics and the broad investment strategy of HDFC Balanced Advantage Fund is similar to that of erstwhile HDFC Prudence Fund, the track record (i.e. since inception date, dividend history, etc.) and past performance of erstwhile HDFC Prudence Fund has been considered, in line with SEBI circular on Performance disclosure post consolidation/ merger of scheme dated April 12, 2018.
(An open ended balanced advantage fund)HDFC Balanced Advantage Fund Company Industry+ / Rating % to NAV
EqUITY & EqUITY RELATED
• State Bank of India Banks 9.38
• NTPC Ltd. Power 5.16
• Coal India Ltd. Minerals/Mining 4.33
• ICICI Bank Ltd. Banks 4.07
• Larsen and Toubro Ltd. Construction Project 3.68
• Power Finance Corporation Ltd. Finance 3.56
• ITC Ltd. Consumer Non Durables 3.54
• Infosys Ltd. Software 2.82
• REC Ltd. Finance 2.36
• Hindustan Petroleum Corporation Ltd. Petroleum Products 2.06
Axis Bank Ltd. Banks 1.93
Lupin Ltd. Pharmaceuticals 1.63
Bharti Airtel Ltd. Telecom - Services 1.59
Hindustan Aeronautics Ltd. Aerospace & Defense 1.53
Sun Pharmaceutical Industries Ltd. Pharmaceuticals 1.47
GAIL (India) Ltd. Gas 1.43
Bharat Petroleum Corporation Ltd. Petroleum Products 1.19
NHPC Ltd. Power 1.12
Bank of Baroda Banks 1.04
Tata Motors Ltd. Auto 0.94
Gujarat Pipavav Port Ltd. Transportation 0.75
Mishra Dhatu Nigam Ltd. Ferrous Metals 0.72
Apollo Tyres Ltd. Auto Ancillaries 0.66
Power Grid Corporation of India Ltd. Power 0.59
Tata Communications Ltd. Telecom - Services 0.56
BeML Ltd. Industrial Capital Goods 0.53
CeSC Ltd. Power 0.46
SBI Life Insurance Company Ltd. Insurance 0.46
Garden Reach Shipbuilders & engineers Ltd. Aerospace & Defense 0.44
Great eastern Shipping Company Ltd. Transportation 0.44
Indian Railways Finance Corporation Ltd. Finance 0.42
Orient Cement Ltd. Cement & Cement Products 0.40
Ashoka Buildcon Ltd. Construction 0.39
Savita Oil Technologies Ltd. Petroleum Products 0.39
Techno electric & engineering Company Ltd. Construction Project 0.39
Aurobindo Pharma Ltd. Pharmaceuticals 0.36
Chambal Fertilizers & Chemicals Ltd. Fertilisers 0.34
Kirloskar Pneumatic Ltd. Industrial Products 0.30
Apar Industries Ltd. Industrial Capital Goods 0.29
Bharat Dynamics Ltd. Aerospace & Defense 0.29
NLC India Ltd. Power 0.29
Krishna Institute Of Medical Sciences Ltd. Healthcare Services 0.28
Timken India Ltd. Industrial Products 0.28
Dilip Buildcon Ltd. Construction 0.25
Lakshmi Machine Works Ltd. Industrial Capital Goods 0.25
Union Bank of India Banks 0.25
Computer Age Management Services Capital Markets 0.24
Cipla Ltd. Pharmaceuticals 0.23
J.Kumar Infraprojects Ltd. Construction 0.23
Company Industry+ / Rating % to NAV
JMC Projects (India) Ltd. Construction 0.23
SBI Cards and Payment Services Ltd. Finance 0.23
Time Technoplast Ltd. Industrial Products 0.23
RITeS Ltd. engineering Services 0.21
Transport Corporation of India Ltd. Transportation 0.21
IRB Infrastructure Developers Ltd. Construction 0.19
Sterlite Technologies Ltd. Telecom - Services 0.19
WABCO India Ltd. Auto Ancillaries 0.17
Canara Bank Banks 0.16
ICICI Prudential Life Insurance Company Ltd. Insurance 0.15
Sterling and Wilson Solar Construction Project 0.15
Gujarat Industries Power Company Ltd. Power 0.14
Sagar Cements Ltd. Cement & Cement Products 0.14
Wheels India Ltd. Auto Ancillaries 0.14
Dynamatic Technologies Ltd. Industrial Capital Goods 0.12
ICICI Securities Ltd. Capital Markets 0.11
SJVN Ltd. Power 0.10
Titagarh Wagons Ltd. Industrial Capital Goods 0.10
Ramco Systems Ltd. Software 0.08
Texmaco Rail & engineering Ltd. Industrial Capital Goods 0.08
Spicejet Ltd. Transportation 0.07
Hindustan Construction Company Ltd. Construction Project 0.06
Power Mech Projects Ltd. Construction Project 0.06
MeP Infrastructure Developers Ltd. Transportation 0.05
Punjab National Bank Banks 0.05
Just Dial Ltd. Retailing 0.04
ABB Power Products and Systems India Ltd. Industrial Capital Goods 0.03
S Chand and Company Ltd. Printing & Publication 0.03
Indian Hotels Company Ltd. Leisure Services 0.02
Sub Total 69.85
UNITS ISSUED BY REIT & INVIT
UNITS ISSUED BY INVIT
POWeRGRID Infrastructure Investment Trust Power 0.64
Sub Total 0.64
UNITS ISSUED BY REIT
Brookfield India Real estate Trust Construction 1.00
embassy Office Parks ReIT Construction 0.96
Sub Total 1.96
Total 2.60
DEBT & DEBT RELATED
GOVERNMENT SECURITIES (CENTRAL/STATE)
7.16 GOI 2023 Sovereign 1.36
5.22 GOI 2025 Sovereign 1.12
6.18 GOI 2024 Sovereign 0.80
8.13 GOI 2022 Sovereign 0.56
8.15 GOI 2022 Sovereign 0.50
7.37 GOI 2023 Sovereign 0.31
7.32 GOI 2024 Sovereign 0.28
8.08 GOI 2022 Sovereign 0.26
6.17 GOI 2023 Sovereign 0.25
6.84 GOI 2022 Sovereign 0.06
Sub Total 5.50
PORTFOLIO
KEY FACTS
INVESTMENT OBJECTIVE
To provide long term capital appreciation / income from a dynamic mix of equity and debt investments.
There is no assurance that the investment objective of the Scheme will be realized.
FUND MANAGER ¥
Prashant Jain (since June 20, 2003)§ @@
Total Experience: Over 27 years
INCEPTION DATE@@
February 01, 1994
NAV (AS ON JUNE 30, 2021) NAV PER UNIT (`)
Regular Plan - Growth Option 257.785Regular Plan - IDCW Option 28.070Direct Plan - Growth Option 271.625Direct Plan - IDCW Option 30.666
ASSETS UNDER MANAGEMENT (`) IN CRORE
As on June 30, 2021 41,796.27Average for Month of June 2021 42,204.44
qUANTITATIVE DATAPortfolio Turnover Ratio 37.63%Average Maturity * 4.33 yearsMacaulay Duration * 3.13 yearsModified Duration * 2.92 yearsYield to Maturity * 5.68%*Calculated on amount invested in debt securities (including accrued interest), deployment of funds in TRePS and Reverse Repo and net receivable / payable.
TOTAL ExPENSE RATIO (As on June 30, 2021)Including Additional expenses and Goods and Service Tax on Management Fees
Regular: 1.58% Direct: 1.03%
#BENCHMARK INDEx: NIFTY 50 Hybrid Composite Debt 65:35 Index
##ADDL. BENCHMARK INDEx: NIFTY 50 (Total Returns Index)
ExIT LOAD
l In respect of each purchase / switch-in of Units, upto 15% of the units may be redeemed without any exit load from the date of allotment.
l Any redemption in excess of the above limit shall be subject to the following exit load:
n Exit load of 1.00% is payable if Units are redeemed / switched-out within 1 year from the date of allotment of units.
l No Exit Load is payable if Units are redeemed / switched-out after 1 year from the date of allotment.
For further details, please refer to para ‘Exit Load’ on Pg 68.
PLANS & OPTIONS
Regular Plan, Direct Plan. Under Each Plan: Growth & Income Distribution cum Capital Withdrawal (IDCW) Option. The IDCW Option offers following Sub-Options: Payout of Income Distribution cum Capital Withdrawal (IDCW) Option; and Re-investment of Income Distribution cum Capital Withdrawal (IDCW) Option.
MINIMUM APPLICATION AMOUNT
Purchase : ` 5,000 and any amount thereafter.Additional Purchase : ` 1,000 and any amount thereafter.
¥ Dedicated Fund Manager for Overseas Investments: Mr. Sankalp Baid (since January 22, 2021) (Total Experience: Over 13 years).§ Date of migration of erstwhile HDFC Prudence Fund from
Zurich India Mutual Fund (Close of business hours - June 19, 03).
(The Scheme underwent Change in Fundamental Attributes i.e. change in Asset Allocation Pattern w.e.f. March 14, 2019).
CATEGORY OF SCHEME: BALANCED ADVANTAGE FUND

17 June 2021
This product is suitable for investors who are seeking ~
l to generate long-term capital appreciation / income
l investments in a mix of equity and debt instruments
VeryHigh
Low to
Moderate
Low
Moderate ModeratelyHigh High
RISKOMETERInvestors understand that their principal will be at
very high risk
~ Investors should consult their financial advisers, if in doubt about whether the product is suitable for them.
SIP PERFORMANCE ^ - Regular Plan - Growth OptionSince Inception
SIP15 year
SIP10 year
SIP5 year
SIP3 year
SIP1 year
SIPTotal Amount Invested (` ‘000) 3,290.00 1,800.00 1,200.00 600.00 360.00 120.00 Mkt Value As on June 30, 2021 (` ‘000) $$ 77,503.88 5,526.62 2,419.88 843.26 482.88 151.01 Returns (%) $$ 18.74 13.74 13.45 13.60 20.07 51.53 Benchmark Returns (%) # N.A. 11.72 12.83 14.77 18.62 30.35 Additional Benchmark Returns (%) ## 13.65 12.71 14.36 17.15 22.62 46.03
Assuming ` 10,000 invested systematically on the first Business Day of every month over a period of time. CAGR returns are computed after accounting for the cash flow by using xIRR method (investment internal rate of return) for Regular Plan - Growth Option. The above investment simulation is for illustrative purposes only and should not be construed as a promise on minimum returns and safeguard of capital.
PERFORMANCE ^ - Regular Plan - Growth OptionDate Period Scheme
Returns (%) $$
Benchmark Returns
(%)#
Additional Benchmark
Returns (%) ##
Value of ` 10,000 invested
Scheme (`) $$
Benchmark (`)#
Additional Benchmark
(`)##Jun 30, 20 Last 1 Year 51.30 35.83 54.58 15,130 13,583 15,458Jun 29, 18 Last 3 Years 12.91 14.07 15.00 14,402 14,854 15,220Jun 30, 16 Last 5 Years 12.44 13.25 15.08 17,979 18,635 20,191Feb 01, 94 Since Inception 18.08 N.A. 10.94 954,053 N.A. 172,596
Returns greater than 1 year period are compounded annualized (CAGR). N.A. Not Available. Scheme performance may not strictly be comparable with that of its Additional Benchmark in view of balanced nature of the scheme where a portion of scheme’s investments are made in debt instruments. $$ All Dividends declared prior to the splitting of the Scheme into IDCW & Growth Options are assumed to be reinvested in the units of the Scheme at the then prevailing NAV (ex-dividend NAV). For performance of other schemes managed by Prashant Jain, please refer page 68. Different plans viz. Regular Plan and Direct Plan have a different expense structure. The expenses of the Direct Plan under the Scheme will be lower to the extent of the distribution expenses / commission charged in the Regular Plan. As NIFTY 50 TRI data is not available since inception of the scheme, additional benchmark performance is calculated using composite CAGR of NIFTY 50 PRI values from February 1, 1994 to June 29, 1999 and TRI values since June 30, 1999. For Performance of Direct Plan, refer page no. 73. For FPI Portfolio, refer page no. 80.
^Past performance may or may not be sustained in the future. Since Inception Date = Date of First allotment in the Scheme / Plan. Load is not taken into consideration for computation of performance.
Portfolio Classification By Asset Class (%)
n equity 69.85n Units issued by InvIT 0.64n Units issued by ReIT 1.96n G-Sec 5.50n Credit exposure 12.43n Cash, Cash equivalents and Net
Current Assets 9.62
Portfolio Classification By Rating Class (%)
n equity 69.85n Sovereign 5.50n Units issued by InvIT 0.64n Units issued by ReIT 1.96n AAA/AAA(SO)/A1+/A1+(SO) &
equivalent 3.35n AA+ 4.18n AA/AA- 4.67n A+ & Below 0.23n Cash, Cash equivalents and Net
Current Assets 9.62
(An open ended balanced advantage fund)HDFC Balanced Advantage Fund .....Contd from previous page
Industry Allocation of Equity Holding (% of Net Assets)
0.020.030.040.210.280.340.350.540.610.720.810.940.971.401.431.522.262.342.903.253.543.643.694.334.34
6.578.50
16.88
0 2 4 6 8 10 12 14 16 18Leisure Services
Printing & PublicationRetailing
Engineering ServicesHealthcare Services
FertilisersCapital Markets
Cement & Cement ProductsInsurance
Ferrous MetalsIndustrial Products
AutoAuto Ancillaries
Industrial Capital GoodsGas
TransportationAerospace & Defense
Telecom - ServicesSoftware
ConstructionConsumer Non Durables
Petroleum ProductsPharmaceuticalsMinerals/Mining
Construction ProjectFinance
PowerBanks
PORTFOLIOCompany Industry+ / Rating % to NAV
CREDIT ExPOSURE (NON PERPETUAL)
Housing Development Finance Corporation Ltd.£ CRISIL - AAA 0.78
LIC Housing Finance Ltd. CRISIL - AAA 0.56
State Bank of India CRISIL - AAA 0.47
Pipeline Infrastructure Pvt. Ltd. CRISIL - AAA 0.39
ReC Ltd. CRISIL - AAA 0.28
Bharat Petroleum Corporation Ltd. CRISIL - AAA 0.24
Bajaj electricals Ltd. ICRA - A 0.23
Tata Steel Ltd. CARe - AA 0.22
Coastal Gujarat Power Ltd. (Corporate Guarantee of Tata Power) CARe - AA(Ce) 0.19
Indian Railways Finance Corporation Ltd. CRISIL - AAA 0.19
export - Import Bank of India CRISIL - AAA 0.13
Power Grid Corporation of India Ltd. CRISIL - AAA 0.13
Fullerton India Credit Company Ltd. CRISIL - AAA 0.12
National Bank for Agriculture and Rural Development ICRA - AAA 0.06
Sub Total 3.99
Company Industry+ / Rating % to NAV
CREDIT ExPOSURE (PERPETUAL BONDS)
State Bank of India (AT1, BASeL III, Perpetual) CRISIL - AA+ 1.85
Canara Bank (AT1, BASeL III, Perpetual) CRISIL - AA 1.65
ICICI Bank Ltd. (AT1, BASeL III, Perpetual) CARE - AA+ 1.10
Punjab National Bank (AT1, BASeL III, Perpetual) CRISIL - AA- 1.10
Union Bank of India (AT1, BASeL III, Perpetual) CARe - AA- 0.73
HDFC Bank Ltd. (AT1, BASeL III, Perpetual) CRISIL - AA+ 0.64
Bank of Baroda (AT1, BASeL III, Perpetual) CRISIL - AA+ 0.53
Canara Bank (AT1, BASeL III, Perpetual) CARe - AA 0.37
Punjab National Bank (AT1, BASeL III, Perpetual) IND - AA 0.34
Union Bank of India (AT1, BASeL III, Perpetual) CRISIL - AA- 0.07
Axis Bank Ltd. (AT1, BASeL III, Perpetual) CRISIL - AA+ 0.06
Sub Total 8.44
Total 17.93
Cash, Cash equivalents and Net Current Assets 9.62
Grand Total 100.00
• Top Ten Holdings, £ Co-sponsor

June 2021 18
Company Industry+ / Rating % to NAV
EqUITY & EqUITY RELATED
• ICICI Bank Ltd. Banks 7.62
• HDFC Bank Ltd. Banks 6.58
• Infosys Ltd. Software 5.64
• Larsen and Toubro Ltd. Construction Project 4.56
• Reliance Industries Ltd. Petroleum Products 4.40
• Housing Development Finance Corporation Ltd.£ Finance 4.21
• State Bank of India Banks 3.59
• Bharat Electronics Ltd. Aerospace & Defense 3.23
• Aurobindo Pharma Ltd. Pharmaceuticals 3.11
Axis Bank Ltd. Banks 3.08
ITC Ltd. Consumer Non Durables 2.98
Atul Ltd. Chemicals 2.16
KeC International Ltd. Power 1.98
Power Grid Corporation of India Ltd. Power 1.98
UPL Ltd. Pesticides 1.92
Bharti Airtel Ltd. Telecom - Services 1.73
SKF India Ltd. Industrial Products 1.47
Hindustan Petroleum Corporation Ltd. Petroleum Products 1.21
Redington (India) Ltd. Trading 1.19
PNC Infratech Ltd. Construction 1.16
Indusind Bank Ltd. Banks 1.13
Bharat Petroleum Corporation Ltd. Petroleum Products 0.97
Tata Steel Ltd. Ferrous Metals 0.96
Bank of Baroda Banks 0.85
Mahindra Holidays & Resorts Ind Ltd. Leisure Services 0.81
Persistent Systems Ltd. Software 0.76
Vardhman Textiles Ltd. Textiles - Cotton 0.56
Carborundum Universal Ltd. Industrial Products 0.47
Sharda Cropchem Ltd. Pesticides 0.44
Tamilnadu Newsprint & Papers Ltd. Paper 0.43
Zensar Technologies Ltd. Software 0.43
Kalpataru Power Transmission Ltd. Power 0.36
Sadbhav engineering Ltd. Construction Project 0.27
MM Forgings Ltd. Industrial Products 0.22
Cholamandalam Financial Holdings Ltd. Finance 0.16
Navneet education Ltd. Printing & Publication 0.15
Jagran Prakashan Ltd. Media 0.11
Sub Total 72.88
UNITS ISSUED BY REIT & INVIT
UNITS ISSUED BY INVIT
POWeRGRID Infrastructure Investment Trust Power 0.40
Sub Total 0.40
UNITS ISSUED BY REIT
Brookfield India Real estate Trust Construction 0.38
Sub Total 0.38
Total 0.78
Company Industry+ / Rating % to NAV
DEBT & DEBT RELATED
GOVERNMENT SECURITIES (CENTRAL/STATE)
7.16 GOI 2023 Sovereign 1.61
6.84 GOI 2022 Sovereign 1.05
8.2 GOI 2025 Sovereign 1.05
7.35 GOI 2024 Sovereign 0.88
8.24 GOI 2033 Sovereign 0.59
8.4 GOI 2024 Sovereign 0.30
8.6 GOI 2028 Sovereign 0.25
8.13 GOI 2045 Sovereign 0.12
8.83 GOI 2023 Sovereign 0.02
8.2 GOI 2022 Sovereign 0.01
SUB TOTAL 5.88
CREDIT ExPOSURE (NON PERPETUAL)
• Tata Sons Ltd. CRISIL - AAA 3.11
LIC Housing Finance Ltd. CARe - AAA / CRISIL - AAA 1.63
Coastal Gujarat Power Ltd. (Corporate Guarantee of Tata Power) CARe - AA(Ce) 1.41
Power Finance Corporation Ltd. CRISIL - AAA / ICRA - AAA 1.12
ReC Ltd. CARe - AAA / CRISIL - AAA / IND - AAA 0.76
Shriram City Union Finance Ltd. CRISIL - AA 0.56
Bajaj electricals Ltd. ICRA - A 0.54
Shriram Transport Finance Company Ltd. CRISIL - AA+ / IND - AA+ 0.44
National Bank for Agriculture and Rural Development CRISIL - AAA 0.38
HDFC Bank Ltd. CRISIL - AAA 0.30
Muthoot Finance Ltd. CRISIL - AA+ 0.28
Kalpataru Power Transmission Ltd. CRISIL - AA 0.15
ICICI Bank Ltd. CARe - AAA 0.14
Hindalco Industries Ltd. CRISIL - AA 0.06
Sub Total 10.88
CREDIT ExPOSURE (PERPETUAL BONDS)
Axis Bank Ltd. (AT1, BASeL III, Perpetual) CRISIL - AA+ 1.94
Punjab National Bank (AT1, BASeL III, Perpetual) CRISIL - AA- 0.56
State Bank of India (AT1, BASeL III, Perpetual) CRISIL - AA+ 0.28
Canara Bank (AT1, BASeL III, Perpetual) CARe - AA 0.17
Union Bank of India (AT1, BASeL III, Perpetual) CRISIL - AA- 0.11
Sub Total 3.06
Total 19.82
MUTUAL FUND UNITS
HDFC NIFTY 50 Exchange Traded Fund 1.18
Sub Total 1.18
Cash, Cash equivalents and Net Current Assets 5.34
GRAND TOTAL 100.00
l Top Ten Holdings, £ Co-sponsor
CATEGORY OF SCHEME: AGGRESSIVE HYBRID FUND
Face Value per Unit: ` 10 unless otherwise specified, + Industry Classification as recommended by AMFI, Data is as of June 30, 2021 unless otherwise specified.
Note: @@ Effective close of business hours of June 1, 2018, HDFC Balanced Fund merged with HDFC Premier Multi Cap Fund (HDFC Hybrid Equity Fund after changes in fundamental attributes). As the portfolio characteristics and the broad investment strategy of HDFC Hybrid Equity Fund is similar to that of erstwhile HDFC Balanced Fund, the track record (i.e. since inception date, dividend history, etc) and past performance of erstwhile HDFC Balanced Fund has been considered, in line with SEBI circular on Performance disclosure post consolidation/ merger of scheme dated April 12, 2018.
(An open ended hybrid scheme investing predominantly in equity and equity related instruments)HDFC Hybrid Equity Fund
PORTFOLIO
KEY FACTS
INVESTMENT OBJECTIVE
The investment objective of the Scheme is to generate capital appreciation / income from a portfolio, predominantly of equity & equity related instruments. The Scheme will also invest in debt and money market instruments.
There is no assurance that the investment objective of the Scheme will be realized.
FUND MANAGER ¥
Chirag Setalvad (since April 2, 2007)@@
Total Experience: Over 21 years
INCEPTION DATE@@
September 11, 2000
NAV (AS ON JUNE 30, 2021) NAV PER UNIT (`)
Regular Plan - Growth Option 73.195Regular Plan - IDCW Option 13.532Direct Plan - Growth Option 77.306Direct Plan - IDCW Option 14.716
ASSETS UNDER MANAGEMENT (`) IN CRORE
As on June 30, 2021 18,220.21Average for Month of June 2021 18,242.96
qUANTITATIVE DATA
Portfolio Turnover Ratio (Last 1 year) 0.93%Average Maturity * 2.95 yearsMacaulay Duration * 2.24 yearsModified Duration * 2.12 yearsYield to Maturity * 5.35%
*Calculated on amount invested in debt securities (including accrued interest), deployment of funds in TRePS and Reverse Repo and net receivable / payable.
TOTAL ExPENSE RATIO (As on June 30, 2021)Including Additional expenses and Goods and Service Tax on Management Fees
Regular: 1.78% Direct: 1.14%
#BENCHMARK INDEx: NIFTY 50 Hybrid Composite Debt 65:35 Index
##ADDL. BENCHMARK INDEx: NIFTY 50 (Total Returns Index)
ExIT LOAD
l In respect of each purchase/switch-in of Units, upto 15% of the units may be redeemed without any exit load from the date of allotment.
l Any redemption in excess of the above limit shall be subject to the following exit load:
n Exit load of 1.00% is payable if Units are redeemed / switched-out within 1 year from the date of allotment of units.
l No Exit Load is payable if Units are redeemed / switched-out after 1 year from the date of allotment.
For further details, please refer to para ‘Exit Load’ on Pg 68.
PLANS & OPTIONS
Regular Plan, Direct Plan. Under Each Plan: Growth & Income Distribution cum Capital Withdrawal (IDCW) Option. The IDCW Option offers following Sub-Options: Payout of Income Distribution cum Capital Withdrawal (IDCW) Option; and Re-investment of Income Distribution cum Capital Withdrawal (IDCW) Option.
MINIMUM APPLICATION AMOUNT
Purchase : ` 5,000 and any amount thereafter.Additional Purchase : ` 1,000 and any amount thereafter.
SEGMENT-WISE BREAK-UP OF EqUITY HOLDINGS (% OF NET ASSETS)
Large Cap 55.66%Mid Cap 7.00%Small Cap 10.21%
¥ Dedicated Fund Manager for Overseas Investments: Mr. Sankalp Baid (since January 22, 2021) (Total Experience: Over 13 years).

19 June 2021
SIP PERFORMANCE ^ - Regular Plan - Growth Option
Since Inception SIP
15 year SIP
10 year SIP
5 year SIP
3 year SIP
1 year SIP
Total Amount Invested (` ‘000) 2,500.00 1,800.00 1,200.00 600.00 360.00 120.00 Mkt Value As on June 30, 2021 (` ‘000) 17,321.59 6,066.43 2,584.80 864.11 489.69 148.11 Returns (%) 16.09 14.82 14.68 14.59 21.08 46.46 Benchmark Returns (%) # N.A. 11.72 12.83 14.77 18.62 30.35 Additional Benchmark Returns (%) ## 15.04 12.71 14.36 17.15 22.62 46.03
Assuming ` 10,000 invested systematically on the first Business Day of every month over a period of time. CAGR returns are computed after accounting for the cash flow by using xIRR method (investment internal rate of return) for Regular Plan - Growth Option. The above investment simulation is for illustrative purposes only and should not be construed as a promise on minimum returns and safeguard of capital.
PERFORMANCE ^ - Regular Plan - Growth Option
Date Period Scheme Returns
(%)
Benchmark Returns
(%)#
Additional Benchmark
Returns (%) ##
Value of ` 10,000 invested
Scheme (`) Benchmark (`)#
Additional Benchmark
(`)##
Jun 30, 20 Last 1 Year 50.12 35.83 54.58 15,012 13,583 15,458Jun 29, 18 Last 3 Years 13.25 14.07 15.00 14,536 14,854 15,220Jun 30, 16 Last 5 Years 13.08 13.25 15.08 18,496 18,635 20,191Sep 11, 00 Since Inception 15.74 N.A. 13.67 209,608 N.A. 143,911
Returns greater than 1 year period are compounded annualized (CAGR). N.A. Not Available. Scheme performance may not strictly be comparable with that of its Additional Benchmark in view of hybrid nature of the scheme where a portion of scheme’s investments are made in debt instruments. For performance of other schemes managed by Chirag Setalvad, please refer page 68. Different plans viz. Regular Plan and Direct Plan have a different expense structure. The expenses of the Direct Plan under the Scheme will be lower to the extent of the distribution expenses / commission charged in the Regular Plan. For Performance of Direct Plan, refer page no. 73.
^Past performance may or may not be sustained in the future. Since Inception Date = Date of First allotment in the Scheme / Plan. Load is not taken into consideration for computation of performance.
Face Value per Unit: ` 10 unless otherwise specified, + Industry Classification as recommended by AMFI, Data is as of June 30, 2021 unless otherwise specified.
This product is suitable for investors who are seeking ~
l to generate long-term capital appreciation / income.
l investments predominantly in equity & equity related instruments. The Scheme will also invest in debt and money market instruments.
VeryHigh
Low to
Moderate
Low
Moderate ModeratelyHigh High
RISKOMETERInvestors understand that their principal will be at
very high risk
~ Investors should consult their financial advisers, if in doubt about whether the product is suitable for them.
PORTFOLIO CLASSIFICATION BY ASSET CLASS (%)
n equity 72.88
n Units issued by InvIT 0.40
n Units issued by ReIT 0.38
n G-Sec 5.88n Credit exposure 13.94
n Mutual Fund Units 1.18
n Cash, Cash equivalents and Net Current Assets 5.34
PORTFOLIO CLASSIFICATION BY RATING CLASS (%)
n equity 72.88n Sovereign 5.88n Units issued by InvIT 0.40n Units issued by ReIT 0.38n AAA/AAA(SO)/A1+/A1+(SO) &
equivalent 7.44n AA+ 2.94n AA/AA- 3.02n A+ & Below 0.54n Mutual Fund Units 1.18n Cash, Cash equivalents and Net
Current Assets 5.34
(An open ended hybrid scheme investing predominantly in equity and equity related instruments)HDFC Hybrid Equity Fund .....Contd from previous page
Industry Allocation of Equity Holding (% of Net Assets)
0.110.150.430.560.810.961.191.541.732.162.162.362.983.113.23
4.374.724.83
6.586.83
22.85
0 5 10 15 20 25
MediaPrinting & Publication
PaperTextiles - CottonLeisure ServicesFerrous Metals
TradingConstruction
Telecom - ServicesChemicals
Industrial ProductsPesticides
Consumer Non DurablesPharmaceuticals
Aerospace & DefenseFinance
PowerConstruction ProjectPetroleum Products
SoftwareBanks

June 2021 20
SIP PERFORMANCE ^ - Regular Plan - Growth Option
Since Inception SIP
15 year SIP
10 year SIP
5 Year SIP
3 Year SIP
1 Year SIP
Total Amount Invested (` ‘000) 1,910.00 1,800.00 1,200.00 600.00 360.00 120.00 Mkt Value As on June 30, 2021 (` ‘000) 4,639.74 4,171.51 2,113.31 836.04 476.12 138.91 Returns (%) 10.34 10.45 10.91 13.25 19.06 30.68 Benchmark Returns (%) # N.A. N.A. 12.48 14.64 18.13 25.87 Additional Benchmark Returns (%) ## 12.78 12.71 14.36 17.15 22.62 46.03
Assuming ` 10,000 invested systematically on the first Business Day of every month over a period of time. CAGR returns are computed after accounting for the cash flow by using xIRR method (investment internal rate of return) for Regular Plan - Growth Option. The above investment simulation is for illustrative purposes only and should not be construed as a promise on minimum returns and safeguard of capital.
PERFORMANCE ^ - Regular Plan - Growth Option
Date Period Scheme Returns
(%)
Benchmark Returns
(%)#
Additional Benchmark
Returns (%) ##
Value of ` 10,000 invested
Scheme (`) Benchmark (`)#
Additional Benchmark
(`)##
Jun 30, 20 Last 1 Year 37.00 31.41 54.58 13,700 13,141 15,458Jun 29, 18 Last 3 Years 12.77 14.41 15.00 14,349 14,987 15,220Jun 30, 16 Last 5 Years 10.49 12.88 15.08 16,474 18,331 20,191Aug 17, 05 Since Inception 9.79 N.A. 13.95 44,083 N.A. 79,554
Returns greater than 1 year period are compounded annualized (CAGR). N.A. Not Available. The Scheme formerly, a debt oriented hybrid fund, has undergone change in Fundamental attributes w.e.f. May 23, 2018 and become a multi asset fund investing in equities, debt and gold related instruments. Accordingly, the Scheme’s benchmark has also changed. Hence, the performance of the Scheme from inception till May 22, 2018 may not strictly be comparable with those of the new benchmark and the additional benchmark. Scheme performance may not strictly be comparable with that of its Additional Benchmark in view of hybrid nature of the scheme where a portion of scheme’s investments are made in debt instruments and gold related instruments. For performance of other schemes managed by Amit B. Ganatra (Equities), Anil Bamboli (Debt), Krishan Kumar Daga (Gold and Arbitrage) and Arun Agarwal (Arbitrage) please refer page 68. Different plans viz. Regular Plan and Direct Plan have a different expense structure. The expenses of the Direct Plan under the Scheme will be lower to the extent of the distribution expenses / commission charged in the Regular Plan. For Performance of Direct Plan, refer page no. 79.
Face Value per Unit: ` 10 unless otherwise specified, + Industry Classification as recommended by AMFI, Data is as of June 30, 2021 unless otherwise specified.
This product is suitable for investors who are seeking ~
l to generate long-term capital appreciation/incomel investments in a diversified portfolio of equity & equity
related instruments, debt & money market instruments and Gold related instruments
VeryHighLow
to
Moderate
Low
Moderate ModeratelyHigh High
RISKOMETERInvestors understand that their principal will be at
very high risk
~ Investors should consult their financial advisers, if in doubt about whether the product is suitable for them.
^Past performance may or may not be sustained in the future. Since Inception Date = Date of First allotment in the Scheme / Plan. Load is not taken into consideration for computation of performance.
(An open ended scheme investing in equity and equity related instruments, debt & money market instruments and gold related instruments)HDFC Multi-Asset Fund
Industry Allocation of Equity Holding (% of Net Assets)
0.230.470.490.500.540.560.600.630.940.961.001.031.371.391.481.801.87
2.693.00
4.104.96
5.819.24
12.56
0 2 4 6 8 10 12 14Industrial Capital Goods
RetailingGas
Industrial ProductsEntertainment
Healthcare ServicesLeisure ServicesCapital Markets
ChemicalsAuto
Ferrous MetalsInsurance
Consumer DurablesTelecom - Services
ConstructionAerospace & Defense
PharmaceuticalsAuto Ancillaries
Petroleum ProductsPower
FinanceConsumer Non Durables
SoftwareBanks
KEY FACTS
INVESTMENT OBJECTIVE
The objective of the Scheme is to generate long term capital appreciation/income by investing in a diversified portfolio of equity & equity related instruments, debt & money market instruments and Gold related instruments.There is no assurance that the investment objective of the Scheme will be realized.
FUND MANAGER ¥
Amit B. Ganatra (equities) (since June 12, 2020)
Total experience - Over 17 years;
Anil Bamboli (Debt) (since August 17, 2005)
Total Experience: Over 23 years &
Krishan Kumar Daga (Gold and Arbitrage) (since May 23, 2018)Total Experience: Over 22 years
Arun Agarwal (Arbitrage) (since August 24, 2020)
Total Experience: Over 22 years
INCEPTION DATE (Date of Allotment)
August 17, 2005
NAV (AS ON JUNE 30, 2021) NAV PER UNIT (`)
Regular Plan - Growth Option 44.083Regular Plan - IDCW Option 14.656Direct Plan - Growth Option 46.757Direct Plan - IDCW Option 16.406
ASSETS UNDER MANAGEMENT (`) IN CRORE
As on June 30, 2021 905.13Average for Month of June 2021 874.63
qUANTITATIVE DATA
Portfolio Turnover Ratio 29.86%
TOTAL ExPENSE RATIO (As on June 30, 2021)Including Additional expenses and Goods and Service Tax on Management Fees
Regular: 2.48% Direct: 1.00%
#BENCHMARK INDEx: 90% NIFTY 50 Hybrid Composite Debt 65:35 Index + 10% Domestic Price of Gold
##ADDL. BENCHMARK INDEx: NIFTY 50 (Total Returns Index)
ExIT LOAD
l In respect of each purchase / switch-in of Units, 15% of the units (“the limit”) may be redeemed without any exit Load from the date of allotment.
l Any redemption in excess of the above limit shall be subject to the following exit load:
t exit Load of 1.00% is payable if units are redeemed / switched out within 12 months from the date of allotment.
l No exit Load is payable if units are redeemed / switched out after 12 months from the date of allotment.
For further details, please refer to para ‘Exit Load’ on Pg 68.
PLANS & OPTIONS
Regular Plan, Direct Plan. Under Each Plan: Growth & Income Distribution cum Capital Withdrawal (IDCW) Option. The IDCW Option offers following Sub-Options: Payout of Income Distribution cum Capital Withdrawal (IDCW) Option; and Re-investment of Income Distribution cum Capital Withdrawal (IDCW) Option.
MINIMUM APPLICATION AMOUNT
Purchase : ` 5,000 and any amount thereafter.Additional Purchase : ` 1,000 and any amount thereafter.
¥ Dedicated Fund Manager for Overseas Investments: Mr. Sankalp Baid (since January 22, 2021) (Total Experience: Over 13 years).
(The Scheme underwent Change in Fundamental Attributes i.e. change in Asset Allocation Pattern w.e.f. March 14, 2019).
Portfolio Classification By Asset Class (%)
n equity 67.06n Units issued by InvIT 2.22n Units issued by ReIT 1.48n G-Sec, T-Bills 9.56n Credit exposure 4.62n Gold ETF 10.36n Cash, Cash equivalents and Net
Current Assets 4.70
Portfolio Classification By Rating Class (%)
n equity 67.06n Sovereign 9.56n Units issued by InvIT 2.22n Units issued by ReIT 1.48n AAA/AAA(SO)/A1+/A1+(SO) &
equivalent 1.83n AA/AA- 2.23n A+ & Below 0.56n Gold ETF 10.36n Cash, Cash equivalents and Net
Current Assets 4.70
Cash and Cash equivalents include overnight deployment of Cash in Tri-Party Repos
CATEGORY OF SCHEME: MULTI ASSET ALLOCATION FUND

21 June 2021
Company Industry+ / Rating % to NAV (Hedged & Unhedged)
% exposure of Derivative
EqUITY & EqUITY RELATED
• HDFC Bank Ltd. Banks 6.19 0.00
• Infosys Ltd. Software 5.00 0.01
• ICICI Bank Ltd. Banks 4.01 0.00
• Housing Development Finance Corporation Ltd.£ Finance 3.70 0.00
• Axis Bank Ltd. Banks 3.45 1.09
• Reliance Industries Ltd. Petroleum Products 3.21 0.76
• Hindustan Unilever Ltd. Consumer Non Durables 2.76 0.85
• Tata Steel Ltd. Ferrous Metals 2.43 1.43
Maruti Suzuki India Ltd. Auto 1.56 0.61
Bharti Airtel Ltd. Telecom - Services 1.39 0.00
HCL Technologies Ltd. Software 1.15 0.00
Adani Ports & Special economic Zone Transportation 1.09 1.09
Persistent Systems Ltd. Software 1.05 0.00
SBI Life Insurance Company Ltd. Insurance 1.03 0.00
Godrej Consumer Products Ltd. Consumer Non Durables 1.02 0.09
Asian Paints Ltd. Consumer Non Durables 0.99 0.99
Tata Consumer Products Ltd. Consumer Non Durables 0.99 0.00
Cipla Ltd. Pharmaceuticals 0.97 0.00
NTPC Ltd. Power 0.94 0.00
Power Grid Corporation of India Ltd. Power 0.94 0.00
Dr Reddys Laboratories Ltd. Pharmaceuticals 0.90 0.00
Oil & Natural Gas Corporation Ltd. Oil 0.89 0.89
Indusind Bank Ltd. Banks 0.87 0.87
Titan Company Ltd. Consumer Durables 0.87 0.22
emami Ltd. Consumer Non Durables 0.85 0.00
United Spirits Ltd. Consumer Non Durables 0.83 0.83
MTAR Technologies Ltd. Aerospace & Defense 0.77 0.00
Balkrishna Industries Ltd. Auto Ancillaries 0.72 0.00
Hindustan Petroleum Corporation Ltd. Petroleum Products 0.71 0.71
ITC Ltd. Consumer Non Durables 0.70 0.00
UTI Asset Management Company Ltd. Capital Markets 0.63 0.00
Sonata Software Ltd. Software 0.61 0.00
Burger King India Ltd. Leisure Services 0.60 0.00
Bharat electronics Ltd. Aerospace & Defense 0.59 0.00
Coforge Ltd. Software 0.59 0.00
endurance Technologies Ltd. Auto Ancillaries 0.57 0.00
Apollo Hospitals enterprise Ltd. Healthcare Services 0.56 0.00
Bharat Petroleum Corporation Ltd. Petroleum Products 0.55 0.00
Nazara Technologies Ltd. entertainment 0.54 0.00
IIFL Wealth Management Ltd. Finance 0.52 0.00
Aarti Industries Ltd. Chemicals 0.50 0.00
ACC Ltd. Cement & Cement Products 0.50 0.50
Mindtree Consulting Ltd. Software 0.50 0.00
Shaily engineering Plastics Ltd. Industrial Products 0.50 0.00
WABCO India Ltd. Auto Ancillaries 0.50 0.00
Whirlpool of India Ltd. Consumer Durables 0.50 0.00
Gujarat Gas Ltd. Gas 0.49 0.00
Zee entertainment enterprises Ltd. entertainment 0.48 0.48
Trent Ltd. Retailing 0.47 0.00
Suprajit engineering Ltd. Auto Ancillaries 0.46 0.00
Hindustan Aeronautics Ltd. Aerospace & Defense 0.44 0.00
Jamna Auto Industries Ltd. Auto Ancillaries 0.44 0.00
Company Industry+ / Rating % to NAV (Hedged & Unhedged)
% exposure of Derivative
Rossari Biotech Ltd. Chemicals 0.44 0.00
Dabur India Ltd. Consumer Non Durables 0.43 0.00
Tata Consultancy Services Ltd. Software 0.42 0.42
JSW Steel Ltd. Ferrous Metals 0.40 0.40
Repco Home Finance Ltd. Finance 0.37 0.00
Shriram Transport Finance Company Ltd. Finance 0.37 0.00
Oracle Financial Services Software Ltd. Software 0.35 0.00
Bajaj Auto Ltd. Auto 0.29 0.28
The Anup engineering Ltd. Industrial Capital Goods 0.23 0.00
La Opala RG Ltd. Consumer Durables 0.22 0.00
ICICI Lombard General Insurance Company Ltd. Insurance 0.02 0.02
Sub Total 67.06
UNITS ISSUED BY REIT & INVIT
UNITS ISSUED BY INVIT
POWERGRID Infrastructure Investment Trust Power 2.22
Sub Total 2.22
UNITS ISSUED BY REIT
Brookfield India Real estate Trust Construction 1.48
Sub Total 1.48
Total 3.70
DEBT & DEBT RELATED
GOVERNMENT SECURITIES (CENTRAL/STATE)
• 7.27 GOI 2026 Sovereign 4.66
6.17 GOI 2021 Sovereign 1.66
Sub Total 6.32
T-BILLS
364 Days Tbill - Mat 110322 Sovereign 1.08
364 Days Tbill ISD 310321 Mat 300322 Sovereign 1.07
364 Days Tbill Mat 290721 Sovereign 0.55
364 Days Tbill - Mat 170322 Sovereign 0.54
Sub Total 3.24
CREDIT ExPOSURE (NON PERPETUAL)
Housing Development Finance Corporation Ltd.£ CRISIL - AAA 1.23
Vedanta Ltd. CRISIL - AA- 1.12
Power Finance Corporation Ltd. CRISIL - AAA 0.60
INOx Wind Infrastructure Services Ltd. CRISIL - AA(Ce) 0.55
Sub Total 3.50
CREDIT ExPOSURE (PERPETUAL BONDS)
TATA International Ltd. (Perpetual) CARe - A 0.56
Union Bank of India (AT1, BASEL III, Perpetual) CARe - AA- 0.56
Sub Total 1.12
Total 14.18
MUTUAL FUND UNITS
• HDFC Gold Exchange Traded Fund 10.36
Sub Total 10.36
OTHERS
Cash, Cash equivalents and Net Current Assets 4.70
Sub Total 4.70
Grand Total 100.00
• Top Ten Holdings, £ Co-sponsor
Outstanding exposure in derivative instruments (` in Crore) 113.59
Hedged position in Equity & Equity related instruments
Outstanding derivative exposure (% age) 12.55
Face Value per Unit: ` 10 unless otherwise specified, + Industry Classification as recommended by AMFI, Data is as of June 30, 2021 unless otherwise specified.
(An open ended scheme investing in equity and equity related instruments, debt & money market instruments and gold related instruments)HDFC Multi-Asset Fund ...Contd from previous page
PORTFOLIO

June 2021 22
CATEGORY OF SCHEME: ExCHANGE TRADED FUND
KEY FACTSINVESTMENT OBJECTIVEThe investment objective of HDFC NIFTY 50 ETF is to generate returns that are commensurate with the performance of the NIFTY 50 Index, subject to tracking error.There is no assurance that the investment objective of the Scheme will be realized.
FUND MANAGERKrishan Kumar Daga (since December 09, 2015)
Total Experience: Over 22 yearsArun Agarwal (since August 24, 2020)
Total Experience: Over 22 years
INCEPTION DATE (Date of Allotment)December 09, 2015
NAV (AS ON JUNE 30, 2021) NAV PER UNIT (`)Growth Option 167.28
ASSETS UNDER MANAGEMENT j (`) IN CROREAs on June 30, 2021 977.54Average for Month of June 2021 975.33
qUANTITATIVE DATAPortfolio Turnover Ratio (Last 1 year) 14.06%
TRACKING ERRORAnnualised tracking error is calculated based on daily rolling returns for the last 12 months: 0.03%
TOTAL ExPENSE RATIO (As on June 30, 2021)Including Additional expenses and Goods and Service Tax on Management FeesHDFC NIFTY 50 ETF 0.04%
#BENCHMARK INDEx: NIFTY 50 (Total Returns Index)##ADDL. BENCHMARK INDEx: S&P BSe SeNSex (Total Returns Index)
ExIT LOADFor Creation Unit Size:l No exit load will be levied on redemptions made by
Authorised Participants / Large Investors directly with the Fund in Creation Unit Size.
For other than Creation Unit Size:l N.A. The Units of HNETF in other than Creation Unit Size cannot
be directly redeemed with the Fund. These Units can be redeemed (sold) on a continuous basis on
the NSe and BSe during the trading hours on all trading days. Refer SID for further details.For further details, please refer to para ‘Exit Load’ on Pg 68.
PLANS & OPTIONSHDFC NIFTY 50 ETF. Presently the Scheme does not offer any Plans / Options for investmentMINIMUM APPLICATION AMOUNT (Under each Plan / Option)Authorised Participants / Large Investors: Application for subscription of HNETF Units in Creation Unit Size can be made either: (i) in exchange of the Portfolio Deposit; or (ii) by depositing basket of securities comprising NIFTY 50 Index Each Creation Unit Size will consist of 40,000 Units of HNETF and 1 Unit of HNETF will be approximately equal to 1/100th of the value of NIFTY 50 Index. (w.e.f February 19, 2021)Other investors (including Authorised Participants and Large Investors): Units of HNETF can be subscribed (in lots of 1 Unit) during the trading hours on all trading days on the NSe and BSE on which the Units will be listed.
Face Value per Unit: ` 76.125 (w.e.f February 19, 2021), + Industry Classification as recommended by AMFI, Data is as of June 30, 2021 unless otherwise specified.
PERFORMANCE *^
Date Period Scheme Returns
(%)
Benchmark Returns
(%)#
Additional Benchmark
Returns (%) ##
Value of ` 10,000 invested
Scheme (`) Benchmark (`)#
Additional Benchmark
(`)##
Jun 30, 20 Last 1 Year 54.42 54.58 52.38 15,442 15,458 15,238
Jun 29, 18 Last 3 Years 14.82 15.00 15.32 15,147 15,220 15,350
Jun 30, 16 Last 5 Years 14.92 15.08 15.58 20,055 20,191 20,639
Dec 09, 15 Since Inception 15.21 15.39 15.67 21,974 22,165 22,472
Returns greater than 1 year period are compounded annualized (CAGR). * The Scheme does not offer any Plans/Options. For performance of other schemes managed by Krishan Kumar Daga and Arun Agarwal, please refer page 68.
This product is suitable for investors who are seeking ~
l returns that are commensurate with the performance of the NIFTY 50, subject to tracking errors over long term
l investment in equity securities covered by the NIFTY 50
VeryHigh
Low to
Moderate
Low
Moderate ModeratelyHigh High
RISKOMETERInvestors understand that their principal will be at
very high risk
~ Investors should consult their financial advisers, if in doubt about whether the product is suitable for them. ^Past performance may or may not be sustained in the future. Since Inception Date = Date of First allotment in the Scheme / Plan.
Load is not taken into consideration for computation of performance.
j Includes investments made by the schemes of HDFC Mutual Fund aggregating to ` 215.89 Crores
(An open ended scheme replicating / tracking NIFTY 50 index)HDFC NIFTY 50 ETF
Company Industry+ % to NAV
EqUITY & EqUITY RELATED
• Reliance Industries Ltd. Petroleum Products 9.97
• HDFC Bank Ltd. Banks 9.55
• Infosys Ltd. Software 8.56
• Housing Development Finance Corporation Ltd.£
Finance 6.52
• ICICI Bank Ltd. Banks 6.38
• Tata Consultancy Services Ltd. Software 5.06
• Kotak Mahindra Bank Ltd. Banks 3.66
• Hindustan Unilever Ltd. Consumer Non Durables 3.22
• Axis Bank Ltd. Banks 2.82
• Larsen and Toubro Ltd. Construction Project 2.65
ITC Ltd. Consumer Non Durables 2.59
State Bank of India Banks 2.35
Bajaj Finance Ltd. Finance 2.33
Asian Paints Ltd. Consumer Non Durables 1.97
Bharti Airtel Ltd. Telecom - Services 1.81
HCL Technologies Ltd. Software 1.56
Maruti Suzuki India Ltd. Auto 1.46
Tata Steel Ltd. Ferrous Metals 1.33
Wipro Ltd. Software 1.18
UltraTech Cement Ltd. Cement & Cement Products 1.14
Mahindra & Mahindra Ltd. Auto 1.09
Bajaj Finserv Ltd. Insurance 1.07
Sun Pharmaceutical Industries Ltd. Pharmaceuticals 1.07
Titan Company Ltd. Consumer Durables 1.06
Tech Mahindra Ltd. Software 0.99
JSW Steel Ltd. Ferrous Metals 0.97
Dr Reddys Laboratories Ltd. Pharmaceuticals 0.96
Nestle India Ltd. Consumer Non Durables 0.92
Indusind Bank Ltd. Banks 0.90
Tata Motors Ltd. Auto 0.89
Power Grid Corporation of India Ltd. Power 0.87
Grasim Industries Ltd. Cement & Cement Products 0.84
HDFC Life Insurance Company Ltd. Insurance 0.83
Divis Laboratories Ltd. Pharmaceuticals 0.82
NTPC Ltd. Power 0.81
Bajaj Auto Ltd. Auto 0.79
Hindalco Industries Ltd. Non - Ferrous Metals 0.79
Adani Ports & Special economic Zone Transportation 0.76
Cipla Ltd. Pharmaceuticals 0.72
Tata Consumer Products Ltd. Consumer Non Durables 0.66
SBI Life Insurance Company Ltd. Insurance 0.65
Bharat Petroleum Corporation Ltd. Petroleum Products 0.64
Company Industry+ % to NAV
UPL Ltd. Pesticides 0.64
Britannia Industries Ltd. Consumer Non Durables 0.63
Oil & Natural Gas Corporation Ltd. Oil 0.63
Hero MotoCorp Ltd. Auto 0.55
eicher Motors Ltd. Auto 0.54
Shree Cement Ltd. Cement & Cement Products 0.54
Coal India Ltd. Minerals/Mining 0.45
Indian Oil Corporation Ltd. Petroleum Products 0.40
Yes Bank Ltd. Banks @
Sub Total 99.59
DEBT & DEBT RELATED
CREDIT ExPOSURE (NON PERPETUAL)
Britannia Industries Ltd. CRISIL - AAA @
Sub Total @Total @Cash, Cash equivalents and Net Current Assets 0.41
Grand Total 100.00• Top Ten Holdings, £ Co-sponsor, @ Less than 0.01%
PORTFOLIO
Industry Allocation of Equity Holding (% of Net Assets)
0.450.630.640.760.791.061.681.812.302.522.552.653.57
5.328.859.9911.01
17.3525.66
0 5 10 15 20 25 30
Minerals/MiningOil
PesticidesTransportation
Non - Ferrous MetalsConsumer Durables
PowerTelecom - Services
Ferrous MetalsCement & Cement Products
InsuranceConstruction Project
PharmaceuticalsAuto
FinanceConsumer Non Durables
Petroleum ProductsSoftware
Banks

23 June 2021
CATEGORY OF SCHEME: INDEx FUNDCompany Industry+ % to
NAVEqUITY & EqUITY RELATED• Reliance Industries Ltd. Petroleum Products 10.02• HDFC Bank Ltd. Banks 9.59• Infosys Ltd. Software 8.60• Housing Development
Finance Corporation Ltd.£ Finance 6.55• ICICI Bank Ltd. Banks 6.41• Tata Consultancy Services Ltd. Software 5.09• Kotak Mahindra Bank Ltd. Banks 3.67• Hindustan Unilever Ltd. Consumer Non Durables 3.24• Axis Bank Ltd. Banks 2.83• Larsen and Toubro Ltd. Construction Project 2.66ITC Ltd. Consumer Non Durables 2.60State Bank of India Banks 2.36Bajaj Finance Ltd. Finance 2.35Asian Paints Ltd. Consumer Non Durables 1.98Bharti Airtel Ltd. Telecom - Services 1.82HCL Technologies Ltd. Software 1.57Maruti Suzuki India Ltd. Auto 1.47Tata Steel Ltd. Ferrous Metals 1.34Wipro Ltd. Software 1.18UltraTech Cement Ltd. Cement & Cement
Products 1.15Mahindra & Mahindra Ltd. Auto 1.09Bajaj Finserv Ltd. Insurance 1.07Sun Pharmaceutical Industries Ltd. Pharmaceuticals 1.07Titan Company Ltd. Consumer Durables 1.06Tech Mahindra Ltd. Software 1.00Dr Reddys Laboratories Ltd. Pharmaceuticals 0.97JSW Steel Ltd. Ferrous Metals 0.97Nestle India Ltd. Consumer Non Durables 0.92Indusind Bank Ltd. Banks 0.90Tata Motors Ltd. Auto 0.89Power Grid Corporation of India Ltd. Power 0.87Grasim Industries Ltd. Cement & Cement
Products 0.84HDFC Life Insurance Company Ltd. Insurance 0.84Divis Laboratories Ltd. Pharmaceuticals 0.82NTPC Ltd. Power 0.81Hindalco Industries Ltd. Non - Ferrous Metals 0.80Bajaj Auto Ltd. Auto 0.79Adani Ports & Special economic Zone Transportation 0.76Cipla Ltd. Pharmaceuticals 0.72Tata Consumer Products Ltd. Consumer Non Durables 0.66SBI Life Insurance Company Ltd. Insurance 0.65
Company Industry+ % to NAV
Bharat Petroleum Corporation Ltd. Petroleum Products 0.64UPL Ltd. Pesticides 0.64Britannia Industries Ltd. Consumer Non Durables 0.63Oil & Natural Gas Corporation Ltd. Oil 0.63eicher Motors Ltd. Auto 0.55Hero MotoCorp Ltd. Auto 0.55Shree Cement Ltd. Cement & Cement
Products 0.54Coal India Ltd. Minerals/Mining 0.45Indian Oil Corporation Ltd. Petroleum Products 0.40Yes Bank Ltd. Banks @Sub Total 100.01DEBT & DEBT RELATEDCREDIT ExPOSURE (NON PERPETUAL)Britannia Industries Ltd. CRISIL - AAA @Sub Total @Total @Cash, Cash equivalents and Net Current Assets -0.01Grand Total 100.00• Top Ten Holdings, £ Co-sponsor, @ Less than 0.01%
KEY FACTS
INVESTMENT OBJECTIVE
The investment objective of the Scheme is to generate returns that are commensurate with the performance of the NIFTY 50 Index, subject to tracking errors.
There is no assurance that the investment objective of the Scheme will be realized.
FUND MANAGER
Krishan Kumar Daga (since October 19, 2015)
Total Experience: Over 22 years
Arun Agarwal (since August 24, 2020)
Total Experience: Over 22 years
INCEPTION DATE (Date of Allotment)
July 17, 2002
NAV (AS ON JUNE 30, 2021) NAV PER UNIT (`)
Regular Plan - Growth Option 144.5400Direct Plan - Growth Option 146.7214
ASSETS UNDER MANAGEMENT (`) IN CRORE
As on June 30, 2021 3,343.13Average for Month of June 2021 3,292.81
qUANTITATIVE DATA
Portfolio Turnover Ratio (Last 1 year) 14.40%
TRACKING ERROR
Annualised tracking error is calculated based on daily rolling returns for the last 12 months: 0.04%
TOTAL ExPENSE RATIO (As on June 30, 2021)Including Additional expenses and Goods and Service Tax on Management Fees
Regular: 0.40% Direct: 0.20%
#BENCHMARK INDEx: NIFTY 50 (Total Returns Index)
##ADDL. BENCHMARK INDEx: S&P BSe SeNSex (Total Returns Index)
ExIT LOAD
l In respect of each purchase / switch-in of Units, an Exit Load of 0.25% is payable if Units are redeemed / switched-out within 3 days from the date of allotment.
l No exit load is payable if units are redeemed / switched out after 3 days from the date of allotment.
For further details, please refer to para ‘Exit Load’ on Pg 68.
PLANS & OPTIONS
Regular Plan, Direct Plan. Each Plan offers Growth Option only.
MINIMUM APPLICATION AMOUNT
Purchase : ` 5,000 and any amount thereafter.Additional Purchase : ` 1,000 and any amount thereafter.
SIP PERFORMANCE ^ - Regular Plan - Growth Option
Since Inception SIP
15 year SIP
10 year SIP
5 year SIP
3 year SIP
1 year SIP
Total Amount Invested (` ‘000) 2,280.00 1,800.00 1,200.00 600.00 360.00 120.00 Mkt Value As on June 30, 2021 (` ‘000) 9,035.73 4,634.33 2,460.53 905.98 495.27 147.47 Returns (%) 12.96 11.69 13.76 16.51 21.90 45.35 Benchmark Returns (%) # 14.74 12.71 14.36 17.15 22.62 46.03 Additional Benchmark Returns (%) ## 15.14 12.86 14.57 17.48 22.01 42.32
Assuming ` 10,000 invested systematically on the first Business Day of every month over a period of time. CAGR returns are computed after accounting for the cash flow by using xIRR method (investment internal rate of return) for Regular Plan - Growth Option. The above investment simulation is for illustrative purposes only and should not be construed as a promise on minimum returns and safeguard of capital.
PERFORMANCE ^ - Regular Plan - Growth Option
Date Period Scheme Returns
(%)
Benchmark Returns
(%)#
Additional Benchmark
Returns (%) ##
Value of ` 10,000 invested
Scheme (`) Benchmark (`)#
Additional Benchmark
(`)##
Jun 30, 20 Last 1 Year 53.84 54.58 52.38 15,384 15,458 15,238Jun 29, 18 Last 3 Years 14.32 15.00 15.32 14,951 15,220 15,350Jun 30, 16 Last 5 Years 14.44 15.08 15.58 19,640 20,191 20,639Jul 17, 02 Since Inception 14.93 17.06 17.62 139,977 198,304 217,177
Returns greater than 1 year period are compounded annualized (CAGR). Since inception returns are calculated on ` 10.3260 (allotment price). For performance of other schemes managed by Krishan Kumar Daga and Arun Agarwal, please refer page 68. Different plans viz. Regular Plan and Direct Plan have a different expense structure. The expenses of the Direct Plan under the Scheme will be lower to the extent of the distribution expenses / commission charged in the Regular Plan. For Performance of Direct Plan, refer page no. 80.
Face Value per Unit: ` 10.3260, + Industry Classification as recommended by AMFI, Data is as of June 30, 2021 unless otherwise specified.
This product is suitable for investors who are seeking ~
l returns that are commensurate with the performance of the NIFTY 50, subject to tracking errors over long term
l investment in equity securities covered by the NIFTY 50
VeryHigh
Low to
Moderate
Low
Moderate ModeratelyHigh High
RISKOMETERInvestors understand that their principal will be at
very high risk
~ Investors should consult their financial advisers, if in doubt about whether the product is suitable for them. ^Past performance may or may not be sustained in the future. Since Inception Date = Date of First allotment in the Scheme / Plan.
Load is not taken into consideration for computation of performance.
(An open ended scheme replicating / tracking NIFTY 50 index)HDFC Index Fund - NIFTY 50 Plan
PORTFOLIO
Industry Allocation of Equity Holding (% of Net Assets)
0.450.630.640.760.801.061.681.822.312.532.562.663.58
5.348.9010.0311.06
17.4425.76
0 5 10 15 20 25 30
Minerals/MiningOil
PesticidesTransportation
Non - Ferrous MetalsConsumer Durables
PowerTelecom - Services
Ferrous MetalsCement & Cement Products
InsuranceConstruction Project
PharmaceuticalsAuto
FinanceConsumer Non Durables
Petroleum ProductsSoftware
Banks
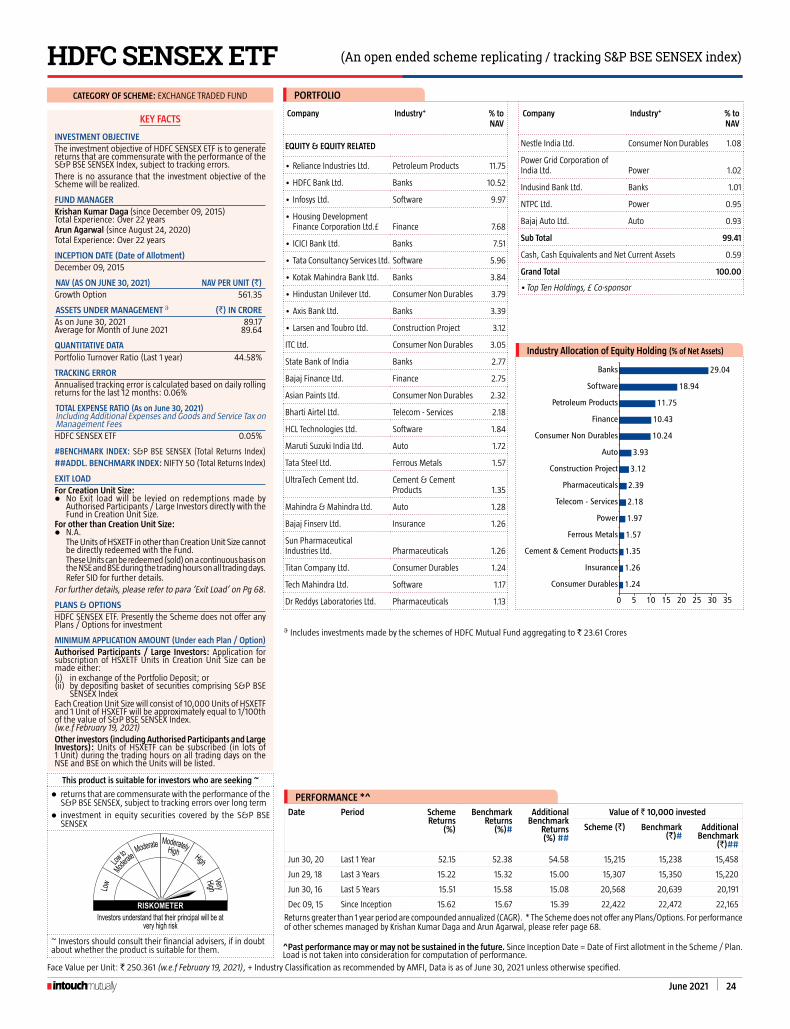
June 2021 24
CATEGORY OF SCHEME: ExCHANGE TRADED FUND
KEY FACTS
INVESTMENT OBJECTIVEThe investment objective of HDFC SENSEx ETF is to generate returns that are commensurate with the performance of the S&P BSe SeNSex Index, subject to tracking errors.There is no assurance that the investment objective of the Scheme will be realized.
FUND MANAGERKrishan Kumar Daga (since December 09, 2015)
Total Experience: Over 22 yearsArun Agarwal (since August 24, 2020)
Total Experience: Over 22 years
INCEPTION DATE (Date of Allotment)December 09, 2015
NAV (AS ON JUNE 30, 2021) NAV PER UNIT (`)Growth Option 561.35
ASSETS UNDER MANAGEMENT j (`) IN CROREAs on June 30, 2021 89.17Average for Month of June 2021 89.64
qUANTITATIVE DATAPortfolio Turnover Ratio (Last 1 year) 44.58%
TRACKING ERRORAnnualised tracking error is calculated based on daily rolling returns for the last 12 months: 0.06%
TOTAL ExPENSE RATIO (As on June 30, 2021)Including Additional expenses and Goods and Service Tax on Management FeesHDFC SeNSex ETF 0.05%
#BENCHMARK INDEx: S&P BSe SeNSex (Total Returns Index)##ADDL. BENCHMARK INDEx: NIFTY 50 (Total Returns Index)
ExIT LOADFor Creation Unit Size:l No exit load will be levied on redemptions made by
Authorised Participants / Large Investors directly with the Fund in Creation Unit Size.
For other than Creation Unit Size:l N.A. The Units of HSxETF in other than Creation Unit Size cannot
be directly redeemed with the Fund. These Units can be redeemed (sold) on a continuous basis on
the NSe and BSe during the trading hours on all trading days. Refer SID for further details.For further details, please refer to para ‘Exit Load’ on Pg 68.
PLANS & OPTIONSHDFC SENSEx ETF. Presently the Scheme does not offer any Plans / Options for investment
MINIMUM APPLICATION AMOUNT (Under each Plan / Option)Authorised Participants / Large Investors: Application for subscription of HSxETF Units in Creation Unit Size can be made either: (i) in exchange of the Portfolio Deposit; or (ii) by depositing basket of securities comprising S&P BSe
SeNSex IndexEach Creation Unit Size will consist of 10,000 Units of HSxETF and 1 Unit of HSxETF will be approximately equal to 1/100th of the value of S&P BSe SeNSex Index.(w.e.f February 19, 2021) Other investors (including Authorised Participants and Large Investors): Units of HSxETF can be subscribed (in lots of 1 Unit) during the trading hours on all trading days on the NSE and BSE on which the Units will be listed.
Face Value per Unit: ` 250.361 (w.e.f February 19, 2021), + Industry Classification as recommended by AMFI, Data is as of June 30, 2021 unless otherwise specified.
PERFORMANCE *^
Date Period Scheme Returns
(%)
Benchmark Returns
(%)#
Additional Benchmark
Returns (%) ##
Value of ` 10,000 invested
Scheme (`) Benchmark (`)#
Additional Benchmark
(`)##
Jun 30, 20 Last 1 Year 52.15 52.38 54.58 15,215 15,238 15,458
Jun 29, 18 Last 3 Years 15.22 15.32 15.00 15,307 15,350 15,220
Jun 30, 16 Last 5 Years 15.51 15.58 15.08 20,568 20,639 20,191
Dec 09, 15 Since Inception 15.62 15.67 15.39 22,422 22,472 22,165
Returns greater than 1 year period are compounded annualized (CAGR). * The Scheme does not offer any Plans/Options. For performance of other schemes managed by Krishan Kumar Daga and Arun Agarwal, please refer page 68.
This product is suitable for investors who are seeking ~
l returns that are commensurate with the performance of the S&P BSe SeNSex, subject to tracking errors over long term
l investment in equity securities covered by the S&P BSe SeNSex
VeryHigh
Low to
Moderate
Low
Moderate ModeratelyHigh High
RISKOMETERInvestors understand that their principal will be at
very high risk
~ Investors should consult their financial advisers, if in doubt about whether the product is suitable for them. ^Past performance may or may not be sustained in the future. Since Inception Date = Date of First allotment in the Scheme / Plan.
Load is not taken into consideration for computation of performance.
j Includes investments made by the schemes of HDFC Mutual Fund aggregating to ` 23.61 Crores
(An open ended scheme replicating / tracking S&P BSE SENSEX index)HDFC SENSEX ETF
Company Industry+ % to NAV
EqUITY & EqUITY RELATED
• Reliance Industries Ltd. Petroleum Products 11.75
• HDFC Bank Ltd. Banks 10.52
• Infosys Ltd. Software 9.97
• Housing Development Finance Corporation Ltd.£ Finance 7.68
• ICICI Bank Ltd. Banks 7.51
• Tata Consultancy Services Ltd. Software 5.96
• Kotak Mahindra Bank Ltd. Banks 3.84
• Hindustan Unilever Ltd. Consumer Non Durables 3.79
• Axis Bank Ltd. Banks 3.39
• Larsen and Toubro Ltd. Construction Project 3.12
ITC Ltd. Consumer Non Durables 3.05
State Bank of India Banks 2.77
Bajaj Finance Ltd. Finance 2.75
Asian Paints Ltd. Consumer Non Durables 2.32
Bharti Airtel Ltd. Telecom - Services 2.18
HCL Technologies Ltd. Software 1.84
Maruti Suzuki India Ltd. Auto 1.72
Tata Steel Ltd. Ferrous Metals 1.57
UltraTech Cement Ltd. Cement & Cement Products 1.35
Mahindra & Mahindra Ltd. Auto 1.28
Bajaj Finserv Ltd. Insurance 1.26
Sun Pharmaceutical Industries Ltd. Pharmaceuticals 1.26
Titan Company Ltd. Consumer Durables 1.24
Tech Mahindra Ltd. Software 1.17
Dr Reddys Laboratories Ltd. Pharmaceuticals 1.13
Company Industry+ % to NAV
Nestle India Ltd. Consumer Non Durables 1.08
Power Grid Corporation of India Ltd. Power 1.02
Indusind Bank Ltd. Banks 1.01
NTPC Ltd. Power 0.95
Bajaj Auto Ltd. Auto 0.93
Sub Total 99.41
Cash, Cash equivalents and Net Current Assets 0.59
Grand Total 100.00
• Top Ten Holdings, £ Co-sponsor
PORTFOLIO
Industry Allocation of Equity Holding (% of Net Assets)
1.24
1.26
1.35
1.57
1.97
2.18
2.39
3.12
3.93
10.24
10.43
11.75
18.94
29.04
0 5 10 15 20 25 30 35
Consumer Durables
Insurance
Cement & Cement Products
Ferrous Metals
Power
Telecom - Services
Pharmaceuticals
Construction Project
Auto
Consumer Non Durables
Finance
Petroleum Products
Software
Banks
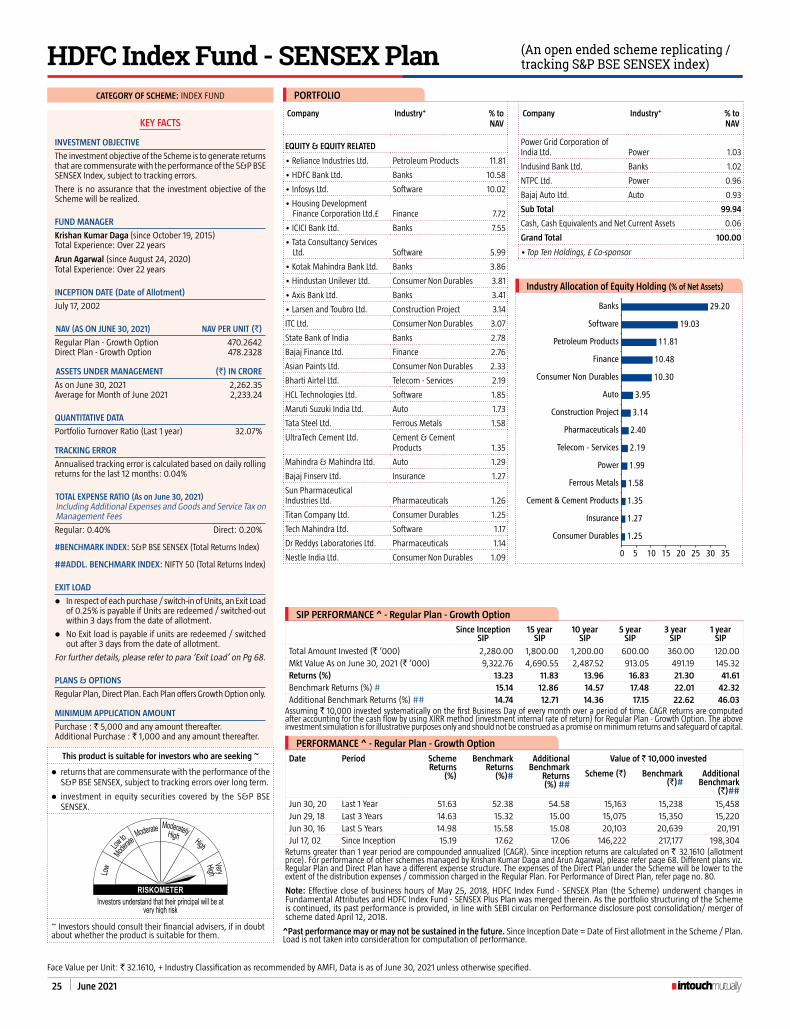
25 June 2021
CATEGORY OF SCHEME: INDEx FUND
KEY FACTS
INVESTMENT OBJECTIVE
The investment objective of the Scheme is to generate returns that are commensurate with the performance of the S&P BSe SeNSex Index, subject to tracking errors.
There is no assurance that the investment objective of the Scheme will be realized.
FUND MANAGER
Krishan Kumar Daga (since October 19, 2015)
Total Experience: Over 22 years
Arun Agarwal (since August 24, 2020)
Total Experience: Over 22 years
INCEPTION DATE (Date of Allotment)
July 17, 2002
NAV (AS ON JUNE 30, 2021) NAV PER UNIT (`)
Regular Plan - Growth Option 470.2642Direct Plan - Growth Option 478.2328
ASSETS UNDER MANAGEMENT (`) IN CRORE
As on June 30, 2021 2,262.35Average for Month of June 2021 2,233.24
qUANTITATIVE DATA
Portfolio Turnover Ratio (Last 1 year) 32.07%
TRACKING ERROR
Annualised tracking error is calculated based on daily rolling returns for the last 12 months: 0.04%
TOTAL ExPENSE RATIO (As on June 30, 2021)Including Additional expenses and Goods and Service Tax on Management Fees
Regular: 0.40% Direct: 0.20%
#BENCHMARK INDEx: S&P BSe SeNSex (Total Returns Index)
##ADDL. BENCHMARK INDEx: NIFTY 50 (Total Returns Index)
ExIT LOAD
l In respect of each purchase / switch-in of Units, an Exit Load of 0.25% is payable if Units are redeemed / switched-out within 3 days from the date of allotment.
l No exit load is payable if units are redeemed / switched out after 3 days from the date of allotment.
For further details, please refer to para ‘Exit Load’ on Pg 68.
PLANS & OPTIONS
Regular Plan, Direct Plan. Each Plan offers Growth Option only.
MINIMUM APPLICATION AMOUNT
Purchase : ` 5,000 and any amount thereafter.Additional Purchase : ` 1,000 and any amount thereafter.
SIP PERFORMANCE ^ - Regular Plan - Growth Option
Since Inception SIP
15 year SIP
10 year SIP
5 year SIP
3 year SIP
1 year SIP
Total Amount Invested (` ‘000) 2,280.00 1,800.00 1,200.00 600.00 360.00 120.00 Mkt Value As on June 30, 2021 (` ‘000) 9,322.76 4,690.55 2,487.52 913.05 491.19 145.32 Returns (%) 13.23 11.83 13.96 16.83 21.30 41.61 Benchmark Returns (%) # 15.14 12.86 14.57 17.48 22.01 42.32 Additional Benchmark Returns (%) ## 14.74 12.71 14.36 17.15 22.62 46.03
Assuming ` 10,000 invested systematically on the first Business Day of every month over a period of time. CAGR returns are computed after accounting for the cash flow by using xIRR method (investment internal rate of return) for Regular Plan - Growth Option. The above investment simulation is for illustrative purposes only and should not be construed as a promise on minimum returns and safeguard of capital.
Face Value per Unit: ` 32.1610, + Industry Classification as recommended by AMFI, Data is as of June 30, 2021 unless otherwise specified.
This product is suitable for investors who are seeking ~
l returns that are commensurate with the performance of the S&P BSe SeNSex, subject to tracking errors over long term.
l investment in equity securities covered by the S&P BSe SeNSex.
VeryHigh
Low to
Moderate
Low
Moderate ModeratelyHigh High
RISKOMETERInvestors understand that their principal will be at
very high risk
~ Investors should consult their financial advisers, if in doubt about whether the product is suitable for them. ^Past performance may or may not be sustained in the future. Since Inception Date = Date of First allotment in the Scheme / Plan.
Load is not taken into consideration for computation of performance.
PERFORMANCE ^ - Regular Plan - Growth Option
Date Period Scheme Returns
(%)
Benchmark Returns
(%)#
Additional Benchmark
Returns (%) ##
Value of ` 10,000 invested
Scheme (`) Benchmark (`)#
Additional Benchmark
(`)##
Jun 30, 20 Last 1 Year 51.63 52.38 54.58 15,163 15,238 15,458Jun 29, 18 Last 3 Years 14.63 15.32 15.00 15,075 15,350 15,220Jun 30, 16 Last 5 Years 14.98 15.58 15.08 20,103 20,639 20,191Jul 17, 02 Since Inception 15.19 17.62 17.06 146,222 217,177 198,304
Returns greater than 1 year period are compounded annualized (CAGR). Since inception returns are calculated on ` 32.1610 (allotment price). For performance of other schemes managed by Krishan Kumar Daga and Arun Agarwal, please refer page 68. Different plans viz. Regular Plan and Direct Plan have a different expense structure. The expenses of the Direct Plan under the Scheme will be lower to the extent of the distribution expenses / commission charged in the Regular Plan. For Performance of Direct Plan, refer page no. 80.
Note: Effective close of business hours of May 25, 2018, HDFC Index Fund - SENSEx Plan (the Scheme) underwent changes in Fundamental Attributes and HDFC Index Fund - SENSEx Plus Plan was merged therein. As the portfolio structuring of the Scheme is continued, its past performance is provided, in line with SeBI circular on Performance disclosure post consolidation/ merger of scheme dated April 12, 2018.
(An open ended scheme replicating / tracking S&P BSE SENSEX index)HDFC Index Fund - SENSEX Plan
Company Industry+ % to NAV
EqUITY & EqUITY RELATED
• Reliance Industries Ltd. Petroleum Products 11.81
• HDFC Bank Ltd. Banks 10.58
• Infosys Ltd. Software 10.02
• Housing Development Finance Corporation Ltd.£ Finance 7.72
• ICICI Bank Ltd. Banks 7.55
• Tata Consultancy Services Ltd. Software 5.99
• Kotak Mahindra Bank Ltd. Banks 3.86
• Hindustan Unilever Ltd. Consumer Non Durables 3.81
• Axis Bank Ltd. Banks 3.41
• Larsen and Toubro Ltd. Construction Project 3.14
ITC Ltd. Consumer Non Durables 3.07
State Bank of India Banks 2.78
Bajaj Finance Ltd. Finance 2.76
Asian Paints Ltd. Consumer Non Durables 2.33
Bharti Airtel Ltd. Telecom - Services 2.19
HCL Technologies Ltd. Software 1.85
Maruti Suzuki India Ltd. Auto 1.73
Tata Steel Ltd. Ferrous Metals 1.58
UltraTech Cement Ltd. Cement & Cement Products 1.35
Mahindra & Mahindra Ltd. Auto 1.29
Bajaj Finserv Ltd. Insurance 1.27
Sun Pharmaceutical Industries Ltd. Pharmaceuticals 1.26
Titan Company Ltd. Consumer Durables 1.25
Tech Mahindra Ltd. Software 1.17
Dr Reddys Laboratories Ltd. Pharmaceuticals 1.14
Nestle India Ltd. Consumer Non Durables 1.09
Company Industry+ % to NAV
Power Grid Corporation of India Ltd. Power 1.03
Indusind Bank Ltd. Banks 1.02
NTPC Ltd. Power 0.96
Bajaj Auto Ltd. Auto 0.93
Sub Total 99.94
Cash, Cash equivalents and Net Current Assets 0.06
Grand Total 100.00
• Top Ten Holdings, £ Co-sponsor
PORTFOLIO
Industry Allocation of Equity Holding (% of Net Assets)
1.25
1.27
1.35
1.58
1.99
2.19
2.40
3.14
3.95
10.30
10.48
11.81
19.03
29.20
0 5 10 15 20 25 30 35
Consumer Durables
Insurance
Cement & Cement Products
Ferrous Metals
Power
Telecom - Services
Pharmaceuticals
Construction Project
Auto
Consumer Non Durables
Finance
Petroleum Products
Software
Banks

June 2021 26
CATEGORY OF SCHEME: EqUITY LINKED SAVINGS SCHEME
KEY FACTS
INVESTMENT OBJECTIVE
To generate capital appreciation / income from a portfolio, comprising predominantly of equity & equity related instruments.There is no assurance that the investment objective of the Scheme will be realized.
FUND MANAGER ¥
Amit B. Ganatra (since August 24, 2020)
Total Experience: Over 17 years
INCEPTION DATE (Date of Allotment)
March 31, 1996
NAV (AS ON JUNE 30, 2021) NAV PER UNIT (`)
Regular Plan - Growth Option 645.699Regular Plan - IDCW Option 51.902Direct Plan - Growth Option 680.202Direct Plan - IDCW Option 62.786
ASSETS UNDER MANAGEMENT (`) IN CRORE
As on June 30, 2021 8,577.31Average for Month of June 2021 8,508.48
qUANTITATIVE DATA
Portfolio Turnover Ratio (Last 1 year) 42.26%
Risk Ration Standard Deviation 6.541%n Beta 0.971n Sharpe Ratio* 0.104
Computed for the 3-yr period ended June 30, 2021. Based on month-end NAV. * Risk free rate: 3.36%(Source: FIMMDA MIBOR)
TOTAL ExPENSE RATIO (As on June 30, 2021)Including Additional expenses and Goods and Service Tax on Management Fees
Regular: 1.80% Direct: 1.30%
#BENCHMARK INDEx: NIFTY 500 (Total Returns Index)
##ADDL. BENCHMARK INDEx: NIFTY 50 (Total Returns Index)
ExIT LOAD
Nil
PLANS & OPTIONS
Regular Plan, Direct Plan. Under Each Plan: Growth & Income Distribution cum Capital Withdrawal (IDCW) Option. The IDCW Option offers Payout of Income Distribution cum Capital Withdrawal (IDCW) Option.
MINIMUM APPLICATION AMOUNT
Purchase : ` 500 and in multiples of ` 500 thereafter.Additional Purchase : ̀ 500 and in multiples of ̀ 500 thereafter.
LOCK-IN PERIOD
3 years from the date of allotment of the respective Units
¥ Dedicated Fund Manager for Overseas Investments: Mr. Sankalp Baid (since January 22, 2021) (Total Experience: Over 13 years).
SIP PERFORMANCE ^ - Regular Plan - Growth OptionSince Inception
SIP15 year
SIP10 year
SIP5 year
SIP3 year
SIP1 year
SIPTotal Amount Invested (` ‘000) 3,030.00 1,800.00 1,200.00 600.00 360.00 120.00 Mkt Value As on June 30, 2021 (` ‘000) $$ 82,283.86 4,704.78 2,223.12 799.56 470.86 150.46 Returns (%) $$ 21.35 11.86 11.86 11.44 18.27 50.57 Benchmark Returns (%) # 15.45 13.24 15.18 17.53 25.01 54.41 Additional Benchmark Returns (%) ## 14.29 12.71 14.36 17.15 22.62 46.03
Assuming ` 10,000 invested systematically on the first Business Day of every month over a period of time. CAGR returns are computed after accounting for the cash flow by using xIRR method (investment internal rate of return) for Regular Plan - Growth Option. The above investment simulation is for illustrative purposes only and should not be construed as a promise on minimum returns and safeguard of capital.
PERFORMANCE ^ - Regular Plan - Growth OptionDate Period Scheme
Returns (%) $$
Benchmark Returns
(%)#
Additional Benchmark
Returns (%) ##
Value of ` 10,000 investedScheme (`)
$$Benchmark
(`)#Additional
Benchmark (`)##
Jun 30, 20 Last 1 Year 51.98 60.77 54.58 15,198 16,077 15,458Jun 29, 18 Last 3 Years 9.19 15.00 15.00 13,025 15,220 15,220Jun 30, 16 Last 5 Years 10.88 15.40 15.08 16,761 20,473 20,191Mar 31, 96 Since Inception 22.33 14.22 12.92 1,628,829 287,697 215,449
Returns greater than 1 year period are compounded annualized (CAGR). $$ All Dividends declared prior to the splitting of the Scheme into IDCW & Growth Options are assumed to be reinvested in the units of the Scheme at the then prevailing NAV (ex-dividend NAV). For performance of other schemes managed by Amit B. Ganatra, please refer page 68. Different plans viz. Regular Plan and Direct Plan have a different expense structure. The expenses of the Direct Plan under the Scheme will be lower to the extent of the distribution expenses / commission charged in the Regular Plan. For Performance of Direct Plan, refer page no. 78. As TRI data is not available since inception of the scheme, additional benchmark performance is calculated using composite CAGR of NIFTY 50 PRI values from Mar 29, 96 (Data for March 31, 96 is not available) to Jun 29, 99 and TRI values since Jun 30, 99. As NIFTY 500 TRI data is not available for March 31, 96, benchmark performance is calculated from March 29, 96.
Face Value per Unit: ` 10 unless otherwise specified, + Industry Classification as recommended by AMFI, Data is as of June 30, 2021 unless otherwise specified.
This product is suitable for investors who are seeking ~
l to generate long-term capital appreciation / income
l investment predominantly of equity & equity related instruments
VeryHigh
Low to
Moderate
Low
Moderate ModeratelyHigh High
RISKOMETERInvestors understand that their principal will be at
very high risk
~ Investors should consult their financial advisers, if in doubt about whether the product is suitable for them. ^Past performance may or may not be sustained in the future. Since Inception Date = Date of First allotment in the Scheme / Plan.
Load is not taken into consideration for computation of performance.
(An open ended equity linked savings scheme with a statutory lock in of 3 years and tax benefit)HDFC TaxSaver
Company Industry+ % to NAVEqUITY & EqUITY RELATED• Infosys Ltd. Software 9.50• HDFC Bank Ltd. Banks 8.87• ICICI Bank Ltd. Banks 8.66• Reliance Industries Ltd. Petroleum Products 4.28• Bharti Airtel Ltd. Telecom - Services 3.67• Axis Bank Ltd. Banks 3.35• Hindustan Unilever Ltd. Consumer Non Durables 2.72• State Bank of India Banks 2.65• Bharat Petroleum
Corporation Ltd. Petroleum Products 2.52• Persistent Systems Ltd. Software 2.26Cipla Ltd. Pharmaceuticals 2.06Larsen and Toubro Ltd. Construction Project 1.95NTPC Ltd. Power 1.93Tata Steel Ltd. Ferrous Metals 1.85HCL Technologies Ltd. Software 1.70Tata Consumer Products Ltd. Consumer Non Durables 1.70Crompton Greaves Consumer electricals Ltd. Consumer Durables 1.59L&T Technology Services Ltd. Software 1.55Ambuja Cements Ltd. Cement & Cement
Products 1.50Maruti Suzuki India Ltd. Auto 1.50Lupin Ltd. Pharmaceuticals 1.45Voltas Ltd. Consumer Durables 1.40Apollo Hospitals enterprise Ltd. Healthcare Services 1.32Torrent Pharmaceuticals Ltd. Pharmaceuticals 1.32Tata Motors Ltd. Auto 1.18Bharat electronics Ltd. Aerospace & Defense 1.15Computer Age Management Services Capital Markets 1.08United Spirits Ltd. Consumer Non Durables 1.06PI Industries Ltd. Pesticides 1.04endurance Technologies Ltd. Auto Ancillaries 1.03Titan Company Ltd. Consumer Durables 0.99HDFC Life Insurance Company Ltd. Insurance 0.96The Phoenix Mills Ltd. Construction 0.95Dabur India Ltd. Consumer Non Durables 0.92GAIL (India) Ltd. Gas 0.88Power Grid Corporation of India Ltd. Power 0.87Indian Railway Catering and Tourism Corporation Ltd. Transportation 0.81Hindustan Petroleum Corporation Ltd. Petroleum Products 0.80TCI express Ltd. Transportation 0.78Mahanagar Gas Ltd. Gas 0.77SBI Cards and Payment Services Ltd. Finance 0.77Sona Blw Precision Forgings Auto Ancillaries 0.76ITC Ltd. Consumer Non Durables 0.74Timken India Ltd. Industrial Products 0.72Trent Ltd. Retailing 0.71Multi Commodity exchange of India Ltd. Capital Markets 0.70
Company Industry+ % to NAVHousing Development Finance Corporation Ltd.£ Finance 0.67Kalpataru Power Transmission Ltd. Power 0.63Whirlpool of India Ltd. Consumer Durables 0.61Tata Communications Ltd. Telecom - Services 0.60Teamlease Services Ltd. Commercial Services 0.56Procter & Gamble Health Ltd. Pharmaceuticals 0.55AIA engineering Ltd. Industrial Products 0.52Syngene International Ltd. Healthcare Services 0.51Solar Industries India Ltd. Chemicals 0.46WABCO India Ltd. Auto Ancillaries 0.41Dixon Technologies (India) Ltd. Consumer Durables 0.32Sadbhav engineering Ltd. Construction Project 0.31Hindustan Construction Company Ltd. Construction Project 0.23Somany Home Innovation Ltd. Consumer Durables 0.13MTAR Technologies Ltd. Aerospace & Defense 0.12Sadbhav Infrastructure Project Ltd. (Corporate Guarantee of Sadbhav engineering Ltd.) Construction Project 0.10MPS Ltd. Other Consumer Services 0.05Sub Total 97.75Cash, Cash equivalents and Net Current Assets 2.25Grand Total 100.00• Top Ten Holdings, £ Co-sponsor
PORTFOLIO
Industry Allocation of Equity Holding (% of Net Assets)
0.050.460.560.710.950.961.041.241.271.441.501.591.651.781.831.852.202.592.683.434.275.045.38
7.147.60
15.0123.53
0 5 10 15 20 25Other Consumer Services
ChemicalsCommercial Services
RetailingConstruction
InsurancePesticides
Industrial ProductsAerospace & Defense
FinanceCement & Cement Products
TransportationGas
Capital MarketsHealthcare Services
Ferrous MetalsAuto Ancillaries
Construction ProjectAuto
PowerTelecom - Services
Consumer DurablesPharmaceuticals
Consumer Non DurablesPetroleum Products
SoftwareBanks

27 June 2021
CATEGORY OF SCHEME: CHILDREN’S FUND
KEY FACTS
INVESTMENT OBJECTIVE
To generate capital appreciation / income from a portfolio of equity & equity related instruments and debt and money market instruments.
There is no assurance that the investment objective of the Scheme will be realized.
FUND MANAGER ¥
Chirag Setalvad (since April 2, 2007)
Total experience - Over 21 years
INCEPTION DATE (Date of Allotment)
March 2, 2001
NAV (AS ON JUNE 30, 2021) NAV PER UNIT (`)
Regular Plan 171.664Direct Plan 183.987
ASSETS UNDER MANAGEMENT (`) IN CRORE
As on June 30, 2021 4,835.85Average for Month of June 2021 4,759.71
qUANTITATIVE DATA
Portfolio Turnover Ratio (Last 1 year) 7.98%Average Maturity * 3.24 yearsMacaulay Duration * 2.44 yearsModified Duration * 2.30 yearsYield to Maturity * 5.02%*Calculated on amount invested in debt securities (including accrued interest), deployment of funds in TRePS and Reverse Repo and net receivable / payable.
TOTAL ExPENSE RATIO (As on June 30, 2021)Including Additional expenses and Goods and Service Tax on Management Fees
Regular: 1.96% Direct: 1.09%
#BENCHMARK INDEx: NIFTY 50 Hybrid Composite Debt 65:35 Index
##ADDL. BENCHMARK INDEx: NIFTY 50 (Total Returns Index)
ExIT LOAD
Nil
PLANS & OPTIONS
Regular Plan, Direct Plan.
MINIMUM APPLICATION AMOUNT
Purchase : ` 5,000 and any amount thereafter.Additional Purchase : ` 1,000 and any amount thereafter.
LOCK-IN PERIOD
Fresh investments by investors including SIP/ STP registrations, etc (effective May 23, 2018):Lock-in period will be compulsory. Lock-in period shall be earlier ofl 5 Years from the date of allotment; orl Until the Unit holder (being the beneficiary child) attains
the age of majority (i.e. completion of 18 years)¥ Dedicated Fund Manager for Overseas Investments: Mr. Sankalp Baid (since January 22, 2021) (Total Experience: Over 13 years).
(Ω) Eligibility (of Unit holder) : Children less than 18 years of age as on the date of investment by the Investor / Applicant are eligible as Unit holders in the Scheme. (π) Personal Accident Insurance Cover for Parent / Legal Guardian (upto the age of 80 years) of the Unit holder, equivalent to 10 times the cost value of the outstanding Units held by the Unit holder under all the applications / account statements / folios, subject to a maximum amount of ` 10 lakhs per Unit holder. The insurance premium in respect of the personal accident insurance cover will be borne by the AMC. This accident insurance cover is subject to conditions of the group personal accident insurance policy.
Face Value per Unit: ` 10 unless otherwise specified, + Industry Classification as recommended by AMFI, Data is as of June 30, 2021 unless otherwise specified.
[An open ended fund for investment for children having a lock-in for atleast 5 years or till the child attains age of majority (whichever is earlier)] ΩπHDFC Children's Gift Fund
Company Industry+ / Rating % to NAV
EqUITY & EqUITY RELATED
• HDFC Bank Ltd. Banks 6.13
• Reliance Industries Ltd. Petroleum Products 5.32
• Infosys Ltd. Software 5.25
• ICICI Bank Ltd. Banks 4.55
• Housing Development Finance Corporation Ltd.£ Finance 3.69
• Bajaj Finance Ltd. Finance 2.49
• State Bank of India Banks 2.06
Kirloskar Pneumatic Ltd. Industrial Products 2.04
Larsen and Toubro Ltd. Construction Project 1.95
Newgen Software Technologies Ltd. Software 1.95
Coforge Ltd. Software 1.72
ITC Ltd. Consumer Non Durables 1.63
eClerx Services Ltd. Software 1.56
UPL Ltd. Pesticides 1.48
Bharat electronics Ltd. Aerospace & Defense 1.47
Aurobindo Pharma Ltd. Pharmaceuticals 1.18
Oracle Financial Services Software Ltd. Software 1.13
Apollo Tyres Ltd. Auto Ancillaries 1.11
Balkrishna Industries Ltd. Auto Ancillaries 1.11
Century Plyboards (India) Ltd. Consumer Durables 1.08
Finolex Industries Ltd. Industrial Products 1.08
Bharti Airtel Ltd. Telecom - Services 1.07
Motherson Sumi Systems Ltd. Auto Ancillaries 1.05
Prince Pipes and Fittings Ltd. Industrial Products 1.03
Aster DM Healthcare Ltd. Healthcare Services 0.99
Sonata Software Ltd. Software 0.96
Tata Steel Ltd. Ferrous Metals 0.93
Ipca Laboratories Ltd. Pharmaceuticals 0.85
Carborundum Universal Ltd. Industrial Products 0.78
Power Grid Corporation of India Ltd. Power 0.77
PNC Infratech Ltd. Construction 0.69
Indian Hotels Company Ltd. Leisure Services 0.68
Voltamp Transformers Ltd. Industrial Capital Goods 0.66
Axis Bank Ltd. Banks 0.64
Mahindra Holidays & Resorts Ind Ltd. Leisure Services 0.61
Zensar Technologies Ltd. Software 0.50
Bank of Baroda Banks 0.49
Bharat Petroleum Corporation Ltd. Petroleum Products 0.48
Company Industry+ / Rating % to NAV
Cholamandalam Financial Holdings Ltd. Finance 0.45
SKF India Ltd. Industrial Products 0.45
Swaraj engines Ltd. Industrial Products 0.44
VST Industries Ltd. Consumer Non Durables 0.38
Vesuvius India Ltd. Industrial Products 0.29
Navneet education Ltd. Printing & Publication 0.22
Jagran Prakashan Ltd. Media 0.09
Sadbhav engineering Ltd. Construction Project 0.08
Yes Bank Ltd. Banks 0.01
Sub Total 65.57
DEBT & DEBT RELATED
GOVERNMENT SECURITIES (CENTRAL/STATE)
• 7.17 GOI 2028 Sovereign 3.57
8.28 GOI 2027 Sovereign 1.03
8.32 GOI 2032 Sovereign 0.70
6.79 GOI 2027 Sovereign 0.64
8.83 GOI 2023 Sovereign 0.60
8.15 GOI 2022 Sovereign 0.32
8.08 GOI 2022 Sovereign 0.22
8.6 GOI 2028 Sovereign 0.12
7.26 GOI 2029 Sovereign 0.11
8.2 GOI 2022 Sovereign 0.05
Sub Total 7.36
CREDIT ExPOSURE (NON PERPETUAL)
• Housing Development Finance Corporation Ltd.£ CRISIL - AAA 2.67
LIC Housing Finance Ltd. CRISIL - AAA 1.10
L&T Finance Ltd. CRISIL - AAA 0.85
Tata Sons Ltd. CRISIL - AAA 0.79
State Bank of India CRISIL - AAA 0.54
Power Finance Corporation Ltd. CRISIL - AAA 0.05
Britannia Industries Ltd. CRISIL - AAA 0.01
Sub Total 6.01
CREDIT ExPOSURE (PERPETUAL BONDS)
• Axis Bank Ltd. (AT1, BASeL III, Perpetual) CRISIL - AA+ 2.09
Bank of Baroda (AT1, BASeL III, Perpetual) CRISIL - AA+ 2.04
ICICI Bank Ltd. (AT1, BASeL III, Perpetual) CARE - AA+ 0.85
Sub Total 4.98
Total 18.35
Cash, Cash equivalents and Net Current Assets 16.08
Grand Total 100.00
• Top Ten Holdings, £ Co-sponsor
PORTFOLIO

June 2021 28
Face Value per Unit: ` 10 unless otherwise specified, + Industry Classification as recommended by AMFI, Data is as of June 30, 2021 unless otherwise specified.
This product is suitable for investors who are seeking ~
l capital appreciation over long term.
l investment in equity and equity related instruments as well as debt and money market instruments.
VeryHigh
Low to
Moderate
Low
Moderate ModeratelyHigh High
RISKOMETERInvestors understand that their principal will be at
very high risk
~ Investors should consult their financial advisers, if in doubt about whether the product is suitable for them.
SIP PERFORMANCE ^ - Regular Plan - Growth Option
Since Inception SIP 15 year SIP 10 year SIP 5 Year SIP 3 Year SIP 1 Year SIP
Total Amount Invested (` ‘000) 2,440.00 1,800.00 1,200.00 600.00 360.00 120.00
Mkt Value As on June 30, 2021 (` ‘000) $ 16,051.13 6,390.72 2,680.56 899.91 501.82 148.51
Returns (%) $ 16.11 15.41 15.36 16.24 22.85 47.15
Benchmark Returns (%) # N.A. 11.72 12.83 14.77 18.62 30.35
Additional Benchmark Returns (%) ## 15.10 12.71 14.36 17.15 22.62 46.03
Assuming ̀ 10,000 invested systematically on the first Business Day of every month over a period of time. CAGR returns are computed after accounting for the cash flow by using xIRR method (investment internal rate of return) for Regular Plan - Growth Option. The above investment simulation is for illustrative purposes only and should not be construed as a promise on minimum returns and safeguard of capital. N.A. Not Available.
PERFORMANCE ^ - Regular Plan - Growth Option
Date Period Scheme Returns
(%) $
Benchmark Returns
(%)#
Additional Benchmark
Returns(%) ##
Value of ` 10,000 invested
Scheme (`) $
Benchmark (`)#
Additional Benchmark(`)##
Jun 30, 20 Last 1 Year 50.02 35.83 54.58 15,002 13,583 15,458
Jun 29, 18 Last 3 Years 14.60 14.07 15.00 15,063 14,854 15,220
Jun 30, 16 Last 5 Years 14.35 13.25 15.08 19,558 18,635 20,191
Mar 02, 01 Since Inception 16.49 N.A. 14.62 223,163 N.A. 160,400
Returns greater than 1 year period are compounded annualized (CAGR). N.A. Not Available. Scheme performance may not strictly be comparable with that of its Additional Benchmark in view of balanced nature of the scheme where a portion of scheme’s investments are made in debt instruments. $ Adjusted for Bonus units declared under the Scheme. For performance of other schemes managed by Chirag Setalvad, please refer page 48. Different plans viz. Regular Plan and Direct Plan have a different expense structure. The expenses of the Direct Plan under the Scheme will be lower to the extent of the distribution expenses / commission charged in the Regular Plan. For Performance of Direct Plan, refer page no. 73.
^Past performance may or may not be sustained in the future. Since Inception Date = Date of First allotment in the Scheme / Plan. Load is not taken into consideration for computation of performance.
Portfolio Classification By Asset Class (%)
equity 65.57
G-Sec 7.36
Credit exposure 10.99
Cash, Cash equivalents and Net Current Assets 16.08
Portfolio Classification By Rating Class (%)
equity 65.57
Sovereign 7.36
AAA/AAA(SO)/A1+/A1+(SO) & equivalent 6.01
AA+ 4.98
Cash, Cash equivalents and Net Current Assets 16.08
[An open ended fund for investment for children having a lock-in for atleast 5 years or till the child attains age of majority (whichever is earlier)] ΩπHDFC Children's Gift Fund .....Contd from previous page
Industry Allocation of Equity Holding (% of Net Assets)
0.09
0.22
0.66
0.69
0.77
0.93
0.99
1.07
1.08
1.29
1.47
1.48
2.01
2.03
2.03
3.27
5.80
6.11
6.63
13.07
13.88
0 2 4 6 8 10 12 14 16
Media
Printing & Publication
Industrial Capital Goods
Construction
Power
Ferrous Metals
Healthcare Services
Telecom - Services
Consumer Durables
Leisure Services
Aerospace & Defense
Pesticides
Consumer Non Durables
Construction Project
Pharmaceuticals
Auto Ancillaries
Petroleum Products
Industrial Products
Finance
Software
Banks

29 June 2021
CATEGORY OF SCHEME: RETIREMENT FUND
KEY FACTS
INVESTMENT OBJECTIVE
The investment objective of the Scheme is to provide long-term capital appreciation/income by investing in a mix of equity and debt instruments to help investors meet their retirement goals. There is no assurance that the investment objective of the Scheme will be realized.
FUND MANAGER ¥
Chirag Setalvad (Equities) (since February 25, 2016)
Total experience - Over 21 years &Shobhit Mehrotra (Debt) (since February 25, 2016)
Total Experience: Over 25 years
INCEPTION DATE (Date of Allotment)
February 25, 2016
NAV (AS ON JUNE 30, 2021) NAV PER UNIT (`)
Regular Plan 26.069Direct Plan 28.170
ASSETS UNDER MANAGEMENT (`) IN CRORE
As on June 30, 2021 1,668.76Average for Month of June 2021 1,637.31
qUANTITATIVE DATA
Portfolio Turnover Ratio 12.69%
TOTAL ExPENSE RATIO (As on June 30, 2021)Including Additional expenses and Goods and Service Tax on Management Fees
Regular: 2.14% Direct: 0.99%
#BENCHMARK INDEx: NIFTY 500 (Total Returns Index)
##ADDL. BENCHMARK INDEx: NIFTY 50 (Total Returns Index)
ExIT LOAD
Upon completion of lock-in period: Nil
PLANS & OPTIONS
Regular Plan, Direct Plan. Under Each Plan offers Growth Option only.
MINIMUM APPLICATION AMOUNT
Purchase : ` 5,000 and any amount thereafter.Additional Purchase : ` 1,000 and any amount thereafter.
LOCK-IN PERIOD
Existing investments by investors including SIP / STP registrations, etc (until June 1, 2018):
Units purchased cannot be assigned / transferred / pledged / redeemed / switched out until completion of 5 years from the date of allotment of Units under the Scheme.
Fresh investments by investors including SIP / STP registrations, etc (effective June 2, 2018):
Units purchased cannot be assigned / transferred / pledged / redeemed / switched out until completion of 5 years from the date of allotment of Units or Retirement Age of Unit holder (i.e. completion of 60 years), whichever is earlier.
¥ Dedicated Fund Manager for Overseas Investments: Mr. Sankalp Baid (since January 22, 2021) (Total Experience: Over 13 years).
Face Value per Unit: ` 10 unless otherwise specified, + Industry Classification as recommended by AMFI, Data is as of June 30, 2021 unless otherwise specified.
PERFORMANCE ^ - Regular Plan - Growth OptionDate Period Scheme
Returns (%)
Benchmark Returns
(%)#
Additional Benchmark
Returns (%) ##
Value of ` 10,000 invested
Scheme (`)
Benchmark (`)#
Additional Benchmark
(`)##Jun 30, 20 Last 1 Year 70.71 60.77 54.58 17,071 16,077 15,458Jun 29, 18 Last 3 Years 16.98 15.00 15.00 16,020 15,220 15,220Jun 30, 16 Last 5 Years 16.77 15.40 15.08 21,717 20,473 20,191Feb 25, 16 Since Inception 19.62 18.44 17.96 26,069 24,721 24,192
Returns greater than 1 year period are compounded annualized (CAGR). For performance of other schemes managed by Chirag Setalvad (equities) and Shobhit Mehrotra (Debt), please refer page 68. Different plans viz. Regular Plan and Direct Plan have a different expense structure. The expenses of the Direct Plan under the Scheme will be lower to the extent of the distribution expenses / commission charged in the Regular Plan. For Performance of Direct Plan, refer page no. 79.
This product is suitable for investors who are seeking ~
l a corpus to provide for pension in the form of income to the extent of the redemption value of their holding after the age of 60 years.
l investment predominantly in equity and equity related instruments.
VeryHigh
Low to
Moderate
Low
Moderate ModeratelyHigh High
RISKOMETERInvestors understand that their principal will be at
very high risk~ Investors should consult their financial advisers, if in doubt about whether the product is suitable for them.
^Past performance may or may not be sustained in the future. Since Inception Date = Date of First allotment in the Scheme / Plan. Load is not taken into consideration for computation of performance.
[An open ended retirement solution oriented scheme having a lock-in of 5 years or till retirement age (whichever is earlier)]HDFC Retirement Savings Fund - Equity Plan
(A notified Tax Savings Cum Pension Scheme)
Company Industry+ / Rating % to NAVEqUITY & EqUITY RELATED• HDFC Bank Ltd. Banks 5.22• Reliance Industries Ltd. Petroleum Products 4.69• Infosys Ltd. Software 4.61• ICICI Bank Ltd. Banks 4.39• Housing Development
Finance Corporation Ltd.£ Finance 3.63• Larsen and Toubro Ltd. Construction Project 3.15• ITC Ltd. Consumer Non Durables 2.31• State Bank of India Banks 2.31• Cyient Ltd. Software 2.19• Bajaj Electricals Ltd. Consumer Durables 2.17JB Chemicals & Pharmaceuticals Ltd. Pharmaceuticals 2.14Radico Khaitan Ltd. Consumer Non Durables 2.06Bharat electronics Ltd. Aerospace & Defense 1.90Computer Age Management Services Capital Markets 1.84Aarti Industries Ltd. Chemicals 1.76PNC Infratech Ltd. Construction 1.75Timken India Ltd. Industrial Products 1.75Finolex Cables Ltd. Industrial Products 1.71Tata Steel Ltd. Ferrous Metals 1.66Balkrishna Industries Ltd. Auto Ancillaries 1.64Newgen Software Technologies Ltd. Software 1.60Redington (India) Ltd. Trading 1.60Jindal Steel & Power Ltd. Ferrous Metals 1.55Crisil Ltd. Finance 1.53Transport Corporation of India Ltd. Transportation 1.51Aurobindo Pharma Ltd. Pharmaceuticals 1.47Godrej Consumer Products Ltd. Consumer Non Durables 1.46UPL Ltd. Pesticides 1.43United Spirits Ltd. Consumer Non Durables 1.39Chambal Fertilizers & Chemicals Ltd. Fertilisers 1.30AkzoNobel India Ltd. Consumer Non Durables 1.27KeC International Ltd. Power 1.25Atul Ltd. Chemicals 1.18Hindustan Petroleum Corporation Ltd. Petroleum Products 1.18Carborundum Universal Ltd. Industrial Products 1.09Cholamandalam Investment & Finance Finance 1.08Voltamp Transformers Ltd. Industrial Capital Goods 1.08Firstsource Solutions Ltd. Software 1.03Nilkamal Ltd. Industrial Products 0.98Oracle Financial Services Software Ltd. Software 0.98Mahindra Holidays & Resorts Ind Ltd. Leisure Services 0.97The Anup engineering Ltd. Industrial Capital Goods 0.93Great eastern Shipping Company Ltd. Transportation 0.92Equitas Small Finance Bank Ltd. Banks 0.89Tata Metaliks Ltd. Ferrous Metals 0.87Power Grid Corporation of India Ltd. Power 0.83
Company Industry+ / Rating % to NAVengineers India Ltd. Construction Project 0.77Finolex Industries Ltd. Industrial Products 0.75KeI Industries Ltd. Industrial Products 0.72Sharda Cropchem Ltd. Pesticides 0.69Axis Bank Ltd. Banks 0.66Indian Hotels Company Ltd. Leisure Services 0.61Kalpataru Power Transmission Ltd. Power 0.59Tamilnadu Newsprint & Papers Ltd. Paper 0.57T. V. Today Network Ltd. entertainment 0.39Tata Motors Ltd. DVR Auto 0.37Oriental Carbon & Chemicals Ltd. Chemicals 0.35GNA Axles Ltd. Auto Ancillaries 0.31Jagran Prakashan Ltd. Media 0.30Zensar Technologies Ltd. Software 0.28Indusind Bank Ltd. Banks 0.24CG Power and Industrial Solutions Ltd. Industrial Capital Goods 0.22Apar Industries Ltd. Industrial Capital Goods 0.19Sub Total 92.26DEBT & DEBT RELATEDCREDIT ExPOSURE (NON PERPETUAL)Vedanta Ltd. CRISIL - AA- 1.03Sub Total 1.03Cash, Cash equivalents and Net Current Assets 6.71Grand Total 100.00• Top Ten Holdings, £ Co-sponsor
PORTFOLIO
Industry Allocation of Equity Holding (% of Net Assets)
0.300.370.390.57
1.301.581.601.751.841.901.952.122.172.422.432.673.293.613.924.08
5.876.24
7.008.49
10.6913.71
0 2 4 6 8 10 12 14 16
MediaAuto
EntertainmentPaper
FertilisersLeisure Services
TradingConstruction
Capital MarketsAerospace & Defense
Auto AncillariesPesticides
Consumer DurablesIndustrial Capital Goods
TransportationPower
ChemicalsPharmaceuticals
Construction ProjectFerrous Metals
Petroleum ProductsFinance
Industrial ProductsConsumer Non Durables
SoftwareBanks
SIP PERFORMANCE ^ - Regular Plan - Growth Option
Since Inception SIP 5 Year SIP 3 Year SIP 1 Year SIP
Total Amount Invested (` ‘000) 650.00 600.00 360.00 120.00 Mkt Value As on June 30, 2021 (` ‘000) 1,092.33 971.73 549.83 162.38 Returns (%) 19.19 19.39 29.59 71.93 Benchmark Returns (%) # 17.43 17.53 25.01 54.41 Additional Benchmark Returns (%) ## 17.04 17.15 22.62 46.03
Assuming ` 10,000 invested systematically on the first Business Day of every month over a period of time. CAGR returns are computed after accounting for the cash flow by using xIRR method (investment internal rate of return) for Regular Plan - Growth Option. The above investment simulation is for illustrative purposes only and should not be construed as a promise on minimum returns and safeguard of capital.
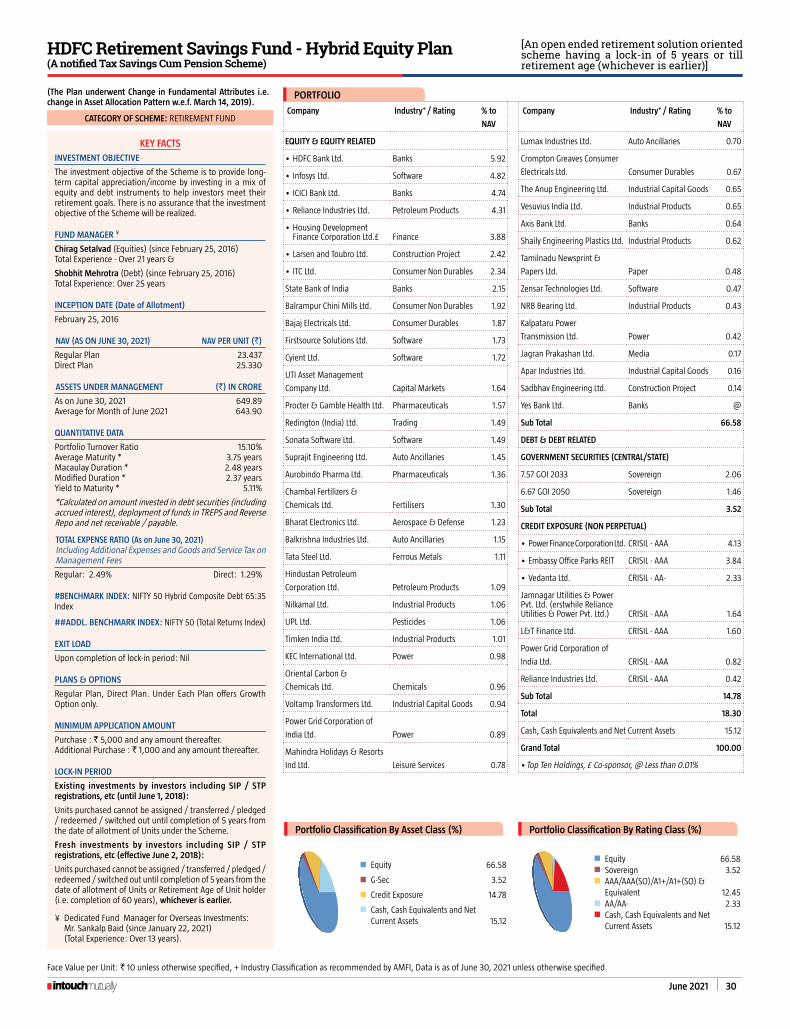
June 2021 30
Face Value per Unit: ` 10 unless otherwise specified, + Industry Classification as recommended by AMFI, Data is as of June 30, 2021 unless otherwise specified.
[An open ended retirement solution oriented scheme having a lock-in of 5 years or till retirement age (whichever is earlier)]
HDFC Retirement Savings Fund - Hybrid Equity Plan(A notified Tax Savings Cum Pension Scheme)
Company Industry+ / Rating % to
NAV
EqUITY & EqUITY RELATED
• HDFC Bank Ltd. Banks 5.92
• Infosys Ltd. Software 4.82
• ICICI Bank Ltd. Banks 4.74
• Reliance Industries Ltd. Petroleum Products 4.31
• Housing Development Finance Corporation Ltd.£ Finance 3.88
• Larsen and Toubro Ltd. Construction Project 2.42
• ITC Ltd. Consumer Non Durables 2.34
State Bank of India Banks 2.15
Balrampur Chini Mills Ltd. Consumer Non Durables 1.92
Bajaj electricals Ltd. Consumer Durables 1.87
Firstsource Solutions Ltd. Software 1.73
Cyient Ltd. Software 1.72
UTI Asset Management
Company Ltd. Capital Markets 1.64
Procter & Gamble Health Ltd. Pharmaceuticals 1.57
Redington (India) Ltd. Trading 1.49
Sonata Software Ltd. Software 1.49
Suprajit engineering Ltd. Auto Ancillaries 1.45
Aurobindo Pharma Ltd. Pharmaceuticals 1.36
Chambal Fertilizers &
Chemicals Ltd. Fertilisers 1.30
Bharat electronics Ltd. Aerospace & Defense 1.23
Balkrishna Industries Ltd. Auto Ancillaries 1.15
Tata Steel Ltd. Ferrous Metals 1.11
Hindustan Petroleum
Corporation Ltd. Petroleum Products 1.09
Nilkamal Ltd. Industrial Products 1.06
UPL Ltd. Pesticides 1.06
Timken India Ltd. Industrial Products 1.01
KeC International Ltd. Power 0.98
Oriental Carbon &
Chemicals Ltd. Chemicals 0.96
Voltamp Transformers Ltd. Industrial Capital Goods 0.94
Power Grid Corporation of
India Ltd. Power 0.89
Mahindra Holidays & Resorts
Ind Ltd. Leisure Services 0.78
Company Industry+ / Rating % to
NAV
Lumax Industries Ltd. Auto Ancillaries 0.70
Crompton Greaves Consumer
electricals Ltd. Consumer Durables 0.67
The Anup engineering Ltd. Industrial Capital Goods 0.65
Vesuvius India Ltd. Industrial Products 0.65
Axis Bank Ltd. Banks 0.64
Shaily engineering Plastics Ltd. Industrial Products 0.62
Tamilnadu Newsprint &
Papers Ltd. Paper 0.48
Zensar Technologies Ltd. Software 0.47
NRB Bearing Ltd. Industrial Products 0.43
Kalpataru Power
Transmission Ltd. Power 0.42
Jagran Prakashan Ltd. Media 0.17
Apar Industries Ltd. Industrial Capital Goods 0.16
Sadbhav engineering Ltd. Construction Project 0.14
Yes Bank Ltd. Banks @
Sub Total 66.58
DEBT & DEBT RELATED
GOVERNMENT SECURITIES (CENTRAL/STATE)
7.57 GOI 2033 Sovereign 2.06
6.67 GOI 2050 Sovereign 1.46
Sub Total 3.52
CREDIT ExPOSURE (NON PERPETUAL)
• Power Finance Corporation Ltd. CRISIL - AAA 4.13
• Embassy Office Parks REIT CRISIL - AAA 3.84
• Vedanta Ltd. CRISIL - AA- 2.33
Jamnagar Utilities & Power Pvt. Ltd. (erstwhile Reliance Utilities & Power Pvt. Ltd.) CRISIL - AAA 1.64
L&T Finance Ltd. CRISIL - AAA 1.60
Power Grid Corporation of
India Ltd. CRISIL - AAA 0.82
Reliance Industries Ltd. CRISIL - AAA 0.42
Sub Total 14.78
Total 18.30
Cash, Cash equivalents and Net Current Assets 15.12
Grand Total 100.00
• Top Ten Holdings, £ Co-sponsor, @ Less than 0.01%
PORTFOLIO
KEY FACTSINVESTMENT OBJECTIVE
The investment objective of the Scheme is to provide long-term capital appreciation/income by investing in a mix of equity and debt instruments to help investors meet their retirement goals. There is no assurance that the investment objective of the Scheme will be realized.
FUND MANAGER ¥
Chirag Setalvad (Equities) (since February 25, 2016)
Total experience - Over 21 years &
Shobhit Mehrotra (Debt) (since February 25, 2016)
Total Experience: Over 25 years
INCEPTION DATE (Date of Allotment)
February 25, 2016
NAV (AS ON JUNE 30, 2021) NAV PER UNIT (`)
Regular Plan 23.437Direct Plan 25.330
ASSETS UNDER MANAGEMENT (`) IN CRORE
As on June 30, 2021 649.89Average for Month of June 2021 643.90
qUANTITATIVE DATA
Portfolio Turnover Ratio 15.10%Average Maturity * 3.75 yearsMacaulay Duration * 2.48 yearsModified Duration * 2.37 yearsYield to Maturity * 5.11%
*Calculated on amount invested in debt securities (including accrued interest), deployment of funds in TRePS and Reverse Repo and net receivable / payable.
TOTAL ExPENSE RATIO (As on June 30, 2021)Including Additional expenses and Goods and Service Tax on Management Fees
Regular: 2.49% Direct: 1.29%
#BENCHMARK INDEx: NIFTY 50 Hybrid Composite Debt 65:35 Index
##ADDL. BENCHMARK INDEx: NIFTY 50 (Total Returns Index)
ExIT LOAD
Upon completion of lock-in period: Nil
PLANS & OPTIONS
Regular Plan, Direct Plan. Under Each Plan offers Growth Option only.
MINIMUM APPLICATION AMOUNT
Purchase : ` 5,000 and any amount thereafter.Additional Purchase : ` 1,000 and any amount thereafter.
LOCK-IN PERIOD
Existing investments by investors including SIP / STP registrations, etc (until June 1, 2018):
Units purchased cannot be assigned / transferred / pledged / redeemed / switched out until completion of 5 years from the date of allotment of Units under the Scheme.
Fresh investments by investors including SIP / STP registrations, etc (effective June 2, 2018):
Units purchased cannot be assigned / transferred / pledged / redeemed / switched out until completion of 5 years from the date of allotment of Units or Retirement Age of Unit holder (i.e. completion of 60 years), whichever is earlier.
¥ Dedicated Fund Manager for Overseas Investments: Mr. Sankalp Baid (since January 22, 2021) (Total Experience: Over 13 years).
(The Plan underwent Change in Fundamental Attributes i.e. change in Asset Allocation Pattern w.e.f. March 14, 2019).
CATEGORY OF SCHEME: RETIREMENT FUND
Portfolio Classification By Asset Class (%)
n equity 66.58
n G-Sec 3.52
n Credit exposure 14.78
n Cash, Cash equivalents and Net Current Assets 15.12
Portfolio Classification By Rating Class (%)
n equity 66.58n Sovereign 3.52n AAA/AAA(SO)/A1+/A1+(SO) &
equivalent 12.45n AA/AA- 2.33n Cash, Cash equivalents and Net
Current Assets 15.12

31 June 2021
This product is suitable for investors who are seeking ~
l a corpus to provide for pension in the form of income to the extent of the redemption value of their holding after the age of 60 years.
l investment predominantly in equity and equity related instruments & balance in debt and money market instruments.
VeryHigh
Low to
Moderate
Low
Moderate ModeratelyHigh High
RISKOMETERInvestors understand that their principal will be at
very high risk
~ Investors should consult their financial advisers, if in doubt about whether the product is suitable for them.
PERFORMANCE ^ - Regular Plan - Growth Option
Date Period Scheme Returns
(%)
Benchmark Returns
(%)#
Additional Benchmark
Returns (%) ##
Value of ` 10,000 invested
Scheme (`)
Benchmark (`)#
Additional Benchmark
(`)##
Jun 30, 20 Last 1 Year 48.83 35.83 54.58 14,883 13,583 15,458
Jun 29, 18 Last 3 Years 14.53 14.07 15.00 15,032 14,854 15,220
Jun 30, 16 Last 5 Years 14.87 13.25 15.08 20,009 18,635 20,191
Feb 25, 16 Since Inception 17.26 15.26 17.96 23,437 21,369 24,192
Returns greater than 1 year period are compounded annualized (CAGR). Scheme performance may not strictly be comparable with that of its Additional Benchmark in view of hybrid nature of the scheme where a portion of scheme’s investments are made in debt instruments. For performance of other schemes managed by Chirag Setalvad (equities) and Shobhit Mehrotra (Debt), please refer page 68. Different plans viz. Regular Plan and Direct Plan have a different expense structure. The expenses of the Direct Plan under the Scheme will be lower to the extent of the distribution expenses / commission charged in the Regular Plan. For Performance of Direct Plan, refer page no. 79.
^Past performance may or may not be sustained in the future. Since Inception Date = Date of First allotment in the Scheme / Plan. Load is not taken into consideration for computation of performance.
[An open ended retirement solution oriented scheme having a lock-in of 5 years or till retirement age(whichever is earlier)]
HDFC Retirement Savings Fund - Hybrid Equity Plan(A notified Tax Savings Cum Pension Scheme)
Industry Allocation of Equity Holding (% of Net Assets)
0.170.480.780.961.061.111.231.301.491.641.752.292.542.562.933.303.773.884.26
5.4010.23
13.45
0 2 4 6 8 10 12 14 16
MediaPaper
Leisure ServicesChemicalsPesticides
Ferrous MetalsAerospace & Defense
FertilisersTrading
Capital MarketsIndustrial Capital Goods
PowerConsumer DurablesConstruction Project
PharmaceuticalsAuto Ancillaries
Industrial ProductsFinance
Consumer Non DurablesPetroleum Products
SoftwareBanks
.....Contd from previous page
SIP PERFORMANCE ^ - Regular Plan - Growth Option
Since Inception SIP 5 Year SIP 3 Year SIP 1 Year SIP
Total Amount Invested (` ‘000) 650.00 600.00 360.00 120.00
Mkt Value As on June 30, 2021 (` ‘000) 1,002.21 892.53 497.22 148.04
Returns (%) 15.96 15.90 22.18 46.34
Benchmark Returns (%) # 14.68 14.77 18.62 30.35
Additional Benchmark Returns (%) ## 17.04 17.15 22.62 46.03
Assuming ` 10,000 invested systematically on the first Business Day of every month over a period of time. CAGR returns are computed after accounting for the cash flow by using xIRR method (investment internal rate of return) for Regular Plan - Growth Option. The above investment simulation is for illustrative purposes only and should not be construed as a promise on minimum returns and safeguard of capital.

June 2021 32
CATEGORY OF SCHEME: RETIREMENT FUND
KEY FACTS
INVESTMENT OBJECTIVEThe investment objective of the Scheme is to provide long-term capital appreciation/income by investing in a mix of equity and debt instruments to help investors meet their retirement goals. There is no assurance that the investment objective of the Scheme will be realized.
FUND MANAGER ¥
Chirag Setalvad (Equities) (since February 26, 2016)
Total experience - Over 21 years &Shobhit Mehrotra (Debt) (since February 26, 2016)
Total Experience: Over 25 years
INCEPTION DATE (Date of Allotment)February 26, 2016
NAV (AS ON JUNE 30, 2021) NAV PER UNIT (`)Regular Plan 15.9141Direct Plan 17.1187
ASSETS UNDER MANAGEMENT (`) IN CROREAs on June 30, 2021 123.29Average for Month of June 2021 121.80
qUANTITATIVE DATAAverage Maturity * 6.14 yearsMacaulay Duration * 4.08 yearsModified Duration * 3.90 yearsYield to Maturity * 5.73%*Calculated on amount invested in debt securities (including accrued interest), deployment of funds in TRePS and Reverse Repo and net receivable / payable.
TOTAL ExPENSE RATIO (As on June 30, 2021)Including Additional expenses and Goods and Service Tax on Management FeesRegular: 2.27% Direct: 1.17%
#BENCHMARK INDEx: NIFTY 50 Hybrid Composite Debt 15:85 Index##ADDL. BENCHMARK INDEx: CRISIL 10 Year Gilt Index
ExIT LOADUpon completion of lock-in period: Nil
PLANS & OPTIONSRegular Plan, Direct Plan. Under Each Plan offers Growth Option only.MINIMUM APPLICATION AMOUNTPurchase : ` 5,000 and any amount thereafter.Additional Purchase : ` 1,000 and any amount thereafter.
LOCK-IN PERIODExisting investments by investors including SIP / STP registrations, etc (until June 1, 2018):Units purchased cannot be assigned / transferred / pledged / redeemed / switched out until completion of 5 years from the date of allotment of Units under the Scheme. Fresh investments by investors including SIP / STP registrations, etc (effective June 2, 2018): Units purchased cannot be assigned / transferred / pledged / redeemed / switched out until completion of 5 years from the date of allotment of Units or Retirement Age of Unit holder (i.e. completion of 60 years), whichever is earlier.
¥ Dedicated Fund Manager for Overseas Investments: Mr. Sankalp Baid (since January 22, 2021) (Total Experience: Over 13 years).
Face Value per Unit: ` 10 unless otherwise specified, + Industry Classification as recommended by AMFI, Data is as of June 30, 2021 unless otherwise specified.
PERFORMANCE ^ - Regular Plan - Growth OptionDate Period Scheme
Returns (%)
Benchmark Returns
(%)#
Additional Benchmark
Returns (%) ##
Value of ` 10,000 investedScheme
(`)Benchmark
(`)#Additional
Benchmark (`)##
Jun 30, 20 Last 1 Year 15.06 12.17 4.08 11,506 11,217 10,408Jun 29, 18 Last 3 Years 8.70 11.21 9.61 12,850 13,762 13,174Jun 30, 16 Last 5 Years 8.43 9.62 7.25 14,993 15,834 14,192Feb 26, 16 Since Inception 9.08 10.42 7.72 15,914 16,984 14,884
Returns greater than 1 year period are compounded annualized (CAGR). Scheme performance may not strictly be comparable with that of its Additional Benchmark in view of hybrid nature of the scheme where a portion of scheme’s investments are made in equity instruments. For performance of other schemes managed by Chirag Setalvad (equities) and Shobhit Mehrotra (Debt), please refer page 68. Different plans viz. Regular Plan and Direct Plan have a different expense structure. The expenses of the Direct Plan under the Scheme will be lower to the extent of the distribution expenses / commission charged in the Regular Plan. For Performance of Direct Plan, refer page no. 79.
This product is suitable for investors who are seeking ~
l a corpus to provide for pension in the form of income to the extent of the redemption value of their holding after the age of 60 years.
l investment predominantly in debt and money market instruments & balance in equity and equity related instruments.
VeryHigh
Low to
Moderate
Low
Moderate ModeratelyHigh High
RISKOMETERInvestors understand that their principal will be at
moderately high risk~ Investors should consult their financial advisers, if in doubt about whether the product is suitable for them. ^Past performance may or may not be sustained in the future. Since Inception Date = Date of First allotment in the Scheme /
Plan. Load is not taken into consideration for computation of performance.
Portfolio Classification By Asset Class (%)
n equity 13.49
n G-Sec 26.56
n Credit exposure 32.43
n Cash, Cash equivalents and Net Current Assets 27.52
Portfolio Classification By Rating Class (%)
n equity 13.49n Sovereign 26.56n AAA/AAA(SO)/A1+/A1+(SO)
& equivalent 18.67n AA/AA- 13.76n Cash, Cash equivalents and
Net Current Assets 27.52
[An open ended retirement solution oriented scheme having a lock-in of 5 years or till retirement age (whichever is earlier)]
HDFC Retirement Savings Fund - Hybrid Debt Plan(A notified Tax Savings Cum Pension Scheme)
SIP PERFORMANCE ^ - Regular Plan - Growth Option
Since Inception SIP 5 Year SIP 3 Year SIP 1 Year SIP
Total Amount Invested (` ‘000) 650.00 600.00 360.00 120.00 Mkt Value As on June 30, 2021 (` ‘000) 818.04 740.50 419.66 128.89 Returns (%) 8.42 8.36 10.24 14.11 Benchmark Returns (%) # 10.09 10.11 11.52 10.43 Additional Benchmark Returns (%) ## 7.23 7.19 7.82 4.64
Assuming ` 10,000 invested systematically on the first Business Day of every month over a period of time. CAGR returns are computed after accounting for the cash flow by using xIRR method (investment internal rate of return) for Regular Plan - Growth Option. The above investment simulation is for illustrative purposes only and should not be construed as a promise on minimum returns and safeguard of capital.
Company Industry+ / Rating % to NAVEqUITY & EqUITY RELATEDICICI Bank Ltd. Banks 1.26HDFC Bank Ltd. Banks 1.07Infosys Ltd. Software 0.74Reliance Industries Ltd. Petroleum Products 0.71Redington (India) Ltd. Trading 0.65Larsen and Toubro Ltd. Construction Project 0.52Newgen Software Technologies Ltd. Software 0.52Chambal Fertilizers & Chemicals Ltd. Fertilisers 0.50Bajaj electricals Ltd. Consumer Durables 0.47MTAR Technologies Ltd. Aerospace & Defense 0.46Finolex Cables Ltd. Industrial Products 0.44ITC Ltd. Consumer Non Durables 0.41Timken India Ltd. Industrial Products 0.36Axis Bank Ltd. Banks 0.35Transport Corporation of India Ltd. Transportation 0.34Voltamp Transformers Ltd. Industrial Capital Goods 0.34State Bank of India Banks 0.32Tata Steel Ltd. Ferrous Metals 0.32The Anup engineering Ltd. Industrial Capital Goods 0.28SKF India Ltd. Industrial Products 0.26GNA Axles Ltd. Auto Ancillaries 0.25Lumax Industries Ltd. Auto Ancillaries 0.25Nilkamal Ltd. Industrial Products 0.23Mahindra Holidays & Resorts Ind Ltd. Leisure Services 0.22Oriental Carbon & Chemicals Ltd. Chemicals 0.22Vesuvius India Ltd. Industrial Products 0.20Insecticides (India) Ltd. Pesticides 0.19Hindustan Petroleum Corporation Ltd. Petroleum Products 0.18Time Technoplast Ltd. Industrial Products 0.18Kalpataru Power Transmission Ltd. Power 0.17Navneet education Ltd. Printing & Publication 0.17NRB Bearing Ltd. Industrial Products 0.17
Company Industry+ / Rating % to NAVPower Grid Corporation of India Ltd. Power 0.17Aurobindo Pharma Ltd. Pharmaceuticals 0.16Apar Industries Ltd. Industrial Capital Goods 0.13Bank of Baroda Banks 0.09DCB Bank Ltd. Banks 0.09Tamilnadu Newsprint & Papers Ltd. Paper 0.06Sadbhav engineering Ltd. Construction Project 0.04Sub Total 13.49DEBT & DEBT RELATEDGOVERNMENT SECURITIES (CENTRAL/STATE)• 6.19 GOI 2034 Sovereign 7.73• 7.57 GOI 2033 Sovereign 6.53• 7.5 GOI 2034 Sovereign 4.32• 6.79 GOI 2029 Sovereign 4.14• 6.67 GOI 2050 Sovereign 3.84Sub Total 26.56CREDIT ExPOSURE (NON PERPETUAL)• Vedanta Ltd. CRISIL - AA- 5.74• L&T Finance Ltd. CRISIL - AAA 5.48• Indian Railways Finance
Corporation Ltd. CRISIL - AAA 4.43• Housing Development
Finance Corporation Ltd.£ CRISIL - AAA 3.99Jamnagar Utilities & Power Pvt. Ltd. (erstwhile Reliance Utilities & Power Pvt. Ltd.) CRISIL - AAA 2.16Reliance Industries Ltd. CRISIL - AAA 1.70Power Finance Corporation Ltd. CRISIL - AAA 0.91Sub Total 24.41CREDIT ExPOSURE (PERPETUAL BONDS)• TMF Holdings Ltd.
(Subsidiary of Tata Motors Ltd.) (Perpetual) CARe - AA- 8.02
Sub Total 8.02Total 58.99Cash, Cash equivalents and Net Current Assets 27.52Grand Total 100.00• Top Ten Holdings, £ Co-sponsor
PORTFOLIO

33 June 2021
CATEGORY OF SCHEME: EqUITY SAVINGS FUND
KEY FACTS
INVESTMENT OBJECTIVE
To provide capital appreciation by investing in equity & equity related instruments, Arbitrage opportunities, and Debt & money market instruments.There is no assurance that the investment objective of the Scheme will be realized.
FUND MANAGER ¥
Gopal Agrawal (equities) (since July 16, 2020)
Total Experience: Over 16 years
Krishan Kumar Daga (Arbitrage) (since January 08, 2016)
Total Experience: Over 22 years
Arun Agarwal (Arbitrage) (since August 24, 2020)
Total Experience: Over 22 years
Anil Bamboli (Debt) (since September 17, 2004)
Total Experience: Over 23 years
INCEPTION DATE (Date of Allotment)
September 17, 2004
NAV (AS ON JUNE 30, 2021) NAV PER UNIT (`)
Regular Plan - Growth Option 45.726Regular Plan - IDCW Option 11.910Direct Plan - Growth Option 49.327Direct Plan - IDCW Option 13.197
ASSETS UNDER MANAGEMENT (`) IN CRORE
As on June 30, 2021 2,372.13Average for Month of June 2021 2,390.62
qUANTITATIVE DATA
Portfolio Turnover Ratio 18.22%Average Maturity * 4.76 yearsMacaulay Duration * 3.34 yearsModified Duration * 3.09 yearsYield to Maturity * 6.55%
*Calculated on amount invested in debt securities (including accrued interest), deployment of funds in TRePS and Reverse Repo and net receivable / payable.
TOTAL ExPENSE RATIO (As on June 30, 2021)Including Additional expenses and Goods and Service Tax on Management Fees
Regular: 2.13% Direct: 1.31%
#BENCHMARK INDEx: 40% NIFTY 50 Arbitrage Index, 30% CRISIL Short Term Bond Fund Index and 30% NIFTY 50 (Total Returns Index)
##ADDL. BENCHMARK INDEx: CRISIL 10 year Gilt Index
ExIT LOAD
l In respect of each purchase / switch-in of Units, upto 15% of the units may be redeemed without any exit load from the date of allotment.
l Any redemption in excess of the above limit shall be subject to the following exit load:
n Exit load of 1.00% is payable if Units are redeemed / switched-out within 1 year from the date of allotment of units.
l No Exit Load is payable if Units are redeemed / switched-out after 1 year from the date of allotment.
For further details, please refer to para ‘Exit Load’ on Pg 68.
PLANS & OPTIONS
Regular Plan, Direct Plan. Under Each Plan: Growth & Income Distribution cum Capital Withdrawal (IDCW) Option. The IDCW Option offers following Sub-Options: Payout of Income Distribution cum Capital Withdrawal (IDCW) Option; and Re-investment of Income Distribution cum Capital Withdrawal (IDCW) Option.
MINIMUM APPLICATION AMOUNT
Purchase : ` 5,000 and any amount thereafter.Additional Purchase : ` 1,000 and any amount thereafter.
¥ Dedicated Fund Manager for Overseas Investments: Mr. Sankalp Baid (since January 22, 2021) (Total Experience: Over 13 years).
This product is suitable for investors who are seeking ~l capital appreciation while generating income over medium to
long term.l provide capital appreciation and income distribution to the
investors by using equity and equity related instruments, arbitrage opportunities, and investments in debt and money market instruments.
VeryHighLow
to
Moderate
Low
Moderate ModeratelyHigh High
RISKOMETERInvestors understand that their principal will be at
high risk~ Investors should consult their financial advisers, if in doubt about whether the product is suitable for them.
SIP PERFORMANCE ^ - Regular Plan - Growth OptionSince Inception SIP 15 year SIP 10 year SIP 5 Year SIP 3 Year SIP 1 Year SIP
Total Amount Invested (` ‘000) 2,020.00 1,800.00 1,200.00 600.00 360.00 120.00 Mkt Value As on June 30, 2021 (` ‘000) 4,868.62 3,941.66 2,005.73 780.98 443.97 138.29 Returns (%) 9.67 9.78 9.92 10.50 14.13 29.64 Benchmark Returns (%) # N.A. N.A. 9.35 9.71 11.24 15.96 Additional Benchmark Returns (%) ## 7.00 7.12 7.52 7.19 7.82 4.64
Assuming ` 10,000 invested systematically on the first Business Day of every month over a period of time. CAGR returns are computed after accounting for the cash flow by using xIRR method (investment internal rate of return) for Regular Plan - Growth Option. The above investment simulation is for illustrative purposes only and should not be construed as a promise on minimum returns and safeguard of capital. N.A. Not Available.
PERFORMANCE ^ - Regular Plan - Growth OptionDate Period^^ Scheme
Returns (%)
Benchmark Returns
(%)#
Additional Benchmark
Returns (%) ##
Value of ` 10,000 investedScheme (`) Benchmark
(`)#Additional
Benchmark (`)##
Jun 30, 20 Last 1 Year 28.54 17.83 4.08 12,854 11,783 10,408Jun 29, 18 Last 3 Years 9.60 9.46 9.61 13,172 13,122 13,174Jun 30, 16 Last 5 Years 10.44 9.10 7.25 16,431 15,460 14,192Sep 17, 04 Since Inception 9.47 N.A. 6.24 45,726 N.A. 27,636
^^Effective December 16, 2015, certain changes, including changes to fundamental attributes, were effected in the erstwhile HDFC Multiple Yield Fund, (an open ended income scheme) which was renamed as HDFC Equity Savings Fund, an open ended equity scheme. On account of these changes, the performance during the period(s) from September 17, 2004 to December 15, 2015 is not comparable.Returns greater than 1 year period are compounded annualized (CAGR). N.A. Not Available. Scheme performance may not strictly be comparable with that of its Additional Benchmark, since a portion of scheme’s investments are made in debt instruments. For performance of other schemes managed by Gopal Agrawal (equities), Krishan Kumar Daga (Arbitrage), Arun Agarwal (Arbitrage) and Anil Bamboli (Debt), please refer page 68. Different plans viz. Regular Plan and Direct Plan have a different expense structure. The expenses of the Direct Plan under the Scheme will be lower to the extent of the distribution expenses / commission charged in the Regular Plan. For Performance of Direct Plan, refer page no. 79.
^Past performance may or may not be sustained in the future. Since Inception Date = Date of First allotment in the Scheme / Plan. Load is not taken into consideration for computation of performance.
Face Value per Unit: ` 10 unless otherwise specified, + Industry Classification as recommended by AMFI, Data is as of June 30, 2021 unless otherwise specified. ...Contd on next page
Portfolio Classification By Rating Class (%)
n equity 67.09n Sovereign 7.01n Units issued by InvIT 2.03n AAA/AAA(SO)/A1+/A1+(SO)
& equivalent 3.29n AA/AA- 15.02n Cash, Cash equivalents and
Net Current Assets 5.56
(An open ended scheme investing in equity, arbitrage and debt)HDFC Equity Savings Fund
Industry Allocation of Equity Holding (% of Net Assets)
0.010.200.250.710.810.880.901.151.221.491.691.691.911.962.032.26
3.823.93
5.7310.63
0 2 4 6 8 10 12
Printing & PublicationCement & Cement Products
OilMinerals/Mining
Ferrous MetalsGas
Telecom - ServicesFinance
TransportationAerospace & Defense
PowerConstruction
Construction ProjectConsumer Non Durables
Units issued by InvITPharmaceuticals
Petroleum ProductsIndustrial Capital Goods
SoftwareBanks

June 2021 34
Face Value per Unit: ` 10 unless otherwise specified, + Industry Classification as recommended by AMFI, CD - Certificate of Deposit; CP - Commercial Papers. Data is as of June 30, 2021 unless otherwise specified.
(An open ended scheme investing in equity, arbitrage and debt) .....Contd from previous pageHDFC Equity Savings Fund
Company Industry+ / Rating % to NAV (Hedged & Unhedged)
% exposure of Derivative
EqUITY & EqUITY RELATED
• Housing Development Finance Corporation Ltd.£ Finance 6.52 6.52
• Infosys Ltd. Software 4.61 0.00
• Reliance Industries Ltd. Petroleum Products 4.20 1.95
• State Bank of India Banks 3.61 0.79
• ICICI Bank Ltd. Banks 3.58 0.00
• HDFC Bank Ltd. Banks 3.40 0.00
• Sun Pharmaceutical Industries Ltd. Pharmaceuticals 3.24 3.24
• Dr Reddys Laboratories Ltd. Pharmaceuticals 3.16 3.16
• Tata Steel Ltd. Ferrous Metals 3.07 2.27
JSW Steel Ltd. Ferrous Metals 2.10 2.09
Bharti Airtel Ltd. Telecom - Services 1.98 1.08
Larsen and Toubro Ltd. Construction Project 1.91 0.00
Titan Company Ltd. Consumer Durables 1.45 1.45
Axis Bank Ltd. Banks 1.44 0.62
elecon engineering Comapny Ltd. Industrial Capital Goods 1.35 0.00
BeML Ltd. Industrial Capital Goods 1.26 0.00
Gujarat Pipavav Port Ltd. Transportation 1.22 0.00
SBI Cards and Payment Services Ltd. Finance 1.15 0.00
Newgen Software Technologies Ltd. Software 1.12 0.00
Bharat Petroleum Corporation Ltd. Petroleum Products 1.10 0.00
JMC Projects (India) Ltd. Construction 1.03 0.00
NTPC Ltd. Power 0.93 0.00
United Spirits Ltd. Consumer Non Durables 0.89 0.26
GAIL (India) Ltd. Gas 0.88 0.00
Titagarh Wagons Ltd. Industrial Capital Goods 0.88 0.00
Cipla Ltd. Pharmaceuticals 0.85 0.00
Aurobindo Pharma Ltd. Pharmaceuticals 0.84 0.23
Bharat electronics Ltd. Aerospace & Defense 0.84 0.00
Lupin Ltd. Pharmaceuticals 0.80 0.00
Power Grid Corporation of India Ltd. Power 0.76 0.00
Coal India Ltd. Minerals/Mining 0.71 0.00
Tata Consumer Products Ltd. Consumer Non Durables 0.69 0.00
Hindustan Aeronautics Ltd. Aerospace & Defense 0.65 0.00
ITC Ltd. Consumer Non Durables 0.64 0.00
Maruti Suzuki India Ltd. Auto 0.48 0.48
Hindustan Petroleum Corporation Ltd. Petroleum Products 0.47 0.00
Max Financial Services Ltd. Insurance 0.46 0.46
Texmaco Rail & engineering Ltd. Industrial Capital Goods 0.44 0.00
The Federal Bank Ltd. Banks 0.44 0.43
ITD Cementation India Ltd. Construction 0.34 0.00
Ashoka Buildcon Ltd. Construction 0.32 0.00
Cadila Healthcare Ltd. Pharmaceuticals 0.31 0.31
Oil & Natural Gas Corporation Ltd. Oil 0.25 0.00
Orient Cement Ltd. Cement & Cement Products 0.20 0.00
Pidilite Industries Ltd. Chemicals 0.13 0.13
Tech Mahindra Ltd. Software 0.13 0.13
UltraTech Cement Ltd. Cement & Cement Products 0.12 0.12
Adani Ports & Special economic Zone Transportation 0.09 0.09
Mahindra & Mahindra Ltd. Auto 0.04 0.04
Company Industry+ / Rating % to NAV (Hedged & Unhedged)
% exposure of Derivative
S Chand and Company Ltd. Printing & Publication 0.01 0.00
Biocon Ltd. Pharmaceuticals @Sub Total 67.09
Preference Shares
Zee entertainment enterprises Ltd. entertainment @
Sub Total @
Total 67.09
UNITS ISSUED BY REIT & INVIT
UNITS ISSUED BY INVIT
POWeRGRID Infrastructure Investment Trust Power 2.03
Sub Total 2.03
Total 2.03
DEBT & DEBT RELATED
GOVERNMENT SECURITIES (CENTRAL/STATE)
7.59 GOI 2026 Sovereign 0.67
5.09 GOI 2022 Sovereign 0.64
6.97 GOI 2026 Sovereign 0.44
Sub Total 1.75
T-BILLS
364 Days Tbill - Mat 150721 Sovereign 2.11
364 Days Tbill Mat 220721 Sovereign 1.05
364 Days Tbill Mat 290721 Sovereign 1.05
364 Days Tbill Mat 190821 Sovereign 0.84
364 Days Tbill - Mat 110322 Sovereign 0.21
Sub Total 5.26
CREDIT ExPOSURE (NON PERPETUAL)
Power Finance Corporation Ltd. CRISIL - AAA 2.19
Vedanta Ltd. CRISIL - AA- 2.13
Shriram City Union Finance Ltd. CRISIL - AA 1.71
Indian Railways Finance Corporation Ltd. CRISIL - AAA 1.10
INOx Wind Infrastructure Services Ltd. CRISIL - AA(Ce) 0.63
Aarish Solar Power Pvt. Ltd. (Greenko) CARe - AA(Ce) 0.45
Sub Total 8.21
CREDIT ExPOSURE (PERPETUAL BONDS)
• Punjab National Bank (AT1, BASEL III, Perpetual) CRISIL - AA- 3.44
Canara Bank (AT1, BASeL III, Perpetual) CARe - AA 2.36
Union Bank of India (AT1, BASEL III, Perpetual) IND - AA 2.15
Canara Bank (AT1, BASeL III, Perpetual) CRISIL - AA 1.07
Bank of Baroda (AT1, BASeL III, Perpetual) CARe - AA 0.44
Punjab National Bank (AT1, BASeL III, Perpetual) IND - AA 0.39
Union Bank of India (AT1, BASEL III, Perpetual) CARe - AA- 0.21
Union Bank of India (AT1, BASEL III, Perpetual) CRISIL - AA- 0.04
Sub Total 10.10
Total 25.32
Cash, Cash equivalents and Net Current Assets 5.56
Grand Total 100.00
• Top Ten Holdings, £ Co-sponsor, @ Less than 0.01%
Outstanding exposure in derivative instruments (` in Crore) 614.21
Hedged position in Equity & Equity related instruments
Outstanding derivative exposure (% age) 25.89
PORTFOLIO

35 June 2021
CATEGORY OF SCHEME: CONSERVATIVE HYBRID FUND
KEY FACTS
INVESTMENT OBJECTIVE
To generate income / capital appreciation by investing primarily in debt securities, money market instruments and moderate exposure to equities.
There is no assurance that the investment objective of the Scheme will be realized.
FUND MANAGER ¥
Prashant Jain (equities) (since December 26, 2003)
Total Experience: Over 27 years &Shobhit Mehrotra (Debt) (since September 1, 2007)
Total Experience: Over 25 years
INCEPTION DATE (Date of Allotment)
December 26, 2003
NAV (AS ON JUNE 30, 2021) NAV PER UNIT (`)
Regular Plan - Growth Option 56.6813Regular Plan - Monthly IDCW Option 13.3348Regular Plan - Quarterly IDCW Option 14.0880Direct Plan - Growth Option 59.0861Direct Plan - Monthly IDCW Option 14.1900Direct Plan - Quarterly IDCW Option 14.9869
ASSETS UNDER MANAGEMENT (`) IN CRORE
As on June 30, 2021 2,525.39Average for Month of June 2021 2,522.25
qUANTITATIVE DATA
Average Maturity * 4.17 yearsMacaulay Duration * 3.26 yearsModified Duration * 3.08 yearsYield to Maturity * 6.33%
*Calculated on amount invested in debt securities (including accrued interest), deployment of funds in TRePS and Reverse Repo and net receivable / payable.
TOTAL ExPENSE RATIO (As on June 30, 2021)Including Additional expenses and Goods and Service Tax on Management Fees
Regular: 1.87% Direct: 1.46%
#BENCHMARK INDEx: NIFTY 50 Hybrid Composite Debt 15:85 Index
##ADDL. BENCHMARK INDEx: CRISIL 10 year Gilt Index
ExIT LOAD
l In respect of each purchase / switch-in of Units, 15% of the Units (“the limit”) may be redeemed without any exit load from the date of allotment.
l Any redemption in excess of the limit shall be subject to the following exit load:
n Exit load of 1.00% is payable if Units are redeemed / switched-out within 1 year from the date of allotment of units.
l No Exit load is payable if Units are redeemed / switched-out after 1 year from the date of allotment.
For further details, please refer to para ‘Exit Load’ on Pg 68.
PLANS & OPTIONS
Regular Plan, Direct Plan. Under Each Plan: Growth, (Monthly & Quarterly) Income Distribution cum Capital Withdrawal (IDCW) Option. The IDCW Option offers following Sub-Options: Payout of Income Distribution cum Capital Withdrawal (IDCW) Option; and Re-investment of Income Distribution cum Capital Withdrawal (IDCW) Option.
MINIMUM APPLICATION AMOUNT
Purchase: (Growth & quarterly IDCW Option) - ` 5,000 and any amount thereafter. (Monthly IDCW Option) - ` 25,000 and any amount thereafter.Additional Purchase : ` 1,000 and any amount thereafter.
¥ Dedicated Fund Manager for Overseas Investments: Mr. Sankalp Baid (since January 22, 2021) (Total Experience: Over 13 years).
Face Value per Unit: ` 10 unless otherwise specified, + Industry Classification as recommended by AMFI, CD - Certificate of Deposit; CP - Commercial Papers. Data is as of June 30, 2021 unless otherwise specified.
Company Industry+ / Rating % to NAV
EqUITY & EqUITY RELATED
State Bank of India Banks 2.30
ICICI Bank Ltd. Banks 1.87
Larsen and Toubro Ltd. Construction Project 1.44
NTPC Ltd. Power 1.40
Infosys Ltd. Software 1.26
IRB Infrastructure Developers Ltd. Construction 1.16
Power Finance Corporation Ltd. Finance 1.08
ITC Ltd. Consumer Non Durables 1.06
Axis Bank Ltd. Banks 0.97
Coal India Ltd. Minerals/Mining 0.87
Apar Industries Ltd. Industrial Capital Goods 0.68
Bharti Airtel Ltd. Telecom - Services 0.68
Lupin Ltd. Pharmaceuticals 0.65
NHPC Ltd. Power 0.63
ReC Ltd. Finance 0.62
Sun Pharmaceutical Industries Ltd. Pharmaceuticals 0.58
Hindustan Petroleum Corporation Ltd. Petroleum Products 0.57
Mishra Dhatu Nigam Ltd. Ferrous Metals 0.52
Cipla Ltd. Pharmaceuticals 0.50
Bharat Petroleum Corporation Ltd. Petroleum Products 0.40
SBI Life Insurance Company Ltd. Insurance 0.40
HCL Technologies Ltd. Software 0.39
MeP Infrastructure Developers Ltd. Transportation 0.39
SBI Cards and Payment Services Ltd. Finance 0.28
Tata Motors Ltd. Auto 0.27
Hindustan Aeronautics Ltd. Aerospace & Defense 0.26
Indian Railways Finance Corporation Ltd. Finance 0.25
Mahindra & Mahindra Ltd. Auto 0.25
Aurobindo Pharma Ltd. Pharmaceuticals 0.22
Texmaco Rail & engineering Ltd. Industrial Capital Goods 0.21
Power Grid Corporation of India Ltd. Power 0.19
Union Bank of India Banks 0.17
Bharat Dynamics Ltd. Aerospace & Defense 0.15
Chambal Fertilizers & Chemicals Ltd. Fertilisers 0.12
elecon engineering Comapny Ltd. Industrial Capital Goods 0.09
Titagarh Wagons Ltd. Industrial Capital Goods 0.03
Tata Motors Ltd. DVR Auto @
Sub Total 22.91
UNITS ISSUED BY REIT & INVIT
UNITS ISSUED BY INVIT
POWeRGRID Infrastructure Investment Trust Power 1.39
Sub Total 1.39
Total 1.39
DEBT & DEBT RELATED
GOVERNMENT SECURITIES (CENTRAL/STATE)
7.89% Gujarat SDL - Mat 150525 Sovereign 1.49
6.68 GOI 2031 Sovereign 1.00
5.77 GOI 2030 Sovereign 0.96
5.85 GOI 2030 Sovereign 0.59
6.19 GOI 2034 Sovereign 0.47
6.97 GOI 2026 Sovereign 0.41
Company Industry+ / Rating % to NAV
7.17 GOI 2028 Sovereign 0.41
6.79 GOI 2029 Sovereign 0.40
6.67 GOI 2050 Sovereign 0.38
1.44% GOI Inflation Indexed 2023 Sovereign 0.33
6.45 GOI 2029 Sovereign 0.20
8.10% Tamil Nadu SDL - Mat 110325 Sovereign 0.11
7.73 GOI 2034 Sovereign 0.02
8.15 GOI 2026 Sovereign 0.01
Sub Total 6.78
CREDIT ExPOSURE (NON PERPETUAL)
• Vedanta Ltd. CRISIL - AA- 5.28
• TATA Housing Development Company Ltd. CARe - AA 5.23
• Pipeline Infrastructure Pvt. Ltd. CRISIL - AAA 4.25
• Tata Motors Ltd. CRISIL - AA- 4.21
• Sikka Port and Terminal Ltd. (erstwhile Reliance Ports and Terminals Ltd.) CRISIL - AAA 4.18
• DLF Ltd. ICRA - A+ 3.99
• Bajaj Finance Ltd. CRISIL - AAA 3.18
• Shriram City Union Finance Ltd. CARe - AA / CRISIL - AA 3.04
• National Bank for Agriculture and Rural Development
CRISIL - AAA / ICRA - AAA 2.85
• Indian Railways Finance Corporation Ltd. CRISIL - AAA 2.83
ReC Ltd. CRISIL - AAA 2.51
Power Finance Corporation Ltd. CRISIL - AAA 2.25
Housing and Urban Development Corporation Ltd. CARe - AAA 2.17
National Highways Authority of India CRISIL - AAA 2.15
Housing Development Finance Corporation Ltd.£ CRISIL - AAA 1.95
Andhra Pradesh expressway Ltd. (NHAI Annuity) ICRA - AAA 1.61
L&T Finance Ltd. CRISIL - AAA 1.40
First Business Receivables Trust (PTC backed by receivables from Reliance Corporate IT Park Ltd.) CRISIL - AAA(SO) 1.25
embassy Office Parks ReIT CRISIL - AAA 0.99
Coastal Gujarat Power Ltd. (Corporate Guarantee of Tata Power) CARe - AA(Ce) 0.78
JM Financial Products Ltd. ICRA - AA 0.26
Power Grid Corporation of India Ltd. CRISIL - AAA 0.22
Sub Total 56.58
CREDIT ExPOSURE (PERPETUAL BONDS)
Punjab National Bank (AT1, BASeL III, Perpetual) CRISIL - AA- 2.02
TMF Holdings Ltd. (Subsidiary of Tata Motors Ltd.) (Perpetual) CARe - AA- 0.59
Sub Total 2.61
Total 65.97
Cash, Cash equivalents and Net Current Assets 9.73
Grand Total 100.00
• Top Ten Holdings, @ Less than 0.01%, £ Co-sponsor
(An open ended hybrid scheme investing predominantly in debt instruments)HDFC Hybrid Debt Fund
PORTFOLIO

June 2021 36
Face Value per Unit: ` 10 unless otherwise specified, + Industry Classification as recommended by AMFI, Data is as of June 30, 2021 unless otherwise specified.
This product is suitable for investors who are seeking ~
l to generate long-term income / capital appreciation
l investments primarily in debt securities, money market instruments and moderate exposure to equities
VeryHigh
Low to
Moderate
Low
Moderate ModeratelyHigh High
RISKOMETERInvestors understand that their principal will be at
high risk
~ Investors should consult their financial advisers, if in doubt about whether the product is suitable for them.
SIP PERFORMANCE ^ - Regular Plan - Growth Option
Since Inception SIP
15 year SIP 10 year SIP 5 Year SIP 3 Year SIP 1 Year SIP
Total Amount Invested (` ‘000) 2,110.00 1,800.00 1,200.00 600.00 360.00 120.00
Mkt Value As on June 30, 2021 (` ‘000) 5,447.64 3,907.91 1,957.48 759.06 434.31 133.39
Returns (%) 9.92 9.67 9.46 9.35 12.60 21.46
Benchmark Returns (%) # 9.22 9.36 9.76 10.11 11.52 10.43
Additional Benchmark Returns (%) ## 6.89 7.12 7.52 7.19 7.82 4.64
Assuming ` 10,000 invested systematically on the first Business Day of every month over a period of time. CAGR returns are computed after accounting for the cash flow by using xIRR method (investment internal rate of return) for Regular Plan - Growth Option. The above investment simulation is for illustrative purposes only and should not be construed as a promise on minimum returns and safeguard of capital.
PERFORMANCE ^ - Regular Plan - Growth Option
Date Period Scheme Returns
(%)
Benchmark Returns
(%)#
Additional Benchmark
Returns (%) ##
Value of ` 10,000 invested
Scheme (`) Benchmark (`)#
Additional Benchmark (`)##
Jun 30, 20 Last 1 Year 22.44 12.17 4.08 12,244 11,217 10,408
Jun 29, 18 Last 3 Years 10.00 11.21 9.61 13,316 13,762 13,174
Jun 30, 16 Last 5 Years 8.75 9.62 7.25 15,215 15,834 14,192
Dec 26, 03 Since Inception 10.41 8.59 5.87 56,681 42,395 27,150
Returns greater than 1 year period are compounded annualized (CAGR). Scheme performance may not strictly be comparable with that of its Additional Benchmark in view of hybrid nature of the scheme where a portion of scheme’s investments are made in equity instruments. For performance of other schemes managed by Prashant Jain (Equities) and Shobhit Mehrotra (Debt), please refer page 68. Different plans viz. Regular Plan and Direct Plan have a different expense structure. The expenses of the Direct Plan under the Scheme will be lower to the extent of the distribution expenses / commission charged in the Regular Plan. For Performance of Direct Plan, refer page no. 79.
^Past performance may or may not be sustained in the future. Since Inception Date = Date of First allotment in the Scheme / Plan. Load is not taken into consideration for computation of performance.
Note: Effective close of business hours of May 25, 2018, HDFC MF Monthly Income Plan – Long Term Plan (MIP-LTP) underwent changes in Fundamental Attributes and was renamed as HDFC Hybrid Debt Fund (HHDF) and HDFC MF Monthly Income Plan – Short Term Plan was merged therein. As the portfolio structuring of HHDF closely resembles the erstwhile MIP-LTP, the past performance of MIP-LTP is provided, in line with SeBI circular on Performance disclosure post consolidation/ merger of scheme dated April 12, 2018.
Portfolio Classification By Asset Class (%)
n equity 22.91
n Units issued by InvIT 1.39
n G-Sec, SDL 6.78
n Credit exposure 59.19
n Cash, Cash equivalents and Net Current Assets 9.73
Portfolio Classification By Rating Class (%)
n equity 22.91n Sovereign 6.78n Units issued by InvIT 1.39n AAA/AAA(SO)/A1+/A1+(SO)
& equivalent 33.79n AA/AA- 21.41n A+ & Below 3.99n Cash, Cash equivalents and
Net Current Assets 9.73
(An open ended hybrid scheme investing predominantly in debt instruments) .....Contd from previous pageHDFC Hybrid Debt Fund

37 June 2021
CATEGORY OF SCHEME: ARBITRAGE FUND
KEY FACTS
INVESTMENT OBJECTIVE
To generate income through arbitrage opportunities and debt & money market instruments.
There is no assurance that the investment objective of the Scheme will be realized.
FUND MANAGER ¥
Krishan Kumar Daga (since September 10, 2015)
Total Experience: Over 22 years
Arun Agarwal (since August 24, 2020)
Total Experience: Over 22 years
INCEPTION DATE (Date of Allotment)
October 23, 2007
NAV (AS ON JUNE 30, 2021) NAV PER UNIT (`)
Retail PlanRegular Plan - Growth Option 23.699Regular Plan - IDCW Option 17.601Regular Plan - Quarterly IDCW Option 16.837Direct Plan - Growth Option 24.796Direct Plan - Quarterly IDCW Option 18.791
Wholesale PlanRegular Plan - Growth Option 24.273Regular Plan - IDCW Option 10.558Regular Plan - Monthly IDCW Option 10.912Direct Plan - Growth Option 15.643Direct Plan - IDCW Option 10.873Direct Plan - Monthly IDCW Option 10.579
ASSETS UNDER MANAGEMENT (`) IN CRORE
As on June 30, 2021 7,185.70Average for Month of June 2021 6,854.93
qUANTITATIVE DATA
Portfolio Turnover Ratio 232.64%Average Maturity * 143 daysMacaulay Duration * 142 daysModified Duration * 141 daysYield to Maturity * 3.76%
*Calculated on amount invested in debt securities (including accrued interest), deployment of funds in TRePS and Reverse Repo and net receivable / payable.
TOTAL ExPENSE RATIO (As on June 30, 2021)Including Additional expenses and Goods and Service Tax on Management Fees
Regular: 0.95% Direct: 0.40%
#BENCHMARK INDEx: NIFTY 50 Arbitrage Index
##ADDL. BENCHMARK INDEx: CRISIL 1 year T-Bill Index
ExIT LOAD
l In respect of each purchase / switch-in of Units, an Exit Load of 0.25% is payable if Units are redeemed / switched-out within 1 month from the date of allotment.
l No Exit Load is payable if Units are redeemed / switched-out after 1 month from the date of allotment.
For further details, please refer to para ‘Exit Load’ on Pg 68.
PLANS & OPTIONS
(Wholesale Plan) - Regular Plan, (Wholesale Plan) - Direct Plan. Under Each Plan: Growth & Income Distribution cum Capital Withdrawal (IDCW) Option. The IDCW Option offers (Monthly and Normal) following Sub-Options: Payout of Income Distribution cum Capital Withdrawal (IDCW) Option; and Re-investment of Income Distribution cum Capital Withdrawal (IDCW) Option.
MINIMUM APPLICATION AMOUNT
Purchase/Additional Purchase: ̀ 1 lakh and any amount thereafter.
¥ Dedicated Fund Manager for Overseas Investments: Mr. Sankalp Baid (since January 22, 2021) (Total Experience: Over 13 years).
Company Industry+ / Rating % to NAVEqUITY & EqUITY RELATED (quantity fully hedged using Futures/Options)EqUITY• Adani Ports & Special
economic Zone Transportation 5.62
• Reliance Industries Ltd. Petroleum Products 5.39
• Bharti Airtel Ltd. Telecom - Services 4.81
• Tata Steel Ltd. Ferrous Metals 4.67
• Kotak Mahindra Bank Ltd. Banks 3.25
• Sun Pharmaceutical Industries Ltd. Pharmaceuticals 2.64
• Vedanta Ltd. Non - Ferrous Metals 2.41
• Infosys Ltd. Software 2.21
• The Tata Power Company Ltd. Power 2.09
• JSW Steel Ltd. Ferrous Metals 1.86
Housing Development Finance Corporation Ltd.£ Finance 1.75
Cadila Healthcare Ltd. Pharmaceuticals 1.54
ICICI Bank Ltd. Banks 1.45
Tech Mahindra Ltd. Software 1.17
Zee entertainment enterprises Ltd. entertainment 0.98
Bajaj Finance Ltd. Finance 0.96
Piramal enterprises Ltd. Finance 0.91
ITC Ltd. Consumer Non Durables 0.88
Axis Bank Ltd. Banks 0.81
Divis Laboratories Ltd. Pharmaceuticals 0.76
Godrej Consumer Products Ltd. Consumer Non Durables 0.76
Hero MotoCorp Ltd. Auto 0.76
State Bank of India Banks 0.73
Jindal Steel & Power Ltd. Ferrous Metals 0.69
Indusind Bank Ltd. Banks 0.65
Amara Raja Batteries Ltd. Auto Ancillaries 0.62
Bank of Baroda Banks 0.57
Punjab National Bank Banks 0.57
Dr Reddys Laboratories Ltd. Pharmaceuticals 0.55
United Spirits Ltd. Consumer Non Durables 0.55
Adani enterprises Ltd. Minerals/Mining 0.53
Coal India Ltd. Minerals/Mining 0.53
Mahindra & Mahindra Ltd. Auto 0.53
Sun TV Network Ltd. entertainment 0.51
ACC Ltd. Cement & Cement Products 0.48
Hindalco Industries Ltd. Non - Ferrous Metals 0.47
Biocon Ltd. Pharmaceuticals 0.42
Steel Authority of India Ltd. Ferrous Metals 0.42
Indiabulls Housing Finance Ltd. Finance 0.41
GAIL (India) Ltd. Gas 0.39
Aurobindo Pharma Ltd. Pharmaceuticals 0.38
DLF Ltd. Construction 0.38
Tata Consultancy Services Ltd. Software 0.38
Vodafone Idea Ltd. Telecom - Services 0.37
Glenmark Pharmaceuticals Ltd. Pharmaceuticals 0.35
Bajaj Auto Ltd. Auto 0.33
HDFC Life Insurance Company Ltd. Insurance 0.32
National Aluminium Company Ltd. Non - Ferrous Metals 0.32
L&T Finance Holdings Ltd. Finance 0.31
Indian Oil Corporation Ltd. Petroleum Products 0.30
Asian Paints Ltd. Consumer Non Durables 0.28
escorts Ltd. Auto 0.27
Hindustan Petroleum Corporation Ltd. Petroleum Products 0.27
Tata Chemicals Ltd. Chemicals 0.27
Mahindra & Mahindra Financial Services Ltd. Finance 0.25
Muthoot Finance Ltd. Finance 0.25
Bharat Petroleum Corporation Ltd. Petroleum Products 0.24
Company Industry+ / Rating % to NAVGranules India Ltd. Pharmaceuticals 0.24
UltraTech Cement Ltd. Cement & Cement Products 0.24
Container Corporation of India Ltd. Transportation 0.21
Hindustan Unilever Ltd. Consumer Non Durables 0.20
Oil & Natural Gas Corporation Ltd. Oil 0.20
Grasim Industries Ltd. Cement & Cement Products 0.18
Motherson Sumi Systems Ltd. Auto Ancillaries 0.18
Cholamandalam Investment & Finance Finance 0.16
Mindtree Consulting Ltd. Software 0.16
Shriram Transport Finance Company Ltd. Finance 0.16
RBL Bank Ltd. Banks 0.14
Siemens Ltd. Industrial Capital Goods 0.14
IDFC First Bank Ltd. Banks 0.13
Indraprastha Gas Ltd. Gas 0.13
Jubilant Foodworks Ltd. Leisure Services 0.13
Pfizer Ltd. Pharmaceuticals 0.13
Bharat Heavy electricals Ltd. Industrial Capital Goods 0.12
Lupin Ltd. Pharmaceuticals 0.12
Torrent Pharmaceuticals Ltd. Pharmaceuticals 0.12
Bata India Ltd. Consumer Durables 0.11
Cummins India Ltd. Industrial Products 0.11
HDFC Bank Ltd. Banks 0.11
MRF Ltd. Auto Ancillaries 0.11
Colgate-Palmolive (I) Ltd. Consumer Non Durables 0.10
Deepak Nitrite Ltd. Chemicals 0.10
Bajaj Finserv Ltd. Insurance 0.09
Havells India Ltd. Consumer Durables 0.09
HCL Technologies Ltd. Software 0.09
Berger Paints (I) Ltd. Consumer Non Durables 0.08
Bosch Ltd. Auto Ancillaries 0.08
LIC Housing Finance Ltd. Finance 0.08
The Federal Bank Ltd. Banks 0.08
The Ramco Cements Ltd. Cement & Cement Products 0.08
Apollo Hospitals enterprise Ltd. Healthcare Services 0.07
Au Small Finance Bank Ltd. Banks 0.07
Bharat Forge Ltd. Industrial Products 0.07
PI Industries Ltd. Pesticides 0.07
Ashok Leyland Ltd. Auto 0.06
Bandhan Bank Ltd. Banks 0.06
Larsen & Toubro Infotech Ltd. Software 0.06
Canara Bank Banks 0.05
L&T Technology Services Ltd. Software 0.05
Page Industries Ltd. Textile Products 0.05
Aditya Birla Fashion and Retail Ltd. Retailing 0.04
Balkrishna Industries Ltd. Auto Ancillaries 0.04
Cipla Ltd. Pharmaceuticals 0.04
Petronet LNG Ltd. Gas 0.04
Alembic Pharmaceuticals Ltd. Pharmaceuticals 0.03
Indian Railway Catering and Tourism Corporation Ltd. Transportation 0.03
Larsen and Toubro Ltd. Construction Project 0.03
Alkem Laboratories Ltd. Pharmaceuticals 0.02
Bharat electronics Ltd. Aerospace & Defense 0.02
Godrej Properties Ltd. Construction 0.02
Indus Towers Ltd. Telecom - equipment & Accessories 0.02
Info edge (India) Ltd. Retailing 0.02
Max Financial Services Ltd. Insurance 0.02
SBI Life Insurance Company Ltd. Insurance 0.02
Titan Company Ltd. Consumer Durables 0.02
TVS Motor Company Ltd. Auto 0.02
Apollo Tyres Ltd. Auto Ancillaries 0.01
Face Value per Unit: ` 10 unless otherwise specified, + Industry Classification as recommended by AMFI, Data is as of June 30, 2021 unless otherwise specified. ....Contd on next page
(An open ended scheme investing in arbitrage opportunities)HDFC Arbitrage FundPORTFOLIO

June 2021 38
Company Industry+ / Rating % to NAVCoromandel International Ltd. Fertilisers 0.01
ICICI Lombard General Insurance Company Ltd. Insurance 0.01
Mahanagar Gas Ltd. Gas 0.01
Manappuram Finance Ltd. Finance 0.01
NMDC Ltd. Minerals/Mining 0.01
NTPC Ltd. Power 0.01
Pidilite Industries Ltd. Chemicals 0.01
ReC Ltd. Finance 0.01
Shree Cement Ltd. Cement & Cement Products 0.01
Trent Ltd. Retailing 0.01
Wipro Ltd. Software 0.01
Ambuja Cements Ltd. Cement & Cement Products @
Indian Hotels Company Ltd. Leisure Services @
InterGlobe Aviation Ltd. Transportation @
Maruti Suzuki India Ltd. Auto @
Metropolis Healthcare Ltd. Healthcare Services @
Tata Consumer Products Ltd. Consumer Non Durables @
Sub Total 68.13DEBT & DEBT RELATEDGOVERNMENT SECURITIES (CENTRAL/STATE)8.35 GOI 2022 Sovereign 1.44
8.2 GOI 2022 Sovereign 1.07
5.09 GOI 2022 Sovereign 1.05
Sub Total 3.56
Company Industry+ / Rating % to NAVDEBT & DEBT RELATEDT-BILLS 364 Days Tbill Mat 301221 Sovereign 1.71
364 Days Tbill Mat 030322 Sovereign 1.63
364 Days Tbill Mat 230921 Sovereign 1.38
364 Days Tbill Mat 091221 Sovereign 1.37
364 Days Tbill - Mat 050522 Sovereign 1.35
364 Days Tbill - Mat 190522 Sovereign 1.35
364 Days Tbill ISD 310321 Mat 300322 Sovereign 1.35
364 Days Tbill Mat 240322 Sovereign 1.35
364 Days Tbill Mat 190821 Sovereign 1.04
364 Days Tbill - Mat 110322 Sovereign 1.02
364 Days TBill - Mat 090921 Sovereign 0.69
364 Days Tbill Mat 220721 Sovereign 0.69
364 Days Tbill Mat 231221 Sovereign 0.68
364 Days Tbill Mat 120821 Sovereign 0.42
364 Days Tbill Mat 290721 Sovereign 0.42
182 Days Tbill Mat 150721 Sovereign 0.35
Sub Total 16.80CREDIT ExPOSURE (NON PERPETUAL)Housing Development Finance Corporation Ltd.£ CRISIL - AAA 1.40
Sub Total 1.40Total 21.76Cash, Cash equivalents and Net Current Assets 10.11
Grand Total 100.00• Top Ten Holdings, £ Co-sponsor, @ Less than 0.01%
Outstanding exposure in derivative instruments (` in Crore) 4,907.83
Hedged position in Equity & Equity related instruments
Outstanding derivative exposure (% age) 68.30
PORTFOLIO
This product is suitable for investors who are seeking ~
l income over short term.
l income through arbitrage opportunities between cash and derivative market and arbitrage opportunities within the derivative segment.
VeryHigh
Low to
Moderate
Low
Moderate ModeratelyHigh High
RISKOMETERInvestors understand that their principal will be at
low risk~ Investors should consult their financial advisers, if in doubt about whether the product is suitable for them.
Face Value per Unit: ` 10 unless otherwise specified, + Industry Classification as recommended by AMFI, CD - Certificate of Deposit; CP - Commercial Papers, Data is as of June 30, 2021 unless otherwise specified.
PERFORMANCE ^ - Wholesale Plan - Regular Plan - Growth Option
Date Period Scheme Returns
(%)
Benchmark Returns
(%)#
Additional Benchmark
Returns (%) ##
Value of ` 10,000 invested
Scheme (`) Benchmark (`)#
Additional Benchmark
(`)##
Jun 30, 20 Last 1 Year 3.43 3.51 3.58 10,343 10,351 10,358Jun 29, 18 Last 3 Years 4.84 4.69 6.39 11,527 11,476 12,047Jun 30, 16 Last 5 Years 5.25 4.75 6.30 12,916 12,610 13,576Oct 23, 07 Since Inception 6.69 N.A. 6.38 24,273 N.A. 23,319
Returns greater than 1 year period are compounded annualized (CAGR). N.A. Not Available. Scheme performance is not strictly comparable with that of its Additional Benchmark since the scheme does not take directional call in equity markets but is limited to availing arbitrage opportunities, etc. For performance of other schemes managed by Krishan Kumar Daga and Arun Agarwal, please refer page 68. Different plans viz. Regular Plan and Direct Plan have a different expense structure. The expenses of the Direct Plan under the Scheme will be lower to the extent of the distribution expenses / commission charged in the Regular Plan. For Performance of Direct Plan, refer page no. 80.
^Past performance may or may not be sustained in the future. Since Inception Date = Date of First allotment in the Scheme / Plan. Load is not taken into consideration for computation of performance.
Portfolio Classification By Rating Class (%)
n equity 68.13
n Sovereign 20.36
n AAA/AAA(SO)/A1+/A1+(SO) & equivalent 1.40
n Cash, Cash equivalents and Net Current Assets 10.11
Portfolio Classification By Asset Class (%)
n equity 68.13
n T-Bills, G-Sec 20.36
n Credit exposure 1.40
n Cash, Cash equivalents and Net Current Assets 10.11
(An open ended scheme investing in arbitrage opportunities) .....Contd from previous pageHDFC Arbitrage Fund
Industry Allocation of Equity Holding (% of Net Assets)
0.010.020.020.030.050.070.070.070.130.180.200.220.260.380.400.460.570.991.041.071.49
1.972.10
2.853.20
4.135.185.26
5.866.20
7.347.64
8.67
0 1 2 3 4 5 6 7 8 9 10Fertilisers
Aerospace & DefenseTelecom - Equipment & Accessories
Construction ProjectTextile Products
RetailingHealthcare Services
PesticidesLeisure Services
Industrial ProductsOil
Consumer DurablesIndustrial Capital Goods
ChemicalsConstruction
InsuranceGas
Cement & Cement ProductsAuto Ancillaries
Minerals/MiningEntertainment
AutoPower
Consumer Non DurablesNon - Ferrous Metals
SoftwareTelecom - Services
FinanceTransportation
Petroleum ProductsPharmaceuticals
Ferrous MetalsBanks
SIP PERFORMANCE ^ - Regular Plan - Growth Option
Since Inception SIP
10 year SIP
5 year SIP
3 year SIP
1 year SIP
Total Amount Invested (` ‘000) 1,650.00 1,200.00 600.00 360.00 120.00 Mkt Value As on June 30, 2021 (` ‘000) 2,585.70 1,617.37 677.55 384.71 122.68 Returns (%) 6.27 5.82 4.81 4.37 4.19 Benchmark Returns (%) # N.A. 5.52 4.45 4.16 4.66 Additional Benchmark Returns (%) ## 6.56 6.63 5.99 5.50 3.57
Assuming ` 10,000 invested systematically on the first Business Day of every month over a period of time. CAGR returns are computed after accounting for the cash flow by using xIRR method (investment internal rate of return) for Regular Plan - Growth Option. The above investment simulation is for illustrative purposes only and should not be construed as a promise on minimum returns and safeguard of capital.

39 June 2021
CATEGORY OF SCHEME: CORPORATE BOND FUND
KEY FACTSINVESTMENT OBJECTIVE
To generate income/capital appreciation through investments predominantly in AA+ and above rated corporate bonds.
There is no assurance that the investment objective of the Scheme will be realized.
FUND MANAGER ¥
Anupam Joshi (since October 27, 2015)
Total Experience: Over 12 years
INCEPTION DATE (Date of Allotment)
June 29, 2010
NAV (AS ON JUNE 30, 2021) NAV PER UNIT (`)
Regular Plan - Growth Option 25.2861Regular Plan - IDCW Option 17.1983Regular Plan - Quarterly IDCW Option 10.4233Direct Plan - Growth Option 25.5648Direct Plan - IDCW Option 17.5460Direct Plan - Quarterly IDCW Option 10.3455
ASSETS UNDER MANAGEMENT (`) IN CRORE
As on June 30, 2021 26,697.86Average for Month of June 2021 26,616.67
qUANTITATIVE DATA
Average Maturity * 4.26 yearsMacaulay Duration * 2.89 yearsModified Duration * 2.72 yearsYield to Maturity * 5.42%
*Calculated on amount invested in debt securities (including accrued interest), deployment of funds in TRePS and Reverse Repo and net receivable / payable.
TOTAL ExPENSE RATIO (As on June 30, 2021)Including Additional expenses and Goods and Service Tax on Management Fees
Regular: 0.61% Direct: 0.30%
#BENCHMARK INDEx: NIFTY Corporate Bond Index
##ADDL. BENCHMARK INDEx: CRISIL 10 year Gilt Index
ExIT LOAD
Nil
PLANS & OPTIONS
Regular Plan, Direct Plan. Under both the Plans: Growth, (Quarterly & Normal) Income Distribution cum Capital Withdrawal (IDCW) Option. Both (Quarterly & Normal) IDCW Option offers following Sub-Options: Payout of Income Distribution cum Capital Withdrawal (IDCW) Option; and Re-investment of Income Distribution cum Capital Withdrawal (IDCW) Option.
MINIMUM APPLICATION AMOUNT
Purchase : ` 5,000 and any amount thereafter. Additional Purchase : ` 1,000 and any amount thereafter.
¥ Dedicated Fund Manager for Overseas Investments: Mr. Sankalp Baid (since January 22, 2021) (Total Experience: Over 13 years).
Face Value per Unit: ` 10 unless otherwise specified, CD - Certificate of Deposit; CP - Commercial Papers, Data is as of June 30, 2021 unless otherwise specified.
This product is suitable for investors who are seeking ~
l income over short to medium term
l to generate income/capital appreciation through investments predominantly in AA+ and above rated corporate bonds
VeryHigh
Low to
Moderate
Low
Moderate ModeratelyHigh High
RISKOMETERInvestors understand that their principal will be at
moderate risk~ Investors should consult their financial advisers, if in doubt about whether the product is suitable for them.
Issuer Rating % to NAV
DEBT & DEBT RELATED
GOVERNMENT SECURITIES (CENTRAL/STATE)
• Floating Rate GOI 2033 Sovereign 3.69
• 6.79 GOI 2027 Sovereign 3.29
6.97 GOI 2026 Sovereign 2.93
8.24 GOI 2027 Sovereign 2.06
GOI STRIPS - Mat 170626 Sovereign 0.43
8.15 GOI 2026 Sovereign 0.31
GOI STRIPS - Mat 150326 Sovereign 0.28
GOI STRIPS - Mat 150926 Sovereign 0.27
GOI STRIPS - Mat 260426 Sovereign 0.14
GOI STRIPS - Mat 261026 Sovereign 0.14
GOI STRIPS - Mat 260427 Sovereign 0.13
GOI STRIPS - Mat 261027 Sovereign 0.13
8.21% Haryana SDL (UDAY) - Mat 310323 Sovereign 0.12
7.17 GOI 2028 Sovereign 0.10
7.59 GOI 2026 Sovereign 0.10
5.63 GOI 2026 Sovereign 0.09
GOI STRIPS - Mat 121227 Sovereign 0.09
GOI STRIPS - Mat 020126 Sovereign 0.06
GOI STRIPS - Mat 020726 Sovereign 0.06
GOI STRIPS - Mat 120627 Sovereign 0.06
GOI STRIPS - Mat 020127 Sovereign 0.05
GOI STRIPS - Mat 020727 Sovereign 0.05
Sub Total 14.58
CREDIT ExPOSURE (NON PERPETUAL)
• LIC Housing Finance Ltd. CARe - AAA / CRISIL - AAA 9.43
• REC Ltd. CARe - AAA / CRISIL - AAA / IND - AAA 8.83
• Power Finance Corporation Ltd.
CARe - AAA / CRISIL - AAA / ICRA - AAA 8.24
• Housing Development Finance Corporation Ltd.£ CRISIL - AAA 8.03
• National Bank for Agriculture and Rural Development CRISIL - AAA / ICRA - AAA 7.87
• State Bank of India CRISIL - AAA 6.32
• Bajaj Finance Ltd. CRISIL - AAA 4.18
• Reliance Industries Ltd. CRISIL - AAA / ICRA - AAA 3.73
Mangalore Refinery and Petrochemicals Ltd. CARe - AAA / CRISIL - AAA 3.18
UltraTech Cement Ltd. CRISIL - AAA 2.77
National Highways Authority of India CARe - AAA / CRISIL - AAA 2.29
ONGC Petro additions Ltd. (OPAL) (Put on ONGC Ltd.) CARe - AAA(Ce) 1.64
Issuer Rating % to NAV
Indian Railways Finance Corporation Ltd. CRISIL - AAA 1.63
Chennai Petroleum Corporation Ltd. CRISIL - AAA 1.48
Bank of Baroda CARe - AAA 1.18
Sikka Port and Terminal Ltd. (erstwhile Reliance Ports and Terminals Ltd.)
CARe - AAA / CRISIL - AAA 1.14
Power Grid Corporation of India Ltd. CRISIL - AAA 1.03
Housing and Urban Development Corporation Ltd. CARe - AAA / IND - AAA 0.96
Pipeline Infrastructure Pvt. Ltd. CRISIL - AAA 0.91
Jamnagar Utilities & Power Pvt. Ltd. (erstwhile Reliance Utilities & Power Pvt. Ltd.) CRISIL - AAA 0.83
Sundaram Finance Ltd. ICRA - AAA 0.72
export - Import Bank of India CRISIL - AAA 0.68
Food Corporation of India (Corporate guarantee from Govt of India)
CARe - AAA(Ce) / CRISIL - AAA(Ce) 0.65
Indian Oil Corporation Ltd. CRISIL - AAA 0.58
Britannia Industries Ltd. CRISIL - AAA 0.56
Larsen and Toubro Ltd. CRISIL - AAA 0.37
NTPC Ltd. CRISIL - AAA 0.36
National Housing Bank CRISIL - AAA 0.29
L&T Finance Ltd. CARe - AAA 0.21
NHPC Ltd. CARe - AAA 0.20
HDB Financial Services Ltd. CRISIL - AAA 0.19
First Business Receivables Trust (PTC backed by receivables from Reliance Corporate IT Park Ltd.) CRISIL - AAA(SO) 0.15
Andhra Pradesh expressway Ltd. (NHAI Annuity) ICRA - AAA 0.10
Gujarat Road and Infra CompanyLtd. CARe - AAA 0.10
Nuclear Power Corporation CRISIL - AAA 0.10
ICICI Bank Ltd. CARe - AAA 0.04
Mahanagar Telephone Nigam Ltd. (Corporate guarantee from Govt of India) CRISIL - AAA(Ce) 0.04
Sub Total 81.01
Total 95.59
Cash, Cash equivalents and Net Current Assets 4.41
Grand Total 100.00
• Top Ten Holdings, £ Co-sponsor
Outstanding exposure in derivative instruments Interest Rate Swap (` in Crore) 4,400.00
Note: Effective close of business hours of May 8, 2018, HDFC Medium Term Opportunities Fund (HMTOF) underwent changes in Fundamental Attributes and was renamed as HDFC Corporate Bond Fund (HCBF) and HDFC Floating Rate Income Fund – Long Term Plan and HDFC Gilt Fund – Short Term Plan were merged therein. As the portfolio structuring of HCBF closely resembles the erstwhile HMTOF, the past performance of HMTOF is provided, in line with SEBI circular on Performance disclosure post consolidation/ merger of scheme dated April 12, 2018.
Portfolio Classification By Asset Class (%)
n G-Sec, SDL, G-Sec Strips 14.58
n Credit exposure 81.01
n Cash, Cash equivalents and Net Current Assets 4.41
Portfolio Classification By Rating Class (%)
n Sovereign 14.58n AAA/AAA(SO)/A1+/A1+(SO)
& equivalent 81.01n Cash, Cash equivalents and
Net Current Assets 4.41
(An open ended debt scheme predominantly investing in AA+ and above rated corporate bonds)HDFC Corporate Bond Fund
PORTFOLIO

June 2021 40
PERFORMANCE ^ - Regular Plan - Growth Option
Date Period Scheme Returns
(%)
Benchmark Returns
(%)#
Additional Benchmark
Returns (%) ##
Value of ` 10,000 invested
Scheme (`) Benchmark (`)#
Additional Benchmark
(`)##
Jun 30, 20 Last 1 Year 5.75 7.23 4.08 10,575 10,723 10,408Jun 29, 18 Last 3 Years 9.30 9.36 9.61 13,064 13,086 13,174Jun 30, 16 Last 5 Years 8.43 8.35 7.25 14,994 14,938 14,192Jun 29, 10 Since Inception 8.79 8.64 6.89 25,286 24,907 20,834
Returns greater than 1 year period are compounded annualized (CAGR). For performance of other schemes managed by Anupam Joshi, please refer page 68. Different plans viz. Regular Plan and Direct Plan have a different expense structure. The expenses of the Direct Plan under the Scheme will be lower to the extent of the distribution expenses / commission charged in the Regular Plan. For Performance of Direct Plan, refer page no. 74.
^Past performance may or may not be sustained in the future. Since Inception Date = Date of First allotment in the Scheme / Plan. Load is not taken into consideration for computation of performance.
(An open ended debt scheme predominantly investing in AA+ and above rated corporate bonds).....Contd from previous pageHDFC Corporate Bond Fund
SIP PERFORMANCE ^ - Regular Plan - Growth Option
Since Inception SIP
10 year SIP
5 year SIP
3 year SIP
1 year SIP
Total Amount Invested (` ‘000) 1,330.00 1,200.00 600.00 360.00 120.00 Mkt Value As on June 30, 2021 (` ‘000) 2,196.95 1,878.05 740.56 409.70 123.09 Returns (%) 8.72 8.67 8.36 8.60 4.84 Benchmark Returns (%) # 8.75 8.73 8.53 9.12 6.12 Additional Benchmark Returns (%) ## 7.43 7.52 7.19 7.82 4.64
Assuming ` 10,000 invested systematically on the first Business Day of every month over a period of time. CAGR returns are computed after accounting for the cash flow by using xIRR method (investment internal rate of return) for Regular Plan - Growth Option. The above investment simulation is for illustrative purposes only and should not be construed as a promise on minimum returns and safeguard of capital.

41 June 2021
CATEGORY OF SCHEME: CREDIT RISK FUND
KEY FACTS
INVESTMENT OBJECTIVE
To generate income/capital appreciation by investing predominantly in AA and below rated corporate debt.
There is no assurance that the investment objective of the Scheme will be realized.
FUND MANAGER ¥
Shobhit Mehrotra (since March 25, 2014)
Total Experience: Over 25 years
INCEPTION DATE (Date of Allotment)
March 25, 2014
NAV (AS ON JUNE 30, 2021) NAV PER UNIT (`)
Regular Plan - Growth Option 18.6935Regular Plan - IDCW Option 17.2128Regular Plan - Quarterly IDCW Option 10.4068Direct Plan - Growth Option 19.7101Direct Plan - IDCW Option 17.2774Direct Plan - Quarterly IDCW Option 10.6548
ASSETS UNDER MANAGEMENT (`) IN CRORE
As on June 30, 2021 7,783.74Average for Month of June 2021 7,718.41
qUANTITATIVE DATA
Average Maturity * 3.06 yearsMacaulay Duration * 2.51 yearsModified Duration * 2.38 yearsYield to Maturity * 7.03%*Calculated on amount invested in debt securities (including accrued interest), deployment of funds in TRePS and Reverse Repo and net receivable / payable.
#BENCHMARK INDEx: NIFTY Credit Risk Bond Index
##ADDL. BENCHMARK INDEx: CRISIL 10 year Gilt Index
TOTAL ExPENSE RATIO (As on June 30, 2021)Including Additional expenses and Goods and Service Tax on Management Fees
Regular: 1.61% Direct: 1.06%
ExIT LOAD
l In respect of each purchase / switch-in of Units, 15% of the units (“the limit”) may be redeemed without any exit Load from the date of allotment
l Any redemption in excess of the above limit shall be subject to the following exit load:
n In respect of each purchase / switch-in of Units, an Exit Load of 1.00% is payable if Units are redeemed / switched-out within 12 months from the date of allotment
n In respect of each purchase / switch-in of Units, an Exit Load of 0.50% is payable if Units are redeemed / switched-out after 12 months but within 18 months from the date of allotment
l No Exit Load is payable if Units are redeemed / switched-out after 18 months from the date of allotment
For further details, please refer to para ‘Exit Load’ on Pg 68.
PLANS & OPTIONS
Regular Plan, Direct Plan. Under Each Plan: Growth, (quarterly & Normal) Income Distribution cum Capital Withdrawal (IDCW) Option. Both (Quarterly & Normal) IDCW Option offers following Sub-Options: Payout of Income Distribution cum Capital Withdrawal (IDCW) Option; and Re-investment of Income Distribution cum Capital Withdrawal (IDCW) Option.
MINIMUM APPLICATION AMOUNT
Purchase : ` 5,000 and any amount thereafter. Additional Purchase : ` 1,000 and any amount thereafter.
¥ Dedicated Fund Manager for Overseas Investments: Mr. Sankalp Baid (since January 22, 2021) (Total Experience: Over 13 years).
PERFORMANCE ^ - Regular Plan - Growth Option
Date Period Scheme Returns
(%)
Benchmark Returns
(%)#
Additional Benchmark
Returns (%) ##
Value of ` 10,000 invested
Scheme (`) Benchmark (`)#
Additional Benchmark
(`)##
Jun 30, 20 Last 1 Year 10.51 9.67 4.08 11,051 10,967 10,408Jun 29, 18 Last 3 Years 9.09 9.61 9.61 12,987 13,174 13,174Jun 30, 16 Last 5 Years 8.30 8.90 7.25 14,904 15,320 14,192Mar 25, 14 Since Inception 8.98 9.42 8.33 18,694 19,241 17,896
The above returns are for Regular Plan - Growth Option. Returns greater than 1 year period are compounded annualized (CAGR). Load is not taken into consideration for computation of performance. For performance of other schemes managed by Shobhit Mehrotra, please refer page 68. Different plans viz. Regular Plan and Direct Plan have a different expense structure. The expenses of the Direct Plan under the Scheme will be lower to the extent of the distribution expenses / commission charged in the Regular Plan. For Performance of Direct Plan, refer page no. 73.
This product is suitable for investors who are seeking ~
l income over short to medium terml to generate income/capital appreciation by investing
predominantly in AA and below rated corporate debt (excluding AA+ rated corporate bonds)
VeryHigh
Low to
Moderate
Low
Moderate ModeratelyHigh High
RISKOMETERInvestors understand that their principal will be at
high risk
~ Investors should consult their financial advisers, if in doubt about whether the product is suitable for them.
Note: Effective close of business hours of May 8, 2018, HDFC Corporate Debt Opportunities Fund (HCDOF) underwent changes in Fundamental Attributes and was renamed as HDFC Credit Risk Debt Fund (HCRDF) and HDFC Regular Savings Fund was merged therein. As the portfolio structuring of HCRDF closely resembles the erstwhile HCDOF, the past performance of HCDOF is provided, in line with SeBI circular on Performance disclosure post consolidation/ merger of scheme dated April 12, 2018.
Portfolio Classification By Asset Class (%)
n Units issued by InvIT 1.55
n G-Sec, SDL 8.09
n CP 1.28
n Credit exposure 78.60
n Cash, Cash equivalents and Net Current Assets 10.48
Portfolio Classification By Issuer Rating Class (%) ≈
n Sovereign 8.09n Units issued by InvIT 1.55n AAA/AAA(SO)/A1+/A1+(SO)
& equivalent 23.73n AA+ 0.39n AA/AA- 49.12n A+ & Below 6.64n Cash, Cash equivalents and
Net Current Assets 10.48
[An open ended debt scheme predominantly investing in AA andbelow rated corporate bonds (excluding AA+ rated corporate bonds)]HDFC Credit Risk Debt Fund
Face Value per Unit: ` 10 unless otherwise specified, Data is as of June 30, 2021 unless otherwise specified. ≈ Based on long term rating.
SIP PERFORMANCE ^ - Regular Plan - Growth Option
Since Inception SIP
5 year SIP
3 year SIP
1 year SIP
Total Amount Invested (` ‘000) 880.00 600.00 360.00 120.00 Mkt Value As on June 30, 2021 (` ‘000) 1,211.20 743.69 415.97 126.14 Returns (%) 8.56 8.53 9.63 9.69 Benchmark Returns (%) # 9.15 9.17 9.96 9.59 Additional Benchmark Returns (%) ## 7.53 7.19 7.82 4.64
Assuming ` 10,000 invested systematically on the first Business Day of every month over a period of time. CAGR returns are computed after accounting for the cash flow by using xIRR method (investment internal rate of return) for Regular Plan - Growth Option. The above investment simulation is for illustrative purposes only and should not be construed as a promise on minimum returns and safeguard of capital.
^Past performance may or may not be sustained in the future. Since Inception Date = Date of First allotment in the Scheme / Plan. Load is not taken into consideration for computation of performance.

June 2021 42
Company Industry+ / Security Rating
Issuer Rating % to NAV
UNITS ISSUED BY REIT & INVIT
UNITS ISSUED BY INVIT
POWeRGRID Infrastructure Investment Trust Power Power 1.55
Sub Total 1.55
Total 1.55
DEBT & DEBT RELATED
GOVERNMENT SECURITIES (CENTRAL/STATE)
7.17 GOI 2028 Sovereign Sovereign 1.68
6.79 GOI 2027 Sovereign Sovereign 0.99
8.53% Tamil Nadu SDL - Mat 090326 Sovereign Sovereign 0.99
7.27 GOI 2026 Sovereign Sovereign 0.81
7.89% Gujarat SDL - Mat 150525 Sovereign Sovereign 0.55
7.32 GOI 2024 Sovereign Sovereign 0.54
7.62% Gujarat SDL - Mat 011127 Sovereign Sovereign 0.47
7.98% Tamil Nadu SDL - Mat 250526 Sovereign Sovereign 0.41
7.59 GOI 2026 Sovereign Sovereign 0.34
7.72 GOI 2025 Sovereign Sovereign 0.34
7.02% Gujarat SDL - Mat 280826 Sovereign Sovereign 0.33
5.15 GOI 2025 Sovereign Sovereign 0.32
6.18% Gujarat SDL - Mat 310326 Sovereign Sovereign 0.32
Sub Total 8.09
CREDIT ExPOSURE (NON PERPETUAL)
• Tata Motors Ltd. CRISIL - AA- CRISIL - AA- 5.33
• IndInfravit Trust CRISIL - AAA CRISIL - AAA 4.58
• Bharti Hexacom Ltd. CRISIL - AA INTeRNAL - AA- 4.57
• Pipeline Infrastructure Pvt. Ltd. CRISIL - AAA CRISIL - AAA 4.42
• Power Finance Corporation Ltd. CRISIL - AAA CRISIL - AAA 4.35
• Vedanta Ltd. CRISIL - AA- CRISIL - AA- 4.33
• Shriram City Union Finance Ltd. CRISIL - AA CRISIL - AA 3.64
• Green Infra Wind Energy Ltd. CRISIL - AA CRISIL - AA- 2.94
• Dilip Buildcon Ltd. CRISIL - A CRISIL - A 2.42
JM Financial Asset Reconstruction Company Ltd. ICRA - AA- CRISIL - AA- 2.16
ReC Ltd. CRISIL - AAA CRISIL - AAA 2.11
Indiabulls Housing Finance Ltd. CARe - AA CRISIL - AA 1.98
DLF Ltd. ICRA - A+ CRISIL - A+ 1.94
embassy Office Parks ReIT CRISIL - AAA CRISIL - AAA 1.93
Nuvoco Vistas Corporation Ltd. (100% subsidiary of Nirma Ltd. & erstwhile Lafarge India Ltd.) CRISIL - AA CRISIL - AA 1.84
INOx Wind Ltd. CRISIL - AA(Ce) CRISIL - AA(Ce) 1.74
TVS Credit Services Ltd. CRISIL - AA- ICRA - A+ 1.68
Tata Projects Ltd. IND - AA IND - AA 1.66
Sikka Port and Terminal Ltd. (erstwhile Reliance Ports and Terminals Ltd.) CRISIL - AAA CRISIL - AAA 1.62
INOx Wind Infrastructure Services Ltd. CRISIL - AA(Ce) CRISIL - AA(Ce) 1.48
LIC Housing Finance Ltd. CRISIL - AAA CRISIL - AAA 0.99
India Grid Trust ICRA - AAA / IND - AAA CRISIL - AAA 0.91
Company Industry+ / Security Rating
Issuer Rating % to NAV
GeRA Development Pvt. Ltd. CARe - AA- CARe - AA- 0.86
NTPC Ltd. CRISIL - AAA CRISIL - AAA 0.84
Aarish Solar Power Pvt. Ltd. (Greenko) CARe - AA(Ce) CARe - AA(Ce) 0.73
Aashman energy Pvt. Ltd. (Greenko) CARe - AA(Ce) CARe - AA(Ce) 0.73
Divyesh Power Pvt. Ltd. (Greenko) CARe - AA(Ce) CARe - AA(Ce) 0.73
elena Renewable energy Pvt. Ltd. (Greenko) CARe - AA(Ce) CARe - AA(Ce) 0.73
Pratyash Renewable Pvt. Ltd. (Greenko) CARe - AA(Ce) CARe - AA(Ce) 0.73
SeI Baskara Power Pvt. Ltd. (Greenko) CARe - AA(Ce) BRICKWORKS - AA-(SO) 0.73
SeI enerstar Renewable energy Pvt. Ltd. (Greenko) CARe - AA(Ce) CARe - AA(Ce) 0.73
SeI Mihir energy Pvt. Ltd. (Greenko) CARe - AA(Ce) CARe - AA(Ce) 0.73
Shreyas Renewable energy Pvt. Ltd. (Greenko) CARe - AA(Ce) CARe - AA(Ce) 0.73
Zuvan energy Pvt. Ltd. (Greenko) CARe - AA(Ce) CARe - AA(Ce) 0.73
The Tata Power Company Ltd. CRISIL - AA ICRA - AA- 0.65
Indian Oil Corporation Ltd. CRISIL - AAA CRISIL - AAA 0.64
Motilal Oswal Finvest Ltd. CRISIL - AA- INTeRNAL - AA 0.64
Gateway Distriparks Ltd. IND - AA- IND - AA- 0.52
Starlite Lighting Ltd. (Corporate Guarantee of Bajaj electrical Ltd.) ICRA - A(Ce) ICRA - A(Ce) 0.46
Shriram Transport Finance Company Ltd. IND - AA+ CRISIL - AA+ 0.39
Sansar Trust Nov 2018 (PTC of pools from Shriram Transport Finance Company Ltd.) ICRA - AAA(SO) ICRA - AAA(SO) 0.38
Indian Railways Finance Corporation Ltd. CRISIL - AAA CRISIL - AAA 0.35
L&T Finance Ltd. CRISIL - AAA CARe - AAA 0.33
MFL Securitisation Trust LxxxI (PTC of pools from Magma Fincorp Ltd.) CRISIL - AAA(SO) CRISIL - AAA(SO) 0.27
Coastal Gujarat Power Ltd. (Corporate Guarantee of Tata Power) CARe - AA(Ce) CRISIL - A 0.14
Reliance Industries Ltd. CRISIL - AAA CRISIL - AAA 0.01
Sub Total 72.40
CREDIT ExPOSURE (PERPETUAL BONDS)
• Punjab National Bank (AT1, BASeL III, Perpetual) CRISIL - AA- CARe - AA 3.18
Punjab National Bank (AT1, BASeL III, Perpetual) IND - AA CARe - AA 1.44
TMF Holdings Ltd. (Subsidiary of Tata Motors Ltd.) (Perpetual) CRISIL - AA- CRISIL - AA- 1.26
Indian Bank (AT1, BASeL III, Perpetual) CRISIL - AA CARe - AA 0.32
Sub Total 6.20
Total 86.69
MONEY MARKET INSTRUMENTS
CP
Steel Authority of India Ltd. CARE - A1+ CARe - AA- 0.64
The Tata Power Company Ltd. CRISIL - A1+ ICRA - AA- 0.64
Sub Total 1.28
Total 1.28
Cash, Cash equivalents and Net Current Assets 10.48
Grand Total 100.00
• Top Ten Holdings
Face Value per Unit: ̀ 10 unless otherwise specified, + Industry Classification as recommended by AMFI, CD - Certificate of Deposit; CP - Commercial Papers, Data is as of June 30, 2021 unless otherwise specified.
[An open ended debt scheme predominantly investing in AA and below rated corporate bonds (excluding AA+ rated corporate bonds)] .....Contd from previous pageHDFC Credit Risk Debt Fund
PORTFOLIO

43 June 2021
CATEGORY OF SCHEME: BANKING AND PSU FUND
KEY FACTSINVESTMENT OBJECTIVETo generate income / capital appreciation through investments in debt and money market instruments consisting predominantly of securities issued by entities such as Scheduled Commercial Banks (SCBs), Public Sector undertakings (PSUs), Public Financial Institutions (PFIs), Municipal Corporations and such other bodies.There is no assurance that the investment objective of the Scheme will be realized.
FUND MANAGER ¥
Anil Bamboli (since March 26, 2014)
Total Experience: Over 23 years
INCEPTION DATE (Date of Allotment)March 26, 2014
NAV (AS ON JUNE 30, 2021) NAV PER UNIT (`)Regular Plan - Growth Option 18.1028Regular Plan - IDCW Option 10.1424Direct Plan - Growth Option 18.5418Direct Plan - IDCW Option 10.0132
ASSETS UNDER MANAGEMENT (`) IN CROREAs on June 30, 2021 9,926.80Average for Month of June 2021 9,833.32
qUANTITATIVE DATAAverage Maturity * 3.95 yearsMacaulay Duration * 2.84 yearsModified Duration * 2.67 yearsYield to Maturity * 5.57%*Calculated on amount invested in debt securities (including accrued interest), deployment of funds in TRePS and Reverse Repo and net receivable / payable.
TOTAL ExPENSE RATIO (As on June 30, 2021)Including Additional expenses and Goods and Service Tax on Management FeesRegular: 0.82% Direct: 0.36%
#BENCHMARK INDEx: NIFTY Banking & PSU Index
##ADDL. BENCHMARK INDEx: CRISIL 10 year Gilt Index
ExIT LOADNil
PLANS & OPTIONSRegular Plan, Direct Plan. Under Each Plan: Growth & Income Distribution cum Capital Withdrawal (IDCW) Option (Weekly frequency). The IDCW Option offers following Sub-Options: Payout of Income Distribution cum Capital Withdrawal (IDCW) Option; and Re-investment of Income Distribution cum Capital Withdrawal (IDCW) Option.
MINIMUM APPLICATION AMOUNTPurchase : ` 5,000 and any amount thereafter. Additional Purchase : ` 1,000 and any amount thereafter.
¥ Dedicated Fund Manager for Overseas Investments: Mr. Sankalp Baid (since January 22, 2021) (Total Experience: Over 13 years).
Face Value per Unit: ` 10 unless otherwise specified, Data is as of June 30, 2021 unless otherwise specified.
This product is suitable for investors who are seeking ~
l income over short to medium term.l to generate income / capital appreciation through investments
in debt and money market instruments consisting predominantly of securities issued by entities such as Scheduled Commercial Banks (SCBs), Public Sector undertakings (PSUs), Public Financial Institutions (PFIs), Municipal Corporations and such other bodies
VeryHigh
Low to
Moderate
Low
Moderate ModeratelyHigh High
RISKOMETERInvestors understand that their principal will be at
moderate risk
~ Investors should consult their financial advisers, if in doubt about whether the product is suitable for them.
Issuer Rating % to NAV
DEBT & DEBT RELATED
GOVERNMENT SECURITIES (CENTRAL/STATE)
6.79 GOI 2027 Sovereign 2.13
6.97 GOI 2026 Sovereign 1.05
5.79 GOI 2030 Sovereign 0.88
7.02% Gujarat SDL - Mat 280826 Sovereign 0.52
5.63 GOI 2026 Sovereign 0.50
5.85 GOI 2030 Sovereign 0.15
Sub Total 5.23
CREDIT ExPOSURE (NON PERPETUAL)
• Power Finance Corporation Ltd. CARe - AAA / CRISIL - AAA / ICRA - AAA 7.74
• REC Ltd. CRISIL - AAA / IND - AAA 6.63
• State Bank of India CRISIL - AAA 5.80
• Housing and Urban Development Corporation Ltd. CARe - AAA 5.58
• National Bank for Agriculture and Rural Development CRISIL - AAA 5.47
• Indian Railways Finance Corporation Ltd. CRISIL - AAA 5.23
• NHPC Ltd. CARe - AAA / ICRA - AAA 2.85
• Hindustan Petroleum Corporation Ltd. CRISIL - AAA 2.83
ONGC Petro additions Ltd. (OPAL) (Put on ONGC Ltd.) CARe - AAA(Ce) 2.43
Food Corporation of India (Corporate guarantee from Govt of India) CARe - AAA(Ce) 2.41
National Highways Authority of India CRISIL - AAA 2.10
Mahanagar Telephone Nigam Ltd. (Corporate guarantee from Govt of India) CRISIL - AAA(Ce) 2.08
Power Grid Corporation of India Ltd. CRISIL - AAA 1.32
Vedanta Ltd. CRISIL - AA- 1.27
LIC Housing Finance Ltd. CRISIL - AAA 1.12
L&T Finance Ltd. CRISIL - AAA 1.04
Indian Oil Corporation Ltd. CRISIL - AAA 1.02
The Tata Power Company Ltd. CRISIL - AA 0.80
export - Import Bank of India CRISIL - AAA 0.70
Sikka Port and Terminal Ltd. (erstwhile Reliance Ports and Terminals Ltd.) CRISIL - AAA 0.58
TATA Capital Housing Finance Ltd. CRISIL - AAA 0.52
NTPC Ltd. CRISIL - AAA 0.51
TMF Holdings Ltd. (Subsidiary of Tata Motors Ltd.) ICRA - AA- 0.31
Shriram Transport Finance Company Ltd. IND - AA+ 0.26
Bank of Baroda CARe - AAA 0.21
Issuer Rating % to NAV
Aashman energy Pvt. Ltd. (Greenko) CARe - AA(Ce) 0.11
Divyesh Power Pvt. Ltd. (Greenko) CARe - AA(Ce) 0.11
elena Renewable energy Pvt. Ltd. (Greenko) CARe - AA(Ce) 0.11
Pratyash Renewable Pvt. Ltd. (Greenko) CARe - AA(Ce) 0.11
SeI Baskara Power Pvt. Ltd. (Greenko) CARe - AA(Ce) 0.11
SeI enerstar Renewable energy Pvt. Ltd. (Greenko) CARe - AA(Ce) 0.11
SeI Mihir energy Pvt. Ltd. (Greenko) CARe - AA(Ce) 0.11
Shreyas Renewable energy Pvt. Ltd. (Greenko) CARe - AA(Ce) 0.11
Zuvan energy Pvt. Ltd. (Greenko) CARe - AA(Ce) 0.11
Housing Development Finance Corporation Ltd.£ CRISIL - AAA 0.05
Sub Total 61.85
CREDIT ExPOSURE (PERPETUAL BONDS)
• Bank of Baroda (AT1, BASeL III, Perpetual) CARe - AA 3.36
• Canara Bank (AT1, BASeL III, Perpetual) CARe - AA 2.55
Union Bank of India (AT1, BASeL III, Perpetual) CARe - AA- 1.76
Union Bank of India (AT1, BASeL III, Perpetual) CRISIL - AA- 1.23
Union Bank of India (AT1, BASeL III, Perpetual) IND - AA 1.09
Punjab National Bank (AT1, BASeL III, Perpetual) CRISIL - AA- 1.02
Punjab National Bank (AT1, BASeL III, Perpetual) IND - AA 0.67
State Bank of India (AT1, BASeL III, Perpetual) CRISIL - AA+ 0.48
Bank of Baroda (AT1, BASeL III, Perpetual) CRISIL - AA+ 0.36
ICICI Bank Ltd. (AT1, BASeL III, Perpetual) CARE - AA+ 0.21
Sub Total 12.73
Total 79.81
MONEY MARKET INSTRUMENTS
CD
Axis Bank Ltd. CRISIL - A1+ 2.02
IDFC First Bank Ltd. CRISIL - A1+ 0.98
Sub Total 3.00
Total 3.00
Cash, Cash equivalents and Net Current Assets 17.19
Grand Total 100.00
• Top Ten Holdings, £ Co-sponsor
Outstanding exposure in derivative instruments Interest Rate Swap (` in Crore) 825.00
Portfolio Classification By Asset Class (%)
n G-Sec, SDL 5.23
n CD 3.00
n Credit exposure 74.58
n Cash, Cash equivalents and Net Current Assets 17.19
Portfolio Classification By Rating Class (%)
n Sovereign 5.23n AAA/AAA(SO)/A1+/A1+(SO)
& equivalent 61.22n AA+ 1.31n AA/AA- 15.05n Cash, Cash equivalents and
Net Current Assets 17.19
(An open ended debt scheme predominantly investing in debt instruments of banks, public sector undertakings, public financial institutions and municipal bonds)HDFC Banking and PSU Debt Fund
PORTFOLIO

June 2021 44
PERFORMANCE ^ - Regular Plan - Growth Option
Date Period Scheme Returns
(%)
Benchmark Returns
(%)#
Additional Benchmark
Returns (%) ##
Value of ` 10,000 invested
Scheme (`) Benchmark (`)#
Additional Benchmark
(`)##
Jun 30, 20 Last 1 Year 6.03 5.52 4.08 10,603 10,552 10,408Jun 29, 18 Last 3 Years 8.91 8.62 9.61 12,924 12,820 13,174Jun 30, 16 Last 5 Years 8.07 7.63 7.25 14,743 14,448 14,192Mar 26, 14 Since Inception 8.51 8.29 8.33 18,103 17,837 17,887
The above returns are for Regular Plan - Growth Option. Returns greater than 1 year period are compounded annualized (CAGR). For performance of other schemes managed by Anil Bamboli, please refer page 68. Different plans viz. Regular Plan and Direct Plan have a different expense structure. The expenses of the Direct Plan under the Scheme will be lower to the extent of the distribution expenses / commission charged in the Regular Plan. For Performance of Direct Plan, refer page no. 76.
^Past performance may or may not be sustained in the future. Since Inception Date = Date of First allotment in the Scheme / Plan. Load is not taken into consideration for computation of performance.
(An open ended debt scheme predominantly investing in debt instruments of banks, public sector undertakings, public financial institutions and municipal bonds)HDFC Banking and PSU Debt Fund
.....Contd from previous pageSIP PERFORMANCE ^ - Regular Plan - Growth Option
Since Inception SIP
5 year SIP
3 year SIP
1 year SIP
Total Amount Invested (` ‘000) 880.00 600.00 360.00 120.00 Mkt Value As on June 30, 2021 (` ‘000) 1,193.18 732.66 407.36 123.12 Returns (%) 8.16 7.93 8.21 4.89 Benchmark Returns (%) # 7.80 7.65 8.01 4.81 Additional Benchmark Returns (%) ## 7.53 7.19 7.82 4.64
Assuming ` 10,000 invested systematically on the first Business Day of every month over a period of time. CAGR returns are computed after accounting for the cash flow by using xIRR method (investment internal rate of return) for Regular Plan - Growth Option. The above investment simulation is for illustrative purposes only and should not be construed as a promise on minimum returns and safeguard of capital.

45 June 2021
CATEGORY OF SCHEME: GILT FUND
KEY FACTSINVESTMENT OBJECTIVE
To generate credit risk-free returns through investments in sovereign securities issued by the Central Government and/or State Government.
There is no assurance that the investment objective of the Scheme will be realized.
FUND MANAGER ¥
Anil Bamboli (since September 1, 2007)
Total Experience: Over 23 years
INCEPTION DATE (Date of Allotment)
July 25, 2001
NAV (AS ON JUNE 30, 2021) NAV PER UNIT (`)
Regular Plan - Growth Option 43.8221Regular Plan - IDCW Option 11.7460Direct Plan - Growth Option 45.3361Direct Plan - IDCW Option 12.2830
ASSETS UNDER MANAGEMENT (`) IN CRORE
As on June 30, 2021 1,596.01Average for Month of June 2021 1,732.39
qUANTITATIVE DATA
Average Maturity * 6.02 yearsMacaulay Duration * 4.46 yearsModified Duration * 4.32 yearsYield to Maturity * 5.71%
*Calculated on amount invested in debt securities (including accrued interest), deployment of funds in TRePS and Reverse Repo and net receivable / payable.
TOTAL ExPENSE RATIO (As on June 30, 2021)Including Additional expenses and Goods and Service Tax on Management Fees
Regular: 0.91% Direct: 0.46%
#BENCHMARK INDEx: CRISIL Dynamic Gilt Index
##ADDL. BENCHMARK INDEx: CRISIL 10 year Gilt Index
ExIT LOAD
Nil
PLANS & OPTIONS
Regular Plan, Direct Plan. Under Each Plan: Growth & Income Distribution cum Capital Withdrawal (IDCW) Option. The IDCW Option offers following Sub-Options: Payout of Income Distribution cum Capital Withdrawal (IDCW) Option; and Re-investment of Income Distribution cum Capital Withdrawal (IDCW) Option.
MINIMUM APPLICATION AMOUNT
Purchase : ` 5,000 and any amount thereafter. Additional Purchase : ` 1,000 and any amount thereafter.
¥ Dedicated Fund Manager for Overseas Investments: Mr. Sankalp Baid (since January 22, 2021) (Total Experience: Over 13 years).
Face Value per Unit: ` 10 unless otherwise specified, Data is as of June 30, 2021 unless otherwise specified.
PERFORMANCE ^ - Regular Plan - Growth Option
Date Period Scheme Returns
(%)
Benchmark Returns
(%)#
Additional Benchmark
Returns (%) ##
Value of ` 10,000 invested
Scheme (`) Benchmark (`)#
Additional Benchmark
(`)##
Jun 30, 20 Last 1 Year 3.10 3.71 4.08 10,310 10,371 10,408Jun 29, 18 Last 3 Years 8.03 9.80 9.61 12,613 13,244 13,174Jun 30, 16 Last 5 Years 6.99 7.99 7.25 14,020 14,688 14,192Jul 25, 01 Since Inception 7.69 8.32 N.A. 43,822 49,190 N.A.
Returns greater than 1 year period are compounded annualized (CAGR). N.A. Not Available. For performance of other schemes managed by Anil Bamboli, please refer page 68. Different plans viz. Regular Plan and Direct Plan have a different expense structure. The expenses of the Direct Plan under the Scheme will be lower to the extent of the distribution expenses / commission charged in the Regular Plan. For Performance of Direct Plan, refer page no. 76.
This product is suitable for investors who are seeking ~
l credit risk free returns over medium to long term
l to generate credit risk-free returns through investments in sovereign securities issued by the Central Government and / or State Government
VeryHigh
Low to
Moderate
Low
Moderate ModeratelyHigh High
RISKOMETERInvestors understand that their principal will be at
moderate risk
~ Investors should consult their financial advisers, if in doubt about whether the product is suitable for them.
^Past performance may or may not be sustained in the future. Since Inception Date = Date of First allotment in the Scheme / Plan. Load is not taken into consideration for computation of performance.
Portfolio Classification By Asset Class (%)
n T-bills, G-Sec, SDL 95.36
n Cash, Cash equivalents and Net Current Assets 4.64
Portfolio Classification By Rating Class (%)
n Sovereign 95.36n Cash, Cash equivalents and
Net Current Assets 4.64
(An open ended debt scheme investing in government securities across maturities)HDFC Gilt Fund
Issuer Rating % to NAV
DEBT & DEBT RELATED
GOVERNMENT SECURITIES (CENTRAL/STATE)
• 6.97 GOI 2026 Sovereign 21.87
• 7.17 GOI 2028 Sovereign 16.08
• 6.79 GOI 2027 Sovereign 14.55
• 6.45 GOI 2029 Sovereign 9.45
• 7.26 GOI 2029 Sovereign 7.91
• 6.79 GOI 2029 Sovereign 6.72
• 5.63 GOI 2026 Sovereign 2.18
• 8.60% Rajasthan SDL- Mat 061128 Sovereign 1.73
6.8 GOI 2060 Sovereign 1.51
8.24 GOI 2033 Sovereign 0.30
7.73 GOI 2034 Sovereign 0.20
7.37 GOI 2023 Sovereign 0.16
Issuer Rating % to NAV
7.95 GOI 2032 Sovereign 0.08
7.32 GOI 2024 Sovereign 0.07
8.97 GOI 2030 Sovereign 0.07
Sub Total 82.88
T-BILLS
• 182 days Tbill ISD 180221 Mat 190821 Sovereign 9.36
• 182 days Tbill ISD 110221 Mat 120821 Sovereign 3.12
Sub Total 12.48
Total 95.36
Cash, Cash equivalents and Net Current Assets 4.64
Grand Total 100.00
• Top Ten Holdings
Outstanding exposure in derivative instruments Interest Rate Swap (` in Crore) 60.00
PORTFOLIO
SIP PERFORMANCE ^ - Regular Plan - Growth Option
Since Inception SIP
15 year SIP 10 year SIP 5 Year SIP 3 Year SIP 1 Year SIP
Total Amount Invested (` ‘000) 2,400.00 1,800.00 1,200.00 600.00 360.00 120.00
Mkt Value As on June 30, 2021 (` ‘000) 5,234.46 3,297.29 1,791.18 706.00 398.52 121.53
Returns (%) 7.22 7.64 7.77 6.45 6.73 2.38
Benchmark Returns (%) # 7.86 8.19 8.40 7.81 8.12 3.16
Additional Benchmark Returns (%) ## N.A. 7.12 7.52 7.19 7.82 4.64
Assuming ` 10,000 invested systematically on the first Business Day of every month over a period of time. CAGR returns are computed after accounting for the cash flow by using xIRR method (investment internal rate of return) for Regular Plan - Growth Option. The above investment simulation is for illustrative purposes only and should not be construed as a promise on minimum returns and safeguard of capital.

June 2021 46
CATEGORY OF SCHEME: DYNAMIC BOND FUND
KEY FACTSINVESTMENT OBJECTIVETo generate income / capital appreciation by investing in a range of debt and money market instruments.There is no assurance that the investment objective of the Scheme will be realized.
FUND MANAGER ¥
Anil Bamboli (since February 16, 2004)
Total Experience: Over 23 years
INCEPTION DATE (Date of Allotment)April 28, 1997
NAV (AS ON JUNE 30, 2021) NAV PER UNIT (`)Regular Plan - Growth Option 72.0849Regular Plan - Quarterly IDCW Option 12.2346Regular Plan - Half-Yearly IDCW Option 11.6712Regular Plan - Yearly IDCW Option 13.2714Regular Plan - Normal IDCW Option 15.4426Direct Plan - Growth Option 76.6196Direct Plan - Quarterly IDCW Option 13.1582Direct Plan - Half-Yearly IDCW Option 13.1520Direct Plan - Yearly IDCW Option 14.2890Direct Plan - Normal IDCW Option 16.1327
ASSETS UNDER MANAGEMENT (`) IN CROREAs on June 30, 2021 428.83Average for Month of June 2021 416.47
qUANTITATIVE DATAAverage Maturity * 4.25 yearsMacaulay Duration * 3.03 yearsModified Duration * 2.87 yearsYield to Maturity * 5.60%*Calculated on amount invested in debt securities (including accrued interest), deployment of funds in TRePS and Reverse Repo and net receivable / payable.
TOTAL ExPENSE RATIO (As on June 30, 2021)Including Additional expenses and Goods and Service Tax on Management FeesRegular: 1.77% Direct: 1.16%
#BENCHMARK INDEx: CRISIL Dynamic Debt Index
##ADDL. BENCHMARK INDEx: CRISIL 10 year Gilt Index
ExIT LOADl In respect of each purchase / switch-in of Units, an Exit Load
of 0.50% is payable if Units are redeemed / switched-out within 6 months from the date of allotment.
l No Exit Load is payable if Units are redeemed / switched-out after 6 months from the date of allotment.
For further details, please refer to para ‘Exit Load’ on Pg 68.
PLANS & OPTIONSRegular Plan, Direct Plan. Under Each Plan: Growth, (Normal IDCW, Quarterly IDCW, Half Yearly IDCW & Yearly) Income Distribution cum Capital Withdrawal (IDCW) Option. All IDCW Options offers following Sub-Options: Payout of Income Distribution cum Capital Withdrawal (IDCW) Option; and Re-investment of Income Distribution cum Capital Withdrawal (IDCW) Option.
MINIMUM APPLICATION AMOUNTPurchase : ` 5,000 and any amount thereafter. Additional Purchase : ` 1,000 and any amount thereafter.
¥ Dedicated Fund Manager for Overseas Investments: Mr. Sankalp Baid (since January 22, 2021) (Total Experience: Over 13 years).
Face Value per Unit: ` 10 unless otherwise specified, Data is as of June 30, 2021 unless otherwise specified.
PERFORMANCE ^ - Regular Plan - Growth Option
Date Period Scheme Returns
(%)
Benchmark Returns
(%)#
Additional Benchmark
Returns (%) ##
Value of ` 10,000 invested
Scheme (`) Benchmark (`)#
Additional Benchmark
(`)##
Jun 30, 20 Last 1 Year 9.96 5.29 4.08 10,996 10,529 10,408Jun 29, 18 Last 3 Years 7.38 9.65 9.61 12,385 13,192 13,174Jun 30, 16 Last 5 Years 6.58 8.35 7.25 13,752 14,939 14,192Apr 28, 97 Since Inception 8.51 N.A. N.A. 72,085 N.A. N.A.
Returns greater than 1 year period are compounded annualized (CAGR). N.A. Not Available. For performance of other schemes managed by Anil Bamboli, please refer page 68. Different plans viz. Regular Plan and Direct Plan have a different expense structure. The expenses of the Direct Plan under the Scheme will be lower to the extent of the distribution expenses / commission charged in the Regular Plan. For Performance of Direct Plan, refer page no. 75.
This product is suitable for investors who are seeking ~
l income over medium to long term
l to generate income / capital appreciation by investing in a range of debt and money market instruments
VeryHigh
Low to
Moderate
Low
Moderate ModeratelyHigh High
RISKOMETERInvestors understand that their principal will be at
moderate risk~ Investors should consult their financial advisers, if in doubt about whether the product is suitable for them. ^Past performance may or may not be sustained in the future. Since Inception Date = Date of First allotment in the Scheme / Plan.
Load is not taken into consideration for computation of performance.
Portfolio Classification By Asset Class (%)
n G-Sec, SDL 40.17
n Credit exposure 28.06
n Cash, Cash equivalents and Net Current Assets 31.77
Portfolio Classification By Rating Class (%)
n Sovereign 40.17n AAA/AAA(SO)/A1+/A1+(SO)
& equivalent 13.85n AA/AA- 14.21n Cash, Cash equivalents and
Net Current Assets 31.77
(An open ended dynamic debt scheme investing across duration)HDFC Dynamic Debt Fund
Issuer Rating % to NAV
DEBT & DEBT RELATED
GOVERNMENT SECURITIES (CENTRAL/STATE)
• 7.17 GOI 2028 Sovereign 12.22
• 6.97 GOI 2026 Sovereign 12.15
• 6.79 GOI 2029 Sovereign 4.76
• 5.63 GOI 2026 Sovereign 4.65
• 6.79 GOI 2027 Sovereign 2.41
7.42% Maharashtra SDL - Mat 110522 Sovereign 2.40
8.68% Gujarat SDL - Mat 060223. Sovereign 1.24
1.44% GOI Inflation Indexed 2023 Sovereign 0.19
8.26% Maharashtra SDL - ISD 120815 Mat 120825 Sovereign 0.15
8.19% Rajasthan SDL (UDAY Scheme- Strip Ix ) - ISD 230616 Mat 230626 Sovereign @
Sub Total 40.17
CREDIT ExPOSURE (NON PERPETUAL)
• State Bank of India CRISIL - AAA 6.23
Issuer Rating % to NAV
• Mahanagar Telephone Nigam Ltd. (Corporate guarantee from Govt of India) CARe - AAA(Ce) 3.80
• Jamnagar Utilities & Power Pvt. Ltd. (erstwhile Reliance Utilities & Power Pvt. Ltd.) CRISIL - AAA 3.66
INOx Wind Infrastructure Services Ltd. CRISIL - AA(Ce) 2.34
NTPC Ltd. CRISIL - AAA 0.16
Sub Total 16.19
CREDIT ExPOSURE (PERPETUAL BONDS)
• Canara Bank (AT1, BASeL III, Perpetual) CARe - AA 8.30
• Punjab National Bank (AT1, BASeL III, Perpetual) CRISIL - AA- 3.57
Sub Total 11.87
Total 68.23
Cash, Cash equivalents and Net Current Assets 31.77
Grand Total 100.00
• Top Ten Holdings, @ less than 0.01%
Outstanding exposure in derivative instruments Interest Rate Swap (` in Crore) 40.00
PORTFOLIO
SIP PERFORMANCE ^ - Regular Plan - Growth Option
Since Inception SIP
15 year SIP 10 year SIP 5 Year SIP 3 Year SIP 1 Year SIP
Total Amount Invested (` ‘000) 2,910.00 1,800.00 1,200.00 600.00 360.00 120.00
Mkt Value As on June 30, 2021 (` ‘000) 8,212.13 3,309.65 1,766.67 714.95 412.57 128.46
Returns (%) 7.72 7.68 7.51 6.95 9.07 13.42
Benchmark Returns (%) # N.A. 8.72 8.73 8.27 8.83 4.62
Additional Benchmark Returns (%) ## N.A. 7.12 7.52 7.19 7.82 4.64
Assuming ` 10,000 invested systematically on the first Business Day of every month over a period of time. CAGR returns are computed after accounting for the cash flow by using xIRR method (investment internal rate of return) for Regular Plan - Growth Option. The above investment simulation is for illustrative purposes only and should not be construed as a promise on minimum returns and safeguard of capital.

47 June 2021
CATEGORY OF SCHEME: MEDIUM TO LONG DURATION FUND
KEY FACTS
INVESTMENT OBJECTIVETo generate income / capital appreciation through investments in debt and money market instruments.There is no assurance that the investment objective of the Scheme will be realized.
FUND MANAGER ¥
Shobhit Mehrotra (since September 11, 2007)
Total Experience: Over 25 years
INCEPTION DATE (Date of Allotment)September 11, 2000
NAV (AS ON JUNE 30, 2021) NAV PER UNIT (`)Regular Plan - Growth Option 46.9897Regular Plan - Quarterly IDCW Option 11.1976Regular Plan - Normal IDCW Option 14.8172Direct Plan - Growth Option 49.9709Direct Plan - Quarterly IDCW Option 12.0807Direct Plan - Normal IDCW Option 15.8027
ASSETS UNDER MANAGEMENT (`) IN CROREAs on June 30, 2021 638.36Average for Month of June 2021 651.40
qUANTITATIVE DATAAverage Maturity * 6.50 yearsMacaulay Duration * 4.96 yearsModified Duration * 4.73 yearsYield to Maturity * 6.10%*Calculated on amount invested in debt securities (including accrued interest), deployment of funds in TRePS and Reverse Repo and net receivable / payable.
TOTAL ExPENSE RATIO (As on June 30, 2021)Including Additional expenses and Goods and Service Tax on Management FeesRegular: 2.17% Direct: 1.27%
#BENCHMARK INDEx: NIFTY Medium to Long Duration Debt Index##ADDL. BENCHMARK INDEx: CRISIL 10 year Gilt Index
ExIT LOADl In respect of each purchase / switch-in of Units, an Exit Load
of 0.25% is payable if Units are redeemed / switched-out within 1 month from the date of allotment.
l No Exit Load is payable if Units are redeemed / switched-out after 1 month from the date of allotment.
For further details, please refer to para ‘Exit Load’ on Pg 68.
PLANS & OPTIONSRegular Plan, Direct Plan. Under Each Plan: Growth, (Quarterly & Normal) Income Distribution cum Capital Withdrawal (IDCW) Option. Both (Quarterly & Normal) IDCW Option offers following Sub-Options: Payout of Income Distribution cum Capital Withdrawal (IDCW) Option; and Re-investment of Income Distribution cum Capital Withdrawal (IDCW) Option.
MINIMUM APPLICATION AMOUNTPurchase : ` 5,000 and any amount thereafter.Additional Purchase : ` 1,000 and any amount thereafter.
¥ Dedicated Fund Manager for Overseas Investments: Mr. Sankalp Baid (since January 22, 2021) (Total Experience: Over 13 years).
PERFORMANCE ^ - Regular Plan - Growth Option
Date Period Scheme Returns
(%)
Benchmark Returns
(%)#
Additional Benchmark
Returns (%) ##
Value of ` 10,000 invested
Scheme (`) Benchmark (`)#
Additional Benchmark
(`)##
Jun 30, 20 Last 1 Year 3.92 5.72 4.08 10,392 10,572 10,408Jun 29, 18 Last 3 Years 7.43 10.13 9.61 12,403 13,363 13,174Jun 30, 16 Last 5 Years 6.20 8.30 7.25 13,513 14,905 14,192Sep 11, 00 Since Inception 7.72 N.A. N.A. 46,990 N.A. N.A.
Returns greater than 1 year period are compounded annualized (CAGR). N.A. Not Available. For performance of other schemes managed by Shobhit Mehrotra, please refer page 68. Different plans viz. Regular Plan and Direct Plan have a different expense structure. The expenses of the Direct Plan under the Scheme will be lower to the extent of the distribution expenses / commission charged in the Regular Plan. For Performance of Direct Plan, refer page no. 73.
Face Value per Unit: ` 10 unless otherwise specified, Data is as of June 30, 2021 unless otherwise specified.
This product is suitable for investors who are seeking ~
l income over medium to long term
l to generate income / capital appreciation through investments in debt and money market instruments
VeryHigh
Low to
Moderate
Low
Moderate ModeratelyHigh High
RISKOMETERInvestors understand that their principal will be at
moderate risk~ Investors should consult their financial advisers, if in doubt about whether the product is suitable for them.
^Past performance may or may not be sustained in the future. Since Inception Date = Date of First allotment in the Scheme / Plan. Load is not taken into consideration for computation of performance.
Portfolio Classification By Asset Class (%)
n G-Sec, SDL 39.87
n Credit exposure 50.51
n Cash, Cash equivalents and Net Current Assets 9.62
Portfolio Classification By Rating Class (%)
n Sovereign 39.87n AAA/AAA(SO)/A1+/A1+(SO)
& equivalent 50.51n Cash, Cash equivalents and
Net Current Assets 9.62
[An open ended medium term debt scheme investing in instruments such that the Macaulay Duration of the Portfolio is between 4 years and 7 years (Refer page 2 for definition of Macaulay Duration)]HDFC Income Fund
Issuer Rating % to NAV
DEBT & DEBT RELATED
GOVERNMENT SECURITIES (CENTRAL/STATE)
• 7.26 GOI 2029 Sovereign 4.12
• 6.97 GOI 2026 Sovereign 4.08
• 7.02% Gujarat SDL - Mat 280826 Sovereign 4.07
6.68 GOI 2031 Sovereign 3.97
5.63 GOI 2026 Sovereign 3.90
5.77 GOI 2030 Sovereign 3.79
6.45 GOI 2029 Sovereign 3.15
5.85 GOI 2030 Sovereign 3.09
6.72% Gujarat SDL - ISD 090621 Mat 090630 Sovereign 2.54
6.79 GOI 2029 Sovereign 1.60
6.19 GOI 2034 Sovereign 1.53
6.67 GOI 2050 Sovereign 1.48
1.44% GOI Inflation Indexed 2023 Sovereign 1.05
7.57 GOI 2033 Sovereign 0.84
8.2 GOI 2025 Sovereign 0.54
7.95 GOI 2032 Sovereign 0.12
9.15 GOI 2024 Sovereign @
Sub Total 39.87
Issuer Rating % to NAV
CREDIT ExPOSURE (NON PERPETUAL)
• Power Finance Corporation Ltd. CRISIL - AAA 9.09
• National Bank for Agriculture and Rural Development ICRA - AAA 6.31
• REC Ltd. CRISIL - AAA 5.92
• Housing Development Finance Corporation Ltd.£ CRISIL - AAA 5.40
• Sikka Port and Terminal Ltd. (erstwhile Reliance Ports and Terminals Ltd.) CRISIL - AAA 4.73
• NTPC Ltd. CRISIL - AAA 4.29
• LIC Housing Finance Ltd. CRISIL - AAA 4.03
Housing and Urban Development Corporation Ltd. CARe - AAA 3.87
India Grid Trust CRISIL - AAA 3.68
IndInfravit Trust CRISIL - AAA 3.19
Sub Total 50.51
Total 90.38
Cash, Cash equivalents and Net Current Assets 9.62
Grand Total 100.00
• Top Ten Holdings, @ less than 0.01%, £ Co-sponsor
PORTFOLIO
SIP PERFORMANCE ^ - Regular Plan - Growth Option
Since Inception SIP
15 year SIP 10 year SIP 5 Year SIP 3 Year SIP 1 Year SIP
Total Amount Invested (` ‘000) 2,500.00 1,800.00 1,200.00 600.00 360.00 120.00
Mkt Value As on June 30, 2021 (` ‘000) 5,568.38 3,182.24 1,710.75 696.38 397.03 121.83
Returns (%) 7.10 7.21 6.90 5.90 6.48 2.85
Benchmark Returns (%) # N.A. 8.37 8.58 8.45 9.31 5.05
Additional Benchmark Returns (%) ## N.A. 7.12 7.52 7.19 7.82 4.64
Assuming ` 10,000 invested systematically on the first Business Day of every month over a period of time. CAGR returns are computed after accounting for the cash flow by using xIRR method (investment internal rate of return) for Regular Plan - Growth Option. The above investment simulation is for illustrative purposes only and should not be construed as a promise on minimum returns and safeguard of capital.

June 2021 48
CATEGORY OF SCHEME: MEDIUM DURATION FUND
KEY FACTSINVESTMENT OBJECTIVE
To generate income / capital appreciation through investments in Debt and Money Market Instruments.
There is no assurance that the investment objective of the Scheme will be realized.
FUND MANAGER ¥
Shobhit Mehrotra (since September 1, 2007)
Total Experience: Over 25 years
INCEPTION DATE (Date of Allotment)
February 6, 2002
NAV (AS ON JUNE 30, 2021) NAV PER UNIT (`)
Regular Plan - Growth Option 44.1835Regular Plan - IDCW Option 16.7638Regular Plan - Fortnightly IDCW Option 10.0775Direct Plan - Growth Option 46.6389Direct Plan - IDCW Option 17.4585Direct Plan - Fortnightly IDCW Option 10.0819
ASSETS UNDER MANAGEMENT (`) IN CRORE
As on June 30, 2021 3,488.37Average for Month of June 2021 3,413.01
qUANTITATIVE DATA
Average Maturity * 3.96 yearsMacaulay Duration * 3.14 yearsModified Duration * 2.97 yearsYield to Maturity * 6.52%
*Calculated on amount invested in debt securities (including accrued interest), deployment of funds in TRePS and Reverse Repo and net receivable / payable.
TOTAL ExPENSE RATIO (As on June 30, 2021)Including Additional expenses and Goods and Service Tax on Management Fees
Regular: 1.30% Direct: 0.49%
#BENCHMARK INDEx: NIFTY Medium Duration Debt Index
##ADDL. BENCHMARK INDEx: CRISIL 10 year Gilt Index
ExIT LOAD
Nil
PLANS & OPTIONS
Regular Plan, Direct Plan. Under both the Plans: Growth, (Fortnightly & Normal) Income Distribution cum Capital Withdrawal (IDCW) Option. Both (Fortnightly & Normal) IDCW Options offers following Sub-Options: Payout of Income Distribution cum Capital Withdrawal (IDCW) Option; and Re-investment of Income Distribution cum Capital Withdrawal (IDCW) Option.
MINIMUM APPLICATION AMOUNT
Purchase : ` 5,000 and any amount thereafter. Additional Purchase : ` 1,000 and any amount thereafter.
¥ Dedicated Fund Manager for Overseas Investments: Mr. Sankalp Baid (since January 22, 2021) (Total Experience: Over 13 years).
Face Value per Unit: ` 10 unless otherwise specified, Data is as of June 30, 2021 unless otherwise specified.
This product is suitable for investors who are seeking ~
l income over medium terml to generate income / capital appreciation through
investments in Debt and Money Market Instruments
VeryHigh
Low to
Moderate
Low
Moderate ModeratelyHigh High
RISKOMETERInvestors understand that their principal will be at
moderately high risk
~ Investors should consult their financial advisers, if in doubt about whether the product is suitable for them.
[An open ended medium term debt scheme investing in instruments such that the Macaulay Duration of the portfolio is between 3 years and 4 years (Refer page 2 for definition of Macaulay Duration)]HDFC Medium Term Debt Fund
Issuer Rating % to NAV
DEBT & DEBT RELATED
GOVERNMENT SECURITIES (CENTRAL/STATE)
• 7.59 GOI 2026 Sovereign 3.98
• 7.27 GOI 2026 Sovereign 2.57
• 6.18 GOI 2024 Sovereign 2.51
7.26 GOI 2029 Sovereign 1.66
6.97 GOI 2026 Sovereign 1.49
6.88% Gujarat SDL ISD 300621 Mat 300631 Sovereign 1.29
Floating Rate GOI 2033 Sovereign 1.29
7.98% Gujarat SDL - Mat 110526 Sovereign 0.77
5.79 GOI 2030 Sovereign 0.69
7.96% Maharashtra SDL Mat 290626 Sovereign 0.62
7.89% Gujarat SDL - Mat 150525 Sovereign 0.61
7.62% Gujarat SDL - Mat 011127 Sovereign 0.60
6.79 GOI 2027 Sovereign 0.59
5.15 GOI 2025 Sovereign 0.46
8.05% Gujarat SDL - Mat 150626 Sovereign 0.46
7.17 GOI 2028 Sovereign 0.30
6.45 GOI 2029 Sovereign 0.29
5.77 GOI 2030 Sovereign 0.28
5.85 GOI 2030 Sovereign 0.28
6.67 GOI 2050 Sovereign 0.27
Sub Total 21.01
CREDIT ExPOSURE (NON PERPETUAL)
• Power Finance Corporation Ltd. CRISIL - AAA 6.84
• Sikka Port and Terminal Ltd. (erstwhile Reliance Ports and Terminals Ltd.) CRISIL - AAA 4.41
• Embassy Office Parks REIT CRISIL - AAA 4.34
• REC Ltd. CRISIL - AAA 3.93
• Housing Development Finance Corporation Ltd.£ CRISIL - AAA 3.61
• Green Infra Wind Energy Ltd. CRISIL - AA 3.50
• National Bank for Agriculture and Rural Development ICRA - AAA 3.28
NTPC Ltd. CRISIL - AAA 2.16
Shriram City Union Finance Ltd. CRISIL - AA 2.03
INOx Wind Ltd. CRISIL - AA(Ce) 1.84
Vedanta Ltd. CRISIL - AA- 1.79
Muthoot Finance Ltd. CRISIL - AA+ 1.76
Tata Projects Ltd. IND - AA 1.62
TVS Credit Services Ltd. CRISIL - AA- 1.59
Reliance Industries Ltd. CRISIL - AAA 1.54
INOx Wind Infrastructure Services Ltd. CRISIL - AA(Ce) 1.44
Bharti Hexacom Ltd. CRISIL - AA 1.42
Pipeline Infrastructure Pvt. Ltd. CRISIL - AAA 1.39
India Grid Trust ICRA - AAA / IND - AAA 1.17
TATA Housing Development Company Ltd. CARe - AA 1.15
Tata Motors Finance Solutions Ltd. CARe - AA- 1.15
Indian Railways Finance Corporation Ltd. CRISIL - AAA 0.78
JM Financial Asset Reconstruction Company Ltd. ICRA - AA- 0.76
Issuer Rating % to NAV
LIC Housing Finance Ltd. CRISIL - AAA 0.75
IndInfravit Trust CRISIL - AAA 0.73
National Housing Bank CRISIL - AAA 0.72
Nuvoco Vistas Corporation Ltd. (100% subsidiary of Nirma Ltd. & erstwhile Lafarge India Ltd.) CRISIL - AA 0.72
Housing and Urban Development Corporation Ltd. CARe - AAA 0.71
Mangalore Refinery and Petrochemicals Ltd. CARe - AAA 0.71
Motilal Oswal Finvest Ltd. CRISIL - AA- 0.71
The Tata Power Company Ltd. CRISIL - AA 0.46
GeRA Development Pvt. Ltd. CARe - AA- 0.45
Indian Oil Corporation Ltd. CRISIL - AAA 0.44
Coastal Gujarat Power Ltd. (Corporate Guarantee of Tata Power) CARe - AA(Ce) 0.40
Copeland Jan 2020 (PTC of pools from Muthoot Capital Services Ltd.) CRISIL - AA(SO) 0.37
Tata Motors Ltd. CRISIL - AA- 0.31
Flometallic India Pvt Ltd. CRISIL - AA+ 0.29
Aarish Solar Power Pvt. Ltd. (Greenko) CARe - AA(Ce) 0.12
Aashman energy Pvt. Ltd. (Greenko) CARe - AA(Ce) 0.12
Divyesh Power Pvt. Ltd. (Greenko) CARe - AA(Ce) 0.12
elena Renewable energy Pvt. Ltd. (Greenko) CARe - AA(Ce) 0.12
Pratyash Renewable Pvt. Ltd. (Greenko) CARe - AA(Ce) 0.12
SeI Baskara Power Pvt. Ltd. (Greenko) CARe - AA(Ce) 0.12
SeI enerstar Renewable energy Pvt. Ltd. (Greenko) CARe - AA(Ce) 0.12
SeI Mihir energy Pvt. Ltd. (Greenko) CARe - AA(Ce) 0.12
Shreyas Renewable energy Pvt. Ltd. (Greenko) CARe - AA(Ce) 0.12
Zuvan energy Pvt. Ltd. (Greenko) CARe - AA(Ce) 0.12
L&T Finance Ltd. CRISIL - AAA 0.03
Sub Total 62.50
CREDIT ExPOSURE (PERPETUAL BONDS)
TMF Holdings Ltd. (Subsidiary of Tata Motors Ltd.) (Perpetual) CARe - AA- 2.41
TMF Holdings Ltd. (Subsidiary of Tata Motors Ltd.)(Perpetual) CRISIL - AA- 2.20
Union Bank of India (AT1, BASeL III, Perpetual) BRICKWORKS - AA 2.13
Indian Bank (AT1, BASeL III, Perpetual) CRISIL - AA 1.14
TATA International Ltd. (Perpetual) CARe - A 0.72
Sub Total 8.60
Total 92.11
MONEY MARKET INSTRUMENTS
CP
Fedbank Financial Services Ltd. CRISIL - A1+ 0.98
Sub Total 0.98
Total 0.98
Cash, Cash equivalents and Net Current Assets 6.91
Grand Total 100.00
• Top Ten Holdings, £ Co-sponsor
PORTFOLIO

49 June 2021
.....Contd from previous page
PERFORMANCE ^ - Regular Plan - Growth Option
Date Period Scheme Returns
(%)
Benchmark Returns
(%)#
Additional Benchmark
Returns (%) ##
Value of ` 10,000 invested
Scheme (`) Benchmark (`)#
Additional Benchmark
(`)##
Jun 30, 20 Last 1 Year 8.04 6.52 4.08 10,804 10,652 10,408Jun 29, 18 Last 3 Years 8.35 9.80 9.61 12,727 13,244 13,174Jun 30, 16 Last 5 Years 7.82 8.37 7.25 14,574 14,952 14,192Feb 06, 02 Since Inception 7.96 8.01 6.82 44,184 44,633 35,974
Returns greater than 1 year period are compounded annualized (CAGR). N.A. Not Available. For performance of other schemes managed by Shobhit Mehrotra, please refer page 68. Different plans viz. Regular Plan and Direct Plan have a different expense structure. The expenses of the Direct Plan under the Scheme will be lower to the extent of the distribution expenses / commission charged in the Regular Plan. For Performance of Direct Plan, refer page no. 73.
SIP PERFORMANCE ^ - Regular Plan - Growth Option
Since Inception SIP
15 year SIP 10 year SIP 5 Year SIP 3 Year SIP 1 Year SIP
Total Amount Invested (` ‘000) 2,330.00 1,800.00 1,200.00 600.00 360.00 120.00
Mkt Value As on June 30, 2021 (` ‘000) 5,513.98 3,478.39 1,821.72 728.66 407.49 124.29
Returns (%) 8.17 8.28 8.10 7.71 8.23 6.74
Benchmark Returns (%) # 8.20 8.56 8.70 8.60 9.30 5.58
Additional Benchmark Returns (%) ## 6.77 7.12 7.52 7.19 7.82 4.64
Assuming ` 10,000 invested systematically on the first Business Day of every month over a period of time. CAGR returns are computed after accounting for the cash flow by using xIRR method (investment internal rate of return) for Regular Plan - Growth Option. The above investment simulation is for illustrative purposes only and should not be construed as a promise on minimum returns and safeguard of capital.
Portfolio Classification By Asset Class (%)
n G-Sec, SDL 21.01
n CP 0.98
n Credit exposure 71.10
n Cash, Cash equivalents and Net Current Assets 6.91
Portfolio Classification By Rating Class (%)
n Sovereign 21.01n AAA/AAA(SO)/A1+/A1+(SO) &
equivalent 38.52n AA+ 2.05n AA/AA- 30.79n A+ & Below 0.72n Cash, Cash equivalents and Net
Current Assets 6.91
^Past performance may or may not be sustained in the future. Since Inception Date = Date of First allotment in the Scheme / Plan. Load is not taken into consideration for computation of performance.
[An open ended medium term debt scheme investing in instruments such that the Macaulay Duration of the portfolio is between 3 years and 4 years (Refer page 2 for definition of Macaulay Duration)]HDFC Medium Term Debt Fund

June 2021 50
CATEGORY OF SCHEME: SHORT DURATION FUND
Face Value per Unit: ` 10 unless otherwise specified, CD - Certificate of Deposit; CP - Commercial Papers. Data is as of June 30, 2021 unless otherwise specified.
KEY FACTSINVESTMENT OBJECTIVE
To generate income / capital appreciation through investments in Debt and Money Market Instruments.
There is no assurance that the investment objective of the Scheme will be realized.
FUND MANAGER ¥
Anil Bamboli (since June 25, 2010)
Total Experience: Over 23 years
INCEPTION DATE (Date of Allotment)
June 25, 2010
NAV (AS ON JUNE 30, 2021) NAV PER UNIT (`)
Regular Plan - Growth Option 24.9342Regular Plan - Fortnightly IDCW Option 10.1887Regular Plan - Normal IDCW Option 16.7648Direct Plan - Growth Option 25.3512Direct Plan - Fortnightly IDCW Option 10.2978Direct Plan - Normal IDCW Option 16.9468
ASSETS UNDER MANAGEMENT (`) IN CRORE
As on June 30, 2021 18,016.68Average for Month of June 2021 18,168.41
qUANTITATIVE DATA
Average Maturity * 3.13 yearsMacaulay Duration * 2.38 yearsModified Duration * 2.26 yearsYield to Maturity * 5.31%
*Calculated on amount invested in debt securities (including accrued interest), deployment of funds in TRePS and Reverse Repo and net receivable / payable.
TOTAL ExPENSE RATIO (As on June 30, 2021)Including Additional expenses and Goods and Service Tax on Management Fees
Regular: 0.75% Direct: 0.24%
#BENCHMARK INDEx: CRISIL Short Term Bond Fund Index
##ADDL. BENCHMARK INDEx: CRISIL 10 year Gilt Index
ExIT LOAD
Nil
PLANS & OPTIONS
Regular Plan, Direct Plan. Under Each Plan: Growth, (Fortnightly & Normal) Income Distribution cum Capital Withdrawal (IDCW) Option. Both (Fortnightly & Normal) IDCW Options offers following Sub-Options: Payout of Income Distribution cum Capital Withdrawal (IDCW) Option; and Re-investment of Income Distribution cum Capital Withdrawal (IDCW) Option.
MINIMUM APPLICATION AMOUNT
Purchase : ` 5,000 and any amount thereafter. Additional Purchase : ` 1,000 and any amount thereafter.
¥ Dedicated Fund Manager for Overseas Investments: Mr. Sankalp Baid (since January 22, 2021) (Total Experience: Over 13 years).
This product is suitable for investors who are seeking ~
l income over short term.
l to generate income / capital appreciation through investments in Debt and Money Market Instruments
VeryHigh
Low to
Moderate
Low
Moderate ModeratelyHigh High
RISKOMETERInvestors understand that their principal will be at
moderate risk~ Investors should consult their financial advisers, if in doubt about whether the product is suitable for them.
[An open ended short term debt scheme investing in instruments such that the Macaulay Duration of the portfolio is between 1 year and 3 years (Refer page 2 for definition of Macaulay Duration)]HDFC Short Term Debt Fund
Issuer Rating % to NAVDEBT & DEBT RELATEDGOVERNMENT SECURITIES (CENTRAL/STATE)• 6.79 GOI 2027 Sovereign 2.29• 5.77 GOI 2030 Sovereign 2.076.97 GOI 2026 Sovereign 1.945.63 GOI 2026 Sovereign 1.385.79 GOI 2030 Sovereign 1.105.22 GOI 2025 Sovereign 0.828.48% Karnataka SDL - Mat 171022 Sovereign 0.767.59 GOI 2026 Sovereign 0.717.59% Gujarat SDL - Mat 150227 Sovereign 0.586.45 GOI 2029 Sovereign 0.567.63% Gujarat SDL - Mat 120427 Sovereign 0.56Floating Rate GOI 2033 Sovereign 0.557.89% Gujarat SDL - Mat 150525 Sovereign 0.457.17 GOI 2028 Sovereign 0.446.18 GOI 2024 Sovereign 0.297.27 GOI 2026 Sovereign 0.298.38% Karnataka SDL - Mat 311022 Sovereign 0.297.32 GOI 2024 Sovereign 0.267.26 GOI 2029 Sovereign 0.208.39% Rajasthan SDL - Mat 150323 Sovereign 0.155.85 GOI 2030 Sovereign 0.147.15% Maharashtra SDL - Mat 131026 Sovereign 0.14Sub Total 15.97T-BILLS182 days Tbill ISD 180221 Mat 190821 Sovereign 1.38Sub Total 1.38CREDIT ExPOSURE (NON PERPETUAL)• Housing Development
Finance Corporation Ltd.£ CRISIL - AAA 6.24• REC Ltd. CRISIL - AAA 5.76• State Bank of India CRISIL - AAA 3.08• LIC Housing Finance Ltd. CARe - AAA / CRISIL - AAA 2.86• Power Finance Corporation Ltd. CARe - AAA / CRISIL -
AAA / ICRA - AAA 2.68• National Bank for Agriculture
and Rural DevelopmentCRISIL - AAA / ICRA - AAA 2.10
• Mahanagar Telephone Nigam Ltd. (Corporate
guarantee from Govt of India)CARe - AAA(Ce) / CRISIL - AAA(Ce) 1.99
Cholamandalam Investment & Finance ICRA - AA+ 1.96IndInfravit Trust CRISIL - AAA 1.92Vedanta Ltd. CRISIL - AA- 1.85Indian Railways Finance Corporation Ltd. CRISIL - AAA 1.69Larsen and Toubro Ltd. CRISIL - AAA 1.67Housing and Urban Development Corporation Ltd. CARe - AAA 1.57Reliance Industries Ltd. CRISIL - AAA 1.53Coastal Gujarat Power Ltd. (Corporate Guarantee of Tata Power) CARe - AA(Ce) 1.45Motherson Sumi Systems Ltd. IND - AAA 1.40Fullerton India Credit Company Ltd. CRISIL - AAA 1.14Sikka Port and Terminal Ltd. (erstwhile Reliance Ports and Terminals Ltd.)
CARe - AAA / CRISIL - AAA 1.13
HDB Financial Services Ltd. CRISIL - AAA 1.13L&T Finance Ltd. CRISIL - AAA 1.13First Business Receivables Trust (PTC backed by receivables from Reliance Corporate IT Park Ltd.) CRISIL - AAA(SO) 1.08Jamnagar Utilities & Power Pvt. Ltd. (erstwhile Reliance Utilities & Power Pvt. Ltd.) CRISIL - AAA 1.07
Issuer Rating % to NAVTata Steel Ltd. CARe - AA 1.04Bharti Hexacom Ltd. CRISIL - AA 0.82Pipeline Infrastructure Pvt. Ltd. CRISIL - AAA 0.75Britannia Industries Ltd. CRISIL - AAA 0.58TATA Capital Housing Finance Ltd. CRISIL - AAA 0.58ONGC Petro additions Ltd. (OPAL) (Put on ONGC Ltd.) CARe - AAA(Ce) 0.57Tata Motors Finance Ltd. CRISIL - AA- 0.56Hindustan Petroleum Corporation Ltd. CRISIL - AAA 0.55Power Grid Corporation of India Ltd. CRISIL - AAA 0.52John Deere Financial India Pvt. Ltd. CRISIL - AAA 0.50National Highways Authority of India CRISIL - AAA 0.45Hindalco Industries Ltd. CRISIL - AA 0.38Flometallic India Pvt Ltd. CRISIL - AA+ 0.36TMF Holdings Ltd. (Subsidiary of Tata Motors Ltd.) ICRA - AA- 0.34Grasim Industries Ltd. CRISIL - AAA 0.28Indian Oil Corporation Ltd. CRISIL - AAA 0.28Talwandi Sabo Power Ltd. (Corporate Guarantee of Vedanta Ltd.) CRISIL - AA-(Ce) 0.28Tata Motors Finance Solutions Ltd. CARe - AA- 0.28NHPC Ltd. CARe - AAA 0.27The Tata Power Company Ltd. CRISIL - AA 0.24Mobil Trust Series 10 (PTC of pools from Shriram City Union Finance Ltd.) CRISIL - AAA(SO) 0.22Manappuram Finance Ltd. CRISIL - AA 0.17Inox Air Products Pvt. Ltd. CRISIL - AA+ 0.13Sansar Trust Nov 2018 (PTC of pools from Shriram Transport Finance Company Ltd.) ICRA - AAA(SO) 0.08Sub Total 56.66CREDIT ExPOSURE (PERPETUAL BONDS)• State Bank of India
(AT1, BASeL III, Perpetual) CRISIL - AA+ 2.65ICICI Bank Ltd. (AT1, BASeL III, Perpetual) CARE - AA+ 0.60Union Bank of India (AT1, BASeL III, Perpetual) IND - AA 0.37Axis Bank Ltd. (AT1, BASeL III, Perpetual) CRISIL - AA+ 0.25Bank of Baroda (AT1, BASeL III, Perpetual) CARe - AA 0.25Punjab National Bank (AT1, BASeL III, Perpetual) CRISIL - AA- 0.25Canara Bank (AT1, BASeL III, Perpetual) CARe - AA 0.06Punjab National Bank (AT1, BASeL III, Perpetual) IND - AA 0.06Sub Total 4.49Total 78.50MONEY MARKET INSTRUMENTSCPTata Teleservices (Maharashtra) Ltd. CRISIL - A1+ 0.32Tata Teleservices Ltd. CRISIL - A1+ 0.29Sub Total 0.61CD Axis Bank Ltd. CRISIL - A1+ 1.11IDFC First Bank Ltd. CRISIL - A1+ 0.54Sub Total 1.65Total 2.26Cash, Cash equivalents and Net Current Assets 19.24Grand Total 100.00• Top Ten Holdings, £ Co-sponsor
Outstanding exposure in derivative instruments Interest Rate Swap (` in Crore) 1,650.00
PORTFOLIO

51 June 2021
PERFORMANCE ^ - Regular Plan - Growth Option
Date Period Scheme Returns
(%)
Benchmark Returns
(%)#
Additional Benchmark
Returns (%) ##
Value of ` 10,000 invested
Scheme (`) Benchmark (`)#
Additional Benchmark
(`)##
Jun 30, 20 Last 1 Year 6.25 5.67 4.08 10,625 10,567 10,408Jun 29, 18 Last 3 Years 8.82 8.71 9.61 12,891 12,852 13,174Jun 30, 16 Last 5 Years 8.11 7.92 7.25 14,772 14,642 14,192Jun 25, 10 Since Inception 8.64 8.22 6.95 24,934 23,897 20,966
Returns greater than 1 year period are compounded annualized (CAGR). For performance of other schemes managed by Anil Bamboli, please refer page 68. Different plans viz. Regular Plan and Direct Plan have a different expense structure. The expenses of the Direct Plan under the Scheme will be lower to the extent of the distribution expenses / commission charged in the Regular Plan. For Performance of Direct Plan, refer page no. 76.^Past performance may or may not be sustained in the future. Since Inception Date = Date of First allotment in the Scheme / Plan. Load is not taken into consideration for computation of performance.
[An open ended short term debt scheme investing in instruments such that the Macaulay Duration of the portfolio is between 1 year and 3 years (Refer page 2 for definition of Macaulay Duration)]HDFC Short Term Debt Fund
Portfolio Classification By Asset Class (%)
n T-bills, G-Sec, SDL 17.35
n CP 0.61
n CD 1.65
n Credit exposure 61.15
n Cash, Cash equivalents and Net Current Assets 19.24
Portfolio Classification By Rating Class (%)
n Sovereign 17.35n AAA/AAA(SO)/A1+/A1+(SO)
& equivalent 49.06n AA+ 5.95n AA/AA- 8.40n Cash, Cash equivalents and
Net Current Assets 19.24
.....Contd from previous page
SIP PERFORMANCE ^ - Regular Plan - Growth Option
Since Inception SIP
10 year SIP
5 year SIP
3 year SIP
1 year SIP
Total Amount Invested (` ‘000) 1,330.00 1,200.00 600.00 360.00 120.00 Mkt Value As on June 30, 2021 (` ‘000) 2,168.15 1,853.64 736.79 408.00 123.21 Returns (%) 8.49 8.43 8.16 8.32 5.03 Benchmark Returns (%) # 8.29 8.27 7.90 8.05 4.98 Additional Benchmark Returns (%) ## 7.43 7.52 7.19 7.82 4.64
Assuming ` 10,000 invested systematically on the first Business Day of every month over a period of time. CAGR returns are computed after accounting for the cash flow by using xIRR method (investment internal rate of return) for Regular Plan - Growth Option. The above investment simulation is for illustrative purposes only and should not be construed as a promise on minimum returns and safeguard of capital.

June 2021 52
CATEGORY OF SCHEME: LOW DURATION FUND
KEY FACTSINVESTMENT OBJECTIVETo generate income / capital appreciation through investment in debt securities and money market instruments.There is no assurance that the investment objective of the Scheme will be realized.
FUND MANAGER ¥
Anupam Joshi (since October 27, 2015)
Total Experience: Over 12 years
INCEPTION DATE (Date of Allotment)November 18, 1999
NAV (AS ON JUNE 30, 2021) NAV PER UNIT (`)Regular Plan - Growth Option 45.5455Regular Plan - Daily IDCW Reinvestment Option 10.1401Regular Plan - Weekly IDCW Option 10.0586Regular Plan - Monthly IDCW Option 10.1386Direct Plan - Growth Option 48.2128Direct Plan - Daily IDCW Reinvestment Option 10.0630Direct Plan - Weekly IDCW Option 10.0590Direct Plan - Monthly IDCW Option 10.1415
ASSETS UNDER MANAGEMENT (`) IN CROREAs on June 30, 2021 26,073.33Average for Month of June 2021 24,904.02
qUANTITATIVE DATAAverage Maturity * 2.29 yearsMacaulay Duration * 1.04 yearModified Duration * 0.94 yearYield to Maturity * 4.62%
*Calculated on amount invested in debt securities (including accrued interest), deployment of funds in TRePS and Reverse Repo and net receivable / payable.
TOTAL ExPENSE RATIO (As on June 30, 2021)Including Additional expenses and Goods and Service Tax on Management FeesRegular: 1.04% Direct: 0.44%
#BENCHMARK INDEx: NIFTY Low Duration Debt Index
##ADDL. BENCHMARK INDEx: CRISIL 1 year T-Bill Index
ExIT LOADNil
PLANS & OPTIONSRegular Plan, Direct Plan. Each Plan offers Growth & Income Distribution cum Capital Withdrawal (IDCW) Option. The (Daily) IDCW Option offers only Re-investment of Income Distribution cum Capital Withdrawal (IDCW) Option. The (Weekly and Monthly) IDCW Option offers following Sub-Options: Payout of Income Distribution cum Capital Withdrawal (IDCW) Option; and Re-investment of Income Distribution cum Capital Withdrawal (IDCW) Option.
MINIMUM APPLICATION AMOUNTFor all Options (except Daily IDCW Option) Growth, We e k l y a n d M o nt h l y I D C W O pt i o n : P u rc h a se : ` 5,000 and any amount thereafter. Additional Purchase : ` 1,000 and any amount thereafter. Daily IDCW Option : Purchase : ` 10,000 and any amount thereafter. Additional Purchase : ` 5,000 and any amount thereafter.
¥ Dedicated Fund Manager for Overseas Investments: Mr. Sankalp Baid (since January 22, 2021) (Total Experience: Over 13 years).
Face Value per Unit: ` 10 unless otherwise specified, CD - Certificate of Deposit; CP - Commercial Papers. Data is as of June 30, 2021 unless otherwise specified.
This product is suitable for investors who are seeking ~
l income over short term.
l to generate income / capital appreciation through investmentin debt securities and money market instruments
VeryHigh
Low to
Moderate
Low
Moderate ModeratelyHigh High
RISKOMETERInvestors understand that their principal will be at
moderate risk
~ Investors should consult their financial advisers, if in doubt about whether the product is suitable for them.
[An open ended low duration debt scheme investing in instruments such that the Macaulay Duration of the portfolio is between 6 months and 12 months (Refer page 2 for definition of Macaulay Duration)]HDFC Low Duration Fund
Issuer Rating % to NAVDEBT & DEBT RELATEDGOVERNMENT SECURITIES (CENTRAL/STATE)• Floating Rate GOI 2033 Sovereign 6.618.35 GOI 2022 Sovereign 1.998.2 GOI 2022 Sovereign 1.428.24 GOI 2027 Sovereign 0.638.95% Maharashtra SDL - Mat 070322 Sovereign 0.636.97 GOI 2026 Sovereign 0.606.79 GOI 2027 Sovereign 0.495.15 GOI 2025 Sovereign 0.287.59 GOI 2026 Sovereign 0.205.22 GOI 2025 Sovereign 0.195.63 GOI 2026 Sovereign 0.197.17 GOI 2028 Sovereign 0.10Sub Total 13.33T-BILLS• 182 days Tbill ISD 030621
Mat 021221 Sovereign 3.78182 days Tbill ISD 240621 Mat 231221 Sovereign 0.94364 Days Tbill - Mat 010721 Sovereign 0.1991 days Tbill Mat 050821 Sovereign 0.02Sub Total 4.93CREDIT ExPOSURE (NON PERPETUAL)• Power Finance Corporation Ltd. CARe - AAA / CRISIL -
AAA / ICRA - AAA 6.27• REC Ltd. CARe - AAA / CRISIL - AAA 4.36• National Bank for Agriculture
and Rural Development CRISIL - AAA / ICRA - AAA 4.35• Housing Development
Finance Corporation Ltd.£ CRISIL - AAA 3.34• LIC Housing Finance Ltd. CARe - AAA / CRISIL - AAA 3.16• L&T Finance Ltd. CARe - AAA / CRISIL - AAA 3.12Vedanta Ltd. CRISIL - AA- 1.55Liquid Gold Series 6 ICRA - AAA(SO) 1.54Muthoot Finance Ltd. CRISIL - AA+ 1.46Food Corporation of India (Corporate guarantee from Govt of India) CARe - AAA(Ce) 1.20Reliance Industries Ltd. CRISIL - AAA 1.14Reliable Devices Trust (PTC backed by receivables from Reliance Retail Ltd.) ICRA - AAA(SO) 0.73Bharat Petroleum Corporation Ltd. CRISIL - AAA 0.69Larsen and Toubro Ltd. CRISIL - AAA 0.69Manappuram Finance Ltd. CARe - AA 0.59Bharti Hexacom Ltd. CRISIL - AA 0.57Power Grid Corporation of India Ltd. CRISIL - AAA 0.53TATA Capital Housing Finance Ltd. CRISIL - AAA 0.40Daimler Fin Ser (I) Pvt Ltd. CRISIL - AA+ 0.39embassy Office Parks ReIT CRISIL - AAA 0.38NTPC Ltd. CRISIL - AAA 0.37Housing and Urban Development Corporation Ltd. CARe - AAA 0.36Shriram Transport Finance Company Ltd. CRISIL - AA+ 0.36Mangalore Refinery and Petrochemicals Ltd. CARe - AAA 0.31Bharati Telecom Ltd. CRISIL - AA+ 0.30Small Industries Development Bank CARe - AAA 0.29TMF Holdings Ltd. (Subsidiary of Tata Motors Ltd.) ICRA - AA- 0.24Tata Motors Finance Solutions Ltd. CARe - AA- 0.19HDB Financial Services Ltd. CRISIL - AAA 0.16National Highways Authority of India CARe - AAA / CRISIL - AAA 0.12First Business Receivables Trust (PTC backed by receivables from Reliance Corporate IT Park Ltd.) CRISIL - AAA(SO) 0.12Motherson Sumi Systems Ltd. IND - AAA 0.10
Issuer Rating % to NAVJamnagar Utilities & Power Pvt. Ltd. (erstwhile Reliance Utilities & Power Pvt. Ltd.) CRISIL - AAA 0.05Shriram City Union Finance Ltd. CARe - AA 0.05Aarish Solar Power Pvt. Ltd. (Greenko) CARe - AA(Ce) 0.02Aashman energy Pvt. Ltd. (Greenko) CARe - AA(Ce) 0.02Divyesh Power Pvt. Ltd. (Greenko) CARe - AA(Ce) 0.02elena Renewable energy Pvt. Ltd. (Greenko) CARe - AA(Ce) 0.02Pratyash Renewable Pvt. Ltd. (Greenko) CARe - AA(Ce) 0.02SeI Baskara Power Pvt. Ltd. (Greenko) CARe - AA(Ce) 0.02SeI enerstar Renewable energy Pvt. Ltd. (Greenko) CARe - AA(Ce) 0.02SeI Mihir energy Pvt. Ltd. (Greenko) CARe - AA(Ce) 0.02Shreyas Renewable energy Pvt. Ltd. (Greenko) CARe - AA(Ce) 0.02Zuvan energy Pvt. Ltd. (Greenko) CARe - AA(Ce) 0.02Sub Total 39.68CREDIT ExPOSURE (PERPETUAL BONDS)Union Bank of India (AT1, BASeL III, Perpetual) BRICKWORKS - AA 1.48Bank of Baroda (AT1, BASeL III, Perpetual) CARe - AA 0.72Canara Bank (AT1, BASeL III, Perpetual) CRISIL - AA 0.68Canara Bank (AT1, BASeL III, Perpetual) CARe - AA 0.68Union Bank of India (AT1, BASeL III, Perpetual) IND - AA 0.61Punjab National Bank (AT1, BASeL III, Perpetual) CRISIL - AA- 0.59Union Bank of India (AT1, BASeL III, Perpetual) CARe - AA- 0.58Indian Bank (AT1, BASeL III, Perpetual) CRISIL - AA 0.34Union Bank of India (AT1, BASeL III, Perpetual) CRISIL - AA- 0.30Axis Bank Ltd. (AT1, BASeL III, Perpetual) CRISIL - AA+ 0.25State Bank of India (AT1, BASeL III, Perpetual) CRISIL - AA+ 0.10Sub Total 6.33Total 64.27MONEY MARKET INSTRUMENTSCP• Indian Oil Corporation Ltd. ICRA - A1+ 3.16• Tata Teleservices Ltd. CRISIL - A1+ 2.79Bharat Heavy electricals Ltd. CARE - A1+ 1.33Tata Motors Finance Ltd. CARE - A1+ 0.88CanFin Homes Ltd. CARE - A1+ 0.76Reliance Jio Infocomm Ltd. CRISIL - A1+ 0.57Sundaram BNP Paribas Home Finance L CRISIL - A1+ 0.57Tata Teleservices (Maharashtra) Ltd. CRISIL - A1+ 0.56Tata Realty and Infrastructure Ltd. CRISIL - A1+ 0.46Infina Finance Pvt. Ltd. CRISIL - A1+ 0.39Tata Projects Ltd. CRISIL - A1+ 0.38Fedbank Financial Services Ltd. CRISIL - A1+ 0.19Sub Total 12.04CD Axis Bank Ltd. CRISIL - A1+ 2.49MUFG Bank Ltd. IND - A1+ 1.91export - Import Bank of India CRISIL - AAA 1.76Sub Total 6.16Total 18.20Cash, Cash equivalents and Net Current Assets 17.53Grand Total 100.00• Top Ten Holdings, £ Co-sponsor
Outstanding exposure in derivative instruments Interest Rate Swap (` in Crore) 4,125.00
PORTFOLIO
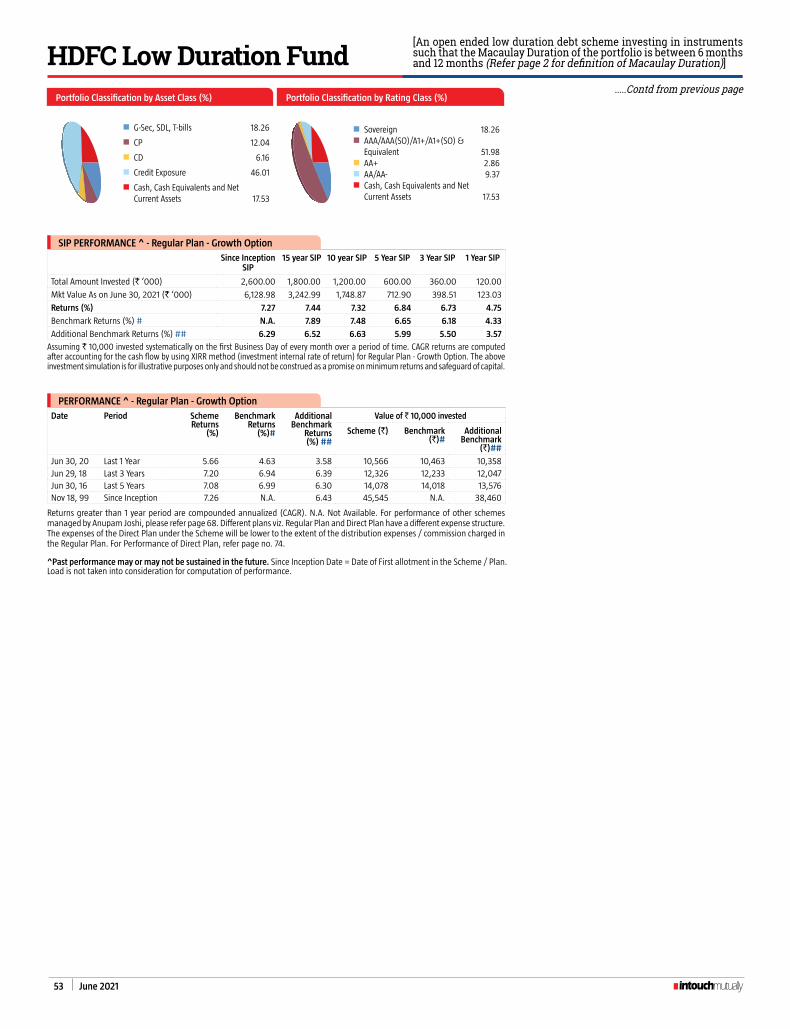
53 June 2021
^Past performance may or may not be sustained in the future. Since Inception Date = Date of First allotment in the Scheme / Plan. Load is not taken into consideration for computation of performance.
Portfolio Classification by Asset Class (%)
n G-Sec, SDL, T-bills 18.26
n CP 12.04
n CD 6.16
n Credit exposure 46.01
n Cash, Cash equivalents and Net Current Assets 17.53
Portfolio Classification by Rating Class (%)
n Sovereign 18.26n AAA/AAA(SO)/A1+/A1+(SO) &
equivalent 51.98n AA+ 2.86n AA/AA- 9.37n Cash, Cash equivalents and Net
Current Assets 17.53
[An open ended low duration debt scheme investing in instruments such that the Macaulay Duration of the portfolio is between 6 months and 12 months (Refer page 2 for definition of Macaulay Duration)]HDFC Low Duration Fund
PERFORMANCE ^ - Regular Plan - Growth Option
Date Period Scheme Returns
(%)
Benchmark Returns
(%)#
Additional Benchmark
Returns (%) ##
Value of ` 10,000 invested
Scheme (`) Benchmark (`)#
Additional Benchmark
(`)##
Jun 30, 20 Last 1 Year 5.66 4.63 3.58 10,566 10,463 10,358Jun 29, 18 Last 3 Years 7.20 6.94 6.39 12,326 12,233 12,047Jun 30, 16 Last 5 Years 7.08 6.99 6.30 14,078 14,018 13,576Nov 18, 99 Since Inception 7.26 N.A. 6.43 45,545 N.A. 38,460
Returns greater than 1 year period are compounded annualized (CAGR). N.A. Not Available. For performance of other schemes managed by Anupam Joshi, please refer page 68. Different plans viz. Regular Plan and Direct Plan have a different expense structure. The expenses of the Direct Plan under the Scheme will be lower to the extent of the distribution expenses / commission charged in the Regular Plan. For Performance of Direct Plan, refer page no. 74.
SIP PERFORMANCE ^ - Regular Plan - Growth Option
Since Inception SIP
15 year SIP 10 year SIP 5 Year SIP 3 Year SIP 1 Year SIP
Total Amount Invested (` ‘000) 2,600.00 1,800.00 1,200.00 600.00 360.00 120.00
Mkt Value As on June 30, 2021 (` ‘000) 6,128.98 3,242.99 1,748.87 712.90 398.51 123.03
Returns (%) 7.27 7.44 7.32 6.84 6.73 4.75
Benchmark Returns (%) # N.A. 7.89 7.48 6.65 6.18 4.33
Additional Benchmark Returns (%) ## 6.29 6.52 6.63 5.99 5.50 3.57
Assuming ` 10,000 invested systematically on the first Business Day of every month over a period of time. CAGR returns are computed after accounting for the cash flow by using xIRR method (investment internal rate of return) for Regular Plan - Growth Option. The above investment simulation is for illustrative purposes only and should not be construed as a promise on minimum returns and safeguard of capital.
.....Contd from previous page

June 2021 54
n G-Sec, SDL, T-Bills 31.68
n CP 53.34
n CD 14.33
n Cash, Cash equivalents and Net Current Assets 0.65
Portfolio Classification by Asset Class (%)
n Sovereign 31.68
n AAA/AAA(SO)/A1+/A1+(SO) & equivalent 67.67
n Cash, Cash equivalents and Net Current Assets 0.65
Portfolio Classification by Rating Class (%)
CATEGORY OF SCHEME: MONEY MARKET FUND
PERFORMANCE ^ - Regular Plan - Growth Option
Date Period Scheme Returns
(%) $$
Benchmark Returns
(%)#
Additional Benchmark
Returns (%) ##
Value of ` 10,000 invested
Scheme (`) $$
Benchmark (`)#
Additional Benchmark
(`)##
Jun 30, 20 Last 1 Year 4.20 3.75 3.58 10,420 10,375 10,358Jun 29, 18 Last 3 Years 6.80 5.99 6.39 12,186 11,911 12,047Jun 30, 16 Last 5 Years 6.76 6.36 6.30 13,868 13,613 13,576Nov 18, 99 Since Inception 7.17 N.A. 6.43 44,761 N.A. 38,460
Returns greater than 1 year period are compounded annualized (CAGR). N.A. Not Available. $$ All Dividends declared prior to the splitting of the Scheme into IDCW & Growth Options are assumed to be reinvested in the units of the Scheme at the then prevailing NAV (ex-dividend NAV). For performance of other schemes managed by Anil Bamboli & Vikas Agarwal, please refer page 68. Different plans viz. Regular Plan and Direct Plan have a different expense structure. The expenses of the Direct Plan under the Scheme will be lower to the extent of the distribution expenses / commission charged in the Regular Plan. For Performance of Direct Plan, refer page no. 80.
Face Value per Unit: ` 1,000, CD - Certificate of Deposit; CP - Commercial Papers. Data is as of June 30, 2021 unless otherwise specified.
This product is suitable for investors who are seeking ~
l income over short term
l to generate income / capital appreciation by investing in money market instruments
VeryHigh
Low to
Moderate
Low
Moderate ModeratelyHigh High
RISKOMETERInvestors understand that their principal will be at
moderate risk
~ Investors should consult their financial advisers, if in doubt about whether the product is suitable for them. ^Past performance may or may not be sustained in the future. Since Inception Date = Date of First allotment in the Scheme / Plan.
Load is not taken into consideration for computation of performance.
(An open ended debt scheme investing in money market instruments)HDFC Money Market Fund
Issuer Rating % to NAVDEBT & DEBT RELATEDGOVERNMENT SECURITIES (CENTRAL/STATE)• 8.79 GOI 2021 Sovereign 8.45• 8.2 GOI 2022 Sovereign 4.496.17 GOI 2021 Sovereign 2.677.75% Punjab SDL Mat 130721 Sovereign 0.546.94% Odisha SDL - Mat 260721 Sovereign 0.478.79% Maharashtra SDL - Mat 211221 Sovereign 0.04Sub Total 16.66T-BILLS• 182 days Tbill ISD 080421
Mat 071021 Sovereign 3.58• 182 Days Tbill ISD 140521
Mat 121121 Sovereign 3.21182 days Tbill ISD 200521 Mat 181121 Sovereign 2.49182 days Tbill ISD 180221 Mat 190821 Sovereign 2.16182 days Tbill ISD 100621 Mat 091221 Sovereign 2.13182 days Tbill ISD 270521 Mat 251121 Sovereign 0.71364 Days Tbill ISD 310321 Mat 300322 Sovereign 0.56364 Days Tbill Mat 071021 Sovereign 0.18Sub Total 15.02Total 31.68MONEY MARKET INSTRUMENTSCP • Reliance Industries Ltd. CRISIL - A1+ 5.03• National Bank for Agriculture
and Rural Development ICRA - A1+ 4.31• Housing Development
Finance Corporation Ltd.£ CRISIL - A1+ 4.30• Sun Pharmaceutical
Industries Ltd. CRISIL - A1+ 3.53Tata Teleservices Ltd. CRISIL - A1+ 2.79CanFin Homes Ltd. CARE - A1+ 2.64Tata Motors Finance Ltd. CARE - A1+ 2.60ICICI Securities Ltd. CRISIL - A1+ 2.36Bajaj Housing Finance Ltd. CRISIL - A1+ 2.13Manappuram Finance Ltd. CRISIL - A1+ 2.12Deutsche Investments India Pvt. Ltd. CRISIL - A1+ 2.11
Issuer Rating % to NAVHero Fincorp Ltd. CRISIL - A1+ 2.11Hindustan Zinc Ltd. CRISIL - A1+ 1.78Motilal Oswal Financial Services Ltd. CRISIL - A1+ 1.43export - Import Bank of India CRISIL - A1+ 1.42TATA Housing Development Company Ltd. CARE - A1+ 1.40Tata Teleservices (Maharashtra) Ltd. CRISIL - A1+ 1.38Barclays Invest & Loans (India) Ltd. CRISIL - A1+ 1.35Axis Finance Ltd. CRISIL - A1+ 1.24TMF Holdings Ltd. (Subsidiary of Tata Motors Ltd.) CARE - A1+ 1.05UPL Ltd. CRISIL - A1+ 0.71Mahindra & Mahindra Financial Services Ltd. CRISIL - A1+ 0.70SBI Global Factors Ltd. CRISIL - A1+ 0.57SCB Inv & Loan (I) Ltd. CRISIL - A1+ 0.57Infina Finance Pvt. Ltd. CRISIL - A1+ 0.55LIC Housing Finance Ltd. CRISIL - A1+ 0.53Fullerton India Home Finance Company Ltd. CRISIL - A1+ 0.52Tata Projects Ltd. CRISIL - A1+ 0.36Aditya Birla Finance Ltd. ICRA - A1+ 0.35Cholamandalam Investment & Finance CRISIL - A1+ 0.35Fedbank Financial Services Ltd. CRISIL - A1+ 0.35L&T Finance Ltd. CRISIL - A1+ 0.35Network 18 Media & Investments Ltd. CARE - A1+ 0.35Sub Total 53.34CD• Axis Bank Ltd. CRISIL - A1+ 7.28• Indusind Bank Ltd. CRISIL - A1+ 3.35National Bank for Agriculture and Rural Development IND - A1+ 3.00Small Industries Development Bank ICRA - A1+ 0.70Sub Total 14.33Total 67.67Cash, Cash equivalents and Net Current Assets 0.65Grand Total 100.00
• Top Ten Holdings, £ Co-sponsor
PORTFOLIO
SIP PERFORMANCE ^ - Regular Plan - Growth Option
Since Inception SIP
15 year SIP 10 year SIP 5 Year SIP 3 Year SIP 1 Year SIP
Total Amount Invested (` ‘000) 2,600.00 1,800.00 1,200.00 600.00 360.00 120.00
Mkt Value As on June 30, 2021 (` ‘000) $$ 6,185.15 3,252.71 1,737.63 705.14 393.31 122.51
Returns (%) $$ 7.34 7.47 7.20 6.40 5.84 3.93
Benchmark Returns (%) # N.A. 7.46 6.96 5.84 5.13 3.67
Additional Benchmark Returns (%) ## 6.29 6.52 6.63 5.99 5.50 3.57
Assuming ` 10,000 invested systematically on the first Business Day of every month over a period of time. CAGR returns are computed after accounting for the cash flow by using xIRR method (investment internal rate of return) for Regular Plan - Growth Option. The above investment simulation is for illustrative purposes only and should not be construed as a promise on minimum returns and safeguard of capital.
KEY FACTSINVESTMENT OBJECTIVETo generate income / capital appreciation by investing in money market instruments.
There is no assurance that the investment objective of the Scheme will be realized.
FUND MANAGER ¥
Anil Bamboli (since July 25, 2012)
Total Experience: Over 23 years
Vikash Agarwal (since July 1, 2020)
Total Experience: Over 14 years
INCEPTION DATE (Date of Allotment)November 18, 1999
NAV (AS ON JUNE 30, 2021) NAV PER UNIT (`)Regular Plan - Growth Option 4,460.7528Regular Plan - Daily IDCW Reinvestment Option 1,063.6400Regular Plan - Weekly IDCW Option 1,063.0300Direct Plan - Growth Option 4,518.1507Direct Plan - Daily IDCW Reinvestment Option 1,063.6400Direct Plan - Weekly IDCW Option 1,063.0503
ASSETS UNDER MANAGEMENT (`) IN CROREAs on June 30, 2021 13,853.92Average for Month of June 2021 15,028.45
qUANTITATIVE DATAAverage Maturity * 156 daysMacaulay Duration * 156 daysModified Duration * 155 daysYield to Maturity * 3.96%
*Calculated on amount invested in debt securities (including accrued interest), deployment of funds in TRePS and Reverse Repo and net receivable / payable.
TOTAL ExPENSE RATIO (As on June 30, 2021)Including Additional expenses and Goods and Service Tax on Management FeesRegular: 0.35% Direct: 0.21%
#BENCHMARK INDEx: NIFTY Money Market Index
##ADDL. BENCHMARK INDEx: CRISIL 1 year T-Bill Index
ExIT LOADNil
PLANS & OPTIONSRegular Plan, Direct Plan. Each Plan offers Growth & Daily Income Distribution cum Capital Withdrawal (IDCW) Option. The (Daily) IDCW Option offers only Re-investment of Income Distribution cum Capital Withdrawal (IDCW) Option. The (Weekly) IDCW Option offers following Sub-Options: Payout of Income Distribution cum Capital Withdrawal (IDCW) Option; and Re-investment of Income Distribution cum Capital Withdrawal (IDCW) Option.
MINIMUM APPLICATION AMOUNTPurchase : Under Growth Option and Weekly IDCW Option : ` 5,000 and any amount thereafter. Under Daily IDCW Option : ` 10,000 and any amount thereafter
Additional Purchase : Under Growth Option and Weekly IDCW Option : ` 1,000 and any amount thereafter. Under Daily IDCW Option : ` 5,000 and any amount thereafter
¥ Dedicated Fund Manager for Overseas Investments: Mr. Sankalp Baid (since January 22, 2021) (Total Experience: Over 13 years).

June 2021 55
PORTFOLIOIssuer Rating % to NAV
DEBT & DEBT RELATED
GOVERNMENT SECURITIES (CENTRAL/STATE)
• Floating Rate GOI 2033 Sovereign 8.01
7.89% Gujarat SDL - Mat 150525 Sovereign 2.12
7.59 GOI 2026 Sovereign 1.45
6.79 GOI 2027 Sovereign 1.27
Floating Rate GOI 2024 Sovereign 0.66
6.97 GOI 2026 Sovereign 0.64
8.15% Gujarat SDL - Mat 230925 Sovereign 0.41
6.18 GOI 2024 Sovereign 0.27
8.2 GOI 2022 Sovereign 0.25
7.32 GOI 2024 Sovereign 0.14
5.79 GOI 2030 Sovereign 0.05
5.15 GOI 2025 Sovereign 0.03
7.16 GOI 2023 Sovereign 0.03
Sub Total 15.33
T-BILLS
182 days Tbill ISD 270521 Mat 251121 Sovereign 2.37
182 days Tbill ISD 100621 Mat 091221 Sovereign 1.05
Sub Total 3.42
CREDIT ExPOSURE (NON PERPETUAL)
• Power Finance Corporation Ltd. CARe - AAA / CRISIL - AAA / ICRA - AAA 6.88
• REC Ltd. CARe - AAA / CRISIL - AAA / IND - AAA 5.27
• Housing Development Finance Corporation Ltd.£ CRISIL - AAA 4.17
• Embassy Office Parks REIT CRISIL - AAA 3.66
• LIC Housing Finance Ltd. CARe - AAA / CRISIL - AAA 3.49
• National Bank for Agriculture and Rural Development
CRISIL - AAA / ICRA - AAA 2.80
• Muthoot Finance Ltd. CRISIL - AA+ 2.46
Reliance Industries Ltd. CRISIL - AAA 2.05
L&T Finance Ltd. CRISIL - AAA 1.78
Vedanta Ltd. CRISIL - AA- 1.75
Sikka Port and Terminal Ltd. (erstwhile Reliance Ports and Terminals Ltd.)
CARe - AAA / CRISIL - AAA 1.62
NTPC Ltd. CRISIL - AAA 1.34
Small Industries Development Bank CARe - AAA 1.24
National Housing Bank CRISIL - AAA 1.08
Housing and Urban Development Corporation Ltd. CARe - AAA / IND - AAA 1.04
Indian Railways Finance Corporation Ltd. CRISIL - AAA 0.94
Larsen and Toubro Ltd. CRISIL - AAA 0.90
Grasim Industries Ltd. CRISIL - AAA 0.82
Hinduja Leyland Finance Ltd. CARe - AA- 0.80
Tata Motors Finance Ltd. CRISIL - AA- 0.80
Manappuram Finance Ltd. CARe - AA / CRISIL - AA 0.79
TATA Capital Housing Finance Ltd. CRISIL - AAA 0.75
Fullerton India Home Finance Company Ltd. CRISIL - AAA 0.66
Motilal Oswal Finvest Ltd. CRISIL - AA- 0.66
State Bank of India CRISIL - AAA 0.57
TMF Holdings Ltd. (Subsidiary of Tata Motors Ltd.) ICRA - AA- 0.50
Issuer Rating % to NAV
First Business Receivables Trust (PTC backed by receivables from Reliance Corporate IT Park Ltd.) CRISIL - AAA(SO) 0.48
IndInfravit Trust CRISIL - AAA 0.35
Tata Motors Finance Solutions Ltd. CARe - AA- 0.32
Bajaj Finance Ltd. CRISIL - AAA 0.27
Cholamandalam Investment & Finance ICRA - AA+ 0.27
Hindustan Petroleum Corporation Ltd. CRISIL - AAA 0.27
National Highways Authority of India CARe - AAA 0.27
Sundaram BNP Paribas Home Finance L ICRA - AA+ 0.14
Flometallic India Pvt Ltd. CRISIL - AA+ 0.08
Jamnagar Utilities & Power Pvt. Ltd. (erstwhile Reliance Utilities & Power Pvt. Ltd.) CRISIL - AAA 0.03
Tata Sons Ltd. CRISIL - AAA 0.02
Sub Total 51.32
CREDIT ExPOSURE (PERPETUAL BONDS)
Canara Bank (AT1, BASeL III, Perpetual) CARe - AA 2.03
Union Bank of India (AT1, BASeL III, Perpetual) BRICKWORKS - AA 0.76
TMF Holdings Ltd. (Subsidiary of Tata Motors Ltd.) (Perpetual) CRISIL - AA- 0.75
Canara Bank (AT1, BASeL III, Perpetual) CRISIL - AA 0.54
Axis Bank Ltd. (AT1, BASeL III, Perpetual) CRISIL - AA+ 0.41
Punjab National Bank (AT1, BASeL III, Perpetual) BRICKWORKS - AA 0.27
Indian Bank (AT1, BASeL III, Perpetual) CRISIL - AA 0.13
Punjab National Bank (AT1, BASeL III, Perpetual) IND - AA 0.03
Sub Total 4.92
Total 74.99
MONEY MARKET INSTRUMENTS
CP
Tata Teleservices Ltd. CRISIL - A1+ 1.80
Tata Motors Finance Ltd. CARE - A1+ 1.31
TMF Holdings Ltd. (Subsidiary of Tata Motors Ltd.) CARE - A1+ 0.90
TATA Housing Development Company Ltd. CARE - A1+ 0.40
Fedbank Financial Services Ltd. CRISIL - A1+ 0.34
Tata Projects Ltd. CRISIL - A1+ 0.27
Bahadur Chand Investments Pvt. Ltd. CARE - A1+ 0.26
Sub Total 5.28
CD
• Axis Bank Ltd. CRISIL - A1+ 5.04
• IDFC First Bank Ltd. CRISIL - A1+ 2.56
Small Industries Development Bank CARE - A1+ 1.82
Sub Total 9.42
Total 14.70
Cash, Cash equivalents and Net Current Assets 10.31
Grand Total 100.00
• Top Ten Holdings, £ Co-sponsorOutstanding exposure in derivative instruments Interest Rate Swap (` in Crore) 7,750.00
CATEGORY OF SCHEME: FLOATER FUND
KEY FACTS
INVESTMENT OBJECTIVE
To generate income/capital appreciation through investment in a portfolio comprising substantially of floating rate debt, fixed rate debt instruments swapped for floating rate returns and money market instruments. There is no assurance that the investment objective of the Scheme will be realized.
FUND MANAGER ¥
Shobhit Mehrotra (since October 23, 2007)
Total Experience: Over 25 years
Vikash Agarwal (since July 1, 2020)
Total Experience: Over 14 years
INCEPTION DATE (Date of Allotment)
October 23, 2007
NAV (AS ON JUNE 30, 2021) NAV PER UNIT (`)
Regular Plan - Growth Option 38.4464Regular Plan - Daily IDCW Reinvestment Option 10.0787Regular Plan - Weekly IDCW Option 10.0378Regular Plan - Monthly IDCW Option 10.1419Direct Plan - Growth Option 38.8550Direct Plan - Daily IDCW Reinvestment Option 10.0788Direct Plan - Weekly IDCW Option 10.0380Direct Plan - Monthly IDCW Option 10.1420
ASSETS UNDER MANAGEMENT (`) IN CRORE
As on June 30, 2021 18,739.69Average for Month of June 2021 18,277.60
qUANTITATIVE DATA
Average Maturity * 2.85 yearsMacaulay Duration * 1.36 yearsModified Duration * 1.25 yearsYield to Maturity * 4.97%*Calculated on amount invested in debt securities (including accrued interest), deployment of funds in TRePS and Reverse Repo and net receivable / payable.
TOTAL ExPENSE RATIO (As on June 30, 2021)Including Additional expenses and Goods and Service Tax on Management Fees
Regular: 0.48% Direct: 0.23%
#BENCHMARK INDEx: CRISIL Liquid Fund Index
##ADDL. BENCHMARK INDEx: CRISIL 10 year Gilt Index
ExIT LOAD
Nil
PLANS & OPTIONS
Regular Plan, Direct Plan. Under both the Plans: Growth & Income Distribution cum Capital Withdrawal (IDCW) Option. The (Daily) IDCW Option offers only Re-investment of Income Distribution cum Capital Withdrawal (IDCW) Option. The (Weekly and Monthly) IDCW Option offers following Sub-Options: Payout of Income Distribution cum Capital Withdrawal (IDCW) Option; and Re-investment of Income Distribution cum Capital Withdrawal (IDCW) Option.
MINIMUM APPLICATION AMOUNT
Purchase : ` 5,000 and any amount thereafter. Additional Purchase : ` 1 and any amount thereafter.
¥ Dedicated Fund Manager for Overseas Investments: Mr. Sankalp Baid (since January 22, 2021) (Total Experience: Over 13 years).
Face Value per Unit: ` 10 unless otherwise specified, CD - Certificate of Deposit; CP - Commercial Papers. Data is as of June 30, 2021 unless otherwise specified.
This product is suitable for investors who are seeking ~
l income over short terml to generate income / capital appreciation through investment
in a portfolio comprising substantially of floating rate debt, fixed rate debt instruments swapped for floating rate returns and money market instruments
VeryHigh
Low to
Moderate
Low
Moderate ModeratelyHigh High
RISKOMETERInvestors understand that their principal will be at
moderate risk~ Investors should consult their financial advisers, if in doubt about whether the product is suitable for them.
[An open ended debt scheme predominantly investing in floating rate instruments (including fixed rate instruments converted to floating rate exposures using swaps / derivatives)]HDFC Floating Rate Debt Fund

56 June 2021
Portfolio Classification by Asset Class (%)
n G-Sec, SDL, T-Bills 18.75
n CP 5.28
n CD 9.42
n Credit exposure 56.24
n Cash, Cash equivalents and Net Current Assets 10.31
Portfolio Classification by Rating Class (%)
n Sovereign 18.75n AAA/AAA(SO)/A1+/A1+(SO) &
equivalent 57.45n AA+ 3.36n AA/AA- 10.13n Cash, Cash equivalents and Net
Current Assets 10.31
PERFORMANCE ^ - Regular Plan - Growth Option
Date Period Scheme Returns
(%)
Benchmark Returns
(%)#
Additional Benchmark
Returns (%) ##
Value of ` 10,000 invested
Scheme (`) Benchmark (`)#
Additional Benchmark
(`)##
Jun 30, 20 Last 1 Year 6.38 3.71 4.08 10,638 10,371 10,408
Jun 29, 18 Last 3 Years 7.88 5.70 9.61 12,562 11,813 13,174
Jun 30, 16 Last 5 Years 7.66 6.19 7.25 14,464 13,505 14,192
Oct 23, 07 Since Inception 8.13 7.13 6.93 29,166 25,675 25,034
Returns greater than 1 year period are compounded annualized (CAGR). Since Inception returns are calculated on ` 13.1821 (allotment price). For performance of other schemes managed by Shobhit Mehrotra & Vikas Agarwal, please refer page 68. Different plans viz. Regular Plan and Direct Plan have a different expense structure. The expenses of the Direct Plan under the Scheme will be lower to the extent of the distribution expenses / commission charged in the Regular Plan. For Performance of Direct Plan, refer page no. 80.
[An open ended debt scheme predominantly investing in floating rate instruments (including fixed rate instruments converted to floating rate exposures using swaps / derivatives)]HDFC Floating Rate Debt Fund
SIP PERFORMANCE ^ - Regular Plan - Growth Option
Since Inception SIP
10 year SIP
5 year SIP
3 year SIP
1 year SIP
Total Amount Invested (` ‘000) 1,650.00 1,200.00 600.00 360.00 120.00
Mkt Value As on June 30, 2021 (` ‘000) 2,969.33 1,816.18 725.37 403.01 123.48
Returns (%) 8.12 8.04 7.53 7.48 5.46
Benchmark Returns (%) # 6.99 6.75 5.63 4.83 3.64
Additional Benchmark Returns (%) ## 7.15 7.52 7.19 7.82 4.64
Assuming ` 10,000 invested systematically on the first Business Day of every month over a period of time. CAGR returns are computed after accounting for the cash flow by using xIRR method (investment internal rate of return) for Regular Plan - Growth Option. The above investment simulation is for illustrative purposes only and should not be construed as a promise on minimum returns and safeguard of capital.
.....Contd from previous page
^Past performance may or may not be sustained in the future. Since Inception Date = Date of First allotment in the Scheme / Plan. Load is not taken into consideration for computation of performance.

June 2021 57
CATEGORY OF SCHEME: ULTRA SHORT DURATION FUND
KEY FACTSINVESTMENT OBJECTIVETo generate income / capital appreciation through investment in debt securities and money market instruments.
There is no assurance that the investment objective of the Scheme will be realized.
FUND MANAGER ¥
Anil Bamboli (since September 25, 2018)
Total Experience: Over 23 years
INCEPTION DATE (Date of Allotment)September 25, 2018
NAV (AS ON JUNE 30, 2021) NAV PER UNIT (`)Regular Plan - Growth Option 11.9523Regular Plan - Daily IDCW Reinvestment Option 10.1030Regular Plan - Weekly IDCW Option 10.0520Regular Plan - Monthly IDCW Option 10.1520Direct Plan - Growth Option 12.0567Direct Plan - Daily IDCW Reinvestment Option 10.0920Direct Plan - Weekly IDCW Option 10.0521Direct Plan - Monthly IDCW Option 10.0521
ASSETS UNDER MANAGEMENT (`) IN CROREAs on June 30, 2021 16,033.71Average for Month of June 2021 16,766.42
qUANTITATIVE DATAAverage Maturity * 194 daysMacaulay Duration * 185 daysModified Duration * 181 daysYield to Maturity * 4.08%
*Calculated on amount invested in debt securities (including accrued interest), deployment of funds in TRePS and Reverse Repo and net receivable / payable.
TOTAL ExPENSE RATIO (As on June 30, 2021)Including Additional expenses and Goods and Service Tax on Management FeesRegular: 0.64% Direct: 0.34%
#BENCHMARK INDEx: CRISIL Ultra Short Term Debt Index
##ADDL. BENCHMARK INDEx: CRISIL 1 year T-Bill Index
ExIT LOADNil
PLANS & OPTIONSRegular Plan, Direct Plan. Under both the Plans: Growth & Income Distribution cum Capital Withdrawal (IDCW) Option. The (Daily) IDCW Option offers only Re-investment of Income Distribution cum Capital Withdrawal (IDCW) Option. The (Weekly and Monthly) IDCW Option offers following Sub-Options: Payout of Income Distribution cum Capital Withdrawal (IDCW) Option; and Re-investment of Income Distribution cum Capital Withdrawal (IDCW) Option.
MINIMUM APPLICATION AMOUNTPurchase : ` 5,000 and any amount thereafter. Additional Purchase : ` 1,000 and any amount thereafter.
¥ Dedicated Fund Manager for Overseas Investments: Mr. Sankalp Baid (since January 22, 2021) (Total Experience: Over 13 years).
Face Value per Unit: ` 10 unless otherwise specified, CD - Certificate of Deposit; CP - Commercial Papers. Data is as of June 30, 2021 unless otherwise specified.
This product is suitable for investors who are seeking ~
l income over short terml income/capital appreciation through investment in debt
securities and money market instruments
VeryHigh
Low to
Moderate
Low
Moderate ModeratelyHigh High
RISKOMETERInvestors understand that their principal will be at
moderate risk
~ Investors should consult their financial advisers, if in doubt about whether the product is suitable for them.
[An open ended ultra-short term debt scheme investing in instruments such that the Macaulay Duration of the portfolio is between 3 months and 6 months (Refer page 2 for definition of Macaulay Duration)]HDFC Ultra Short Term Fund
Issuer Rating % to NAV
DEBT & DEBT RELATED
GOVERNMENT SECURITIES (CENTRAL/STATE)
• 8.35 GOI 2022 Sovereign 3.65
• 8.2 GOI 2022 Sovereign 3.59
8.15 GOI 2022 Sovereign 1.46
8.79 GOI 2021 Sovereign 1.27
Sub Total 9.97
T-BILLS
• 182 days Tbill ISD 100621 Mat 091221 Sovereign 3.68
• 182 Days Tbill Mat 161221 Sovereign 3.68
• 182 days Tbill ISD 010721 Mat 301221 Sovereign 3.67
• 182 Days Tbill ISD 150421 Mat 141021 Sovereign 3.09
182 days Tbill ISD 200521 Mat 181121 Sovereign 3.08
91 Days Tbill ISD 150421 Mat 150721 Sovereign 1.56
182 days Tbill ISD 080421 Mat 071021 Sovereign 1.24
182 days Tbill ISD 240621 Mat 231221 Sovereign 1.23
182 Days Tbill Mat 220721 Sovereign 0.81
Sub Total 22.04
CREDIT ExPOSURE (NON PERPETUAL)
• Housing Development Finance Corporation Ltd.£ CRISIL - AAA 6.72
• National Bank for Agriculture and Rural Development CRISIL - AAA / ICRA - AAA 5.10
• REC Ltd. CRISIL - AAA 4.50
Power Finance Corporation Ltd. CARe - AAA / CRISIL - AAA 2.81
LIC Housing Finance Ltd. CARe - AAA / CRISIL - AAA 2.12
L&T Finance Ltd. CARe - AAA / CRISIL - AAA / IND - AAA 1.75
Liquid Gold Series 5 ICRA - A1+(SO) 1.72
Reliance Industries Ltd. CRISIL - AAA 1.40
Liquid Gold Series 6 ICRA - AAA(SO) 0.84
TATA Capital Housing Finance Ltd. CRISIL - AAA 0.65
National Highways Authority of India CRISIL - AAA 0.57
John Deere Financial India Pvt. Ltd. CRISIL - AAA 0.53
Food Corporation of India (Corporate guarantee from Govt of India) CARe - AAA(Ce) 0.49
Mahindra & Mahindra Financial Services Ltd. IND - AAA 0.31
Mobil Trust Series 10 (PTC of pools from Shriram City Union Finance Ltd.) CRISIL - AAA(SO) 0.25
Issuer Rating % to NAV
Indian Railways Finance Corporation Ltd. CRISIL - AAA 0.22
Bajaj Finance Ltd. CRISIL - AAA 0.20
First Business Receivables Trust (PTC backed by receivables from Reliance Corporate IT Park Ltd.) CRISIL - AAA(SO) 0.20
Flometallic India Pvt Ltd. CRISIL - AA+ 0.13
Aditya Birla Housing Finance Ltd. ICRA - AAA 0.11
Housing and Urban Development Corporation Ltd. IND - AAA 0.06
Sub Total 30.68
Total 62.69
MONEY MARKET INSTRUMENTS
CP
• Reliance Jio Infocomm Ltd. CRISIL - A1+ 4.67
Manappuram Finance Ltd. CRISIL - A1+ 3.08
CanFin Homes Ltd. CARE - A1+ 2.47
Tata Teleservices Ltd. CRISIL - A1+ 2.26
Tata Motors Finance Ltd. CARE - A1+ 2.18
Hindustan Zinc Ltd. CRISIL - A1+ 1.54
Sun Pharmaceutical Industries Ltd. CRISIL - A1+ 1.40
TATA Housing Development Company Ltd. CARE - A1+ 1.28
ICICI Securities Ltd. CRISIL - A1+ 1.24
Tata Teleservices (Maharashtra) Ltd. CRISIL - A1+ 1.19
Tata Steel Ltd. ICRA - A1+ 1.02
Tata Projects Ltd. CRISIL - A1+ 0.62
TMF Holdings Ltd. (Subsidiary of Tata Motors Ltd.) CARE - A1+ 0.60
Bahadur Chand Investments Pvt. Ltd. CARE - A1+ 0.30
Deutsche Investments India Pvt. Ltd. CRISIL - A1+ 0.30
Fedbank Financial Services Ltd. CRISIL - A1+ 0.30
SBI Cards and Payment Services Ltd. CRISIL - A1+ 0.15
Sub Total 24.60
CD
Axis Bank Ltd. CRISIL - A1+ 3.09
National Bank for Agriculture and Rural Development IND - A1+ 2.13
Sub Total 5.22
Total 29.82
Cash, Cash equivalents and Net Current Assets 7.49
Grand Total 100.00
• Top Ten Holdings, £ Co-sponsorOutstanding exposure in derivative instruments Interest Rate Swap (` in Crore) 600.00
PORTFOLIO
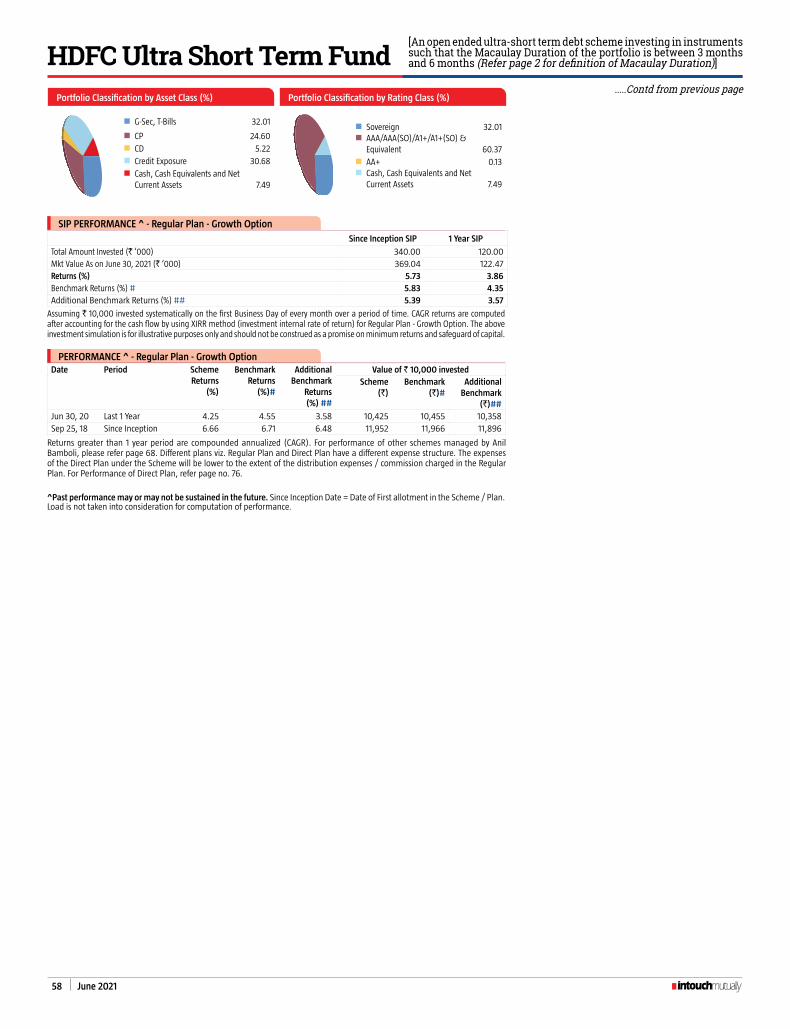
58 June 2021
[An open ended ultra-short term debt scheme investing in instruments such that the Macaulay Duration of the portfolio is between 3 months and 6 months (Refer page 2 for definition of Macaulay Duration)]HDFC Ultra Short Term Fund
^Past performance may or may not be sustained in the future. Since Inception Date = Date of First allotment in the Scheme / Plan. Load is not taken into consideration for computation of performance.
Portfolio Classification by Asset Class (%)
n G-Sec, T-Bills 32.01
n CP 24.60n CD 5.22n Credit exposure 30.68n Cash, Cash equivalents and Net
Current Assets 7.49
Portfolio Classification by Rating Class (%)
n Sovereign 32.01n AAA/AAA(SO)/A1+/A1+(SO) &
equivalent 60.37n AA+ 0.13n Cash, Cash equivalents and Net
Current Assets 7.49
PERFORMANCE ^ - Regular Plan - Growth OptionDate Period Scheme
Returns (%)
Benchmark Returns
(%)#
Additional Benchmark
Returns (%) ##
Value of ` 10,000 investedScheme
(`)Benchmark
(`)#Additional
Benchmark (`)##
Jun 30, 20 Last 1 Year 4.25 4.55 3.58 10,425 10,455 10,358Sep 25, 18 Since Inception 6.66 6.71 6.48 11,952 11,966 11,896
Returns greater than 1 year period are compounded annualized (CAGR). For performance of other schemes managed by Anil Bamboli, please refer page 68. Different plans viz. Regular Plan and Direct Plan have a different expense structure. The expenses of the Direct Plan under the Scheme will be lower to the extent of the distribution expenses / commission charged in the Regular Plan. For Performance of Direct Plan, refer page no. 76.
SIP PERFORMANCE ^ - Regular Plan - Growth Option
Since Inception SIP 1 Year SIP
Total Amount Invested (` ‘000) 340.00 120.00 Mkt Value As on June 30, 2021 (` ‘000) 369.04 122.47 Returns (%) 5.73 3.86 Benchmark Returns (%) # 5.83 4.35 Additional Benchmark Returns (%) ## 5.39 3.57
Assuming ` 10,000 invested systematically on the first Business Day of every month over a period of time. CAGR returns are computed after accounting for the cash flow by using xIRR method (investment internal rate of return) for Regular Plan - Growth Option. The above investment simulation is for illustrative purposes only and should not be construed as a promise on minimum returns and safeguard of capital.
.....Contd from previous page

June 2021 59
CATEGORY OF SCHEME: LIqUID FUND PORTFOLIO
KEY FACTSINVESTMENT OBJECTIVE
To generate income through a portfolio comprising money market and debt instruments.
There is no assurance that the investment objective of the Scheme will be realized.
FUND MANAGER ¥
Anupam Joshi (since October 27, 2015)
Total Experience: Over 12 years
INCEPTION DATE (Date of Allotment)
October 17, 2000
NAV (AS ON JUNE 30, 2021)^^ NAV PER UNIT (`)
Regular Plan - Growth Option 4,048.9127Regular Plan - Daily IDCW Reinvestment Option 1,019.8200Regular Plan - Weekly IDCW Option 1,031.2292Regular Plan - Monthly IDCW Option 1,026.4983Direct Plan - Growth Option 4,077.9755Direct Plan - Daily IDCW Reinvestment Option 1,019.8200Direct Plan - Weekly IDCW Option 1,031.2338Direct Plan - Monthly IDCW Option 1,026.5040
ASSETS UNDER MANAGEMENT (`) IN CRORE
As on June 30, 2021 52,683.54Average for Month of June 2021 55,972.89
qUANTITATIVE DATA
Average Maturity * 39 daysMacaulay Duration * 39 daysModified Duration * 39 daysYield to Maturity * 3.52%
*Calculated on amount invested in debt securities (including accrued interest), deployment of funds in TRePS and Reverse Repo and net receivable / payable.
TOTAL ExPENSE RATIO (As on June 30, 2021)Including Additional expenses and Goods and Service Tax on Management Fees
Regular: 0.30% Direct: 0.20%
#BENCHMARK INDEx: CRISIL Liquid Fund Index
##ADDL. BENCHMARK INDEx: CRISIL 1 year T-Bill Index
ExIT LOAD
l On investments made on or before October 19, 2019: NIL
l On investments (including through existing systematic plan registrations) made on or after October 20, 2019, as follows:
Units redeemed / switched-out within “x” days from the date
of allotment
Exit load as a % of redemption proceeds
Day 1 0.0070%Day 2 0.0065%Day 3 0.0060%Day 4 0.0055%Day 5 0.0050%Day 6 0.0045%Day 7 onwards Nil
PLANS & OPTIONS
Regular Plan, Direct Plan. Under both the Plans: Growth & Income Distribution cum Capital Withdrawal (IDCW) Option. The Daily IDCW Option offers only Re-investment of Income Distribution cum Capital Withdrawal (IDCW) Option. The Weekly and Monthly IDCW Option offers following Sub-Options: Payout of Income Distribution cum Capital Withdrawal (IDCW) Option; and Re-investment of Income Distribution cum Capital Withdrawal (IDCW) Option.
MINIMUM APPLICATION AMOUNT
Purchase : Under Growth Option, Weekly IDCW Option and Monthly IDCW Option: ` 5,000 and any amount thereafter. Under Daily IDCW Option: ̀ 10,000 and any amount thereafter.Additional Purchase : Under Growth Option, Weekly IDCW Option and Monthly IDCW Option: ` 1,000 and any amount thereafter. Under Daily IDCW Option: ` 5,000 and any amount thereafter.
¥ Dedicated Fund Manager for Overseas Investments: Mr. Sankalp Baid (since January 22, 2021) (Total Experience: Over 13 years).
^^Calculated on all calendar days.
Face Value per Unit: ` 1,000, CD - Certificate of Deposit; CP - Commercial Papers. Data is as of June 30, 2021 unless otherwise specified.
(An open ended liquid scheme)HDFC Liquid Fund
Company Rating % to NAV
DEBT & DEBT RELATED
GOVERNMENT SECURITIES (CENTRAL/STATE)
6.17 GOI 2021 Sovereign 0.89
Sub Total 0.89
T-BILLS
• 91 Days Tbill ISD 220421 Mat 220721 Sovereign 13.90
• 91 Days Tbill ISD 150421 Mat 150721 Sovereign 5.69
• 91 Days Tbill Mat 160921 Sovereign 4.60
• 91 Days Tbill ISD 290421 Mat 290721 Sovereign 4.50
91 days Tbill ISD 200521 Mat 190821 Sovereign 2.06
91 Days Tbill ISD 080421 Mat 080721 Sovereign 1.54
91 days T-bill Mat 230921 Sovereign 0.94
182 Days Tbill Mat 080721 Sovereign 0.02
Sub Total 33.25
CREDIT ExPOSURE (NON-PERPETUAL)
Fullerton India Credit Company Ltd. ICRA - AAA 1.11
Kotak Mahindra Prime Ltd. CRISIL - AAA 0.60
Tata Capital Financial Services Ltd. ICRA - AAA 0.26
LIC Housing Finance Ltd. CARe - AAA / CRISIL - AAA 0.12
Aditya Birla Finance Ltd. ICRA - AAA 0.11
UltraTech Cement Ltd. CRISIL - AAA 0.09
Reliance Industries Ltd. CRISIL - AAA 0.08
Housing Development Finance Corporation Ltd.£ CRISIL - AAA 0.06
HDB Financial Services Ltd. CRISIL - AAA 0.05
ReC Ltd. CRISIL - AAA 0.05
Small Industries Development Bank CARe - AAA 0.05
Bajaj Finance Ltd. CARe - AAA 0.01
Sub Total 2.59
Total 36.73
MONEY MARKET INSTRUMENTS
CP
• Reliance Industries Ltd. CRISIL - A1+ 8.80
• National Bank for Agriculture and Rural Development ICRA - A1+ 6.02
• Tata Steel Ltd. ICRA - A1+ 5.17
• Reliance Retail ventures Ltd. CRISIL - A1+ 4.68
• Indian Oil Corporation Ltd. ICRA - A1+ 4.12
Adani Ports & Special economic Zone ICRA - A1+ 3.76
The Tata Power Company Ltd. CRISIL - A1+ 2.82
Steel Authority of India Ltd. CARE - A1+ 2.58
L&T Finance Ltd. CRISIL - A1+ 2.19
Muthoot Finance Ltd. CRISIL - A1+ 1.97
IIFL Facilities Services Ltd. CRISIL - A1+ 1.42
Reliance Jio Infocomm Ltd. CRISIL - A1+ 1.42
Company Rating % to NAV
UltraTech Cement Ltd. CRISIL - A1+ 1.18
Birla Group Holdings Pvt. Ltd. CRISIL - A1+ 1.14
Chennai Petroleum Corporation Ltd. CRISIL - A1+ 1.09
Bharat Heavy electricals Ltd. CARE - A1+ 1.04
Hindustan Petroleum Corporation Ltd. CRISIL - A1+ 0.95
NTPC Ltd. CRISIL - A1+ 0.94
Bharat Oman Refineries Ltd. CRISIL - A1+ 0.85
UPL Ltd. CRISIL - A1+ 0.85
Kotak Securities Ltd. CRISIL - A1+ 0.84
Hindalco Industries Ltd. CRISIL - A1+ 0.76
JM Financial Products Ltd. CRISIL - A1+ 0.73
GIC Housing Finance Ltd. CRISIL - A1+ 0.57
Mangalore Refinery and Petrochemicals Ltd. CARE - A1+ 0.57
Tata Capital Financial Services Ltd. CRISIL - A1+ 0.57
TV18 Broadcast Ltd. CARE - A1+ 0.55
Axis Finance Ltd. CRISIL - A1+ 0.52
ICICI Securities Ltd. CRISIL - A1+ 0.52
Network 18 Media & Investments Ltd. CARE - A1+ 0.47
Julius Baer Capital (India) Pvt. Ltd. CRISIL - A1+ 0.45
JM Financial Capital Ltd. CRISIL - A1+ 0.38
SCB Inv & Loan (I) Ltd. CRISIL - A1+ 0.37
Kotak Mahindra Investments Ltd. CRISIL - A1+ 0.33
Godrej Industries Ltd. CRISIL - A1+ 0.28
Tata Motors Finance Ltd. CARE - A1+ 0.20
CanFin Homes Ltd. CARE - A1+ 0.19
Housing Development Finance Corporation Ltd.£ CRISIL - A1+ 0.19
John Deere Financial India Pvt. Ltd. CRISIL - A1+ 0.19
NLC India Ltd. CARE - A1+ 0.18
Infina Finance Pvt. Ltd. CRISIL - A1+ 0.13
H T Media Ltd. CRISIL - A1+ 0.08
Sundaram Finance Ltd. CRISIL - A1+ 0.05
Sub Total 62.11
CD
Barclays Bank ICRA - A1+ 1.04
The Federal Bank Ltd. CRISIL - A1+ 0.95
Indusind Bank Ltd. CRISIL - A1+ 0.33
Sub Total 2.32
BILLS RE-DISCOUNTING
• ICICI Bank Ltd. CRISIL - NA 3.79
Sub Total 3.79
Total 68.22
Cash, Cash equivalents and Net Current Assets -4.95
Grand Total 100.00
• Top Ten Holdings, £ Co-sponsor

60 June 2021
This product is suitable for investors who are seeking ~
l regular income over short term
l to generate income through a portfolio comprising money market and debt instruments
VeryHigh
Low to
Moderate
Low
Moderate ModeratelyHigh High
RISKOMETERInvestors understand that their principal will be at
moderate risk
~ Investors should consult their financial advisers, if in doubt about whether the product is suitable for them.
(An open ended liquid scheme) .....Contd from previous pageHDFC Liquid Fund
PERFORMANCE ^ - Regular Plan - Growth OptionDate Period Scheme
Returns (%)
Benchmark Returns
(%)#
Additional Benchmark
Returns (%) ##
Value of ` 10,000 investedScheme (`) Benchmark
(`)#Additional
Benchmark (`)##
Jun 23, 21 Last 7 days 3.42 3.73 4.17 10,007 10,007 10,008Jun 15, 21 Last 15 days 3.30 3.59 1.36 10,014 10,015 10,006May 31, 21 Last 1 Month 3.27 3.57 2.45 10,027 10,029 10,020Jun 30, 20 Last 1 Year 3.10 3.71 3.58 10,310 10,371 10,358Jun 29, 18 Last 3 Years 5.28 5.70 6.39 11,673 11,813 12,047Jun 30, 16 Last 5 Years 5.87 6.19 6.30 13,304 13,505 13,576Oct 17, 00 Since Inception 6.98 N.A. 6.34 40,489 N.A. 35,738
Returns less than 1 year period are simple annualized and greater than 1 year are compounded annualized (CAGR). N.A. Not Available. For performance of other schemes managed by Anupam Joshi, please refer page 68. Different plans viz. Regular Plan and Direct Plan have a different expense structure. The expenses of the Direct Plan under the Scheme will be lower to the extent of the distribution expenses / commission charged in the Regular Plan. For Performance of Direct Plan, refer page no. 75.
n T-Bills, G-Sec 34.14
n CP 62.11
n CD 2.32
n Credit exposure 2.59n BRDS 3.79
n Cash, Cash equivalents and Net Current Assets -4.95
Portfolio Classification by Asset Class (%)
n Sovereign 34.14n AAA/AAA(SO)/A1+/A1+(SO) &
equivalent 67.02
n BRDS 3.79
n Cash, Cash equivalents and Net Current Assets -4.95
Portfolio Classification by Rating Class (%)
SIP PERFORMANCE ^ - Regular Plan - Growth Option
Since Inception SIP
15 year SIP 10 year SIP 5 Year SIP 3 Year SIP 1 Year SIP
Total Amount Invested (` ‘000) 2,490.00 1,800.00 1,200.00 600.00 360.00 120.00
Mkt Value As on June 30, 2021 (` ‘000) 5,459.03 3,132.48 1,679.79 684.57 384.63 121.99
Returns (%) 6.99 7.01 6.55 5.22 4.35 3.10
Benchmark Returns (%) # N.A. 7.03 6.75 5.63 4.83 3.64
Additional Benchmark Returns (%) ## 6.28 6.52 6.63 5.99 5.50 3.57
Assuming ̀ 10,000 invested systematically on the first Business Day of every month over a period of time. CAGR returns are computed after accounting for the cash flow by using xIRR method (investment internal rate of return) for Regular Plan - Growth Option. The above investment simulation is for illustrative purposes only and should not be construed as a promise on minimum returns and safeguard of capital. SIP facility in the Scheme has been made available from November 12, 2020.
^Past performance may or may not be sustained in the future. Since Inception Date = Date of First allotment in the Scheme / Plan. Load is not taken into consideration for computation of performance.
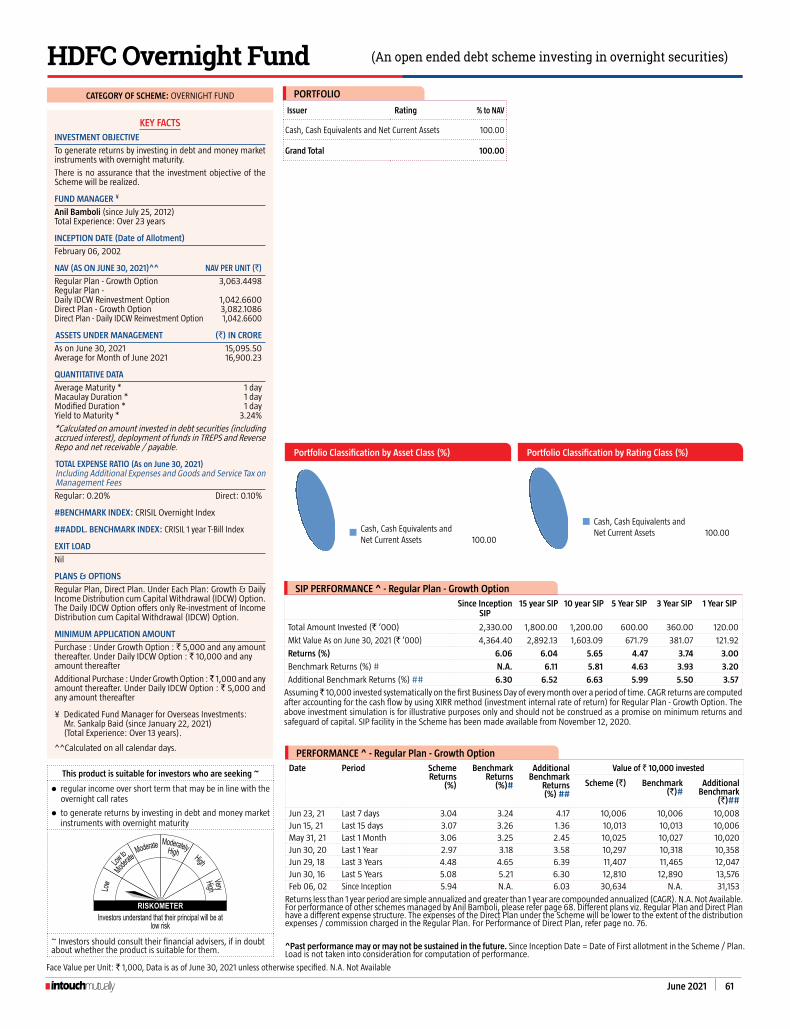
June 2021 61
CATEGORY OF SCHEME: OVERNIGHT FUND
KEY FACTSINVESTMENT OBJECTIVE
To generate returns by investing in debt and money market instruments with overnight maturity.
There is no assurance that the investment objective of the Scheme will be realized.
FUND MANAGER ¥
Anil Bamboli (since July 25, 2012)
Total Experience: Over 23 years
INCEPTION DATE (Date of Allotment)
February 06, 2002
NAV (AS ON JUNE 30, 2021)^^ NAV PER UNIT (`)
Regular Plan - Growth Option 3,063.4498Regular Plan - Daily IDCW Reinvestment Option 1,042.6600Direct Plan - Growth Option 3,082.1086Direct Plan - Daily IDCW Reinvestment Option 1,042.6600
ASSETS UNDER MANAGEMENT (`) IN CRORE
As on June 30, 2021 15,095.50Average for Month of June 2021 16,900.23
qUANTITATIVE DATA
Average Maturity * 1 dayMacaulay Duration * 1 dayModified Duration * 1 dayYield to Maturity * 3.24%
*Calculated on amount invested in debt securities (including accrued interest), deployment of funds in TRePS and Reverse Repo and net receivable / payable.
TOTAL ExPENSE RATIO (As on June 30, 2021)Including Additional expenses and Goods and Service Tax on Management Fees
Regular: 0.20% Direct: 0.10%
#BENCHMARK INDEx: CRISIL Overnight Index
##ADDL. BENCHMARK INDEx: CRISIL 1 year T-Bill Index
ExIT LOAD
Nil
PLANS & OPTIONS
Regular Plan, Direct Plan. Under Each Plan: Growth & Daily Income Distribution cum Capital Withdrawal (IDCW) Option. The Daily IDCW Option offers only Re-investment of Income Distribution cum Capital Withdrawal (IDCW) Option.
MINIMUM APPLICATION AMOUNT
Purchase : Under Growth Option : ` 5,000 and any amount thereafter. Under Daily IDCW Option : ` 10,000 and any amount thereafter
Additional Purchase : Under Growth Option : ̀ 1,000 and any amount thereafter. Under Daily IDCW Option : ` 5,000 and any amount thereafter
¥ Dedicated Fund Manager for Overseas Investments: Mr. Sankalp Baid (since January 22, 2021) (Total Experience: Over 13 years).
^^Calculated on all calendar days.
Face Value per Unit: ` 1,000, Data is as of June 30, 2021 unless otherwise specified. N.A. Not Available
PERFORMANCE ^ - Regular Plan - Growth Option
Date Period Scheme Returns
(%)
Benchmark Returns
(%)#
Additional Benchmark
Returns (%) ##
Value of ` 10,000 invested
Scheme (`) Benchmark (`)#
Additional Benchmark
(`)##
Jun 23, 21 Last 7 days 3.04 3.24 4.17 10,006 10,006 10,008Jun 15, 21 Last 15 days 3.07 3.26 1.36 10,013 10,013 10,006May 31, 21 Last 1 Month 3.06 3.25 2.45 10,025 10,027 10,020Jun 30, 20 Last 1 Year 2.97 3.18 3.58 10,297 10,318 10,358Jun 29, 18 Last 3 Years 4.48 4.65 6.39 11,407 11,465 12,047Jun 30, 16 Last 5 Years 5.08 5.21 6.30 12,810 12,890 13,576Feb 06, 02 Since Inception 5.94 N.A. 6.03 30,634 N.A. 31,153
Returns less than 1 year period are simple annualized and greater than 1 year are compounded annualized (CAGR). N.A. Not Available. For performance of other schemes managed by Anil Bamboli, please refer page 68. Different plans viz. Regular Plan and Direct Plan have a different expense structure. The expenses of the Direct Plan under the Scheme will be lower to the extent of the distribution expenses / commission charged in the Regular Plan. For Performance of Direct Plan, refer page no. 76.
Cash, Cash equivalents and Net Current Assets 100.00
Portfolio Classification by Asset Class (%)
Cash, Cash equivalents and Net Current Assets 100.00
Portfolio Classification by Rating Class (%)
This product is suitable for investors who are seeking ~
l regular income over short term that may be in line with the overnight call rates
l to generate returns by investing in debt and money market instruments with overnight maturity
VeryHigh
Low to
Moderate
Low
Moderate ModeratelyHigh High
RISKOMETERInvestors understand that their principal will be at
low risk
~ Investors should consult their financial advisers, if in doubt about whether the product is suitable for them. ^Past performance may or may not be sustained in the future. Since Inception Date = Date of First allotment in the Scheme / Plan.
Load is not taken into consideration for computation of performance.
(An open ended debt scheme investing in overnight securities)HDFC Overnight Fund
Issuer Rating % to NAV
Cash, Cash equivalents and Net Current Assets 100.00
Grand Total 100.00
PORTFOLIO
SIP PERFORMANCE ^ - Regular Plan - Growth Option
Since Inception SIP
15 year SIP 10 year SIP 5 Year SIP 3 Year SIP 1 Year SIP
Total Amount Invested (` ‘000) 2,330.00 1,800.00 1,200.00 600.00 360.00 120.00
Mkt Value As on June 30, 2021 (` ‘000) 4,364.40 2,892.13 1,603.09 671.79 381.07 121.92
Returns (%) 6.06 6.04 5.65 4.47 3.74 3.00
Benchmark Returns (%) # N.A. 6.11 5.81 4.63 3.93 3.20
Additional Benchmark Returns (%) ## 6.30 6.52 6.63 5.99 5.50 3.57
Assuming ̀ 10,000 invested systematically on the first Business Day of every month over a period of time. CAGR returns are computed after accounting for the cash flow by using xIRR method (investment internal rate of return) for Regular Plan - Growth Option. The above investment simulation is for illustrative purposes only and should not be construed as a promise on minimum returns and safeguard of capital. SIP facility in the Scheme has been made available from November 12, 2020.

62 June 2021
KEY FACTS
INVESTMENT OBJECTIVE
The investment objective of the Scheme is to generate returns that are in line with the performance of gold, subject to tracking errors.
There is no assurance that the investment objective of the Scheme will be realized.
Exchange Listed
BSe/NSe
Exchange Symbol/Scrip Code
BSE/NSE: HDFCMFGETF | 533230
ISIN
INF179K01CN1
Creation Unit Size
1,20,000 units of HDFC Gold ETF
FUND MANAGER
Krishan Kumar Daga (since October 19, 2015)
Total Experience: Over 23 years
INCEPTION DATE (Date of Allotment)
August 13, 2010
NAV (AS ON JUNE 30, 2021) NAV PER UNIT (`)
HDFC Gold ETF 41.7397
ASSETS UNDER MANAGEMENT (`) IN CRORE
As on June 30, 2021 2,527.16Average for Month of June 2021 2,553.46
TRACKING ERROR
Annualised tracking error is calculated based on daily rolling returns for the last 12 months: 0.25%
TOTAL ExPENSE RATIO (As on June 30, 2021)Including Additional expenses and Goods and Service Tax on Management Fees
HDFC GOLD ETF 0.60%
#BENCHMARK INDEx: Domestic Price of Physical Gold
ExIT LOAD
For Creation Unit Size:l No exit load will be levied on redemptions made by
Authorised Participants / Large Investors directly with the Fund in Creation Unit Size.
For other than Creation Unit Size:l N.A. The Units of HGETF in other than Creation Unit Size cannot
be directly redeemed with the Fund. These Units can be redeemed (sold) on a continuous basis on
the NSe and BSe during the trading hours on all trading days. Refer SID for further details.
For further details, please refer to para ‘Exit Load’ on Pg 68.
PLANS & OPTIONS
Currently, there are no investment Plans/Options being offered under the Scheme.
MINIMUM APPLICATION AMOUNT
Authorised Participants: Application for subscription of HGETF Units directly with the Fund in Creation Unit Size at NAV based prices in exchange of Portfolio Deposit and Cash Component.
Large Investors: Application for subscription of HGETF Units directly with the Fund in Creation Unit Size at NAV based prices by payment of requisite Cash as determined by the AMC only by means of payment instruction of Real Time Gross Settlement (RTGS) / National Electronic Funds Transfer (NEFT) or Funds Transfer Letter / Transfer Cheque of a bank where the Scheme has a collection account.
Other investors (including Authorised Participants and Large Investors): Units of HGETF can be subscribed (in lots of 1 Unit) during the trading hours on all trading days on the NSe and BSE on which the Units are listed.
CATEGORY OF SCHEME: ExCHANGE TRADED FUND
This product is suitable for investors who are seeking ~
l returns that are commensurate with the performance of gold, subject to tracking errors, over long term
l investment predominantly in Gold bullion of 0.995 fineness
VeryHigh
Low to
Moderate
Low
Moderate ModeratelyHigh High
RISKOMETERInvestors understand that their principal will be at
moderately high risk
~ Investors should consult their financial advisers, if in doubt about whether the product is suitable for them.
Issuer Rating % to NAV
GOLD
Physical Gold (99.5% Purity) 97.77
Cash, Cash equivalents and Net Current Assets 2.23
Grand Total 100.00
PORTFOLIO
(An open ended scheme replicating / tracking performance of Gold)HDFC Gold Exchange Traded Fund
The Face Value per Unit is revised to ` 1 (earlier ` 100) and Allotment Price per unit is ` 18.0033 (earlier ` 1,800.3288) w.e.f. February 19, 2021. All return computations have been suitably adjusted for this change. Since inception returns are computed on the allotment price. Data is as of June 30, 2021 unless otherwise specified.
^Past performance may or may not be sustained in the future. Since Inception Date = Date of First allotment in the Scheme / Plan. Load is not taken into consideration for computation of performance.
PERFORMANCE * ^
Date Period Scheme Returns (%)
Benchmark Returns (%)#
Value of ` 10,000 invested
Scheme (`) Benchmark (`)#
Jun 30, 20 Last 1 Year -4.22 -3.74 9,578 9,626Jun 29, 18 Last 3 Years 14.31 15.40 14,947 15,382Jun 30, 16 Last 5 Years 7.05 8.13 14,063 14,782Aug 13, 10 Since Inception 8.03 8.89 23,184 25,284
Returns less than 1 year period are simple annualized and greater than 1 year are compounded annualized (CAGR). * The Scheme does not offer any Plans/Options. For performance of other schemes managed by Krishan Kumar Daga, please refer page 68.
HDFC Gold ETF
n Gold 97.77
n Cash, Cash equivalents and Net Current Assets 2.23
Portfolio Classification by Asset Class (%) HDFC Gold ETF
n Gold 97.77
n Cash, Cash equivalents and Net Current Assets 2.23
Portfolio Classification by Rating Class (%)

June 2021 63
SIP PERFORMANCE ^ - Regular Plan - Growth Option
Since Inception SIP
5 Year SIP
3 Year SIP
1 Year SIP
Total Amount Invested (` ‘000) 1,160.00 600.00 360.00 120.00 Mkt Value As on June 30, 2021 (` ‘000) 1,623.20 784.87 425.93 113.51 Returns (%) 6.77 10.70 11.25 -9.93 Benchmark Returns (%) # 8.23 11.96 12.39 -8.68 Additional Benchmark Returns (%) ## N.A. N.A. N.A. N.A.
Assuming ` 10,000 invested systematically on the first Business Day of every month over a period of time. CAGR returns are computed after accounting for the cash flow by using xIRR method (investment internal rate of return) for Regular Plan - Growth Option. The above investment simulation is for illustrative purposes only and should not be construed as a promise on minimum returns and safeguard of capital.
CATEGORY OF SCHEME: FUND OF FUND (DOMESTIC)
KEY FACTS
INVESTMENT OBJECTIVE
To seek capital appreciation by investing in units of HDFC Gold Exchange Traded Fund (HGETF).
There is no assurance that the investment objective of the Scheme will be realized.
FUND MANAGER
Krishan Kumar Daga (since October 19, 2015)
Total Experience: Over 23 years
INCEPTION DATE (Date of Allotment)
November 01, 2011
NAV (AS ON JUNE 30, 2021) NAV PER UNIT (`)
Regular Plan - Growth Option 14.8025Direct Plan - Growth Option 15.2941
ASSETS UNDER MANAGEMENT (`) IN CRORE
As on June 30, 2021 1,194.30Average for Month of June 2021 1,217.91
TOTAL ExPENSE RATIO (As on June 30, 2021)No Investment Management and Advisory Fees will be charged to the Scheme
Regular: 0.50% Direct: 0.15%
#BENCHMARK INDEx: Domestic Price of Physical Gold
ExIT LOAD
In respect of each purchase/switch-in of units-l An Exit Load of 2% is payable if Units are redeemed/
switched-out within 6 months from the date of allotment.l An Exit Load of 1% is payable if Units are redeemed/
switched-out after 6 months but within 1 year from the date of allotment.
l No Exit Load is payable if Units are redeemed/switched-out after 1 year from the date of allotment.
For further details, please refer to para ‘Exit Load’ on Pg 68.
PLANS & OPTIONS
Regular Plan, Direct Plan. Each Plan offers Growth Option only.
MINIMUM APPLICATION AMOUNT
Purchase: Under Growth Option : ` 5,000 and any amount thereafter.
Additional Purchase : Under Growth Option : ` 1,000 and any amount thereafter.
Face Value per Unit: ` 10, Data is as of June 30, 2021 unless otherwise specified. N.A. Not Available
This product is suitable for investors who are seeking ~
l capital appreciation over long term
l investment in Units of HDFC Gold Exchange Traded Fund (HGETF). HGETF invests in gold bullion of 0.995 fineness
VeryHigh
Low to
Moderate
Low
Moderate ModeratelyHigh High
RISKOMETERInvestors understand that their principal will be at
moderately high risk
~ Investors should consult their financial advisers, if in doubt about whether the product is suitable for them.
(An open ended Fund of Fund scheme investing in HDFC Gold Exchange Traded Fund)HDFC Gold Fund
^Past performance may or may not be sustained in the future. Since Inception Date = Date of First allotment in the Scheme / Plan. Load is not taken into consideration for computation of performance.
Issuer Rating % to NAV
MUTUAL FUND UNITS
MUTUAL FUND UNITS
HDFC Gold Exchange Traded Fund 99.93
Cash, Cash equivalents and Net Current Assets 0.07
Grand Total 100.00
PORTFOLIO
PERFORMANCE ^ - Regular Plan - Growth Option
Date Period Scheme Returns (%)
Benchmark Returns (%)#
Value of ` 10,000 invested
Scheme (`) Benchmark (`)#
Jun 30, 20 Last 1 Year -5.03 -3.74 9,497 9,626Jun 29, 18 Last 3 Years 14.02 15.40 14,832 15,382Jun 30, 16 Last 5 Years 7.51 8.13 14,364 14,782Nov 01, 11 Since Inception 4.14 5.79 14,803 17,229
Returns less than 1 year period are simple annualized and greater than 1 year are compounded annualized (CAGR). N.A. Not Available. The investors will bear dual expenses i.e. the expenses charged, under the Scheme and underlying scheme (HDFC Gold Exchange Traded Fund) within the permissible limits. For performance of other schemes managed by Krishan Kumar Daga, please refer page 68. Different plans viz. Regular Plan and Direct Plan have a different expense structure. The expenses of the Direct Plan under the Scheme will be lower to the extent of the distribution expenses / commission charged in the Regular Plan. For Performance of Direct Plan, refer page no. 79.
HDFC Gold Fund
n Mutual Fund Units 99.93
n Cash, Cash equivalents and Net Current Assets 0.07
Portfolio Classification by Asset Class (%) HDFC Gold Fund
Cash, Cash equivalents and Net Current Assets 100.00
Portfolio Classification by Rating Class (%)

64 June 2021
Face Value per Unit: ` 223.31, + Industry Classification as recommended by AMFI, Data is as of June 30, 2021 unless otherwise specified. N.A. Not Available
KEY FACTS
INVESTMENT OBJECTIVE
The investment objective of the Scheme is to provide investment returns that, before expenses, closely correspond to the total returns of the Securities as represented by the NIFTY Bank Index, subject to tracking errors.
There is no assurance that the investment objective of the Scheme will be realized.
Exchange Listed
BSe/NSe
Exchange Symbol/Scrip Code
BSE/NSE: HBANKETF | 543224
ISIN
INF179KC1AN8
Creation Unit Size
12,500 units of HDFC Banking ETF
FUND MANAGER
Krishan Kumar Daga (since August 21, 2020)
Total Experience: Over 23 years
Arun Agarwal (since August 24, 2020)
Total Experience: Over 22 years
INCEPTION DATE (Date of Allotment)
August 21, 2020
NAV (AS ON JUNE 30, 2021) NAV PER UNIT (`)
HDFC Banking ETF 347.89
ASSETS UNDER MANAGEMENT (`) IN CRORE
As on June 30, 2021 150.11Average for Month of June 2021 156.87
TOTAL ExPENSE RATIO (As on June 30, 2021)Including Additional expenses and Goods and Service Tax on Management Fees
HDFC BANKING ETF 0.15%
#BENCHMARK INDEx: NIFTY Bank (Total Returns Index)
##ADDL. BENCHMARK INDEx: NIFTY 50 (Total Returns Index)
ExIT LOAD
For Creation Unit Size:l No exit load will be levied on redemptions made by
Authorised Participants / Large Investors directly with the Fund in Creation Unit Size.
For other than Creation Unit Size:l N.A. The Units of the ETF in other than Creation Unit Size cannot
ordinarily be directly redeemed with the Fund. These Units can be redeemed (sold) on a continuous basis
on the exchange(s) where it is listed during the trading hours on all trading days.
Refer SID for further details.
For further details, please refer to para ‘Exit Load’ on Pg 68.
PLANS & OPTIONS
Currently, there are no investment Plans/Options being offered under the Scheme.
MINIMUM APPLICATION AMOUNT
Authorised Participants / Large Investors: Application for subscription of the ETF Units in Creation Unit Size can be made either:
l in exchange of Cash* [as determined by the AMC equivalent to the cost incurred towards the purchase of predefined basket of securities that represent the underlying index (i.e. Portfolio Deposit)], Cash Component and other applicable transaction charges; or
l in exchange of Portfolio Deposit [i.e. by depositing basket of securities constituting NIFTY Bank Index] along with the cash component and applicable transaction charges.
Each Creation Unit Size will consist of 12,500 Units of the ETF and 1 Unit of the ETF will be approximately equal to 1/100th of the value of NIFTY Bank Index.
*Cash means payments shall be made only by means of payment instruction of Real Time Gross Settlement (RTGS) / National Electronic Funds Transfer (NEFT) or Funds Transfer Letter / Transfer Cheque of a bank where the Scheme has a collection account.
Redemption of Units of the ETF in Creation Unit Size will be allowed by means of exchange of Portfolio Deposit or in Cash.
Other investors (including Authorised Participants and Large Investors): Units of the ETF can be subscribed (in lots of 1 Unit) during the trading hours on all trading days on the NSe and/ or BSE on which the Units will be listed.
CATEGORY OF SCHEME: ExCHANGE TRADED FUND
This product is suitable for investors who are seeking ~
l returns that are commensurate with the performance of the NIFTY Bank Index (Total Returns Index), subject to tracking error, over long term
l investment in equity securities covered by the NIFTY Bank Index
VeryHigh
Low to
Moderate
Low
Moderate ModeratelyHigh High
RISKOMETERInvestors understand that their principal will be at
very high risk
~ Investors should consult their financial advisers, if in doubt about whether the product is suitable for them.
Issuer Industry+ % to NAV
EqUITY & EqUITY RELATED
• HDFC Bank Ltd. Banks 28.72
• ICICI Bank Ltd. Banks 21.01
• Kotak Mahindra Bank Ltd. Banks 12.04
• Axis Bank Ltd. Banks 12.03
• State Bank of India Banks 11.97
• Indusind Bank Ltd. Banks 5.34
• Au Small Finance Bank Ltd. Banks 1.98
• Bandhan Bank Ltd. Banks 1.95
• The Federal Bank Ltd. Banks 1.52
• IDFC First Bank Ltd. Banks 1.26
Punjab National Bank Banks 1.10
RBL Bank Ltd. Banks 0.86
Sub Total 99.78
Cash, Cash equivalents and Net Current Assets 0.22
Grand Total 100.00
• Top Ten Holdings
PORTFOLIO
(An open ended scheme replicating / tracking NIFTY Bank Index)HDFC Banking ETF
HDFC Banking ETF
n Banks 99.78
n Cash, Cash equivalents and Net Current Assets 0.22
Portfolio Classification by Asset Class (%)HDFC Banking ETF
n equity 99.78
n Cash, Cash equivalents and Net Current Assets 0.22
Portfolio Classification by Rating Class (%)
PERFORMANCE *^
Date Period Scheme Returns
(%)
Benchmark Returns
(%)#
Additional Benchmark
Returns (%) ##
Value of ` 10,000 invested
Scheme (`) Benchmark (`)#
Additional Benchmark
(`)##
Dec 31, 20 Last 6 Months 22.80 23.16 26.66 11,131 11,149 11,322
Simple annualized returns have been provided as per the extant guidelines since the scheme has completed 6 months but not 1 year. However, such returns may not be representative. Absolute returns of the Scheme for the 6 month period is 11.31%.
* The Scheme does not offer any Plans/Options. For performance of other schemes managed by Krishan Kumar Daga and Arun Agarwal, please refer page 68.
^Past performance may or may not be sustained in the future. Since Inception Date = Date of First allotment in the Scheme/Plan. Load is not taken into consideration for computation of performance.

June 2021 65
Face Value per Unit: ` 10 unless otherwise specified, + Industry Classification as recommended by AMFI, Data is as of June 30, 2021 unless otherwise specified.
This product is suitable for investors who are seeking ~
l capital appreciation over long term/regular income
l investment predominantly in equity and equity related Instruments of dividend yielding companies
VeryHigh
Low to
Moderate
Low
Moderate ModeratelyHigh High
RISKOMETERInvestors understand that their principal will be at
very high risk
~ Investors should consult their financial advisers, if in doubt about whether the product is suitable for them.
(An open ended equity scheme predominantly investing in dividend yielding stocks)HDFC Dividend Yield Fund
Company Industry+ % to NAV
EqUITY & EqUITY RELATED
• Infosys Ltd. Software 5.28
• Hindustan Unilever Ltd. Consumer Non Durables 4.95
• Tata Consultancy Services Ltd. Software 3.88
• ITC Ltd. Consumer Non Durables 3.48
• HCL Technologies Ltd. Software 3.17
• Tech Mahindra Ltd. Software 3.17
• ICICI Bank Ltd. Banks 3.09
• NTPC Ltd. Power 2.54
• CESC Ltd. Power 2.47
• Chambal Fertilizers & Chemicals Ltd. Fertilisers 2.19
Wipro Ltd. Software 2.07
Inox Leisure Ltd. entertainment 2.06
Coal India Ltd. Minerals/Mining 2.03
Quess Corp Ltd. Other Services 1.95
NHPC Ltd. Power 1.93
Tata Steel Ltd. Ferrous Metals 1.92
Indian Railway Catering and Tourism Corporation Ltd. Transportation 1.81
Vardhman Textiles Ltd. Textiles - Cotton 1.63
Indian Railways Finance Corporation Ltd. Finance 1.52
Tata Motors Ltd. Auto 1.51
Sun Pharmaceutical Industries Ltd. Pharmaceuticals 1.45
Balrampur Chini Mills Ltd. Consumer Non Durables 1.43
Dilip Buildcon Ltd. Construction 1.43
Ambuja Cements Ltd. Cement & Cement Products 1.37
Hindustan Petroleum Corporation Ltd. Petroleum Products 1.34
Power Finance Corporation Ltd. Finance 1.32
Tube Investments of India Ltd. Auto Ancillaries 1.30
Nestle India Ltd. Consumer Non Durables 1.26
emami Ltd. Consumer Non Durables 1.25
Bharat electronics Ltd. Aerospace & Defense 1.22
ReC Ltd. Finance 1.19
Bharti Airtel Ltd. Telecom - Services 1.17
PNC Infratech Ltd. Construction 1.15
State Bank of India Banks 1.12
SKF India Ltd. Industrial Products 1.11
Carborundum Universal Ltd. Industrial Products 1.08
UPL Ltd. Pesticides 1.06
Greenply Industries Ltd. Consumer Durables 1.05
Axis Bank Ltd. Banks 1.00
HDFC Bank Ltd. Banks 1.00
Larsen and Toubro Ltd. Construction Project 1.00
UTI Asset Management Company Ltd. Capital Markets 1.00
GHCL Ltd. Chemicals 0.97
AIA engineering Ltd. Industrial Products 0.95
Finolex Cables Ltd. Industrial Products 0.93
Cholamandalam Financial Holdings Ltd. Finance 0.88
Godrej Consumer Products Ltd. Consumer Non Durables 0.87
MM Forgings Ltd. Industrial Products 0.87
Trent Ltd. Retailing 0.85
Company Industry+ % to NAV
Oil & Natural Gas Corporation Ltd. Oil 0.84
Muthoot Finance Ltd. Finance 0.83
Max Healthcare Institute Ltd. Healthcare Services 0.80
Lupin Ltd. Pharmaceuticals 0.77
SBI Life Insurance Company Ltd. Insurance 0.72
Centum electronics Ltd. Industrial Capital Goods 0.71
Mahindra & Mahindra Ltd. Auto 0.69
Bajaj Auto Ltd. Auto 0.63
GAIL (India) Ltd. Gas 0.60
ICICI Securities Ltd. Capital Markets 0.55
Apollo Tyres Ltd. Auto Ancillaries 0.50
Mahindra Holidays & Resorts Ind Ltd. Leisure Services 0.43
RailTel Corporation of India Ltd. Telecom - Services 0.42
Sun TV Network Ltd. entertainment 0.18
Hindustan Aeronautics Ltd. Aerospace & Defense 0.09
MTAR Technologies Ltd. Aerospace & Defense 0.02Sub Total 94.05Cash, Cash equivalents and Net Current Assets 5.95
Grand Total 100.00
• Top Ten Holdings
PORTFOLIO
Industry Allocation of Equity Holding (% of Net Assets)
0.430.600.710.720.800.840.850.971.001.051.061.331.341.371.551.591.631.801.811.921.952.032.192.222.242.582.83
4.945.746.216.94
13.2417.57
0 2 4 6 8 101214161820Leisure Services
GasIndustrial Capital Goods
InsuranceHealthcare Services
OilRetailing
ChemicalsConstruction ProjectConsumer Durables
PesticidesAerospace & Defense
Petroleum ProductsCement & Cement Products
Capital MarketsTelecom - Services
Textiles - CottonAuto AncillariesTransportationFerrous MetalsOther Services
Minerals/MiningFertilisers
PharmaceuticalsEntertainment
ConstructionAuto
Industrial ProductsFinance
BanksPower
Consumer Non DurablesSoftware
KEY FACTS
INVESTMENT OBJECTIVE
To provide capital appreciation and/or dividend distribution by predominantly investing in a well-diversified portfolio of equity and equity related instruments of dividend yielding companies.
There is no assurance that the investment objective of the Scheme will be realized.
FUND MANAGER § ¥
Gopal Agrawal (since December 18, 2020)
Total Experience: Over 16 years
INCEPTION DATE (Date of Allotment)
December 18, 2020
NAV (AS ON JUNE 30, 2021) NAV PER UNIT (`)
Regular Plan - Growth Option 12.266Regular Plan - IDCW Option 12.266Direct Plan - Growth Option 12.376Direct Plan - IDCW Option 12.376
ASSETS UNDER MANAGEMENT (`) IN CRORE
As on June 30, 2021 2,244.77Average for Month of June 2021 2,212.21
TOTAL ExPENSE RATIO (As on June 30, 2021)Including Additional expenses and Goods and Service Tax on Management Fees
Regular: 1.87% Direct: 0.37%
#BENCHMARK INDEx: NIFTY Dividend Opportunities 50 (Total Returns Index)
##ADDL. BENCHMARK INDEx: NIFTY 50 (Total Returns Index)
ExIT LOAD
l In respect of each purchase / switch-in of Units, an Exit Load of 1.00% is payable if Units are redeemed / switched-out within 1 year from the date of allotment.
l No Exit Load is payable if Units are redeemed / switched-out after 1 year from the date of allotment.
For further details, please refer to para ‘Exit Load’ on Pg 68.
PLANS & OPTIONS
Regular Plan, Direct Plan. Under Each Plan: Growth & Income Distribution cum Capital Withdrawal (IDCW) Option. The IDCW Option offers following Sub-Options: Payout of Income Distribution cum Capital Withdrawal (IDCW) Option; and Re-investment of Income Distribution cum Capital Withdrawal (IDCW) Option.
MINIMUM APPLICATION AMOUNT
Purchase : ` 5,000 and any amount thereafter.Additional Purchase : ` 1,000 and any amount thereafter.
¥ Dedicated Fund Manager for Overseas Investments: Mr. Sankalp Baid (since January 22, 2021) (Total Experience: Over 13 years).
CATEGORY OF SCHEME: DIVIDEND YIELD FUND

66 June 2021
Face Value per Unit: ` 10 unless otherwise specified, + Industry Classification as recommended by AMFI, Data is as of June 30, 2021 unless otherwise specified.
Company Industry+ % to NAVEqUITY & EqUITY RELATED• Larsen and Toubro Ltd. Construction Project 9.06• HDFC Bank Ltd. Banks 8.99• Housing Development
Finance Corporation Ltd.£ Finance 7.85• State Bank of India Banks 7.71• ICICI Bank Ltd. Banks 7.69• NTPC Ltd. Power 7.37• Axis Bank Ltd. Banks 6.18• Ambuja Cements Ltd. Cement & Cement
Products 6.03• Ashoka Buildcon Ltd. Construction 3.46• Sagar Cements Ltd. Cement & Cement
Products 2.94Tata Steel Ltd. Ferrous Metals 2.89Prestige estates Projects Ltd. Construction 1.99Orient Cement Ltd. Cement & Cement
Products 1.91Bharat Petroleum Corporation Ltd. Petroleum Products 1.80JMC Projects (India) Ltd. Construction 1.69AkzoNobel India Ltd. Consumer Non Durables 1.62Dilip Buildcon Ltd. Construction 1.60Asian Paints Ltd. Consumer Non Durables 1.42GAIL (India) Ltd. Gas 1.41Bharat Dynamics Ltd. Aerospace & Defense 1.36Indian Railways Finance Corporation Ltd. Finance 1.33Crompton Greaves Consumer electricals Ltd. Consumer Durables 1.18Birla Corporation Ltd. Cement & Cement
Products 1.11Power Grid Corporation of India Ltd. Power 0.89RBL Bank Ltd. Banks 0.89Finolex Cables Ltd. Industrial Products 0.88Macrotech Developers Ltd. Construction 0.85Ge Power India Ltd. Industrial Capital Goods 0.72Hindalco Industries Ltd. Non - Ferrous Metals 0.71PNC Infratech Ltd. Construction 0.69Petronet LNG Ltd. Gas 0.67Bank of Baroda Banks 0.57NCL Industries Ltd. Cement & Cement
Products 0.57Repco Home Finance Ltd. Finance 0.55SBI Cards and Payment Services Ltd. Finance 0.45Johnson Controls Hitachi Air Conditioning India Ltd. Consumer Durables 0.36Prism Johnson Ltd. Cement & Cement
Products 0.28Sub Total 97.67UNITS ISSUED BY REIT & INVITUNITS ISSUED BY INVITPOWeRGRID Infrastructure Investment Trust Power 0.30Sub Total 0.30UNITS ISSUED BY REITBrookfield India Real estate Trust Construction 1.21Sub Total 1.21Total 1.51Cash, Cash equivalents and Net Current Assets 0.82Grand Total 100.00• Top Ten Holdings, £ Co-sponsor
PORTFOLIOIndustry Allocation of Equity Holding (% of Net Assets)
0.30
0.71
0.72
0.88
1.21
1.36
1.54
1.80
2.08
2.89
3.04
8.26
9.06
10.18
10.28
12.84
32.03
0 5 10 15 20 25 30 35
Units issued by InvIT
Non - Ferrous Metals
Industrial Capital Goods
Industrial Products
Units issued by ReIT
Aerospace & Defense
Consumer Durables
Petroleum Products
Gas
Ferrous Metals
Consumer Non Durables
Power
Construction Project
Finance
Construction
Cement & Cement Products
BanksKEY FACTS
INVESTMENT OBJECTIVE
To provide long-term capital appreciation by investing predominantly in equity and equity related instruments of entities engaged in and/or expected to benefit from the growth in housing and its allied business activities.There is no assurance that the investment objective of the Scheme will be realized.
FUND MANAGER § ¥
Rakesh Vyas (since June 01, 2019)
Total Experience: Over 17 years
INCEPTION DATE (Date of Allotment)
December 6, 2017
NAV (AS ON JUNE 30, 2021) NAV PER UNIT (`)
Regular Plan - Growth Option 11.714Regular Plan - IDCW Option 11.714Direct Plan - Growth Option 12.160Direct Plan - IDCW Option 12.160
ASSETS UNDER MANAGEMENT (`) IN CRORE
As on June 30, 2021 1,691.08Average for Month of June 2021 1,759.85
qUANTITATIVE DATA
Portfolio Turnover Ratio (Last 1 year) 9.45%
Risk Ration Standard Deviation 7.448%n Beta 1.076n Sharpe Ratio* 0.109
Computed for the 3-yr period ended June 30, 2021. Based on month-end NAV. * Risk free rate: 3.36%(Source: FIMMDA MIBOR)
TOTAL ExPENSE RATIO (As on June 30, 2021)Including Additional expenses and Goods and Service Tax on Management Fees
Regular: 2.16% Direct: 1.21%
#BENCHMARK INDEx: India Housing & Allied Businesses Index (Total Returns Index)##ADDL. BENCHMARK INDEx: NIFTY 50 (Total Returns Index)
ExIT LOAD
Applicable only for units allotted after conversion of scheme into open-ended scheme i.e. on or after January 19, 2021:
In respect of each purchase / switch-in of Units, upto 15% of the units may be redeemed without any exit load from the date of allotment.
l Any redemption in excess of the above limit shall be subject to the following exit load: - Exit load of 1.00% is payable if Units are redeemed / switched-out within 1 year from the date of allotment of units.
l No Exit Load is payable if Units are redeemed / switched-out after 1 year from the date of allotment. No entry / exit Load shall be levied on bonus units and units allotted on IDCW reinvestment.
Note: To clarify, Unitholders who acquired units on or before January 18, 2021, will not be charged exit load in respect of those units.
For further details, please refer to para ‘Exit Load’ on Pg 68.
PLANS & OPTIONS
Regular Plan, Direct Plan. Under Each Plan: Growth & Income Distribution cum Capital Withdrawal (IDCW) Option. The IDCW Option offers following Sub-Options: Payout of Income Distribution cum Capital Withdrawal (IDCW) Option; and Re-investment of Income Distribution cum Capital Withdrawal (IDCW) Option.
MINIMUM APPLICATION AMOUNT
Purchase : ` 5,000 and any amount thereafter*.Additional Purchase : ` 1,000 and any amount thereafter.*applicable if investing for the first time in a folio in the Scheme.
¥ Dedicated Fund Manager for Overseas Investments: Mr. Sankalp Baid (since January 22, 2021) (Total Experience: Over 13 years).
CATEGORY OF SCHEME: THEMATIC FUND
The date of inception/allotment of HDFC Housing opportunities Fund is December 6, 2017. The Scheme was launched as a close ended thematic Equity Scheme. The Scheme has been converted into open-ended scheme on January 19, 2021.
PERFORMANCE ^ - Regular Plan - Growth OptionDate Period Scheme
Returns (%)
Benchmark Returns
(%)#
Additional Benchmark
Returns (%) ##
Value of ` 10,000 investedScheme (`) Benchmark
(`)#Additional
Benchmark (`)##
Jun 30, 20 Last 1 Year 61.55 79.61 54.58 16,155 17,961 15,458Jun 29, 18 Last 3 Years 9.04 17.67 15.00 12,971 16,308 15,220Dec 06, 17 Since Inception 4.53 15.02 14.82 11,714 16,475 16,370
Returns greater than 1 year period are compounded annualized (CAGR). N.A. Not Available. For performance of other schemes managed by Rakesh Vyas, please refer page 68. Different plans viz. Regular Plan and Direct Plan have a different expense structure. The expenses of the Direct Plan under the Scheme will be lower to the extent of the distribution expenses / commission charged in the Regular Plan. For Performance of Direct Plan, refer page no. 78.
^Past performance may or may not be sustained in the future. Since Inception Date = Date of First allotment in the Scheme / Plan. Load is not taken into consideration for computation of performance.
This product is suitable for investors who are seeking ~
l capital appreciation over long term/regular incomel investment predominantly in equity and equity related
instruments of entities engaged in and/ or expected to benefit from the growth in housing and its allied business activities
VeryHigh
Low to
Moderate
Low
Moderate ModeratelyHigh High
RISKOMETERInvestors understand that their principal will be at
very high risk
~ Investors should consult their financial advisers, if in doubt about whether the product is suitable for them.
(An open ended equity scheme following housing and allied activities theme)HDFC Housing Opportunities Fund

June 2021 67
Face Value per Unit: ` 10 unless otherwise specified, Data is as of June 30, 2021 unless otherwise specified.
(An open ended Fund of Funds scheme investing in equity oriented, debt oriented and gold ETFs schemes)
This product is suitable for investors who are seeking ~
l capital appreciation over long term
l investment predominantly in equity oriented, debt oriented and Gold ETF schemes
VeryHighLow
to
Moderate
Low
Moderate ModeratelyHigh High
RISKOMETERInvestors understand that their principal will be at
high risk
~ Investors should consult their financial advisers, if in doubt about whether the product is suitable for them.
KEY FACTS
INVESTMENT OBJECTIVE
To seek capital appreciation by managing the asset allocation between equity oriented, debt oriented and gold ETF schemes.
There is no assurance that the investment objective of the Scheme will be realized.
FUND MANAGER
Amit Ganatra (equity) (since May 05, 2021)
Total Experience: Over 16 years
Krishan Kumar Daga (Gold) (since May 05, 2021)
Total Experience: Over 22 years
Anil Bamboli (Debt) (since May 05, 2021)
Total Experience: Over 23 years
INCEPTION DATE (Date of Allotment)
May 05, 2021
NAV (AS ON JUNE 30, 2021) NAV PER UNIT (`)
Regular Plan - Growth Option 10.60Regular Plan - IDCW Option 10.60Direct Plan - Growth Option 10.63Direct Plan - IDCW Option 10.63
ASSETS UNDER MANAGEMENT (`) IN CRORE
As on June 30, 2021 1,436.26Average for Month of June 2021 1,358.45
TOTAL ExPENSE RATIO (As on June 30, 2021)Including Additional expenses and Goods and Service Tax on Management Fees
Regular: 1.30% Direct: 0.10%
#BENCHMARK INDEx: 90% NIFTY 50 Hybrid Composite Debt 65:35 Index (Total Returns Index) and 10% Domestic Prices of Gold arrived at based on London Bullion Market Association's (LBMA) AM Fixing Price.
##ADDL. BENCHMARK INDEx: NIFTY 50 (Total Returns Index)
ExIT LOAD
In respect of each purchase / switch-in of Units, upto 15% of the units may be redeemed without any exit load from the date of allotment.
Any redemption in excess of the above limit shall be subject to the following exit load:
lIn respect of each purchase / switch-in of Units, an Exit Load of 1.00% is payable if Units are redeemed / switched-out within 1 year from the date of allotment.
l No Exit Load is payable if Units are redeemed / switched-out after 1 year from the date of allotment.
For further details, please refer to para ‘Exit Load’ on Pg 68.
PLANS & OPTIONS
Regular Plan, Direct Plan. Under Each Plan: Growth & Income Distribution cum Capital Withdrawal (IDCW) Option. The IDCW Option offers following Sub-Options: Payout of Income Distribution cum Capital Withdrawal (IDCW) Option; and Re-investment of Income Distribution cum Capital Withdrawal (IDCW) Option.
MINIMUM APPLICATION AMOUNT
Purchase : ` 5,000 and any amount thereafter.Additional Purchase : ` 1,000 and any amount thereafter.
CATEGORY OF SCHEME: FUND OF FUNDS
HDFC Asset Allocator Fund of Funds
Issuer % to NAV
MUTUAL FUND UNITS
MUTUAL FUND UNITS - DEBT
• HDFC Short Term Debt Fund - Growth Option - Direct Plan 23.11
• HDFC Credit Risk Debt Fund - Growth Option - Direct Plan 4.94
HDFC Overnight Fund - Direct Plan - Growth Option 1.05
Sub Total 29.10
MUTUAL FUND UNITS - EqUITY
• HDFC Small Cap Fund - Direct Plan - Growth Option 10.55
• HDFC Top 100 Fund - Direct Plan - Growth Option 10.15
• HDFC Mid-Cap Opportunities Fund - Direct Plan - Growth Option 9.86
• HDFC Flexi Cap Fund - Direct Plan - Growth Option 9.75
• HDFC Dividend Yield Fund - Direct Plan - Growth Option 5.08
• HDFC Capital Builder Value Fund - Direct Plan - Growth Option 4.65
• HDFC Large and Mid Cap Fund - Direct Plan- Growth Option 3.09
Sub Total 53.13
MUTUAL FUND UNITS - GOLD
• HDFC Gold Exchange Traded Fund 10.25
Sub Total 10.25
Total 92.48
Cash, Cash equivalents and Net Current Assets 7.52
Grand Total 100.00
• Top Ten Holdings
PORTFOLIO

68 June 2021
Performance details of Schemes managed by respective Fund Managers
Sr. No. Name of the Fund Manager Funds Managed Page no.1 Mr. Prashant Jain HDFC Flexi Cap Fund 8
HDFC Top 100 Fund 10HDFC Balanced Advantage Fund 16-17HDFC Hybrid Debt Fund (Co-managed scheme) 35-36Permitted Category FPI Portfolio 80
2 Mr. Chirag Setalvad HDFC Mid-Cap Opportunities Fund 11HDFC Small Cap Fund 12HDFC Long Term Advantage Fund 68HDFC Hybrid Equity Fund 18-19HDFC Children’s Gift Fund 27-28HDFC Retirement Savings Fund - Equity Plan (Co-managed scheme) 29HDFC Retirement Savings Fund - Hybrid Equity Plan (Co-managed scheme) 30-31HDFC Retirement Savings Fund - Hybrid Debt Plan (Co-managed scheme) 32
3 Mr. Amit B. Ganatra HDFC Capital Builder Value Fund 9HDFC Dynamic PE Ratio Fund of Funds (Co-managed scheme) 72HDFC Multi-Asset Fund (Co-managed scheme) 20-21HDFC TaxSaver 26HDFC Asset Allocator Fund of Funds (Co-managed scheme) 67Closed ended schemes 72
4 Mr. Krishan Kumar Daga HDFC Arbitrage Fund (Co-managed scheme) 37-38HDFC Multi-Asset Fund (Co-managed scheme) 20-21HDFC Index Fund - SEnSEx Plan (Co-managed scheme) 25HDFC Index Fund - nIFTY 50 Plan (Co-managed scheme) 23HDFC SEnSEx ETF (Co-managed scheme) 24HDFC nIFTY 50 ETF (Co-managed scheme) 22HDFC Gold Exchange Traded Fund 62HDFC Gold Fund 63HDFC Equity Savings Fund (Co-managed scheme) 33-34HDFC Banking ETF (Co-managed scheme) 64HDFC Asset Allocator Fund of Funds (Co-managed scheme) 67
5 Mr. Shobhit Mehrotra HDFC Income Fund 47HDFC Medium Term Debt Fund 48-49HDFC Floating Rate Debt Fund (Co-managed scheme) 55-56HDFC Credit Risk Debt Fund 41-42HDFC Hybrid Debt Fund (Co-managed scheme) 35-36HDFC Retirement Savings Fund - Equity Plan (Co-managed scheme) 29HDFC Retirement Savings Fund - Hybrid Equity Plan (Co-managed scheme) 30-31HDFC Retirement Savings Fund - Hybrid Debt Plan (Co-managed scheme) 32Close ended schemes 69-70
6 Mr. Anil Bamboli HDFC Dynamic Debt Fund 46HDFC Short Term Debt Fund 50-51HDFC Gilt Fund 45HDFC Money Market Fund (Co-managed scheme) 54HDFC Ultra Short Term Fund 57-58HDFC Overnight Fund 61HDFC Banking and PSU Debt Fund 43-44HDFC Equity Savings Fund (Co-managed scheme) 33-34HDFC Multi-Asset Fund (Co-managed scheme) 20-21HDFC Dynamic PE Ratio Fund of Funds (Co-managed scheme) 72HDFC Asset Allocator Fund of Funds (Co-managed scheme) 67Close ended schemes 70-71
7 Mr. Anupam Joshi HDFC Liquid Fund 59-60HDFC Corporate Bond Fund 39-40HDFC Low Duration Fund 52-53Close ended schemes 71-72
8 Mr. Rakesh Vyas HDFC Infrastructure Fund 15HDFC Housing Opportunities Fund 66
9 Mr. Vikash Agarwal HDFC Floating Rate Debt Fund (Co-managed scheme) 55-56HDFC Money Market Fund (Co-managed scheme) 54
10 Mr. Gopal Agrawal HDFC Equity Savings Fund (Co-managed scheme) 33-34HDFC Focused 30 Fund 14HDFC Large and Mid Cap Fund (Erstwhile HDFC Growth Opportunities Fund) 13HDFC Dividend Yield Fund 65
11 Mr. Arun Agarwal HDFC Arbitrage Fund (Co-managed scheme) 37-38HDFC Equity Savings Fund (Co-managed scheme) 33-34HDFC Index Fund - SEnSEx Plan (Co-managed scheme) 25HDFC Index Fund - nIFTY 50 Plan (Co-managed scheme) 23HDFC SEnSEx ETF (Co-managed scheme) 24HDFC nIFTY 50 ETF (Co-managed scheme) 22HDFC Multi-Asset Fund (Co-managed scheme) 20-21HDFC Banking ETF (Co-managed scheme) 64
For performance details of Direct Plan, refer page 74-81
https://files.hdfcfund.com/s3fs-public/2020-07/FAQs%20on%20Stamp%20Duty.pdf
Exit Load : (i) no exit load shall be levied for switching between Options under the same Plan within a Scheme. (ii) Switch of investments to Direct Plan within the same Scheme shall be subject to applicable exit load, unless the investments were made without any distributor code. However, any subsequent switch-out or redemption of such investments from the Direct Plan will not be subject to any exit load. (iii) no exit load shall be levied for switch-out from Direct Plan to other Plan within the same Scheme. However, any subsequent switch-out or redemption of such investment from the other Plan shall be subject to exit load based on the original date of investment in the Direct Plan. (iv) Switch of investments between Plans under a Scheme having separate portfolios, will be subject to applicable exit load. (v) no exit load will be levied on Bonus Units and Units allotted on IDCW Re-investment. (vi) In case of Systematic Transactions such as SIP, GSIP, Flex SIP, STP, Flex STP, Swing STP, Flexindex; Exit Load, if any, prevailing on the date of registration / enrolment shall be levied. Tax Benefits / Consequences : The Dividend Distribution Tax on distribution of income by equity oriented fund to all the investors shall be payable at the rate of 11.648%* and on distribution of income by other than equity oriented fund to an individual / HUF shall be payable at the rate of 29.12%* and at the rate of 34.944%* on distribution of income to any other investor. Such income distributed by the Scheme(s) is free from Income–tax in the hands of Investors. Units of the Scheme(s) are not subject to Wealth-tax and Gift-tax. Unit holders are required to pay Securities Transaction Tax (STT) at the rate of 0.001% at the time of redemption / switch-out of units of an equity-oriented fund. * including applicable surcharge, health and education cess.Investors should be aware that the fiscal rules / tax laws may change and there can be no guarantee that the current tax position may continue indefinitely. In view of individual nature of tax consequences, each investor is advised to consult his / her own professional tax advisor.Applicability of Stamp Duty : Effective July 1, 2020, in accordance with the amendment to the Indian Stamp Act, 1899, a stamp duty @ 0.005% of the transaction value would be levied on applicable mutual fund purchase transactions (including transactions carried through stock exchanges and depositories for units in demat mode). Thus, the number of units allotted on all the applicable mutual fund transactions would be reduced to the extent of levy of stamp duty.Kindly refer to FAQs on Stamp Duty, for details on the nature of transactions and the rate of levy of stamp duty available on our website.

June 2021 69
SCHEME PERFORMANCE - REGULAR PLAN - GROWTH OPTION (FUND MANAGER-WISE)
Past performance may or may not be sustained in the future. Returns greater than 1 year period are compounded annualized (CAGR). Different plans viz. Regular Plan and Direct Plan have a different expense structure. The expenses of the Direct Plan under the Scheme will be lower to the extent of the distribution expenses / commission charged in the Regular Plan. Load is not taken into consideration for computation of performance. Since Inception Date = Date of First allotment in the Scheme / Plan. n.A.: not Available
Performance of close-ended schemes, being close-ended in nature, is not strictly comparable with that of open-ended schemes since the investment strategy for close-ended schemes is primarily buy-and-hold whereas open-ended schemes are actively managed.
CHIRAG SETALVAD
HDFC LONG TERM ADVANTAGE FUND NAV as on Jun 30, 2021 ` 503.853
Date Period Scheme Returns
(%)
Benchmark Returns
(%)#
Additional Benchmark
Returns (%) ##
Value of ` 10,000 invested
Scheme (`)
Benchmark (`)#
Additional Benchmark
(`)##
Jun 30, 20 Last 1 Year 63.22 52.38 54.58 16,322 15,238 15,458Jun 29, 18 Last 3 Years 15.16 15.32 15.00 15,285 15,350 15,220Jun 30, 16 Last 5 Years 15.30 15.58 15.08 20,389 20,639 20,191Jan 02, 01 Since Inception 21.07 15.14 14.64 503,853 180,035 164,765
# S&P BSE SEnSEx (Total Returns Index) ## nIFTY 50 (Total Returns Index). The scheme is managed by Mr. Chirag Setalvad since April 02, 2007.
SHOBHIT MEHROTRA
HDFC FMP 3360D MARCH 2014 (1) NAV as on Jun 30, 2021 ` 16.9860
Date Period Scheme Returns
(%)
Benchmark Returns
(%)#
Additional Benchmark
Returns (%) ##
Value of ` 10,000 invested
Scheme (`)
Benchmark (`)#
Additional Benchmark
(`)##
Jun 30, 20 Last 1 Year 4.50 4.90 4.08 10,450 10,490 10,408Jun 29, 18 Last 3 Years 9.39 9.82 9.61 13,097 13,251 13,174Jun 30, 16 Last 5 Years 8.30 8.39 7.25 14,904 14,963 14,192Mar 26, 14 Since Inception 7.56 9.26 8.33 16,986 19,039 17,887
# CRISIL Composite Bond Fund Index ## CRISIL 10 year Gilt Index. The scheme is managed by Mr. Shobhit Mehrotra since inception.
HDFC FMP 1430D JULY 2017 (1) NAV as on Jun 30, 2021 ` 12.9217
Date Period Scheme Returns
(%)
Benchmark Returns
(%)#
Additional Benchmark
Returns (%) ##
Value of ` 10,000 invested
Scheme (`)
Benchmark (`)#
Additional Benchmark
(`)##
Jun 30, 20 Last 1 Year 3.96 4.90 4.08 10,396 10,490 10,408Jun 29, 18 Last 3 Years 7.80 9.82 9.61 12,531 13,251 13,174Aug 01, 17 Since Inception 6.77 7.52 6.03 12,922 13,280 12,574
# CRISIL Composite Bond Fund Index ## CRISIL 10 year Gitl Index. The scheme is managed by Mr. Shobhit Mehrotra since inception.
HDFC FMP 1113D JUNE 2018 (1) NAV as on Jun 30, 2021 ` 12.6049
Date Period Scheme Returns
(%)
Benchmark Returns
(%)#
Additional Benchmark
Returns (%) ##
Value of ` 10,000 invested
Scheme (`)
Benchmark (`)#
Additional Benchmark
(`)##
Jun 30, 20 Last 1 Year 4.36 4.90 4.08 10,436 10,490 10,408Jun 29, 18 Last 3 Years 7.93 9.82 9.61 12,579 13,251 13,174Jun 14, 18 Since Inception 7.89 9.88 9.68 12,605 13,325 13,253
# CRISIL Composite Bond Fund Index ## CRISIL 10 year Gilt Index. The scheme is managed by Mr. Shobhit Mehrotra since inception.
HDFC FMP 1124D JUNE 2018 (1) NAV as on Jun 30, 2021 ` 12.8312
Date Period Scheme Returns
(%)
Benchmark Returns
(%)#
Additional Benchmark
Returns (%) ##
Value of ` 10,000 invested
Scheme (`)
Benchmark (`)#
Additional Benchmark
(`)##
Jun 30, 20 Last 1 Year 10.22 4.90 4.08 11,022 10,490 10,408Jun 29, 18 Last 3 Years 8.65 9.82 9.61 12,831 13,251 13,174Jun 29, 18 Since Inception 8.65 9.82 9.61 12,831 13,251 13,174
# CRISIL Composite Bond Fund Index ## CRISIL 10 year Gilt Index. The scheme is managed by Mr. Shobhit Mehrotra since inception.
HDFC FMP 1099D JUNE 2018 (1) NAV as on Jun 30, 2021 ` 12.5285
Date Period Scheme Returns
(%)
Benchmark Returns
(%)#
Additional Benchmark
Returns (%) ##
Value of ` 10,000 invested
Scheme (`)
Benchmark (`)#
Additional Benchmark
(`)##
Jun 30, 20 Last 1 Year 4.15 4.90 4.08 10,415 10,490 10,408Jun 29, 18 Last 3 Years 7.79 9.82 9.61 12,530 13,251 13,174Jun 28, 18 Since Inception 7.78 9.85 9.68 12,529 13,264 13,204
# CRISIL Composite Bond Fund Index ## CRISIL 10 year Gilt Index. The scheme is managed by Mr. Shobhit Mehrotra since inception.
HDFC FMP 1122D JULY 2018 (1) NAV as on Jun 30, 2021 ` 12.5904
Date Period Scheme Returns
(%)
Benchmark Returns
(%)#
Additional Benchmark
Returns (%) ##
Value of ` 10,000 invested
Scheme (`)
Benchmark (`)#
Additional Benchmark
(`)##
Jun 30, 20 Last 1 Year 4.47 4.90 4.08 10,447 10,490 10,408Jul 04, 18 Since Inception 8.00 9.75 9.49 12,590 13,208 13,116
# CRISIL Composite Bond Fund Index ## CRISIL 10 year Gilt Index. The scheme is managed by Mr. Shobhit Mehrotra since inception.
HDFC FMP 1133D JULY 2018 (1) NAV as on Jun 30, 2021 ` 12.4675
Date Period Scheme Returns
(%)
Benchmark Returns
(%)#
Additional Benchmark
Returns (%) ##
Value of ` 10,000 invested
Scheme (`)
Benchmark (`)#
Additional Benchmark
(`)##
Jun 30, 20 Last 1 Year 5.58 4.90 4.08 10,558 10,490 10,408Jul 25, 18 Since Inception 7.81 9.71 9.35 12,468 13,124 13,000
# CRISIL Composite Bond Fund Index ## CRISIL 10 year Gilt Index. The scheme is managed by Mr. Shobhit Mehrotra since inception.
HDFC FMP 1133D FEBRUARY 2019 (1) NAV as on Jun 30, 2021 ` 12.1532
Date Period Scheme Returns
(%)
Benchmark Returns
(%)#
Additional Benchmark
Returns (%) ##
Value of ` 10,000 invested
Scheme (`)
Benchmark (`)#
Additional Benchmark
(`)##
Jun 30, 20 Last 1 Year 5.51 4.90 4.08 10,551 10,490 10,408Mar 06, 19 Since Inception 8.77 10.00 9.11 12,153 12,475 12,244
# CRISIL Composite Bond Fund Index ## CRISIL 10 year Gilt Index. The scheme is managed by Mr. Shobhit Mehrotra since inception.
HDFC FMP 1126D MARCH 2019 (1) NAV as on Jun 30, 2021 ` 12.1222
Date Period Scheme Returns
(%)
Benchmark Returns
(%)#
Additional Benchmark
Returns (%) ##
Value of ` 10,000 invested
Scheme (`)
Benchmark (`)#
Additional Benchmark
(`)##
Jun 30, 20 Last 1 Year 5.65 4.90 4.08 10,565 10,490 10,408Mar 13, 19 Since Inception 8.72 9.87 9.09 12,122 12,419 12,217
# CRISIL Composite Bond Fund Index ## CRISIL 10 year Gilt Index. The scheme is managed by Mr. Shobhit Mehrotra since inception.
HDFC FMP 1127D MARCH 2019 (1) NAV as on Jun 30, 2021 ` 12.0340
Date Period Scheme Returns
(%)
Benchmark Returns
(%)#
Additional Benchmark
Returns (%) ##
Value of ` 10,000 invested
Scheme (`)
Benchmark (`)#
Additional Benchmark
(`)##
Jun 30, 20 Last 1 Year 5.46 4.90 4.08 10,546 10,490 10,408Mar 19, 19 Since Inception 8.44 9.86 9.10 12,034 12,396 12,201
# CRISIL Composite Bond Fund Index ## CRISIL 10 year Gilt Index. The scheme is managed by Mr. Shobhit Mehrotra since inception.
HDFC FMP 1120D MARCH 2019 (1) NAV as on Jun 30, 2021 ` 11.9806
Date Period Scheme Returns
(%)
Benchmark Returns
(%)#
Additional Benchmark
Returns (%) ##
Value of ` 10,000 invested
Scheme (`)
Benchmark (`)#
Additional Benchmark
(`)##
Jun 30, 20 Last 1 Year 5.39 4.90 4.08 10,539 10,490 10,408Mar 26, 19 Since Inception 8.30 9.68 9.00 11,981 12,328 12,156
# CRISIL Composite Bond Fund Index ## CRISIL 10 year Gilt Index. The scheme is managed by Mr. Shobhit Mehrotra since inception.
HDFC FMP 1118D MARCH 2019 (1) NAV as on Jun 30, 2021 ` 12.0188
Date Period Scheme Returns
(%)
Benchmark Returns
(%)#
Additional Benchmark
Returns (%) ##
Value of ` 10,000 invested
Scheme (`)
Benchmark (`)#
Additional Benchmark
(`)##
Jun 30, 20 Last 1 Year 5.38 4.90 4.08 10,538 10,490 10,408Mar 28, 19 Since Inception 8.48 9.64 8.94 12,019 12,312 12,135
# CRISIL Composite Bond Fund Index ## CRISIL 10 year Gilt Index. The scheme is managed by Mr. Shobhit Mehrotra since inception.

70 June 2021
SCHEME PERFORMANCE - REGULAR PLAN - GROWTH OPTION (FUND MANAGER-WISE)
SHOBHIT MEHROTRA....CONTINUED
Past performance may or may not be sustained in the future. Returns greater than 1 year period are compounded annualized (CAGR). Different plans viz. Regular Plan and Direct Plan have a different expense structure. The expenses of the Direct Plan under the Scheme will be lower to the extent of the distribution expenses / commission charged in the Regular Plan. Load is not taken into consideration for computation of performance. Since Inception Date = Date of First allotment in the Scheme / Plan. n.A.: not Available
Performance of close-ended schemes, being close-ended in nature, is not strictly comparable with that of open-ended schemes since the investment strategy for close-ended schemes is primarily buy-and-hold whereas open-ended schemes are actively managed.
HDFC FMP 1100D APRIL 2019 (1) NAV as on Jun 30, 2021 ` 11.9942
Date Period Scheme Returns
(%)
Benchmark Returns
(%)#
Additional Benchmark
Returns (%) ##
Value of ` 10,000 invested
Scheme (`)
Benchmark (`)#
Additional Benchmark
(`)##
Jun 30, 20 Last 1 Year 5.56 4.90 4.08 10,556 10,490 10,408May 08, 19 Since Inception 8.83 9.95 9.20 11,994 12,259 12,081
# CRISIL Composite Bond Fund Index ## CRISIL 10 year Gilt Index. The scheme is managed by Mr. Shobhit Mehrotra since inception.
ANIL BAMBOLI
HDFC FMP 1846D AUGUST 2013 (1) NAV as on Jun 30, 2021 ` 19.8209
Date Period Scheme Returns
(%)
Benchmark Returns
(%)#
Additional Benchmark
Returns (%) ##
Value of ` 10,000 invested
Scheme (`)
Benchmark (`)#
Additional Benchmark
(`)##
Jun 30, 20 Last 1 Year 12.31 4.90 4.08 11,231 10,490 10,408Jun 29, 18 Last 3 Years 9.47 9.82 9.61 13,127 13,251 13,174Jun 30, 16 Last 5 Years 8.44 8.39 7.25 14,999 14,963 14,192Aug 14, 13 Since Inception 9.07 9.33 7.82 19,821 20,205 18,108
# CRISIL Composite Bond Fund Index ## CRISIL 10 year Gilt Index. The scheme is managed by Mr. Anil Bamboli since inception.
HDFC FMP 1181D APRIL 2018 (1) NAV as on Jun 30, 2021 ` 12.6231
Date Period Scheme Returns
(%)
Benchmark Returns
(%)#
Additional Benchmark
Returns (%) ##
Value of ` 10,000 invested
Scheme (`)
Benchmark (`)#
Additional Benchmark
(`)##Jun 30, 20 Last 1 Year 4.04 4.90 4.08 10,404 10,490 10,408Jun 29, 18 Last 3 Years 7.86 9.82 9.61 12,552 13,251 13,174Apr 27, 18 Since Inception 7.60 9.39 9.21 12,623 13,302 13,231
# CRISIL Composite Bond Fund Index ## CRISIL 10 year Gilt Index. The scheme is managed by Mr. Anil Bamboli since inception.
HDFC FMP 1434D MAY 2018 (1) NAV as on Jun 30, 2021 ` 13.0098
Date Period Scheme Returns
(%)
Benchmark Returns
(%)#
Additional Benchmark
Returns (%) ##
Value of ` 10,000 invested
Scheme (`)
Benchmark (`)#
Additional Benchmark
(`)##
Jun 30, 20 Last 1 Year 5.51 4.90 4.08 10,551 10,490 10,408Jun 29, 18 Last 3 Years 9.05 9.82 9.61 12,973 13,251 13,174May 09, 18 Since Inception 8.73 9.35 9.09 13,010 13,248 13,146
# CRISIL Composite Bond Fund Index ## CRISIL 10 year Gilt Index. The scheme is managed by Mr. Anil Bamboli since inception.
HDFC FMP 1134D MAY 2018 (1) NAV as on Jun 30, 2021 ` 12.6517
Date Period Scheme Returns
(%)
Benchmark Returns
(%)#
Additional Benchmark
Returns (%) ##
Value of ` 10,000 invested
Scheme (`)
Benchmark (`)#
Additional Benchmark
(`)##
Jun 30, 20 Last 1 Year 4.17 4.90 4.08 10,417 10,490 10,408Jun 29, 18 Last 3 Years 7.88 9.82 9.61 12,559 13,251 13,174May 24, 18 Since Inception 7.87 9.70 9.48 12,652 13,327 13,246
# CRISIL Composite Bond Fund Index ## CRISIL 10 year Gilt Index. The scheme is managed by Mr. Anil Bamboli since inception.
HDFC FMP 1119D JUNE 2018 (1) NAV as on Jun 30, 2021 ` 12.6500
Date Period Scheme Returns
(%)
Benchmark Returns
(%)#
Additional Benchmark
Returns (%) ##
Value of ` 10,000 invested
Scheme (`)
Benchmark (`)#
Additional Benchmark
(`)##
Jun 30, 20 Last 1 Year 4.30 4.90 4.08 10,430 10,490 10,408Jun 29, 18 Last 3 Years 7.94 9.82 9.61 12,580 13,251 13,174Jun 08, 18 Since Inception 7.98 9.88 9.68 12,650 13,347 13,272
# CRISIL Composite Bond Fund Index ## CRISIL 10 year Gilt Index. The scheme is managed by Mr. Anil Bamboli since inception.
HDFC FMP 1280D OCTOBER 2018 (1) NAV as on Jun 30, 2021 ` 12.7360
Date Period Scheme Returns
(%)
Benchmark Returns
(%)#
Additional Benchmark
Returns (%) ##
Value of ` 10,000 invested
Scheme (`)
Benchmark (`)#
Additional Benchmark
(`)##
Jun 30, 20 Last 1 Year 5.71 4.90 4.08 10,571 10,490 10,408Oct 11, 18 Since Inception 9.30 10.39 9.99 12,736 13,086 12,959
# CRISIL Composite Bond Fund Index ## CRISIL 10 year Gilt Index. The scheme is managed by Mr. Anil Bamboli since inception.
HDFC FMP 1344D OCTOBER 2018 (1) NAV as on Jun 30, 2021 ` 12.8379
Date Period Scheme Returns
(%)
Benchmark Returns
(%)#
Additional Benchmark
Returns (%) ##
Value of ` 10,000 invested
Scheme (`)
Benchmark (`)#
Additional Benchmark
(`)##
Jun 30, 20 Last 1 Year 9.38 4.90 4.08 10,938 10,490 10,408Oct 24, 18 Since Inception 9.75 10.27 9.72 12,838 13,001 12,827
# CRISIL Composite Bond Fund Index ## CRISIL 10 year Gilt Index. The scheme is managed by Mr. Anil Bamboli since inception.
HDFC FMP 1274D OCTOBER 2018 (1) NAV as on Jun 30, 2021 ` 12.7110
Date Period Scheme Returns
(%)
Benchmark Returns
(%)#
Additional Benchmark
Returns (%) ##
Value of ` 10,000 invested
Scheme (`)
Benchmark (`)#
Additional Benchmark
(`)##
Jun 30, 20 Last 1 Year 5.52 4.90 4.08 10,552 10,490 10,408Oct 17, 18 Since Inception 9.28 10.31 9.80 12,711 13,040 12,878
# CRISIL Composite Bond Fund Index ## CRISIL 10 year Gilt Index. The scheme is managed by Mr. Anil Bamboli since inception.
HDFC FMP 1261D OCTOBER 2018 (1) NAV as on Jun 30, 2021 ` 12.6037
Date Period Scheme Returns
(%)
Benchmark Returns
(%)#
Additional Benchmark
Returns (%) ##
Value of ` 10,000 invested
Scheme (`)
Benchmark (`)#
Additional Benchmark
(`)##
Jun 30, 20 Last 1 Year 4.94 4.90 4.08 10,494 10,490 10,408Oct 25, 18 Since Inception 9.01 10.27 9.71 12,604 12,997 12,821
# CRISIL Composite Bond Fund Index ## CRISIL 10 year Gilt Index. The scheme is managed by Mr. Anil Bamboli since inception.
HDFC FMP 1260D OCTOBER 2018 (1) NAV as on Jun 30, 2021 ` 12.6873
Date Period Scheme Returns
(%)
Benchmark Returns
(%)#
Additional Benchmark
Returns (%) ##
Value of ` 10,000 invested
Scheme (`)
Benchmark (`)#
Additional Benchmark
(`)##
Jun 30, 20 Last 1 Year 5.42 4.90 4.08 10,542 10,490 10,408Oct 31, 18 Since Inception 9.34 10.27 9.69 12,687 12,976 12,796
# CRISIL Composite Bond Fund Index ## CRISIL 10 year Gilt Index. The scheme is managed by Mr. Anil Bamboli since inception.
HDFC FMP 1265D OCTOBER 2018 (1) NAV as on Jun 30, 2021 ` 12.6660
Date Period Scheme Returns
(%)
Benchmark Returns
(%)#
Additional Benchmark
Returns (%) ##
Value of ` 10,000 invested
Scheme (`)
Benchmark (`)#
Additional Benchmark
(`)##
Jun 30, 20 Last 1 Year 5.68 4.90 4.08 10,568 10,490 10,408nov 01, 18 Since Inception 9.28 10.23 9.61 12,666 12,960 12,768
# CRISIL Composite Bond Fund Index ## CRISIL 10 year Gilt Index. The scheme is managed by Mr. Anil Bamboli since inception.
HDFC FMP 1246D NOVEMBER 2018 (1) NAV as on Jun 30, 2021 ` 12.5923
Date Period Scheme Returns
(%)
Benchmark Returns
(%)#
Additional Benchmark
Returns (%) ##
Value of ` 10,000 invested
Scheme (`)
Benchmark (`)#
Additional Benchmark
(`)##
Jun 30, 20 Last 1 Year 5.60 4.90 4.08 10,560 10,490 10,408nov 20, 18 Since Inception 9.23 10.13 9.56 12,592 12,864 12,691
# CRISIL Composite Bond Fund Index ## CRISIL 10 year Gilt Index. The scheme is managed by Mr. Anil Bamboli since inception.
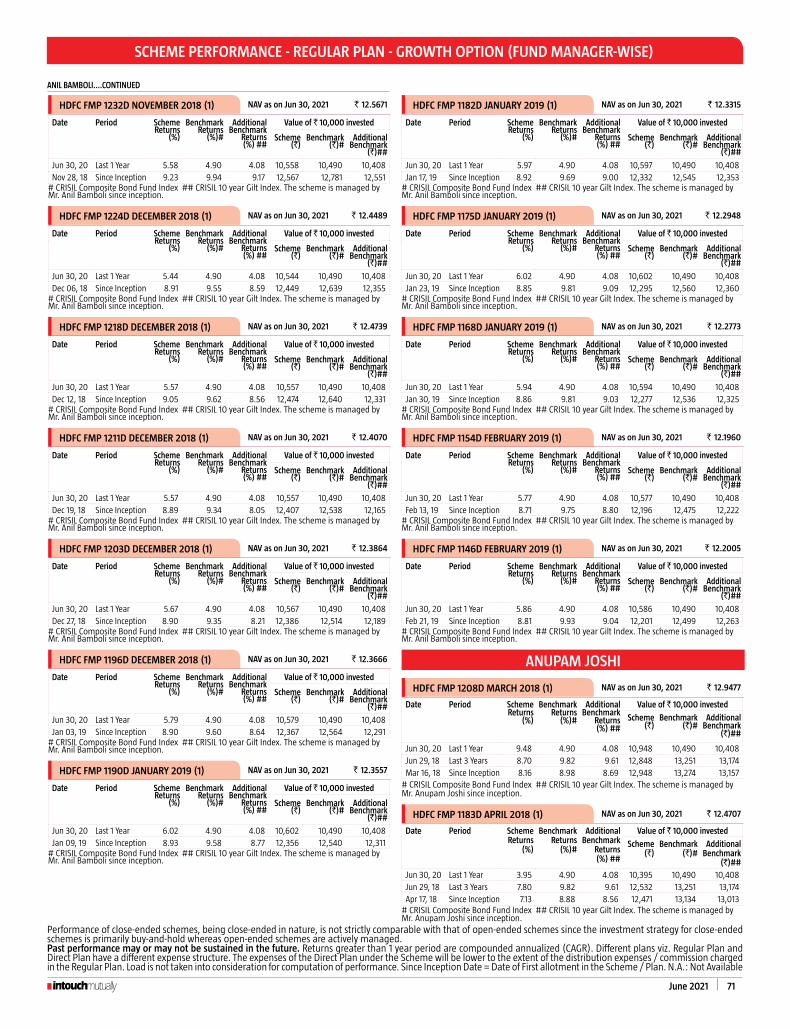
June 2021 71
SCHEME PERFORMANCE - REGULAR PLAN - GROWTH OPTION (FUND MANAGER-WISE)
ANIL BAMBOLI....CONTINUED
Past performance may or may not be sustained in the future. Returns greater than 1 year period are compounded annualized (CAGR). Different plans viz. Regular Plan and Direct Plan have a different expense structure. The expenses of the Direct Plan under the Scheme will be lower to the extent of the distribution expenses / commission charged in the Regular Plan. Load is not taken into consideration for computation of performance. Since Inception Date = Date of First allotment in the Scheme / Plan. n.A.: not Available
Performance of close-ended schemes, being close-ended in nature, is not strictly comparable with that of open-ended schemes since the investment strategy for close-ended schemes is primarily buy-and-hold whereas open-ended schemes are actively managed.
HDFC FMP 1232D NOVEMBER 2018 (1) NAV as on Jun 30, 2021 ` 12.5671
Date Period Scheme Returns
(%)
Benchmark Returns
(%)#
Additional Benchmark
Returns (%) ##
Value of ` 10,000 invested
Scheme (`)
Benchmark (`)#
Additional Benchmark
(`)##
Jun 30, 20 Last 1 Year 5.58 4.90 4.08 10,558 10,490 10,408nov 28, 18 Since Inception 9.23 9.94 9.17 12,567 12,781 12,551
# CRISIL Composite Bond Fund Index ## CRISIL 10 year Gilt Index. The scheme is managed by Mr. Anil Bamboli since inception.
HDFC FMP 1224D DECEMBER 2018 (1) NAV as on Jun 30, 2021 ` 12.4489
Date Period Scheme Returns
(%)
Benchmark Returns
(%)#
Additional Benchmark
Returns (%) ##
Value of ` 10,000 invested
Scheme (`)
Benchmark (`)#
Additional Benchmark
(`)##
Jun 30, 20 Last 1 Year 5.44 4.90 4.08 10,544 10,490 10,408Dec 06, 18 Since Inception 8.91 9.55 8.59 12,449 12,639 12,355
# CRISIL Composite Bond Fund Index ## CRISIL 10 year Gilt Index. The scheme is managed by Mr. Anil Bamboli since inception.
HDFC FMP 1218D DECEMBER 2018 (1) NAV as on Jun 30, 2021 ` 12.4739
Date Period Scheme Returns
(%)
Benchmark Returns
(%)#
Additional Benchmark
Returns (%) ##
Value of ` 10,000 invested
Scheme (`)
Benchmark (`)#
Additional Benchmark
(`)##
Jun 30, 20 Last 1 Year 5.57 4.90 4.08 10,557 10,490 10,408Dec 12, 18 Since Inception 9.05 9.62 8.56 12,474 12,640 12,331
# CRISIL Composite Bond Fund Index ## CRISIL 10 year Gilt Index. The scheme is managed by Mr. Anil Bamboli since inception.
HDFC FMP 1211D DECEMBER 2018 (1) NAV as on Jun 30, 2021 ` 12.4070
Date Period Scheme Returns
(%)
Benchmark Returns
(%)#
Additional Benchmark
Returns (%) ##
Value of ` 10,000 invested
Scheme (`)
Benchmark (`)#
Additional Benchmark
(`)##
Jun 30, 20 Last 1 Year 5.57 4.90 4.08 10,557 10,490 10,408Dec 19, 18 Since Inception 8.89 9.34 8.05 12,407 12,538 12,165
# CRISIL Composite Bond Fund Index ## CRISIL 10 year Gilt Index. The scheme is managed by Mr. Anil Bamboli since inception.
HDFC FMP 1203D DECEMBER 2018 (1) NAV as on Jun 30, 2021 ` 12.3864
Date Period Scheme Returns
(%)
Benchmark Returns
(%)#
Additional Benchmark
Returns (%) ##
Value of ` 10,000 invested
Scheme (`)
Benchmark (`)#
Additional Benchmark
(`)##
Jun 30, 20 Last 1 Year 5.67 4.90 4.08 10,567 10,490 10,408Dec 27, 18 Since Inception 8.90 9.35 8.21 12,386 12,514 12,189
# CRISIL Composite Bond Fund Index ## CRISIL 10 year Gilt Index. The scheme is managed by Mr. Anil Bamboli since inception.
HDFC FMP 1196D DECEMBER 2018 (1) NAV as on Jun 30, 2021 ` 12.3666
Date Period Scheme Returns
(%)
Benchmark Returns
(%)#
Additional Benchmark
Returns (%) ##
Value of ` 10,000 invested
Scheme (`)
Benchmark (`)#
Additional Benchmark
(`)##
Jun 30, 20 Last 1 Year 5.79 4.90 4.08 10,579 10,490 10,408Jan 03, 19 Since Inception 8.90 9.60 8.64 12,367 12,564 12,291
# CRISIL Composite Bond Fund Index ## CRISIL 10 year Gilt Index. The scheme is managed by Mr. Anil Bamboli since inception.
HDFC FMP 1190D JANUARY 2019 (1) NAV as on Jun 30, 2021 ` 12.3557
Date Period Scheme Returns
(%)
Benchmark Returns
(%)#
Additional Benchmark
Returns (%) ##
Value of ` 10,000 invested
Scheme (`)
Benchmark (`)#
Additional Benchmark
(`)##
Jun 30, 20 Last 1 Year 6.02 4.90 4.08 10,602 10,490 10,408Jan 09, 19 Since Inception 8.93 9.58 8.77 12,356 12,540 12,311
# CRISIL Composite Bond Fund Index ## CRISIL 10 year Gilt Index. The scheme is managed by Mr. Anil Bamboli since inception.
HDFC FMP 1182D JANUARY 2019 (1) NAV as on Jun 30, 2021 ` 12.3315
Date Period Scheme Returns
(%)
Benchmark Returns
(%)#
Additional Benchmark
Returns (%) ##
Value of ` 10,000 invested
Scheme (`)
Benchmark (`)#
Additional Benchmark
(`)##
Jun 30, 20 Last 1 Year 5.97 4.90 4.08 10,597 10,490 10,408Jan 17, 19 Since Inception 8.92 9.69 9.00 12,332 12,545 12,353
# CRISIL Composite Bond Fund Index ## CRISIL 10 year Gilt Index. The scheme is managed by Mr. Anil Bamboli since inception.
HDFC FMP 1175D JANUARY 2019 (1) NAV as on Jun 30, 2021 ` 12.2948
Date Period Scheme Returns
(%)
Benchmark Returns
(%)#
Additional Benchmark
Returns (%) ##
Value of ` 10,000 invested
Scheme (`)
Benchmark (`)#
Additional Benchmark
(`)##
Jun 30, 20 Last 1 Year 6.02 4.90 4.08 10,602 10,490 10,408Jan 23, 19 Since Inception 8.85 9.81 9.09 12,295 12,560 12,360
# CRISIL Composite Bond Fund Index ## CRISIL 10 year Gilt Index. The scheme is managed by Mr. Anil Bamboli since inception.
HDFC FMP 1168D JANUARY 2019 (1) NAV as on Jun 30, 2021 ` 12.2773
Date Period Scheme Returns
(%)
Benchmark Returns
(%)#
Additional Benchmark
Returns (%) ##
Value of ` 10,000 invested
Scheme (`)
Benchmark (`)#
Additional Benchmark
(`)##
Jun 30, 20 Last 1 Year 5.94 4.90 4.08 10,594 10,490 10,408Jan 30, 19 Since Inception 8.86 9.81 9.03 12,277 12,536 12,325
# CRISIL Composite Bond Fund Index ## CRISIL 10 year Gilt Index. The scheme is managed by Mr. Anil Bamboli since inception.
HDFC FMP 1154D FEBRUARY 2019 (1) NAV as on Jun 30, 2021 ` 12.1960
Date Period Scheme Returns
(%)
Benchmark Returns
(%)#
Additional Benchmark
Returns (%) ##
Value of ` 10,000 invested
Scheme (`)
Benchmark (`)#
Additional Benchmark
(`)##
Jun 30, 20 Last 1 Year 5.77 4.90 4.08 10,577 10,490 10,408Feb 13, 19 Since Inception 8.71 9.75 8.80 12,196 12,475 12,222
# CRISIL Composite Bond Fund Index ## CRISIL 10 year Gilt Index. The scheme is managed by Mr. Anil Bamboli since inception.
HDFC FMP 1146D FEBRUARY 2019 (1) NAV as on Jun 30, 2021 ` 12.2005
Date Period Scheme Returns
(%)
Benchmark Returns
(%)#
Additional Benchmark
Returns (%) ##
Value of ` 10,000 invested
Scheme (`)
Benchmark (`)#
Additional Benchmark
(`)##
Jun 30, 20 Last 1 Year 5.86 4.90 4.08 10,586 10,490 10,408Feb 21, 19 Since Inception 8.81 9.93 9.04 12,201 12,499 12,263
# CRISIL Composite Bond Fund Index ## CRISIL 10 year Gilt Index. The scheme is managed by Mr. Anil Bamboli since inception.
ANUPAM JOSHI
HDFC FMP 1208D MARCH 2018 (1) NAV as on Jun 30, 2021 ` 12.9477
Date Period Scheme Returns
(%)
Benchmark Returns
(%)#
Additional Benchmark
Returns (%) ##
Value of ` 10,000 invested
Scheme (`)
Benchmark (`)#
Additional Benchmark
(`)##
Jun 30, 20 Last 1 Year 9.48 4.90 4.08 10,948 10,490 10,408Jun 29, 18 Last 3 Years 8.70 9.82 9.61 12,848 13,251 13,174Mar 16, 18 Since Inception 8.16 8.98 8.69 12,948 13,274 13,157
# CRISIL Composite Bond Fund Index ## CRISIL 10 year Gilt Index. The scheme is managed by Mr. Anupam Joshi since inception.
HDFC FMP 1183D APRIL 2018 (1) NAV as on Jun 30, 2021 ` 12.4707
Date Period Scheme Returns
(%)
Benchmark Returns
(%)#
Additional Benchmark
Returns (%) ##
Value of ` 10,000 invested
Scheme (`)
Benchmark (`)#
Additional Benchmark
(`)##Jun 30, 20 Last 1 Year 3.95 4.90 4.08 10,395 10,490 10,408Jun 29, 18 Last 3 Years 7.80 9.82 9.61 12,532 13,251 13,174Apr 17, 18 Since Inception 7.13 8.88 8.56 12,471 13,134 13,013
# CRISIL Composite Bond Fund Index ## CRISIL 10 year Gilt Index. The scheme is managed by Mr. Anupam Joshi since inception.
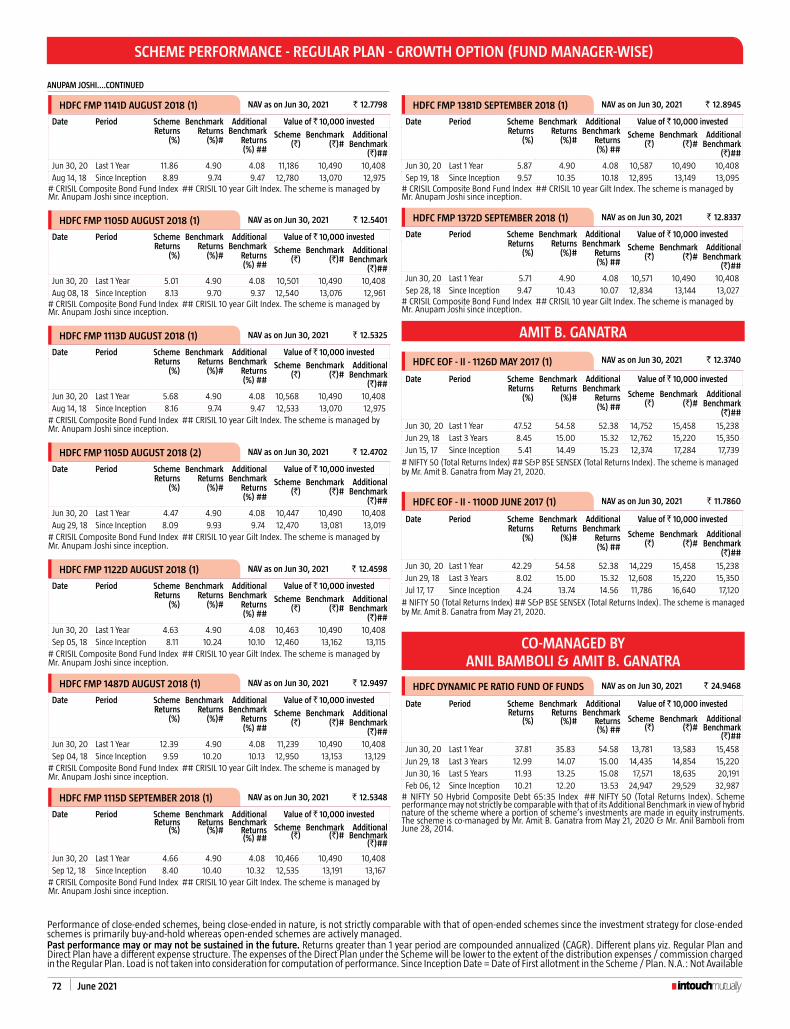
72 June 2021
SCHEME PERFORMANCE - REGULAR PLAN - GROWTH OPTION (FUND MANAGER-WISE)
Past performance may or may not be sustained in the future. Returns greater than 1 year period are compounded annualized (CAGR). Different plans viz. Regular Plan and Direct Plan have a different expense structure. The expenses of the Direct Plan under the Scheme will be lower to the extent of the distribution expenses / commission charged in the Regular Plan. Load is not taken into consideration for computation of performance. Since Inception Date = Date of First allotment in the Scheme / Plan. n.A.: not Available
Performance of close-ended schemes, being close-ended in nature, is not strictly comparable with that of open-ended schemes since the investment strategy for close-ended schemes is primarily buy-and-hold whereas open-ended schemes are actively managed.
ANUPAM JOSHI....CONTINUED
HDFC FMP 1141D AUGUST 2018 (1) NAV as on Jun 30, 2021 ` 12.7798
Date Period Scheme Returns
(%)
Benchmark Returns
(%)#
Additional Benchmark
Returns (%) ##
Value of ` 10,000 invested
Scheme (`)
Benchmark (`)#
Additional Benchmark
(`)##Jun 30, 20 Last 1 Year 11.86 4.90 4.08 11,186 10,490 10,408Aug 14, 18 Since Inception 8.89 9.74 9.47 12,780 13,070 12,975
# CRISIL Composite Bond Fund Index ## CRISIL 10 year Gilt Index. The scheme is managed by Mr. Anupam Joshi since inception.
HDFC FMP 1105D AUGUST 2018 (1) NAV as on Jun 30, 2021 ` 12.5401
Date Period Scheme Returns
(%)
Benchmark Returns
(%)#
Additional Benchmark
Returns (%) ##
Value of ` 10,000 invested
Scheme (`)
Benchmark (`)#
Additional Benchmark
(`)##Jun 30, 20 Last 1 Year 5.01 4.90 4.08 10,501 10,490 10,408Aug 08, 18 Since Inception 8.13 9.70 9.37 12,540 13,076 12,961
# CRISIL Composite Bond Fund Index ## CRISIL 10 year Gilt Index. The scheme is managed by Mr. Anupam Joshi since inception.
HDFC FMP 1113D AUGUST 2018 (1) NAV as on Jun 30, 2021 ` 12.5325
Date Period Scheme Returns
(%)
Benchmark Returns
(%)#
Additional Benchmark
Returns (%) ##
Value of ` 10,000 invested
Scheme (`)
Benchmark (`)#
Additional Benchmark
(`)##Jun 30, 20 Last 1 Year 5.68 4.90 4.08 10,568 10,490 10,408Aug 14, 18 Since Inception 8.16 9.74 9.47 12,533 13,070 12,975
# CRISIL Composite Bond Fund Index ## CRISIL 10 year Gilt Index. The scheme is managed by Mr. Anupam Joshi since inception.
HDFC FMP 1105D AUGUST 2018 (2) NAV as on Jun 30, 2021 ` 12.4702
Date Period Scheme Returns
(%)
Benchmark Returns
(%)#
Additional Benchmark
Returns (%) ##
Value of ` 10,000 invested
Scheme (`)
Benchmark (`)#
Additional Benchmark
(`)##Jun 30, 20 Last 1 Year 4.47 4.90 4.08 10,447 10,490 10,408Aug 29, 18 Since Inception 8.09 9.93 9.74 12,470 13,081 13,019
# CRISIL Composite Bond Fund Index ## CRISIL 10 year Gilt Index. The scheme is managed by Mr. Anupam Joshi since inception.
HDFC FMP 1122D AUGUST 2018 (1) NAV as on Jun 30, 2021 ` 12.4598
Date Period Scheme Returns
(%)
Benchmark Returns
(%)#
Additional Benchmark
Returns (%) ##
Value of ` 10,000 invested
Scheme (`)
Benchmark (`)#
Additional Benchmark
(`)##Jun 30, 20 Last 1 Year 4.63 4.90 4.08 10,463 10,490 10,408Sep 05, 18 Since Inception 8.11 10.24 10.10 12,460 13,162 13,115
# CRISIL Composite Bond Fund Index ## CRISIL 10 year Gilt Index. The scheme is managed by Mr. Anupam Joshi since inception.
HDFC FMP 1487D AUGUST 2018 (1) NAV as on Jun 30, 2021 ` 12.9497
Date Period Scheme Returns
(%)
Benchmark Returns
(%)#
Additional Benchmark
Returns (%) ##
Value of ` 10,000 invested
Scheme (`)
Benchmark (`)#
Additional Benchmark
(`)##Jun 30, 20 Last 1 Year 12.39 4.90 4.08 11,239 10,490 10,408Sep 04, 18 Since Inception 9.59 10.20 10.13 12,950 13,153 13,129
# CRISIL Composite Bond Fund Index ## CRISIL 10 year Gilt Index. The scheme is managed by Mr. Anupam Joshi since inception.
HDFC FMP 1115D SEPTEMBER 2018 (1) NAV as on Jun 30, 2021 ` 12.5348
Date Period Scheme Returns
(%)
Benchmark Returns
(%)#
Additional Benchmark
Returns (%) ##
Value of ` 10,000 invested
Scheme (`)
Benchmark (`)#
Additional Benchmark
(`)##
Jun 30, 20 Last 1 Year 4.66 4.90 4.08 10,466 10,490 10,408Sep 12, 18 Since Inception 8.40 10.40 10.32 12,535 13,191 13,167
# CRISIL Composite Bond Fund Index ## CRISIL 10 year Gilt Index. The scheme is managed by Mr. Anupam Joshi since inception.
HDFC FMP 1381D SEPTEMBER 2018 (1) NAV as on Jun 30, 2021 ` 12.8945
Date Period Scheme Returns
(%)
Benchmark Returns
(%)#
Additional Benchmark
Returns (%) ##
Value of ` 10,000 invested
Scheme (`)
Benchmark (`)#
Additional Benchmark
(`)##Jun 30, 20 Last 1 Year 5.87 4.90 4.08 10,587 10,490 10,408Sep 19, 18 Since Inception 9.57 10.35 10.18 12,895 13,149 13,095
# CRISIL Composite Bond Fund Index ## CRISIL 10 year Gilt Index. The scheme is managed by Mr. Anupam Joshi since inception.
HDFC FMP 1372D SEPTEMBER 2018 (1) NAV as on Jun 30, 2021 ` 12.8337
Date Period Scheme Returns
(%)
Benchmark Returns
(%)#
Additional Benchmark
Returns (%) ##
Value of ` 10,000 invested
Scheme (`)
Benchmark (`)#
Additional Benchmark
(`)##Jun 30, 20 Last 1 Year 5.71 4.90 4.08 10,571 10,490 10,408Sep 28, 18 Since Inception 9.47 10.43 10.07 12,834 13,144 13,027
# CRISIL Composite Bond Fund Index ## CRISIL 10 year Gilt Index. The scheme is managed by Mr. Anupam Joshi since inception.
AMIT B. GANATRA
HDFC EOF - II - 1126D MAY 2017 (1) NAV as on Jun 30, 2021 ` 12.3740
Date Period Scheme Returns
(%)
Benchmark Returns
(%)#
Additional Benchmark
Returns (%) ##
Value of ` 10,000 invested
Scheme (`)
Benchmark (`)#
Additional Benchmark
(`)##
Jun 30, 20 Last 1 Year 47.52 54.58 52.38 14,752 15,458 15,238Jun 29, 18 Last 3 Years 8.45 15.00 15.32 12,762 15,220 15,350Jun 15, 17 Since Inception 5.41 14.49 15.23 12,374 17,284 17,739
# nIFTY 50 (Total Returns Index) ## S&P BSE SEnSEx (Total Returns Index). The scheme is managed by Mr. Amit B. Ganatra from May 21, 2020.
HDFC EOF - II - 1100D JUNE 2017 (1) NAV as on Jun 30, 2021 ` 11.7860
Date Period Scheme Returns
(%)
Benchmark Returns
(%)#
Additional Benchmark
Returns (%) ##
Value of ` 10,000 invested
Scheme (`)
Benchmark (`)#
Additional Benchmark
(`)##
Jun 30, 20 Last 1 Year 42.29 54.58 52.38 14,229 15,458 15,238Jun 29, 18 Last 3 Years 8.02 15.00 15.32 12,608 15,220 15,350Jul 17, 17 Since Inception 4.24 13.74 14.56 11,786 16,640 17,120
# nIFTY 50 (Total Returns Index) ## S&P BSE SEnSEx (Total Returns Index). The scheme is managed by Mr. Amit B. Ganatra from May 21, 2020.
CO-MANAGED BY ANIL BAMBOLI & AMIT B. GANATRA
HDFC DYNAMIC PE RATIO FUND OF FUNDS NAV as on Jun 30, 2021 ` 24.9468
Date Period Scheme Returns
(%)
Benchmark Returns
(%)#
Additional Benchmark
Returns (%) ##
Value of ` 10,000 invested
Scheme (`)
Benchmark (`)#
Additional Benchmark
(`)##
Jun 30, 20 Last 1 Year 37.81 35.83 54.58 13,781 13,583 15,458Jun 29, 18 Last 3 Years 12.99 14.07 15.00 14,435 14,854 15,220Jun 30, 16 Last 5 Years 11.93 13.25 15.08 17,571 18,635 20,191Feb 06, 12 Since Inception 10.21 12.20 13.53 24,947 29,529 32,987
# nIFTY 50 Hybrid Composite Debt 65:35 Index ## nIFTY 50 (Total Returns Index). Scheme performance may not strictly be comparable with that of its Additional Benchmark in view of hybrid nature of the scheme where a portion of scheme’s investments are made in equity instruments. The scheme is co-managed by Mr. Amit B. Ganatra from May 21, 2020 & Mr. Anil Bamboli from June 28, 2014.

June 2021 73
SCHEME PERFORMANCE - DIRECT PLAN - GROWTH OPTION (FUND MANAGER-WISE)
PRASHANT JAIN
HDFC FLExI CAP FUND NAV as on Jun 30, 2021 ` 944.096
Date Period Scheme Returns
(%)
Benchmark Returns
(%)#
Additional Benchmark
Returns (%) ##
Value of ` 10,000 invested Scheme
(`)Benchmark
(`)#Additional
Benchmark (`)##
Jun 30, 20 Last 1 Year 66.99 60.77 54.58 16,699 16,077 15,458Jun 29, 18 Last 3 Years 15.15 15.00 15.00 15,279 15,220 15,220Jun 30, 16 Last 5 Years 14.85 15.40 15.08 19,994 20,473 20,191Jan 01, 13 Since Inception 14.58 14.26 13.51 31,801 31,041 29,351
# nIFTY 500 (Total Returns Index) ## nIFTY 50 (Total Returns Index).
HDFC TOP 100 FUND NAV as on Jun 30, 2021 ` 659.646
Date Period Scheme Returns
(%)
Benchmark Returns
(%)#
Additional Benchmark
Returns (%) ##
Value of ` 10,000 invested Scheme
(`)Benchmark
(`)#Additional
Benchmark (`)##
Jun 30, 20 Last 1 Year 55.77 54.02 52.38 15,577 15,402 15,238Jun 29, 18 Last 3 Years 13.34 14.56 15.32 14,570 15,045 15,350Jun 30, 16 Last 5 Years 13.75 15.08 15.58 19,051 20,189 20,639Jan 01, 13 Since Inception 13.26 13.87 13.82 28,813 30,167 30,051
# nIFTY 100 (Total Returns Index) ## S&P BSE SEnSEx (Total Returns Index).
HDFC BALANCED ADVANTAGE FUND NAV as on Jun 30, 2021 ` 271.625
Date Period Scheme Returns
(%)
Benchmark Returns
(%)#
Additional Benchmark
Returns (%) ##
Value of ` 10,000 invested Scheme
(`)Benchmark
(`)#Additional
Benchmark (`)##
Jun 30, 20 Last 1 Year 52.17 35.83 54.58 15,217 13,583 15,458Jun 29, 18 Last 3 Years 13.71 14.07 15.00 14,711 14,854 15,220Jun 30, 16 Last 5 Years 13.44 13.25 15.08 18,795 18,635 20,191Jan 01, 13 Since Inception 14.02 12.16 13.51 30,491 26,514 29,351
# nIFTY 50 Hybrid Composite Debt 65:35 Index ## nIFTY 50 (Total Returns Index). Scheme performance may not strictly be comparable with that of its Additional Benchmark in view of balanced nature of the scheme where a portion of scheme’s investments are made in debt instruments. Refer to note on performance disclosure on Page no. 17.
CHIRAG SETALVAD
HDFC MID-CAP OPPORTUNITIES FUND NAV as on Jun 30, 2021 ` 88.516
Date Period Scheme Returns
(%)
Benchmark Returns
(%)#
Additional Benchmark
Returns (%) ##
Value of ` 10,000 invested
Scheme (`)
Benchmark (`)#
Additional Benchmark
(`)##Jun 30, 20 Last 1 Year 74.42 84.97 54.58 17,442 18,497 15,458Jun 29, 18 Last 3 Years 15.50 15.13 15.00 15,420 15,273 15,220Jun 30, 16 Last 5 Years 16.47 15.50 15.08 21,444 20,566 20,191Jan 01, 13 Since Inception 20.00 15.68 13.51 47,085 34,481 29,351
# nIFTY Midcap 100 (Total Returns Index) ## nIFTY 50 (Total Returns Index).
HDFC SMALL CAP FUND NAV as on Jun 30, 2021 ` 72.278
Date Period Scheme Returns
(%)
Benchmark Returns
(%)#
Additional Benchmark
Returns (%) ##
Value of ` 10,000 invested
Scheme (`)
Benchmark (`)#
Additional Benchmark
(`)##Jun 30, 20 Last 1 Year 108.64 112.73 54.58 20,864 21,273 15,458Jun 29, 18 Last 3 Years 16.41 11.89 15.00 15,787 14,017 15,220Jun 30, 16 Last 5 Years 20.13 11.94 15.08 25,030 17,584 20,191Jan 01, 13 Since Inception 19.49 13.04 13.51 45,432 28,342 29,351
# nIFTY Smallcap 100 (Total Returns Index) ## nIFTY 50 (Total Returns Index).
HDFC HYBRID EQUITY FUND NAV as on Jun 30, 2021 ` 77.306
Date Period Scheme Returns
(%)
Benchmark Returns
(%)#
Additional Benchmark
Returns (%) ##
Value of ` 10,000 invested Scheme
(`)Benchmark
(`)#Additional
Benchmark (`)##
Jun 30, 20 Last 1 Year 51.06 35.83 54.58 15,106 13,583 15,458Jun 29, 18 Last 3 Years 14.07 14.07 15.00 14,855 14,854 15,220Jun 30, 16 Last 5 Years 14.09 13.25 15.08 19,338 18,635 20,191Jan 01, 13 Since Inception 15.90 12.16 13.51 35,056 26,514 29,351
# nIFTY 50 Hybrid Composite Debt 65:35 Index ## nIFTY 50 (Total Returns Index). Refer to note on performance disclosure on Page no. 19.
HDFC CHILDREN’S GIFT FUND NAV as on Jun 30, 2021 ` 183.987
Date Period Scheme Returns
(%)
Benchmark Returns
(%)#
Additional Benchmark
Returns (%) ##
Value of ` 10,000 invested
Scheme (`)
Benchmark (`)#
Additional Benchmark
(`)##
Jun 30, 20 Last 1 Year 51.28 35.83 54.58 15,128 13,583 15,458Jun 29, 18 Last 3 Years 15.61 14.07 15.00 15,463 14,854 15,220Jun 30, 16 Last 5 Years 15.40 13.25 15.08 20,473 18,635 20,191Jan 01, 13 Since Inception 16.34 12.16 13.51 36,181 26,514 29,351
# nIFTY 50 Hybrid Composite Debt 65:35 Index ## nIFTY 50 (Total Returns Index). Scheme performance may not strictly be comparable with that of its Additional Benchmark in view of balanced nature of the scheme where a portion of scheme’s investments are made in debt instruments.
HDFC LONG TERM ADVANTAGE FUND NAV as on Jun 30, 2021 ` 528.238
Date Period Scheme Returns
(%)
Benchmark Returns
(%)#
Additional Benchmark
Returns (%) ##
Value of ` 10,000 invested
Scheme (`)
Benchmark (`)#
Additional Benchmark
(`)##
Jun 30, 20 Last 1 Year 63.94 52.38 54.58 16,394 15,238 15,458Jun 29, 18 Last 3 Years 15.72 15.32 15.00 15,509 15,350 15,220Jun 30, 16 Last 5 Years 15.96 15.58 15.08 20,978 20,639 20,191Jan 01, 13 Since Inception 16.13 13.82 13.51 35,649 30,051 29,351
# S&P BSE SEnSEx (Total Returns Index) ## nIFTY 50 (Total Returns Index).
SHOBHIT MEHROTRA
HDFC INCOME FUND NAV as on Jun 30, 2021 ` 49.9709
Date Period Scheme Returns
(%)
Benchmark Returns
(%)#
Additional Benchmark
Returns (%) ##
Value of ` 10,000 invested
Scheme (`)
Benchmark (`)#
Additional Benchmark
(`)##
Jun 30, 20 Last 1 Year 4.72 5.72 4.08 10,472 10,572 10,408Jun 29, 18 Last 3 Years 8.05 10.13 9.61 12,621 13,363 13,174Jun 30, 16 Last 5 Years 6.86 8.30 7.25 13,937 14,905 14,192Jan 01, 13 Since Inception 7.76 8.40 7.24 18,877 19,848 18,108
# nIFTY Medium To Long Duration Debt Index ## CRISIL 10 year Gilt Index.
HDFC MEDIUM TERM DEBT FUND NAV as on Jun 30, 2021 ` 46.6389
Date Period Scheme Returns
(%)
Benchmark Returns
(%)#
Additional Benchmark
Returns (%) ##
Value of ` 10,000 invested
Scheme (`)
Benchmark (`)#
Additional Benchmark
(`)##
Jun 30, 20 Last 1 Year 8.93 6.52 4.08 10,893 10,652 10,408Jun 29, 18 Last 3 Years 9.23 9.80 9.61 13,039 13,244 13,174Jun 30, 16 Last 5 Years 8.62 8.37 7.25 15,124 14,952 14,192Jan 01, 13 Since Inception 8.85 8.66 7.24 20,565 20,250 18,108
# nIFTY Medium Duration Debt Index ## CRISIL 10 year Gilt Index.
HDFC CREDIT RISk DEBT FUND NAV as on Jun 30, 2021 ` 19.7101
Date Period Scheme Returns
(%)
Benchmark Returns
(%)#
Additional Benchmark
Returns (%) ##
Value of ` 10,000 invested
Scheme (`)
Benchmark (`)#
Additional Benchmark
(`)##
Jun 30, 20 Last 1 Year 11.07 9.67 4.08 11,107 10,967 10,408Jun 29, 18 Last 3 Years 9.63 9.61 9.61 13,184 13,174 13,174Jun 30, 16 Last 5 Years 9.02 8.90 7.25 15,407 15,320 14,192Mar 25, 14 Since Inception 9.78 9.42 8.33 19,710 19,241 17,896
# nIFTY Credit Risk Bond Index ## CRISIL 10 year Gilt Index. Refer to note on performance disclosure on Page no. 41.
HDFC FMP 3360D MARCH 2014 (1) NAV as on Jun 30, 2021 ` 17.1100
Date Period Scheme Returns
(%)
Benchmark Returns
(%)#
Additional Benchmark
Returns (%) ##
Value of ` 10,000 invested
Scheme (`)
Benchmark (`)#
Additional Benchmark
(`)##
Jun 30, 20 Last 1 Year 4.61 4.90 4.08 10,461 10,490 10,408Jun 29, 18 Last 3 Years 9.50 9.82 9.61 13,136 13,251 13,174Jun 30, 16 Last 5 Years 8.41 8.39 7.25 14,979 14,963 14,192Mar 26, 14 Since Inception 7.67 9.26 8.33 17,110 19,039 17,887
# CRISIL Composite Bond Fund Index ## CRISIL 10 year Gilt Index. The scheme is managed by Mr. Shobhit Mehrotra since inception.
Past performance may or may not be sustained in the future. Returns greater than 1 year period are compounded annualized (CAGR). Different plans viz. Regular Plan and Direct Plan have a different expense structure. The expenses of the Direct Plan under the Scheme will be lower to the extent of the distribution expenses / commission charged in the Regular Plan. Load is not taken into consideration for computation of performance. Since Inception Date = Date of First allotment in the Scheme / Plan. n.A.: not Available

74 June 2021
SCHEME PERFORMANCE - DIRECT PLAN - GROWTH OPTION (FUND MANAGER-WISE)
HDFC FMP 1430D JULY 2017 (1) NAV as on Jun 30, 2021 ` 12.9723
Date Period Scheme Returns
(%)
Benchmark Returns
(%)#
Additional Benchmark
Returns (%) ##
Value of ` 10,000 invested
Scheme (`)
Benchmark (`)#
Additional Benchmark
(`)##
Jun 30, 20 Last 1 Year 4.07 4.90 4.08 10,407 10,490 10,408Jun 29, 18 Last 3 Years 7.90 9.82 9.61 12,569 13,251 13,174Aug 01, 17 Since Inception 6.87 7.52 6.03 12,972 13,280 12,574
# CRISIL Composite Bond Fund Index ## CRISIL 10 year Gilt Index. The scheme is managed by Mr. Shobhit Mehrotra since inception.
HDFC FMP 1113D JUNE 2018 (1) NAV as on Jun 30, 2021 ` 12.6988
Date Period Scheme Returns
(%)
Benchmark Returns
(%)#
Additional Benchmark
Returns (%) ##
Value of ` 10,000 invested
Scheme (`)
Benchmark (`)#
Additional Benchmark
(`)##
Jun 30, 20 Last 1 Year 4.38 4.90 4.08 10,438 10,490 10,408Jun 29, 18 Last 3 Years 8.19 9.82 9.61 12,669 13,251 13,174Jun 14, 18 Since Inception 8.16 9.88 9.68 12,699 13,325 13,253
# CRISIL Composite Bond Fund Index ## CRISIL 10 year Gilt Index. The scheme is managed by Mr. Shobhit Mehrotra since inception.
HDFC FMP 1124D JUNE 2018 (1) NAV as on Jun 30, 2021 ` 12.9460
Date Period Scheme Returns
(%)
Benchmark Returns
(%)#
Additional Benchmark
Returns (%) ##
Value of ` 10,000 invested
Scheme (`)
Benchmark (`)#
Additional Benchmark
(`)##
Jun 30, 20 Last 1 Year 10.25 4.90 4.08 11,025 10,490 10,408Jun 29, 18 Last 3 Years 8.97 9.82 9.61 12,946 13,251 13,174Jun 29, 18 Since Inception 8.97 9.82 9.61 12,946 13,251 13,174
# CRISIL Composite Bond Fund Index ## CRISIL 10 year Gilt Index. The scheme is managed by Mr. Shobhit Mehrotra since inception.
HDFC FMP 1099D JUNE 2018 (1) NAV as on Jun 30, 2021 ` 12.6215
Date Period Scheme Returns
(%)
Benchmark Returns
(%)#
Additional Benchmark
Returns (%) ##
Value of ` 10,000 invested
Scheme (`)
Benchmark (`)#
Additional Benchmark
(`)##
Jun 30, 20 Last 1 Year 4.17 4.90 4.08 10,417 10,490 10,408Jun 29, 18 Last 3 Years 8.06 9.82 9.61 12,623 13,251 13,174Jun 28, 18 Since Inception 8.05 9.85 9.68 12,622 13,264 13,204
# CRISIL Composite Bond Fund Index ## CRISIL 10 year Gilt Index. The scheme is managed by Mr. Shobhit Mehrotra since inception.
HDFC FMP 1122D JULY 2018 (1) NAV as on Jun 30, 2021 ` 12.6839
Date Period Scheme Returns
(%)
Benchmark Returns
(%)#
Additional Benchmark
Returns (%) ##
Value of ` 10,000 invested
Scheme (`)
Benchmark (`)#
Additional Benchmark
(`)##
Jun 30, 20 Last 1 Year 4.49 4.90 4.08 10,449 10,490 10,408Jul 04, 18 Since Inception 8.27 9.75 9.49 12,684 13,208 13,116
# CRISIL Composite Bond Fund Index ## CRISIL 10 year Gilt Index. The scheme is managed by Mr. Shobhit Mehrotra since inception.
HDFC FMP 1133D JULY 2018 (1) NAV as on Jun 30, 2021 ` 12.5597
Date Period Scheme Returns
(%)
Benchmark Returns
(%)#
Additional Benchmark
Returns (%) ##
Value of ` 10,000 invested
Scheme (`)
Benchmark (`)#
Additional Benchmark
(`)##
Jun 30, 20 Last 1 Year 5.60 4.90 4.08 10,560 10,490 10,408Jul 25, 18 Since Inception 8.08 9.71 9.35 12,560 13,124 13,000
# CRISIL Composite Bond Fund Index ## CRISIL 10 year Gilt Index. The scheme is managed by Mr. Shobhit Mehrotra since inception.
HDFC FMP 1133D FEBRUARY 2019 (1) NAV as on Jun 30, 2021 ` 12.2479
Date Period Scheme Returns
(%)
Benchmark Returns
(%)#
Additional Benchmark
Returns (%) ##
Value of ` 10,000 invested
Scheme (`)
Benchmark (`)#
Additional Benchmark
(`)##
Jun 30, 20 Last 1 Year 5.53 4.90 4.08 10,553 10,490 10,408Mar 06, 19 Since Inception 9.13 10.00 9.11 12,248 12,475 12,244
# CRISIL Composite Bond Fund Index ## CRISIL 10 year Gilt Index. The scheme is managed by Mr. Shobhit Mehrotra since inception.
HDFC FMP 1126D MARCH 2019 (1) NAV as on Jun 30, 2021 ` 12.2164
Date Period Scheme Returns
(%)
Benchmark Returns
(%)#
Additional Benchmark
Returns (%) ##
Value of ` 10,000 invested
Scheme (`)
Benchmark (`)#
Additional Benchmark
(`)##
Jun 30, 20 Last 1 Year 5.67 4.90 4.08 10,567 10,490 10,408Mar 13, 19 Since Inception 9.09 9.87 9.09 12,216 12,419 12,217
# CRISIL Composite Bond Fund Index ## CRISIL 10 year Gilt Index. The scheme is managed by Mr. Shobhit Mehrotra since inception.
HDFC FMP 1127D MARCH 2019 (1) NAV as on Jun 30, 2021 ` 12.1276
Date Period Scheme Returns
(%)
Benchmark Returns
(%)#
Additional Benchmark
Returns (%) ##
Value of ` 10,000 invested
Scheme (`)
Benchmark (`)#
Additional Benchmark
(`)##
Jun 30, 20 Last 1 Year 5.48 4.90 4.08 10,548 10,490 10,408Mar 19, 19 Since Inception 8.81 9.86 9.10 12,128 12,396 12,201
# CRISIL Composite Bond Fund Index ## CRISIL 10 year Gilt Index. The scheme is managed by Mr. Shobhit Mehrotra since inception.
HDFC FMP 1120D MARCH 2019 (1) NAV as on Jun 30, 2021 ` 12.0738
Date Period Scheme Returns
(%)
Benchmark Returns
(%)#
Additional Benchmark
Returns (%) ##
Value of ` 10,000 invested
Scheme (`)
Benchmark (`)#
Additional Benchmark
(`)##
Jun 30, 20 Last 1 Year 5.41 4.90 4.08 10,541 10,490 10,408Mar 26, 19 Since Inception 8.67 9.68 9.00 12,074 12,328 12,156
# CRISIL Composite Bond Fund Index ## CRISIL 10 year Gilt Index. The scheme is managed by Mr. Shobhit Mehrotra since inception.
HDFC FMP 1118D MARCH 2019 (1) NAV as on Jun 30, 2021 ` 12.0695
Date Period Scheme Returns
(%)
Benchmark Returns
(%)#
Additional Benchmark
Returns (%) ##
Value of ` 10,000 invested
Scheme (`)
Benchmark (`)#
Additional Benchmark
(`)##
Jun 30, 20 Last 1 Year 5.41 4.90 4.08 10,541 10,490 10,408Mar 28, 19 Since Inception 8.68 9.64 8.94 12,070 12,312 12,135
# CRISIL Composite Bond Fund Index ## CRISIL 10 year Gilt Index. The scheme is managed by Mr. Shobhit Mehrotra since inception.
HDFC FMP 1100D APRIL 2019 (1) NAV as on Jun 30, 2021 ` 12.0629
Date Period Scheme Returns
(%)
Benchmark Returns
(%)#
Additional Benchmark
Returns (%) ##
Value of ` 10,000 invested
Scheme (`)
Benchmark (`)#
Additional Benchmark
(`)##
Jun 30, 20 Last 1 Year 5.58 4.90 4.08 10,558 10,490 10,408May 08, 19 Since Inception 9.12 9.95 9.20 12,063 12,259 12,081
# CRISIL Composite Bond Fund Index ## CRISIL 10 year Gilt Index. The scheme is managed by Mr. Shobhit Mehrotra since inception.
ANUPAM JOSHI
HDFC CORPORATE BOND FUND NAV as on Jun 30, 2021 ` 25.5648
Date Period Scheme Returns
(%)
Benchmark Returns
(%)#
Additional Benchmark
Returns (%) ##
Value of ` 10,000 invested
Scheme (`)
Benchmark (`)#
Additional Benchmark
(`)##
Jun 30, 20 Last 1 Year 6.07 7.23 4.08 10,607 10,723 10,408Jun 29, 18 Last 3 Years 9.50 9.36 9.61 13,137 13,086 13,174Jun 30, 16 Last 5 Years 8.60 8.35 7.25 15,110 14,938 14,192Jan 01, 13 Since Inception 8.83 8.75 7.24 20,533 20,393 18,108
# nIFTY Corporate Bond Index ## CRISIL 10 year Gilt Index. Refer to note on performance disclosure on Page no. 40.
HDFC LOW DURATION FUND NAV as on Jun 30, 2021 ` 48.2128
Date Period Scheme Returns
(%)
Benchmark Returns
(%)#
Additional Benchmark
Returns (%) ##
Value of ` 10,000 invested
Scheme (`)
Benchmark (`)#
Additional Benchmark
(`)##Jun 30, 20 Last 1 Year 6.30 4.63 3.58 10,630 10,463 10,358Jun 29, 18 Last 3 Years 7.85 6.94 6.39 12,551 12,233 12,047Jun 30, 16 Last 5 Years 7.76 6.99 6.30 14,532 14,018 13,576Jan 01, 13 Since Inception 8.21 7.76 6.79 19,556 18,874 17,479
# nIFTY Low Duration Debt Index ## CRISIL 1 year T-Bill Index.
Past performance may or may not be sustained in the future. Returns greater than 1 year period are compounded annualized (CAGR). Different plans viz. Regular Plan and Direct Plan have a different expense structure. The expenses of the Direct Plan under the Scheme will be lower to the extent of the distribution expenses / commission charged in the Regular Plan. Load is not taken into consideration for computation of performance. Since Inception Date = Date of First allotment in the Scheme / Plan. n.A.: not Available
Performance of close-ended schemes, being close-ended in nature, is not strictly comparable with that of open-ended schemes since the investment strategy for close-ended schemes is primarily buy-and-hold whereas open-ended schemes are actively managed.
SHOBHIT MEHROTRA....CONTINUED

June 2021 75
SCHEME PERFORMANCE - DIRECT PLAN - GROWTH OPTION (FUND MANAGER-WISE)
HDFC LIQUID FUND NAV as on Jun 30, 2021 ` 4077.9755
Date Period Scheme Returns
(%)
Benchmark Returns
(%)#
Additional Benchmark
Returns (%) ##
Value of ` 10,000 invested
Scheme (`)
Benchmark (`)#
Additional Benchmark
(`)##Jun 23, 21 Last 7 days 3.52 3.73 4.17 10,007 10,007 10,008Jun 15, 21 Last 15 days 3.40 3.59 1.36 10,014 10,015 10,006May 31, 21 Last 1 Month 3.37 3.57 2.45 10,028 10,029 10,020Jun 30, 20 Last 1 Year 3.21 3.71 3.58 10,321 10,371 10,358Jun 29, 18 Last 3 Years 5.39 5.70 6.39 11,708 11,813 12,047Jun 30, 16 Last 5 Years 5.98 6.19 6.30 13,371 13,505 13,576Dec 31, 12 Since Inception 7.16 7.22 6.79 18,004 18,085 17,487
Returns less than 1 year period are simple annualized. # CRISIL Liquid Fund Index ## CRISIL 1 year T-Bill Index.
HDFC FMP 1208D MARCH 2018 (1) NAV as on Jun 30, 2021 ` 13.0763
Date Period Scheme Returns
(%)
Benchmark Returns
(%)#
Additional Benchmark
Returns (%) ##
Value of ` 10,000 invested
Scheme (`)
Benchmark (`)#
Additional Benchmark
(`)##Jun 30, 20 Last 1 Year 9.81 4.90 4.08 10,981 10,490 10,408Jun 29, 18 Last 3 Years 9.02 9.82 9.61 12,965 13,251 13,174Mar 16, 18 Since Inception 8.49 8.98 8.69 13,076 13,274 13,157
# CRISIL Composite Bond Fund Index ## CRISIL 10 year Gilt Index. The scheme is managed by Mr. Anupam Joshi since inception.
HDFC FMP 1183D APRIL 2018 (1) NAV as on Jun 30, 2021 ` 12.5709
Date Period Scheme Returns
(%)
Benchmark Returns
(%)#
Additional Benchmark
Returns (%) ##
Value of ` 10,000 invested
Scheme (`)
Benchmark (`)#
Additional Benchmark
(`)##
Jun 30, 20 Last 1 Year 4.21 4.90 4.08 10,421 10,490 10,408Jun 29, 18 Last 3 Years 8.07 9.82 9.61 12,626 13,251 13,174Apr 17, 18 Since Inception 7.40 8.88 8.56 12,571 13,134 13,013
# CRISIL Composite Bond Fund Index ## CRISIL 10 year Gilt Index. The scheme is managed by Mr. Anupam Joshi since inception.
HDFC FMP 1141D AUGUST 2018 (1) NAV as on Jun 30, 2021 ` 12.8934
Date Period Scheme Returns
(%)
Benchmark Returns
(%)#
Additional Benchmark
Returns (%) ##
Value of ` 10,000 invested
Scheme (`)
Benchmark (`)#
Additional Benchmark
(`)##
Jun 30, 20 Last 1 Year 11.88 4.90 4.08 11,188 10,490 10,408Aug 14, 18 Since Inception 9.23 9.74 9.47 12,893 13,070 12,975
# CRISIL Composite Bond Fund Index ## CRISIL 10 year Gilt Index. The scheme is managed by Mr. Anupam Joshi since inception.
HDFC FMP 1105D AUGUST 2018 (1) NAV as on Jun 30, 2021 ` 12.6329
Date Period Scheme Returns
(%)
Benchmark Returns
(%)#
Additional Benchmark
Returns (%) ##
Value of ` 10,000 invested
Scheme (`)
Benchmark (`)#
Additional Benchmark
(`)##
Jun 30, 20 Last 1 Year 5.03 4.90 4.08 10,503 10,490 10,408Aug 08, 18 Since Inception 8.41 9.70 9.37 12,633 13,076 12,961
# CRISIL Composite Bond Fund Index ## CRISIL 10 year Gilt Index. The scheme is managed by Mr. Anupam Joshi since inception.
HDFC FMP 1113D AUGUST 2018 (1) NAV as on Jun 30, 2021 ` 12.6246
Date Period Scheme Returns
(%)
Benchmark Returns
(%)#
Additional Benchmark
Returns (%) ##
Value of ` 10,000 invested
Scheme (`)
Benchmark (`)#
Additional Benchmark
(`)##
Jun 30, 20 Last 1 Year 5.71 4.90 4.08 10,571 10,490 10,408Aug 14, 18 Since Inception 8.43 9.74 9.47 12,625 13,070 12,975
# CRISIL Composite Bond Fund Index ## CRISIL 10 year Gilt Index. The scheme is managed by Mr. Anupam Joshi since inception.
HDFC FMP 1105D AUGUST 2018 (2) NAV as on Jun 30, 2021 ` 12.5622
Date Period Scheme Returns
(%)
Benchmark Returns
(%)#
Additional Benchmark
Returns (%) ##
Value of ` 10,000 invested
Scheme (`)
Benchmark (`)#
Additional Benchmark
(`)##
Jun 30, 20 Last 1 Year 4.49 4.90 4.08 10,449 10,490 10,408Aug 29, 18 Since Inception 8.37 9.93 9.74 12,562 13,081 13,019
# CRISIL Composite Bond Fund Index ## CRISIL 10 year Gilt Index. The scheme is managed by Mr. Anupam Joshi since inception.
HDFC FMP 1122D AUGUST 2018 (1) NAV as on Jun 30, 2021 ` 12.5517
Date Period Scheme Returns
(%)
Benchmark Returns
(%)#
Additional Benchmark
Returns (%) ##
Value of ` 10,000 invested
Scheme (`)
Benchmark (`)#
Additional Benchmark
(`)##
Jun 30, 20 Last 1 Year 4.65 4.90 4.08 10,465 10,490 10,408Sep 05, 18 Since Inception 8.40 10.24 10.10 12,552 13,162 13,115
# CRISIL Composite Bond Fund Index ## CRISIL 10 year Gilt Index. The scheme is managed by Mr. Anupam Joshi since inception.
HDFC FMP 1487D AUGUST 2018 (1) NAV as on Jun 30, 2021 ` 13.1289
Date Period Scheme Returns
(%)
Benchmark Returns
(%)#
Additional Benchmark
Returns (%) ##
Value of ` 10,000 invested
Scheme (`)
Benchmark (`)#
Additional Benchmark
(`)##
Jun 30, 20 Last 1 Year 12.41 4.90 4.08 11,241 10,490 10,408Sep 04, 18 Since Inception 10.13 10.20 10.13 13,129 13,153 13,129
# CRISIL Composite Bond Fund Index ## CRISIL 10 year Gilt Index. The scheme is managed by Mr. Anupam Joshi since inception.
HDFC FMP 1115D SEPTEMBER 2018 (1) NAV as on Jun 30, 2021 ` 12.6275
Date Period Scheme Returns
(%)
Benchmark Returns
(%)#
Additional Benchmark
Returns (%) ##
Value of ` 10,000 invested
Scheme (`)
Benchmark (`)#
Additional Benchmark
(`)##
Jun 30, 20 Last 1 Year 4.69 4.90 4.08 10,469 10,490 10,408Sep 12, 18 Since Inception 8.69 10.40 10.32 12,628 13,191 13,167
# CRISIL Composite Bond Fund Index ## CRISIL 10 year Gilt Index. The scheme is managed by Mr. Anupam Joshi since inception.
HDFC FMP 1381D SEPTEMBER 2018 (1) NAV as on Jun 30, 2021 ` 13.0155
Date Period Scheme Returns
(%)
Benchmark Returns
(%)#
Additional Benchmark
Returns (%) ##
Value of ` 10,000 invested
Scheme (`)
Benchmark (`)#
Additional Benchmark
(`)##
Jun 30, 20 Last 1 Year 5.89 4.90 4.08 10,589 10,490 10,408Sep 19, 18 Since Inception 9.94 10.35 10.18 13,016 13,149 13,095
# CRISIL Composite Bond Fund Index ## CRISIL 10 year Gilt Index. The scheme is managed by Mr. Anupam Joshi since inception.
HDFC FMP 1372D SEPTEMBER 2018 (1) NAV as on Jun 30, 2021 ` 12.9348
Date Period Scheme Returns
(%)
Benchmark Returns
(%)#
Additional Benchmark
Returns (%) ##
Value of ` 10,000 invested
Scheme (`)
Benchmark (`)#
Additional Benchmark
(`)##
Jun 30, 20 Last 1 Year 5.73 4.90 4.08 10,573 10,490 10,408Sep 28, 18 Since Inception 9.79 10.43 10.07 12,935 13,144 13,027
# CRISIL Composite Bond Fund Index ## CRISIL 10 year Gilt Index. The scheme is managed by Mr. Anupam Joshi since inception.
ANIL BAMBOLI
HDFC DYNAMIC DEBT FUND NAV as on Jun 30, 2021 ` 76.6196
Date Period Scheme Returns
(%)
Benchmark Returns
(%)#
Additional Benchmark
Returns (%) ##
Value of ` 10,000 invested
Scheme (`)
Benchmark (`)#
Additional Benchmark
(`)##
Jun 30, 20 Last 1 Year 10.55 5.29 4.08 11,055 10,529 10,408Jun 29, 18 Last 3 Years 8.05 9.65 9.61 12,622 13,192 13,174Jun 30, 16 Last 5 Years 7.25 8.35 7.25 14,195 14,939 14,192Jan 01, 13 Since Inception 8.44 8.67 7.24 19,916 20,270 18,108
# CRISIL Dynamic Debt Index ## CRISIL 10 year Gilt Index.
Past performance may or may not be sustained in the future. Returns greater than 1 year period are compounded annualized (CAGR). Different plans viz. Regular Plan and Direct Plan have a different expense structure. The expenses of the Direct Plan under the Scheme will be lower to the extent of the distribution expenses / commission charged in the Regular Plan. Load is not taken into consideration for computation of performance. Since Inception Date = Date of First allotment in the Scheme / Plan. n.A.: not Available
Performance of close-ended schemes, being close-ended in nature, is not strictly comparable with that of open-ended schemes since the investment strategy for close-ended schemes is primarily buy-and-hold whereas open-ended schemes are actively managed.
ANUPAM JOSHI....CONTINUED

76 June 2021
SCHEME PERFORMANCE - DIRECT PLAN - GROWTH OPTION (FUND MANAGER-WISE)
HDFC SHORT TERM DEBT FUND NAV as on Jun 30, 2021 ` 25.3512
Date Period Scheme Returns
(%)
Benchmark Returns
(%)#
Additional Benchmark
Returns (%) ##
Value of ` 10,000 invested
Scheme (`)
Benchmark (`)#
Additional Benchmark
(`)##
Jun 30, 20 Last 1 Year 6.79 5.67 4.08 10,679 10,567 10,408Jun 29, 18 Last 3 Years 9.13 8.71 9.61 13,001 12,852 13,174Jun 30, 16 Last 5 Years 8.36 7.92 7.25 14,942 14,642 14,192Jan 01, 13 Since Inception 8.73 8.41 7.24 20,366 19,868 18,108
# CRISIL Short Term Bond Fund Index ## CRISIL 10 year Gilt Index.
HDFC ULTRA SHORT TERM FUND NAV as on Jun 30, 2021 ` 12.0567
Date Period Scheme Returns
(%)
Benchmark Returns
(%)#
Additional Benchmark
Returns (%) ##
Value of ` 10,000 invested
Scheme (`)
Benchmark (`)#
Additional Benchmark
(`)##
Jun 30, 20 Last 1 Year 4.58 4.55 3.58 10,458 10,455 10,358Sep 25, 18 Since Inception 7.00 6.71 6.48 12,057 11,966 11,896
# CRISIL Ultra Short Term Debt Index ## CRISIL 1 year T-Bill Index. The scheme is managed by Mr. Anil Bamboli since inception.
HDFC GILT FUND NAV as on Jun 30, 2021 ` 45.3361
Date Period Scheme Returns
(%)
Benchmark Returns
(%)#
Additional Benchmark
Returns (%) ##
Value of ` 10,000 invested
Scheme (`)
Benchmark (`)#
Additional Benchmark
(`)##
Jun 30, 20 Last 1 Year 3.56 3.71 4.08 10,356 10,371 10,408Jun 29, 18 Last 3 Years 8.46 9.80 9.61 12,766 13,244 13,174Jun 30, 16 Last 5 Years 7.42 7.99 7.25 14,307 14,688 14,192Jan 01, 13 Since Inception 8.32 8.22 7.24 19,729 19,567 18,108
# CRISIL Dynamic Gilt Index ## CRISIL 10 year Gilt Index.
HDFC BANkING AND PSU DEBT FUND NAV as on Jun 30, 2021 ` 18.5418
Date Period Scheme Returns
(%)
Benchmark Returns
(%)#
Additional Benchmark
Returns (%) ##
Value of ` 10,000 invested
Scheme (`)
Benchmark (`)#
Additional Benchmark
(`)##
Jun 30, 20 Last 1 Year 6.51 5.52 4.08 10,651 10,552 10,408Jun 29, 18 Last 3 Years 9.40 8.62 9.61 13,101 12,820 13,174Jun 30, 16 Last 5 Years 8.55 7.63 7.25 15,077 14,448 14,192Mar 26, 14 Since Inception 8.87 8.29 8.33 18,542 17,837 17,887
# nIFTY Banking & PSU Index ## CRISIL 10 year Gilt Index.
HDFC OVERNIGHT FUND NAV as on Jun 30, 2021 ` 3082.1086
Date Period Scheme Returns
(%)
Benchmark Returns
(%)#
Additional Benchmark
Returns (%) ##
Value of ` 10,000 invested
Scheme (`)
Benchmark (`)#
Additional Benchmark
(`)##
Jun 23, 21 Last 7 days 3.14 3.24 4.17 10,006 10,006 10,008Jun 15, 21 Last 15 days 3.17 3.26 1.36 10,013 10,013 10,006May 31, 21 Last 1 Month 3.16 3.25 2.45 10,026 10,027 10,020Jun 30, 20 Last 1 Year 3.08 3.18 3.58 10,308 10,318 10,358Jun 29, 18 Last 3 Years 4.58 4.65 6.39 11,440 11,465 12,047Jun 30, 16 Last 5 Years 5.16 5.21 6.30 12,861 12,890 13,576Dec 31, 12 Since Inception 6.23 6.31 6.79 16,710 16,818 17,487
Returns less than 1 year period are simple annualized. # CRISIL Overnight Index ## CRISIL 1 year T-Bill Index.
HDFC FMP 1846D AUGUST 2013 (1) NAV as on Jun 30, 2021 ` 20.2989
Date Period Scheme Returns
(%)
Benchmark Returns
(%)#
Additional Benchmark
Returns (%) ##
Value of ` 10,000 invested
Scheme (`)
Benchmark (`)#
Additional Benchmark
(`)##
Jun 30, 20 Last 1 Year 12.64 4.90 4.08 11,264 10,490 10,408Jun 29, 18 Last 3 Years 9.81 9.82 9.61 13,248 13,251 13,174Jun 30, 16 Last 5 Years 8.77 8.39 7.25 15,228 14,963 14,192Aug 14, 13 Since Inception 9.40 9.33 7.82 20,299 20,205 18,108
# CRISIL Composite Bond Fund Index ## CRISIL 10 year Gilt Index. The scheme is managed by Mr. Anil Bamboli since inception.
HDFC FMP 1181D APRIL 2018 (1) NAV as on Jun 30, 2021 ` 12.7237
Date Period Scheme Returns
(%)
Benchmark Returns
(%)#
Additional Benchmark
Returns (%) ##
Value of ` 10,000 invested
Scheme (`)
Benchmark (`)#
Additional Benchmark
(`)##
Jun 30, 20 Last 1 Year 4.30 4.90 4.08 10,430 10,490 10,408Jun 29, 18 Last 3 Years 8.13 9.82 9.61 12,647 13,251 13,174Apr 27, 18 Since Inception 7.87 9.39 9.21 12,724 13,302 13,231
# CRISIL Composite Bond Fund Index ## CRISIL 10 year Gilt Index. The scheme is managed by Mr. Anil Bamboli since inception.
HDFC FMP 1434D MAY 2018 (1) NAV as on Jun 30, 2021 ` 13.1127
Date Period Scheme Returns
(%)
Benchmark Returns
(%)#
Additional Benchmark
Returns (%) ##
Value of ` 10,000 invested
Scheme (`)
Benchmark (`)#
Additional Benchmark
(`)##
Jun 30, 20 Last 1 Year 5.77 4.90 4.08 10,577 10,490 10,408Jun 29, 18 Last 3 Years 9.32 9.82 9.61 13,071 13,251 13,174May 09, 18 Since Inception 9.00 9.35 9.09 13,113 13,248 13,146
# CRISIL Composite Bond Fund Index ## CRISIL 10 year Gilt Index. The scheme is managed by Mr. Anil Bamboli since inception.
HDFC FMP 1134D MAY 2018 (1) NAV as on Jun 30, 2021 ` 12.7457
Date Period Scheme Returns
(%)
Benchmark Returns
(%)#
Additional Benchmark
Returns (%) ##
Value of ` 10,000 invested
Scheme (`)
Benchmark (`)#
Additional Benchmark
(`)##
Jun 30, 20 Last 1 Year 4.19 4.90 4.08 10,419 10,490 10,408Jun 29, 18 Last 3 Years 8.12 9.82 9.61 12,644 13,251 13,174May 24, 18 Since Inception 8.13 9.70 9.48 12,746 13,327 13,246
# CRISIL Composite Bond Fund Index ## CRISIL 10 year Gilt Index. The scheme is managed by Mr. Anil Bamboli since inception.
HDFC FMP 1119D JUNE 2018 (1) NAV as on Jun 30, 2021 ` 12.7421
Date Period Scheme Returns
(%)
Benchmark Returns
(%)#
Additional Benchmark
Returns (%) ##
Value of ` 10,000 invested
Scheme (`)
Benchmark (`)#
Additional Benchmark
(`)##
Jun 30, 20 Last 1 Year 4.32 4.90 4.08 10,432 10,490 10,408Jun 29, 18 Last 3 Years 8.19 9.82 9.61 12,669 13,251 13,174Jun 08, 18 Since Inception 8.23 9.88 9.68 12,742 13,347 13,272
# CRISIL Composite Bond Fund Index ## CRISIL 10 year Gilt Index. The scheme is managed by Mr. Anil Bamboli since inception.
HDFC FMP 1280D OCTOBER 2018 (1) NAV as on Jun 30, 2021 ` 12.8553
Date Period Scheme Returns
(%)
Benchmark Returns
(%)#
Additional Benchmark
Returns (%) ##
Value of ` 10,000 invested
Scheme (`)
Benchmark (`)#
Additional Benchmark
(`)##
Jun 30, 20 Last 1 Year 5.73 4.90 4.08 10,573 10,490 10,408Oct 11, 18 Since Inception 9.67 10.39 9.99 12,855 13,086 12,959
# CRISIL Composite Bond Fund Index ## CRISIL 10 year Gilt Index. The scheme is managed by Mr. Anil Bamboli since inception.
HDFC FMP 1344D OCTOBER 2018 (1) NAV as on Jun 30, 2021 ` 12.9418
Date Period Scheme Returns
(%)
Benchmark Returns
(%)#
Additional Benchmark
Returns (%) ##
Value of ` 10,000 invested
Scheme (`)
Benchmark (`)#
Additional Benchmark
(`)##
Jun 30, 20 Last 1 Year 9.71 4.90 4.08 10,971 10,490 10,408Oct 24, 18 Since Inception 10.08 10.27 9.72 12,942 13,001 12,827
# CRISIL Composite Bond Fund Index ## CRISIL 10 year Gilt Index. The scheme is managed by Mr. Anil Bamboli since inception.
Past performance may or may not be sustained in the future. Returns greater than 1 year period are compounded annualized (CAGR). Different plans viz. Regular Plan and Direct Plan have a different expense structure. The expenses of the Direct Plan under the Scheme will be lower to the extent of the distribution expenses / commission charged in the Regular Plan. Load is not taken into consideration for computation of performance. Since Inception Date = Date of First allotment in the Scheme / Plan. n.A.: not Available
Performance of close-ended schemes, being close-ended in nature, is not strictly comparable with that of open-ended schemes since the investment strategy for close-ended schemes is primarily buy-and-hold whereas open-ended schemes are actively managed.
ANIL BAMBOLI....CONTINUED

June 2021 77
SCHEME PERFORMANCE - DIRECT PLAN - GROWTH OPTION (FUND MANAGER-WISE)
HDFC FMP 1274D OCTOBER 2018 (1) NAV as on Jun 30, 2021 ` 12.8237
Date Period Scheme Returns
(%)
Benchmark Returns
(%)#
Additional Benchmark
Returns (%) ##
Value of ` 10,000 invested
Scheme (`)
Benchmark (`)#
Additional Benchmark
(`)##
Jun 30, 20 Last 1 Year 5.54 4.90 4.08 10,554 10,490 10,408Oct 17, 18 Since Inception 9.63 10.31 9.80 12,824 13,040 12,878
# CRISIL Composite Bond Fund Index ## CRISIL 10 year Gilt Index. The scheme is managed by Mr. Anil Bamboli since inception.
HDFC FMP 1261D OCTOBER 2018 (1) NAV as on Jun 30, 2021 ` 12.6885
Date Period Scheme Returns
(%)
Benchmark Returns
(%)#
Additional Benchmark
Returns (%) ##
Value of ` 10,000 invested
Scheme (`)
Benchmark (`)#
Additional Benchmark
(`)##
Jun 30, 20 Last 1 Year 5.20 4.90 4.08 10,520 10,490 10,408Oct 25, 18 Since Inception 9.28 10.27 9.71 12,689 12,997 12,821
# CRISIL Composite Bond Fund Index ## CRISIL 10 year Gilt Index. The scheme is managed by Mr. Anil Bamboli since inception.
HDFC FMP 1260D OCTOBER 2018 (1) NAV as on Jun 30, 2021 ` 12.7721
Date Period Scheme Returns
(%)
Benchmark Returns
(%)#
Additional Benchmark
Returns (%) ##
Value of ` 10,000 invested
Scheme (`)
Benchmark (`)#
Additional Benchmark
(`)##
Jun 30, 20 Last 1 Year 5.68 4.90 4.08 10,568 10,490 10,408Oct 31, 18 Since Inception 9.61 10.27 9.69 12,772 12,976 12,796
# CRISIL Composite Bond Fund Index ## CRISIL 10 year Gilt Index. The scheme is managed by Mr. Anil Bamboli since inception.
HDFC FMP 1265D OCTOBER 2018 (1) NAV as on Jun 30, 2021 ` 12.7942
Date Period Scheme Returns
(%)
Benchmark Returns
(%)#
Additional Benchmark
Returns (%) ##
Value of ` 10,000 invested
Scheme (`)
Benchmark (`)#
Additional Benchmark
(`)##
Jun 30, 20 Last 1 Year 5.70 4.90 4.08 10,570 10,490 10,408nov 01, 18 Since Inception 9.69 10.23 9.61 12,794 12,960 12,768
# CRISIL Composite Bond Fund Index ## CRISIL 10 year Gilt Index. The scheme is managed by Mr. Anil Bamboli since inception.
HDFC FMP 1246D NOVEMBER 2018 (1) NAV as on Jun 30, 2021 ` 12.6845
Date Period Scheme Returns
(%)
Benchmark Returns
(%)#
Additional Benchmark
Returns (%) ##
Value of ` 10,000 invested
Scheme (`)
Benchmark (`)#
Additional Benchmark
(`)##
Jun 30, 20 Last 1 Year 5.62 4.90 4.08 10,562 10,490 10,408nov 20, 18 Since Inception 9.54 10.13 9.56 12,685 12,864 12,691
# CRISIL Composite Bond Fund Index ## CRISIL 10 year Gilt Index. The scheme is managed by Mr. Anil Bamboli since inception.
HDFC FMP 1232D NOVEMBER 2018 (1) NAV as on Jun 30, 2021 ` 12.6593
Date Period Scheme Returns
(%)
Benchmark Returns
(%)#
Additional Benchmark
Returns (%) ##
Value of ` 10,000 invested
Scheme (`)
Benchmark (`)#
Additional Benchmark
(`)##
Jun 30, 20 Last 1 Year 5.60 4.90 4.08 10,560 10,490 10,408nov 28, 18 Since Inception 9.54 9.94 9.17 12,659 12,781 12,551
# CRISIL Composite Bond Fund Index ## CRISIL 10 year Gilt Index. The scheme is managed by Mr. Anil Bamboli since inception.
HDFC FMP 1224D DECEMBER 2018 (1) NAV as on Jun 30, 2021 ` 12.5532
Date Period Scheme Returns
(%)
Benchmark Returns
(%)#
Additional Benchmark
Returns (%) ##
Value of ` 10,000 invested
Scheme (`)
Benchmark (`)#
Additional Benchmark
(`)##
Jun 30, 20 Last 1 Year 5.46 4.90 4.08 10,546 10,490 10,408Dec 06, 18 Since Inception 9.26 9.55 8.59 12,553 12,639 12,355
# CRISIL Composite Bond Fund Index ## CRISIL 10 year Gilt Index. The scheme is managed by Mr. Anil Bamboli since inception.
HDFC FMP 1218D DECEMBER 2018 (1)NAV as on Jun 30, 2021 ` 12.5642
Date Period Scheme Returns
(%)
Benchmark Returns
(%)#
Additional Benchmark
Returns (%) ##
Value of ` 10,000 invested
Scheme (`)
Benchmark (`)#
Additional Benchmark
(`)##
Jun 30, 20 Last 1 Year 5.59 4.90 4.08 10,559 10,490 10,408Dec 12, 18 Since Inception 9.36 9.62 8.56 12,564 12,640 12,331
# CRISIL Composite Bond Fund Index ## CRISIL 10 year Gilt Index. The scheme is managed by Mr. Anil Bamboli since inception.
HDFC FMP 1211D DECEMBER 2018 (1) NAV as on Jun 30, 2021 ` 12.5014
Date Period Scheme Returns
(%)
Benchmark Returns
(%)#
Additional Benchmark
Returns (%) ##
Value of ` 10,000 invested
Scheme (`)
Benchmark (`)#
Additional Benchmark
(`)##
Jun 30, 20 Last 1 Year 5.59 4.90 4.08 10,559 10,490 10,408Dec 19, 18 Since Inception 9.22 9.34 8.05 12,501 12,538 12,165
# CRISIL Composite Bond Fund Index ## CRISIL 10 year Gilt Index. The scheme is managed by Mr. Anil Bamboli since inception.
HDFC FMP 1203D DECEMBER 2018 (1) NAV as on Jun 30, 2021 ` 12.4770
Date Period Scheme Returns
(%)
Benchmark Returns
(%)#
Additional Benchmark
Returns (%) ##
Value of ` 10,000 invested
Scheme (`)
Benchmark (`)#
Additional Benchmark
(`)##
Jun 30, 20 Last 1 Year 5.69 4.90 4.08 10,569 10,490 10,408Dec 27, 18 Since Inception 9.22 9.35 8.21 12,477 12,514 12,189
# CRISIL Composite Bond Fund Index ## CRISIL 10 year Gilt Index. The scheme is managed by Mr. Anil Bamboli since inception.
HDFC FMP 1196D DECEMBER 2018 (1) NAV as on Jun 30, 2021 ` 12.4633
Date Period Scheme Returns
(%)
Benchmark Returns
(%)#
Additional Benchmark
Returns (%) ##
Value of ` 10,000 invested
Scheme (`)
Benchmark (`)#
Additional Benchmark
(`)##
Jun 30, 20 Last 1 Year 5.81 4.90 4.08 10,581 10,490 10,408Jan 03, 19 Since Inception 9.24 9.60 8.64 12,463 12,564 12,291
# CRISIL Composite Bond Fund Index ## CRISIL 10 year Gilt Index. The scheme is managed by Mr. Anil Bamboli since inception.
HDFC FMP 1190D JANUARY 2019 (1) NAV as on Jun 30, 2021 ` 12.4460
Date Period Scheme Returns
(%)
Benchmark Returns
(%)#
Additional Benchmark
Returns (%) ##
Value of ` 10,000 invested
Scheme (`)
Benchmark (`)#
Additional Benchmark
(`)##
Jun 30, 20 Last 1 Year 6.04 4.90 4.08 10,604 10,490 10,408Jan 09, 19 Since Inception 9.25 9.58 8.77 12,446 12,540 12,311
# CRISIL Composite Bond Fund Index ## CRISIL 10 year Gilt Index. The scheme is managed by Mr. Anil Bamboli since inception.
HDFC FMP 1182D JANUARY 2019 (1) NAV as on Jun 30, 2021 ` 12.4225
Date Period Scheme Returns
(%)
Benchmark Returns
(%)#
Additional Benchmark
Returns (%) ##
Value of ` 10,000 invested
Scheme (`)
Benchmark (`)#
Additional Benchmark
(`)##
Jun 30, 20 Last 1 Year 5.99 4.90 4.08 10,599 10,490 10,408Jan 17, 19 Since Inception 9.25 9.69 9.00 12,423 12,545 12,353
# CRISIL Composite Bond Fund Index ## CRISIL 10 year Gilt Index. The scheme is managed by Mr. Anil Bamboli since inception.
HDFC FMP 1175D JANUARY 2019 (1) NAV as on Jun 30, 2021 ` 12.3968
Date Period Scheme Returns
(%)
Benchmark Returns
(%)#
Additional Benchmark
Returns (%) ##
Value of ` 10,000 invested
Scheme (`)
Benchmark (`)#
Additional Benchmark
(`)##
Jun 30, 20 Last 1 Year 6.04 4.90 4.08 10,604 10,490 10,408Jan 23, 19 Since Inception 9.22 9.81 9.09 12,397 12,560 12,360
# CRISIL Composite Bond Fund Index ## CRISIL 10 year Gilt Index. The scheme is managed by Mr. Anil Bamboli since inception.
Past performance may or may not be sustained in the future. Returns greater than 1 year period are compounded annualized (CAGR). Different plans viz. Regular Plan and Direct Plan have a different expense structure. The expenses of the Direct Plan under the Scheme will be lower to the extent of the distribution expenses / commission charged in the Regular Plan. Load is not taken into consideration for computation of performance. Since Inception Date = Date of First allotment in the Scheme / Plan. n.A.: not Available
Performance of close-ended schemes, being close-ended in nature, is not strictly comparable with that of open-ended schemes since the investment strategy for close-ended schemes is primarily buy-and-hold whereas open-ended schemes are actively managed.
ANIL BAMBOLI....CONTINUED

78 June 2021
SCHEME PERFORMANCE - DIRECT PLAN - GROWTH OPTION (FUND MANAGER-WISE)
HDFC FMP 1168D JANUARY 2019 (1) NAV as on Jun 30, 2021 ` 12.3792
Date Period Scheme Returns
(%)
Benchmark Returns
(%)#
Additional Benchmark
Returns (%) ##
Value of ` 10,000 invested
Scheme (`)
Benchmark (`)#
Additional Benchmark
(`)##
Jun 30, 20 Last 1 Year 5.96 4.90 4.08 10,596 10,490 10,408Jan 30, 19 Since Inception 9.23 9.81 9.03 12,379 12,536 12,325
# CRISIL Composite Bond Fund Index ## CRISIL 10 year Gilt Index. The scheme is managed by Mr. Anil Bamboli since inception.
HDFC FMP 1154D FEBRUARY 2019 (1) NAV as on Jun 30, 2021 ` 12.2911
Date Period Scheme Returns
(%)
Benchmark Returns
(%)#
Additional Benchmark
Returns (%) ##
Value of ` 10,000 invested
Scheme (`)
Benchmark (`)#
Additional Benchmark
(`)##
Jun 30, 20 Last 1 Year 5.79 4.90 4.08 10,579 10,490 10,408Feb 13, 19 Since Inception 9.06 9.75 8.80 12,291 12,475 12,222
# CRISIL Composite Bond Fund Index ## CRISIL 10 year Gilt Index. The scheme is managed by Mr. Anil Bamboli since inception.
HDFC FMP 1146D FEBRUARY 2019 (1) NAV as on Jun 30, 2021 ` 12.2962
Date Period Scheme Returns
(%)
Benchmark Returns
(%)#
Additional Benchmark
Returns (%) ##
Value of ` 10,000 invested
Scheme (`)
Benchmark (`)#
Additional Benchmark
(`)##
Jun 30, 20 Last 1 Year 5.88 4.90 4.08 10,588 10,490 10,408Feb 21, 19 Since Inception 9.17 9.93 9.04 12,296 12,499 12,263
# CRISIL Composite Bond Fund Index ## CRISIL 10 year Gilt Index. The scheme is managed by Mr. Anil Bamboli since inception.
AMIT B. GANATRA
HDFC TAxSAVER NAV as on Jun 30, 2021 ` 680.202
Date Period Scheme Returns
(%)
Benchmark Returns
(%)#
Additional Benchmark
Returns (%) ##
Value of ` 10,000 invested
Scheme (`)
Benchmark (`)#
Additional Benchmark
(`)##
Jun 30, 20 Last 1 Year 52.87 60.77 54.58 15,287 16,077 15,458Jun 29, 18 Last 3 Years 9.84 15.00 15.00 13,260 15,220 15,220Jun 30, 16 Last 5 Years 11.60 15.40 15.08 17,314 20,473 20,191Jan 01, 13 Since Inception 12.69 14.26 13.51 27,604 31,041 29,351
# nIFTY 500 (Total Returns Index) ## nIFTY 50 (Total Returns Index).
HDFC CAPITAL BUILDER VALUE FUND NAV as on Jun 30, 2021 ` 413.714
Date Period Scheme Returns
(%)
Benchmark Returns
(%)#
Additional Benchmark
Returns (%) ##
Value of ` 10,000 invested
Scheme (`)
Benchmark (`)#
Additional Benchmark
(`)##
Jun 30, 20 Last 1 Year 63.41 60.77 54.58 16,341 16,077 15,458Jun 29, 18 Last 3 Years 11.23 15.00 15.00 13,769 15,220 15,220Jun 30, 16 Last 5 Years 14.20 15.40 15.08 19,428 20,473 20,191Jan 01, 13 Since Inception 15.94 14.26 13.51 35,143 31,041 29,351
# nIFTY 500 (Total Returns Index) ## nIFTY 50 (Total Returns Index).
HDFC EOF - II - 1126D MAY 2017 (1) NAV as on Jun 30, 2021 ` 12.7980
Date Period Scheme Returns
(%)
Benchmark Returns
(%)#
Additional Benchmark
Returns (%) ##
Value of ` 10,000 invested
Scheme (`)
Benchmark (`)#
Additional Benchmark
(`)##Jun 30, 20 Last 1 Year 47.68 54.58 52.38 14,768 15,458 15,238Jun 29, 18 Last 3 Years 9.09 15.00 15.32 12,988 15,220 15,350Jun 15, 17 Since Inception 6.29 14.49 15.23 12,798 17,284 17,739
# nIFTY 50 (Total Returns Index) ## S&P BSE SEnSEx (Total Returns Index). The scheme is managed by Mr. Amit B. Ganatra from May 21, 2020.
HDFC EOF - II - 1100D JUNE 2017 (1) NAV as on Jun 30, 2021 ` 12.2630
Date Period Scheme Returns
(%)
Benchmark Returns
(%)#
Additional Benchmark
Returns (%) ##
Value of ` 10,000 invested
Scheme (`)
Benchmark (`)#
Additional Benchmark
(`)##Jun 30, 20 Last 1 Year 43.14 54.58 52.38 14,314 15,458 15,238Jun 29, 18 Last 3 Years 8.81 15.00 15.32 12,889 15,220 15,350Jul 17, 17 Since Inception 5.29 13.74 14.56 12,263 16,640 17,120
# nIFTY 50 (Total Returns Index) ## S&P BSE SEnSEx (Total Returns Index). The scheme is managed by Mr. Amit B. Ganatra from May 21, 2020.
RAkESH VYAS
HDFC INFRASTRUCTURE FUND NAV as on Jun 30, 2021 ` 19.441
Date Period Scheme Returns
(%)
Benchmark Returns
(%)#
Additional Benchmark
Returns (%) ##
Value of ` 10,000 invested
Scheme (`)
Benchmark (`)#
Additional Benchmark
(`)##Jun 30, 20 Last 1 Year 73.67 60.77 54.58 17,367 16,077 15,458Jun 29, 18 Last 3 Years 4.05 15.00 15.00 11,268 15,220 15,220Jun 30, 16 Last 5 Years 3.97 15.40 15.08 12,148 20,473 20,191Jan 01, 13 Since Inception 6.76 14.26 13.51 17,433 31,041 29,351
# nIFTY 500 (Total Returns Index) ## nIFTY 50 (Total Returns Index).
HDFC HOUSING OPPORTUNITIES FUND € NAV as on Jun 30, 2021 ` 12.1600
Date Period Scheme Returns
(%)
Benchmark Returns
(%)#
Additional Benchmark
Returns (%) ##
Value of ` 10,000 invested
Scheme (`)
Benchmark (`)#
Additional Benchmark
(`)##Jun 30, 20 Last 1 Year 62.74 79.61 54.58 16,274 17,961 15,458Jun 29, 18 Last 3 Years 10.05 17.67 15.00 13,333 16,308 15,220Dec 06, 17 Since Inception 5.64 15.02 14.82 12,160 16,475 16,370
# India Housing & Allied Businesses Index ## nIFTY 50 (Total Returns Index) € HDFC Housing opportunities Fund was launched as a close ended thematic Equity Scheme. The Scheme has been converted into open-ended scheme on January 19, 2021.
GOPAL AGRAWAL
HDFC FOCUSED 30 FUND NAV as on Jun 30, 2021 ` 104.820
Date Period Scheme Returns
(%)
Benchmark Returns
(%)#
Additional Benchmark
Returns (%) ##
Value of ` 10,000 invested Scheme
(`)Benchmark
(`)#Additional
Benchmark (`)##
Jun 30, 20 Last 1 Year 55.72 60.77 52.38 15,572 16,077 15,238Jun 29, 18 Last 3 Years 9.68 15.00 15.32 13,199 15,220 15,350Jun 30, 16 Last 5 Years 10.68 15.40 15.58 16,614 20,473 20,639Jan 01, 13 Since Inception 11.90 14.26 13.82 26,009 31,041 30,051
# nIFTY 500 (Total Returns Index) ## S&P BSE SEnSEx (Total Returns Index).
HDFC LARGE AND MID CAP FUND (ERSTWHILE HDFC GROWTH OPPORTUNITIES FUND) €
NAV as on Jun 30, 2021 ` 167.275
Date Period Scheme Returns
(%)
Benchmark Returns
(%)#
Additional Benchmark
Returns (%) ##
Value of ` 10,000 invested Scheme
(`)Benchmark
(`)#Additional
Benchmark (`)##
Jun 30, 20 Last 1 Year 70.29 67.87 52.38 17,029 16,787 15,238Jun 29, 18 Last 3 Years 15.56 16.18 15.32 15,444 15,694 15,350Jun 30, 16 Last 5 Years 13.81 16.74 15.58 19,102 21,692 20,639Jan 01, 13 Since Inception 11.38 16.18 13.82 24,994 35,760 30,051
# nIFTY Large Midcap 250 (Total Returns Index) ## S&P BSE SEnSEx (Total Returns Index). The Scheme, formerly a large cap fund, has undergone change in Fundamental attributes w.e.f. May 23, 2018 and become a Large and Mid-cap Fund. Accordingly, the Scheme’s benchmark has also changed. Hence, the past performance of the Scheme may not strictly be comparable with that of the new benchmark. € HDFC Growth Opportunities Fund has been renamed as HDFC Large and Mid Cap Fund w.e.f. June 28, 2021.
Past performance may or may not be sustained in the future. Returns greater than 1 year period are compounded annualized (CAGR). Different plans viz. Regular Plan and Direct Plan have a different expense structure. The expenses of the Direct Plan under the Scheme will be lower to the extent of the distribution expenses / commission charged in the Regular Plan. Load is not taken into consideration for computation of performance. Since Inception Date = Date of First allotment in the Scheme / Plan. n.A.: not Available
ANIL BAMBOLI....CONTINUED
Performance of close-ended schemes, being close-ended in nature, is not strictly comparable with that of open-ended schemes since the investment strategy for close-ended schemes is primarily buy-and-hold whereas open-ended schemes are actively managed.

June 2021 79
SCHEME PERFORMANCE - DIRECT PLAN - GROWTH OPTION (FUND MANAGER-WISE)
kRISHAN kUMAR DAGA
HDFC GOLD FUND NAV as on Jun 30, 2021 ` 15.2941
Date Period Scheme Returns (%)
Benchmark Returns
(%)#
Value of ` 10,000 invested
Scheme (`)
Benchmark (`)#
Jun 30, 20 Last 1 Year -4.62 -3.74 9,538 9,626Jun 29, 18 Last 3 Years 14.48 15.40 15,015 15,382Jun 30, 16 Last 5 Years 7.96 8.13 14,671 14,782Jan 01, 13 Since Inception 3.89 5.14 13,830 15,312
# Domestic Price of Physical Gold. The scheme is managed by Mr. Krishan Kumar Daga since October 19, 2015.
CO-MANAGED BY CHIRAG SETALVAD & SHOBHIT MEHROTRA
HDFC RETIREMENT SAVINGS FUND - EQUITY PLAN
NAV as on Jun 30, 2021 ` 28.170
Date Period Scheme Returns
(%)
Benchmark Returns
(%)#
Additional Benchmark
Returns (%) ##
Value of ` 10,000 invested
Scheme (`)
Benchmark (`)#
Additional Benchmark
(`)##Jun 30, 20 Last 1 Year 72.84 60.77 54.58 17,284 16,077 15,458Jun 29, 18 Last 3 Years 18.51 15.00 15.00 16,662 15,220 15,220Jun 30, 16 Last 5 Years 18.47 15.40 15.08 23,345 20,473 20,191Feb 25, 16 Since Inception 21.37 18.44 17.96 28,170 24,721 24,192
# nIFTY 500 (Total Returns Index) ## nIFTY 50 (Total Returns Index).
HDFC RETIREMENTSAVINGS FUND - HYBRID EQUITY PLAN
NAV as on Jun 30, 2021 ` 25.330
Date Period Scheme Returns
(%)
Benchmark Returns
(%)#
Additional Benchmark
Returns (%) ##
Value of ` 10,000 invested
Scheme (`)
Benchmark (`)#
Additional Benchmark
(`)##Jun 30, 20 Last 1 Year 50.69 35.83 54.58 15,069 13,583 15,458Jun 29, 18 Last 3 Years 16.01 14.07 15.00 15,624 14,854 15,220Jun 30, 16 Last 5 Years 16.53 13.25 15.08 21,495 18,635 20,191Feb 25, 16 Since Inception 18.98 15.26 17.96 25,330 21,369 24,192
# nIFTY 50 Hybrid Composite Debt 65:35 Index ## nIFTY 50 (Total Returns Index).
HDFC RETIREMENT SAVINGS FUND - HYBRID DEBT PLAN
NAV as on Jun 30, 2021 ` 17.1187
Date Period Scheme Returns
(%)
Benchmark Returns
(%)#
Additional Benchmark
Returns (%) ##
Value of ` 10,000 invested
Scheme (`)
Benchmark (`)#
Additional Benchmark
(`)##Jun 30, 20 Last 1 Year 16.37 12.17 4.08 11,637 11,217 10,408Jun 29, 18 Last 3 Years 9.97 11.21 9.61 13,307 13,762 13,174Jun 30, 16 Last 5 Years 9.91 9.62 7.25 16,043 15,834 14,192Feb 26, 16 Since Inception 10.58 10.42 7.72 17,119 16,984 14,884
# nIFTY 50 Hybrid Composite Debt 15:85 Index ## CRISIL 10 Year Gilt Index.
CO-MANAGED BY AMIT B. GANATRA, ANIL BAMBOLI,
kRISHAN kUMAR DAGA & ARUN AGARWAL
HDFC MULTI - ASSET FUND NAV as on Jun 30, 2021 ` 46.7570
Date Period Scheme Returns
(%)
Benchmark Returns
(%)#
Additional Benchmark
Returns (%) ##
Value of ` 10,000 invested Scheme
(`)Benchmark
(`)#Additional
Benchmark (`)##
Jun 30, 20 Last 1 Year 38.75 31.41 54.58 13,875 13,141 15,458Jun 29, 18 Last 3 Years 13.78 14.41 15.00 14,741 14,987 15,220Jun 30, 16 Last 5 Years 11.34 12.88 15.08 17,117 18,331 20,191Jan 01, 13 Since Inception 11.08 11.61 13.51 24,417 25,437 29,351
# 90% NIFTY 50 Hybrid Composite Debt 65:35 Index + 10% Domestic Price of Gold ## nIFTY 50 (Total Returns Index). The Scheme formerly, a debt oriented hybrid fund, has undergone change in Fundamental attributes w.e.f. May 23, 2018 and become a multi asset fund investing in equities, debt and gold related instruments. Accordingly, the Scheme’s benchmark and additional benchmarks have also changed. Hence, the past performance of the Scheme since inception till May 22, 2018 may not strictly be comparable with those of the new benchmark and the additional benchmark. Scheme performance may not strictly be comparable with that of its Additional Benchmark in view of hybrid nature of the scheme where a portion of scheme’s investments are made in debt instruments and gold related instruments.
CO-MANAGED BY GOPAL AGRAWAL, ARUN AGARWAL,
kRISHAN kUMAR DAGA & ANIL BAMBOLI
HDFC EQUITY SAVINGS FUND NAV as on Jun 30, 2021 ` 49.3270
Date Period Scheme Returns
(%)
Benchmark Returns
(%)#
Additional Benchmark
Returns (%) ##
Value of ` 10,000 invested Scheme
(`)Benchmark
(`)#Additional
Benchmark (`)##
Jun 30, 20 Last 1 Year 29.56 17.83 4.08 12,956 11,783 10,408Jun 29, 18 Last 3 Years 10.59 9.46 9.61 13,534 13,122 13,174Jun 30, 16 Last 5 Years 11.72 9.10 7.25 17,411 15,460 14,192Jan 01, 13 Since Inception 10.54 9.29 7.24 23,431 21,284 18,108
# 40% NIFTY 50 Arbitrage Index, 30% CRISIL Short Term Bond Fund Index and 30% NIFTY 50 (Total Returns Index) ## CRISIL 10 year Gilt Index. Scheme performance may not strictly be comparable with that of its Additional Benchmark, since a portion of scheme’s investments are made in equity instruments.
CO-MANAGED BY PRASHANT JAIN & SHOBHIT MEHROTRA
HDFC HYBRID DEBT FUND NAV as on Jun 30, 2021 ` 59.0861
Date Period Scheme Returns
(%)
Benchmark Returns
(%)#
Additional Benchmark
Returns (%) ##
Value of ` 10,000 invested Scheme
(`)Benchmark
(`)#Additional
Benchmark (`)##
Jun 30, 20 Last 1 Year 22.94 12.17 4.08 12,294 11,217 10,408Jun 29, 18 Last 3 Years 10.48 11.21 9.61 13,493 13,762 13,174Jun 30, 16 Last 5 Years 9.31 9.62 7.25 15,613 15,834 14,192Jan 01, 13 Since Inception 9.91 9.48 7.24 22,318 21,586 18,108
# nIFTY 50 Hybrid Composite Debt 15:85 Index ## CRISIL 10 year Gilt Index. Refer to note on performance disclosure on Page no. 36.
Past performance may or may not be sustained in the future. Returns greater than 1 year period are compounded annualized (CAGR). Different plans viz. Regular Plan and Direct Plan have a different expense structure. The expenses of the Direct Plan under the Scheme will be lower to the extent of the distribution expenses / commission charged in the Regular Plan. Load is not taken into consideration for computation of performance. Since Inception Date = Date of First allotment in the Scheme / Plan. n.A.: not Available
Performance of close-ended schemes, being close-ended in nature, is not strictly comparable with that of open-ended schemes since the investment strategy for close-ended schemes is primarily buy-and-hold whereas open-ended schemes are actively managed.

80 June 2021
Managing Portfolio Since
Returns (%) (As on June 30, 2021)
Last 1 year (%) Last 3 years (%) Last 5 years (%)
Permitted Category FPI Portfolio (managed under a bilateral agreement under Regulation 24(b) and subject to applicable laws)
March 22, 2016 61.82 16.13 14.55
Benchmark- MSCI India (Total Returns) 54.50 15.16 14.14
Past performance may or may not be sustained in the future. Returns greater than 1 year period are compounded annualised (CAGR). The above returns are computed using the Time Weighted Rate of Return (TWRR) methodology, to make them more comparable with the mutual fund scheme's returns. Inception date is March 22, 2016. The performance is not comparable with the performance of the aforementioned scheme(s) of HDFC Mutual Fund due to differing investment objective/s and fundamental differences in asset allocation, investment strategy and the regulatory environment. The said disclosure is pursuant to SEBI Circular no. Cir/IMD/DF/7/2012 dated February 28, 2012 pertaining to Regulation 24(b) of SEBI (Mutual Funds) Regulations, 1996. FPI - Foreign Portfolio Investor.
PERFORMANCE OF PERMITTED CATEGORY FPI PORTFOLIO (MANAGED BY PRASHANT JAIN)
SCHEME PERFORMANCE - DIRECT PLAN - GROWTH OPTION (FUND MANAGER-WISE)
CO-MANAGED BY ANIL BAMBOLI & AMIT B. GANATRA
HDFC DYNAMIC PE RATIO FUND OF FUNDS NAV as on Jun 30, 2021 ` 26.688
Date Period Scheme Returns
(%)
Benchmark Returns
(%)#
Additional Benchmark
Returns (%) ##
Value of ` 10,000 invested Scheme
(`)Benchmark
(`)#Additional
Benchmark (`)##
Jun 30, 20 Last 1 Year 38.71 35.83 54.58 13,871 13,583 15,458Jun 29, 18 Last 3 Years 13.85 14.07 15.00 14,768 14,854 15,220Jun 30, 16 Last 5 Years 12.86 13.25 15.08 18,318 18,635 20,191Jan 01, 13 Since Inception 11.13 12.16 13.51 24,528 26,514 29,351
# nIFTY 50 Hybrid Composite Debt 65:35 Index ## nIFTY 50 (Total Returns Index). Scheme performance may not strictly be comparable with that of its Additional Benchmark in view of hybrid nature of the scheme where a portion of scheme’s investments are made in equity instruments. The scheme is co-managed by Mr. Amit B. Ganatra from May 21, 2020 & Mr. Anil Bamboli from June 28, 2014.
CO-MANAGED BY SHOBHIT MEHROTRA & VIkASH AGARWAL
HDFC FLOATING RATE DEBT FUND NAV as on Jun 30, 2021 ` 38.8550
Date Period Scheme Returns
(%)
Benchmark Returns
(%)#
Additional Benchmark
Returns (%) ##
Value of ` 10,000 invested
Scheme (`)
Benchmark (`)#
Additional Benchmark
(`)##
Jun 30, 20 Last 1 Year 6.64 3.71 4.08 10,664 10,371 10,408Jun 29, 18 Last 3 Years 8.08 5.70 9.61 12,632 11,813 13,174Jun 30, 16 Last 5 Years 7.83 6.19 7.25 14,583 13,505 14,192Jan 01, 13 Since Inception 8.37 7.22 7.24 19,794 18,081 18,108
# CRISIL Liquid Fund Index ## CRISIL 10 year Gilt Index. The Scheme is co-managed by Shobhit Mehrotra & Vikash Agarwal from July 01, 2020.
CO-MANAGED BY ANIL BAMBOLI & VIkASH AGARWAL
HDFC MONEY MARkET FUND NAV as on Jun 30, 2021 ` 4518.1507
Date Period Scheme Returns
(%)
Benchmark Returns
(%)#
Additional Benchmark
Returns (%) ##
Value of ` 10,000 invested
Scheme (`)
Benchmark (`)#
Additional Benchmark
(`)##
Jun 30, 20 Last 1 Year 4.34 3.75 3.58 10,434 10,375 10,358Jun 29, 18 Last 3 Years 6.99 5.99 6.39 12,252 11,911 12,047Jun 30, 16 Last 5 Years 6.96 6.36 6.30 13,999 13,613 13,576Dec 31, 12 Since Inception 7.73 7.38 6.79 18,832 18,323 17,487
# nIFTY Money Market Index ## CRISIL 1 year T-Bill Index. The Scheme is co-managed by Anil Bamboli & Vikash Agarwal from July 01, 2020.
CO-MANAGED BY kRISHAN kUMAR DAGA & ARUN AGARWAL
HDFC ARBITRAGE FUND - WHOLESALE PLAN NAV as on Jun 30, 2021 ` 15.643
Date Period Scheme Returns
(%)
Benchmark Returns
(%)#
Additional Benchmark
Returns (%) ##
Value of ` 10,000 invested
Scheme (`)
Benchmark (`)#
Additional Benchmark
(`)##
Jun 30, 20 Last 1 Year 4.01 3.51 3.58 10,401 10,351 10,358Jun 29, 18 Last 3 Years 5.39 4.69 6.39 11,710 11,476 12,047Jun 30, 16 Last 5 Years 5.79 4.75 6.30 13,253 12,610 13,576Apr 07, 14 Since Inception 6.38 5.66 6.88 15,643 14,898 16,183
# nIFTY 50 Arbitrage Index ## CRISIL 1 year T-Bill Index. Scheme performance is not strictly comparable with that of its Additional Benchmark since the scheme does not take directional call in equity markets but is limited to availing arbitrage opportunities, etc.
HDFC INDEx FUND - SENSEx PLAN NAV as on Jun 30, 2021 ` 478.2328
Date Period Scheme Returns
(%)
Benchmark Returns
(%)#
Additional Benchmark
Returns (%) ##
Value of ` 10,000 invested
Scheme (`)
Benchmark (`)#
Additional Benchmark
(`)##
Jun 30, 20 Last 1 Year 51.94 52.38 54.58 15,194 15,238 15,458Jun 29, 18 Last 3 Years 14.87 15.32 15.00 15,171 15,350 15,220Jun 30, 16 Last 5 Years 15.19 15.58 15.08 20,284 20,639 20,191Jan 01, 13 Since Inception 13.45 13.82 13.51 29,226 30,051 29,351
# S&P BSE SEnSEx (Total Returns Index) ## nIFTY 50 (Total Returns Index). Refer to note on performance disclosure on Page no. 25.
HDFC INDEx FUND - NIFTY 50 PLAN NAV as on Jun 30, 2021 ` 146.7214
Date Period Scheme Returns
(%)
Benchmark Returns
(%)#
Additional Benchmark
Returns (%) ##
Value of ` 10,000 invested
Scheme (`)
Benchmark (`)#
Additional Benchmark
(`)##
Jun 30, 20 Last 1 Year 54.16 54.58 52.38 15,416 15,458 15,238Jun 29, 18 Last 3 Years 14.54 15.00 15.32 15,037 15,220 15,350Jun 30, 16 Last 5 Years 14.65 15.08 15.58 19,816 20,191 20,639Jan 01, 13 Since Inception 13.14 13.51 13.82 28,557 29,351 30,051
# nIFTY 50 (Total Returns Index) ## S&P BSE SEnSEx (Total Returns Index).
Past performance may or may not be sustained in the future. Returns greater than 1 year period are compounded annualized (CAGR). Different plans viz. Regular Plan and Direct Plan have a different expense structure. The expenses of the Direct Plan under the Scheme will be lower to the extent of the distribution expenses / commission charged in the Regular Plan. Load is not taken into consideration for computation of performance. Since Inception Date = Date of First allotment in the Scheme / Plan. n.A.: not Available
Performance of close-ended schemes, being close-ended in nature, is not strictly comparable with that of open-ended schemes since the investment strategy for close-ended schemes is primarily buy-and-hold whereas open-ended schemes are actively managed.

June 2021 81
DIVIDEND HISTORY ^
HDFC Flexi Cap Fund (Past 3 years) IDCW Option
Record Date Regular Plan Direct Plan
Cum IDCW NAV (`)
IDCW per Unit (`) For Cum IDCW NAV (`)
IDCW per Unit (`) For
Individuals & HUF Others Individuals & HUF Others
Mar 20, 19 56.417 5.25 5.25 60.153 5.25 5.25Mar 19, 20 33.678 4.250 4.250 36.364 4.250 4.250 Mar 18, 21 52.126 5.000 5.000 57.269 5.000 5.000
HDFC Top 100 Fund (Past 3 years) IDCW Option
Record Date Regular Plan Direct Plan
Cum IDCW NAV (`)
IDCW per Unit (`) For Cum IDCW NAV (`)
IDCW per Unit (`) For
Individuals & HUF Others Individuals & HUF Others
Mar 07, 19 52.212 5.50 5.50 55.052 5.50 5.50Mar 12, 20 43.674 5.00 5.00 46.622 5.00 5.00 Mar 04, 21 50.790 5.00 5.00 55.066 5.00 5.00
HDFC Capital Builder Value Fund (Past 3 years) IDCW Option
Record Date Regular Plan Direct Plan
Cum IDCW NAV (`)
IDCW per Unit (`) For Cum IDCW NAV (`)
IDCW per Unit (`) For
Individuals & HUF Others Individuals & HUF Others
Feb 21, 19 26.710 2.75 2.75 28.618 2.75 2.75Feb 20, 20 24.565 2.75 2.75 26.809 2.75 2.75Feb 18, 21 26.933 2.75 2.75 30.026 2.75 2.75
HDFC Focused 30 Fund (Past 3 years) IDCW Option
Record Date Regular Plan Direct Plan
Cum IDCW NAV (`)
IDCW per Unit (`) For Cum IDCW NAV (`)
IDCW per Unit (`) For
Individuals & HUF Others Individuals & HUF Others
Feb 21, 19 16.853 1.75 1.75 18.257 1.75 1.75Feb 20, 20 16.110 1.75 1.75 17.776 1.75 1.75Feb 18, 21 17.040 1.75 1.75 - - -
HDFC Arbitrage Fundnormal IDCW Option (Past 3 months)
Record Date Wholesale Plan Direct Plan
Cum IDCW NAV (`)
IDCW per Unit (`) For Cum IDCW NAV (`)
IDCW per Unit (`) For
Individuals & HUF Others Individuals & HUF Others
Apr 22, 21 10.552 0.040 0.040 10.892 0.040 0.040May 20, 21 - - - 10.874 0.040 0.040Jun 17, 21 10.582 0.040 0.040 10.894 0.040 0.040
Monthly IDCW Option (Past 3 months)
Record Date Wholesale Plan Wholesale Plan - Direct Plan
Cum IDCW NAV (`)
IDCW per Unit (`) For Cum IDCW NAV (`)
IDCW per Unit (`) For
Individuals & HUF Others Individuals & HUF Others
Apr 22, 21 10.943 0.040 0.040 10.602 0.040 0.040May 20, 21 10.919 0.040 0.040 10.582 0.040 0.040Jun 17, 21 10.936 0.040 0.040 10.601 0.040 0.040
HDFC Large and Mid Cap Fund(Erstwhile HDFC Growth Opportunities Fund) (Past 3 years) IDCW Option
Record Date Regular Plan Direct Plan
Cum IDCW NAV (`)
IDCW per Unit (`) For Cum IDCW NAV (`)
IDCW per Unit (`) For
Individuals & HUF Others Individuals & HUF Others
Feb 28, 19 19.807 2.00 2.00 22.663 2.00 2.00Feb 27, 20 18.745 2.00 2.00 21.836 2.00 2.00Feb 25, 21 22.017 2.00 2.00 26.266 2.00 2.00
HDFC Mid-Cap Opportunities Fund (Past 3 years) IDCW Option
Record Date Regular Plan Direct Plan
Cum IDCW NAV (`)
IDCW per Unit (`) For Cum IDCW NAV (`)
IDCW per Unit (`) For
Individuals & HUF Others Individuals & HUF Others
Feb 28, 19 28.574 2.50 2.50 34.574 2.50 2.50Feb 27, 20 28.084 2.50 2.50 34.848 2.50 2.50Feb 25, 21 33.208 3.00 3.00 42.417 3.00 3.00
HDFC Small Cap Fund (Past 3 years) IDCW Option
Record Date Regular Plan Direct Plan
Cum IDCW NAV (`)
IDCW per Unit (`) For Cum IDCW NAV (`)
IDCW per Unit (`) For
Individuals & HUF Others Individuals & HUF Others
Mar 22, 18 28.810 2.75 2.75 30.776 1.00 1.00Mar 27, 19 25.955 2.50 2.50 30.135 0.99 0.99Mar 18, 21 27.378 2.500 2.500 35.017 2.500 2.500
HDFC Hybrid Equity Fund (Past 3 quarters) IDCW Option
Record Date Regular Plan Direct Plan
Cum IDCW NAV (`)
IDCW per Unit (`) For Cum IDCW NAV (`)
IDCW per Unit (`) For
Individuals & HUF Others Individuals & HUF Others
Dec 28, 20 12.1730 0.2500 0.2500 13.1370 0.2500 0.2500Mar 25, 21 12.6770 0.2500 0.2500 13.7220 0.2500 0.2500Jun 25, 21 13.8080 0.2500 0.2500 14.9930 0.2500 0.2500
HDFC Balanced Advantage Fund (Past 3 months) IDCW Option
Record Date Regular Plan Direct Plan
Cum IDCW NAV (`)
IDCW per Unit (`) For Cum IDCW NAV (`)
IDCW per Unit (`) For
Individuals & HUF Others Individuals & HUF Others
Apr 26, 21 25.926 0.230 0.230 28.235 0.230 0.230May 25, 21 27.906 0.230 0.230 30.427 0.230 0.230Jun 25, 21 28.366 0.230 0.230 30.965 0.230 0.230
HDFC TaxSaver (Past 3 years) IDCW Option(An open-ended equity linked savings scheme with a lock-in period of 3 years)
Record Date Regular Plan Direct Plan
Cum IDCW NAV (`)
IDCW per Unit (`) For Cum IDCW NAV (`)
IDCW per Unit (`) For
Individuals & HUF Others Individuals & HUF Others
Mar 14, 19 59.483 6.00 6.00 62.638 6.00 6.00Mar 12, 20 39.950 5.00 5.00 42.588 2.37 2.37 Mar 10, 21 53.273 5.000 5.000 62.058 3.750 3.750
HDFC Infrastructure Fund (Past 3 years) IDCW Option
Record Date Regular Plan Direct Plan
Cum IDCW NAV (`)
IDCW per Unit (`) For Cum IDCW NAV (`)
IDCW per Unit (`) For
Individuals & HUF Others Individuals & HUF Others
Mar 23, 17 14.388 1.500 1.500 17.736 1.500 1.500Mar 15, 18 14.630 1.750 1.750 18.570 1.750 1.750Mar 27, 19 11.308 1.000 1.000 14.899 1.000 1.000
HDFC Hybrid Debt Fund Monthly IDCW Option (Past 3 months)
Record Date Regular Plan Direct Plan
Cum IDCW NAV (`)
IDCW per Unit (`) For Cum IDCW NAV (`)
IDCW per Unit (`) For
Individuals & HUF Others Individuals & HUF Others
Apr 26, 21 12.9529 0.0800 0.0800 13.7586 0.0800 0.0800May 25, 21 13.3059 0.0800 0.0800 14.1433 0.0800 0.0800Jun 25, 21 13.3794 0.0800 0.0800 14.2316 0.0800 0.0800
Quarterly IDCW Option (Past 3 quarters)
Record Date Regular Plan Direct Plan
Cum IDCW NAV (`)
IDCW per Unit (`) For Cum IDCW NAV (`)
IDCW per Unit (`) For
Individuals & HUF Others Individuals & HUF Others
Dec 28, 20 13.7013 0.2400 0.2400 14.5023 0.2400 0.2400Mar 25, 21 13.7757 0.2400 0.2400 14.6102 0.2400 0.2400Jun 25, 21 14.2906 0.2400 0.2400 15.1862 0.2400 0.2400
HDFC Equity Savings Fund (Past 3 quarters) IDCW Option
Record Date Regular Plan Direct Plan
Cum IDCW NAV (`)
IDCW per Unit (`) For Cum IDCW NAV (`)
IDCW per Unit (`) For
Individuals & HUF Others Individuals & HUF Others
Dec 28, 20 11.2210 0.2200 0.2200 12.3190 0.2200 0.2200Mar 25, 21 11.4380 0.2200 0.2200 12.6020 0.2200 0.2200Jun 25, 21 12.1190 0.2200 0.2200 13.4030 0.2200 0.2200
^ Past performance may or may not be sustained in the future. There is no assurance or guarantee to Unit holders as to rate/quantum of IDCW distribution nor that the IDCWs will be paid regularly. After payment of the IDCW, the per Unit nAV falls to the extent of the payout and statutory levy, if any. Please log on to www.hdfcfund.com for Record Date-wise listing of IDCWs declared.

82 June 2021
DIVIDEND HISTORY ^
^ Past performance may or may not be sustained in the future. There is no assurance or guarantee to Unit holders as to rate/quantum of IDCW distribution nor that the IDCWs will be paid regularly. After payment of the IDCW, the per Unit nAV falls to the extent of the payout and statutory levy, if any. Please log on to www.hdfcfund.com for Record Date-wise listing of IDCWs declared.
HDFC Multi-Asset Fund (Past 3 years) IDCW Option
Record Date Regular Plan Direct Plan
Cum IDCW NAV (`)
IDCW per Unit (`) For Cum IDCW NAV (`)
IDCW per Unit (`) For
Individuals & HUF Others Individuals & HUF Others
Mar 09, 17 12.3216 0.7945 0.7361 13.1369 0.7945 0.7361Mar 01, 18 12.2077 0.7945 0.7361 13.1690 0.7945 0.7361Mar 04, 21 14.7460 1.0000 1.0000 16.3170 1.0000 1.0000
HDFC Income Fund (Past 3 quarters) Quarterly IDCW Option
Record Date Regular Plan Direct Plan
Cum IDCW NAV (`)
IDCW per Unit (`) For Cum IDCW NAV (`)
IDCW per Unit (`) For
Individuals & HUF Others Individuals & HUF Others
Dec 28, 20 11.5514 0.2000 0.2000 12.3723 0.2000 0.2000Mar 25, 21 11.2603 0.1000 0.1000 12.1004 0.1000 0.1000Jun 25, 21 11.3065 0.1000 0.1000 12.1888 0.1000 0.1000
HDFC Dynamic Debt FundQuarterly IDCW Option (Past 3 quarters)
Record Date Regular Plan Direct Plan
Cum IDCW NAV (`)
IDCW per Unit (`) For Cum IDCW NAV (`)
IDCW per Unit (`) For
Individuals & HUF Others Individuals & HUF Others
Dec 28, 20 11.9549 0.2000 0.2000 12.7980 0.2000 0.2000Mar 25, 21 11.6870 0.1000 0.1000 12.5407 0.1000 0.1000Jun 25, 21 11.7183 0.1000 0.1000 12.5944 0.1000 0.1000
Half-yearly (IDCW Option) (Past 2 years)
Record Date Regular Plan Direct Plan
Cum IDCW NAV (`)
IDCW per Unit (`) For Cum IDCW NAV (`)
IDCW per Unit (`) For
Individuals & HUF Others Individuals & HUF Others
Mar 18, 20 11.3908 0.4000 0.3704 - - -Sep 25, 20 11.4630 0.4000 0.4000 - - -Mar 25, 21 11.2591 0.3000 0.3000 12.6362 0.3000 0.3000
Yearly (IDCW Option) (Past 3 years)
Record Date Regular Plan Direct Plan
Cum IDCW NAV (`)
IDCW per Unit (`) For Cum IDCW NAV (`)
IDCW per Unit (`) For
Individuals & HUF Others Individuals & HUF Others
Mar 25, 19 12.9184 0.3500 0.3241 13.5824 0.3500 0.3241Mar 18, 20 12.9884 0.5500 0.5093 13.7778 0.5500 0.5093 Mar 25, 21 13.1613 0.7000 0.7000 14.1025 0.7000 0.7000
HDFC Corporate Bond FundQuarterly IDCW Option (Past 3 quarters)
Record Date Regular Plan Direct Plan
Cum IDCW NAV (`)
IDCW per Unit (`) For Cum IDCW NAV (`)
IDCW per Unit (`) For
Individuals & HUF Others Individuals & HUF Others
Dec 28, 20 10.7407 0.1550 0.1550 10.7698 0.2640 0.2640Mar 25, 21 10.5679 0.1720 0.1720 10.4957 0.1700 0.1700Jun 25, 21 10.5746 0.1440 0.1440 10.5113 0.1590 0.1590
HDFC Gilt Fund(IDCW Option) (Past 3 quarters)
Record Date Regular Plan Direct Plan
Cum IDCW NAV (`)
IDCW per Unit (`) For Cum IDCW NAV (`)
IDCW per Unit (`) For
Individuals & HUF Others Individuals & HUF Others
Dec 28, 20 12.1459 0.2000 0.2000 12.6549 0.2000 0.2000Mar 25, 21 11.8018 0.1000 0.1000 12.3182 0.1000 0.1000Jun 25, 21 11.8409 0.1000 0.1000 12.3769 0.1000 0.1000
HDFC Liquid FundMonthly IDCW Option (Past 3 months)
Record Date Regular Plan Direct Plan
Cum IDCW NAV (`)
IDCW per Unit (`) For Cum IDCW NAV (`)
IDCW per Unit (`) For
Individuals & HUF Others Individuals & HUF Others
Apr 26, 21 1028.6511 2.3511 2.3511 1028.7259 2.4259 2.4259May 31, 21 1029.2755 2.9755 2.9755 1029.3742 3.0742 3.0742Jun 28, 21 1028.8600 2.5600 2.5600 1028.9407 2.6407 2.6407
HDFC Floating Rate Debt FundMonthly IDCW Option (Past 3 months)
Record Date Regular Plan Direct Plan
Cum IDCW NAV (`)
IDCW per Unit (`) For Cum IDCW NAV (`)
IDCW per Unit (`) For
Individuals & HUF Others Individuals & HUF Others
Apr 26, 21 10.1858 0.0417 0.0417 10.1877 0.0436 0.0436May 31, 21 10.2085 0.0644 0.0644 10.2109 0.0668 0.0668Jun 28, 21 10.1823 0.0382 0.0382 10.1843 0.0402 0.0402
HDFC Low Duration FundMonthly IDCW Option (Past 3 months)
Record Date Regular Plan Direct Plan
Cum IDCW NAV (`)
IDCW per Unit (`) For Cum IDCW NAV (`)
IDCW per Unit (`) For
Individuals & HUF Others Individuals & HUF Others
Apr 26, 21 10.1753 0.0353 0.0353 10.1824 0.0399 0.0399May 31, 21 10.1871 0.0471 0.0471 10.1955 0.053 0.053Jun 28, 21 10.1779 0.0379 0.0379 10.1849 0.0424 0.0424
HDFC Credit Risk Debt FundQuarterly IDCW Option (Past 3 quarters)
Record Date Regular Plan Direct Plan
Cum IDCW NAV (`)
IDCW per Unit (`) For Cum IDCW NAV (`)
IDCW per Unit (`) For
Individuals & HUF Others Individuals & HUF Others
Dec 28, 20 10.6803 0.2150 0.2150 10.8213 0.2050 0.2050Mar 25, 21 10.5864 0.2260 0.2260 10.7529 0.1970 0.1970Jun 25, 21 10.6331 0.2440 0.2440 10.8479 0.2120 0.2120
HDFC Ultra Short Term FundMonthly IDCW Option (Past 3 months)
Record Date Regular Plan Direct Plan
Cum IDCW NAV (`)
IDCW per Unit (`) For Cum IDCW NAV (`)
IDCW per Unit (`) For
Individuals & HUF Others Individuals & HUF Others
Apr 26, 21 10.1828 0.0328 0.0328 10.0855 0.0355 0.0355May 31, 21 10.1840 0.0340 0.0340 10.0871 0.0371 0.0371Jun 28, 21 10.1750 0.0250 0.0250 10.0772 0.0272 0.0272

Disclaimer: The views expressed herein are based on internal data, publicly available information and other sources believed to be reliable, but involve uncertainties that could cause actual events to differ materially from those expressed or implied in such statements. The document is given for general and information purpose and is neither an investment advice nor an offer to sell nor a solicitation. While due care has been exercised while preparing this document, HDFC Asset Management Company Limited (“HDFC AMC”) does not warrant the completeness or accuracy of the information. neither HDFC AMC, nor any person connected with it, accepts any liability arising from the use of this material. The recipient of this material should rely on their investigations and take their own professional advice. For latest riskometers, please refer www.hdfcfund.com
HDFC SEnSEx ETF, HDFC Index Fund - SEnSEx Plan (“Schemes”) is based on the S&P BSE SEnSEx Index. S&P® is a registered trademark of S&P Financial Services Limited (S&P). BSE® and SEnSEx® are registered trademarks of BSE Limited. The Schemes is not sponsored, endorsed marketed or promoted by S&P, BSE or their respective affiliates. Please refer to the Scheme Information Document for disclaimers w.r.t. S&P BSE SENSEX Index.
For HDFC nIFTY 50 ETF, HDFC Index Fund - nIFTY 50 Plan and HDFC Banking ETF: The Scheme of HDFC Mutual Fund (the “Product(s)”) are not sponsored, endorsed, sold or promoted by nifty Indices Limited [formerly India Index Services & Products Limited] (“nIL”). nIL does not make any representation or warranty, express or implied, to the owners of the Product(s) or any member of the public regarding the advisability of investing in securities generally or in the Product(s) particularly or the ability of the nIFTY Indices to track general stock market performance in India. The relationship of nIL with HDFC Asset Management Company Limited (“the Issuer/Licensee”) is only in respect of the licensing of the Indices and certain trademarks and trade names associated with such Indices which is determined, composed and calculated by nIL without regard to the Issuer /Licensee or the Product(s). nIL does not have any obligation to take the needs of the Issuer/Licensee or the owners of the Product(s) into consideration in determining, composing or calculating the nIFTY Indices. nIL is not responsible for or has participated in the determination of the timing of, prices at, or quantities of the Product(s) to be issued or in the determination or calculation of the equation by which the Product(s) is to be converted into cash. nIL has no obligation or liability in connection with the administration, marketing or trading of the Product(s).
nIL is engaged in the business of developing, constructing, compiling, computing and maintaining various equity indices. The relationship of nIL to HDFC AMC is only in respect of the rights granted to use certain trademarks and trade names of the Index in connection with the utilisation of the Index data relating to such Index. The Index is determined, composed and calculated by nIL without regard to HDFC AMC. nIL has no obligation to take the needs of HDFC AMC into consideration in determining, composing or calculating the nIFTY Indices.
nIL do not guarantee the accuracy and/or the completeness of nIFTY Indices or any data included therein and they shall have no liability for any errors, omissions, or interruptions therein. nIL make no warranty, express or implied, as to results to be obtained by HDFC AMC or any other person or entity from the use of nIFTY Indices or any data included therein. nIL make no express or implied warranties, and expressly disclaim all warranties of merchantability or fitness for a particular purpose or use with respect to the Index or any data included therein. Without limiting any of the foregoing, NIL expressly disclaim any and all liability for any damages or losses arising out of the use of NIFTY Indices or any data included therein by any third party, including any and all direct, special, punitive, indirect, or consequential damages (including lost profits), even if notified of the possibility of such damages. An investor, by subscribing or purchasing an interest in the Product(s), will be regarded as having acknowledged, understood and accepted the disclaimer referred to in Clauses above and will be bound by it.
WANT TO HAVE THE LATEST INFORMATION ABOUT US?
Visit us at www.hdfcfund.com
Telephone ServicesToll-free number: 1800 3010 6767 / 1800 419 7676
For any query or suggestions:-
Investors may contact us at:[email protected]
Distributors may contact us at:[email protected]
SMS: HDFCMF to 56767
Registered Office: HDFC House, 2nd Floor, H.T. Parekh Marg, 165-166 Backbay Reclamation, Churchgate, Mumbai - 400 020.
MUTUAL FUND INVESTMENTS ARE SUBJECT TO MARkET RISkS, READ ALL SCHEME RELATED DOCUMENTS CAREFULLY.
UPDATION OF PAN OF ALL UNITHOLDERS IN THE FOLIOS IS MANDATORY FOR PROCESSING OF REDEMPTION AND RELATED TRANSACTIONS
It is Mandatory to complete the kYC requirements for all unit holders, including for all joint holders and the guardian in case of folio of a minor investor. Accordingly, financial transactions (including redemptions, switches and all types of systematic plans) will not be processed if the unit holders have not completed kYC requirements
Date of Release: July 15, 2021

SOUND INVESTMENT + TIME + PATIENCE =
WEALTH CREATION` 1 lakh invested in HDFC Balanced Advantage
Fund is now worth ` 95.4 lakh^
^ As on June 30, 2021. Assuming the investment is made on February 01, 1994 (Scheme Inception Date). All dividends declared prior to the splitting of the Scheme into IDCW & Growth Options are assumed to be reinvested in the units of the Scheme at the then prevailing NAV (ex-dividend NAV). Past performance may or may not be sustained in the future. Refer complete performance details on Page no. 17.
HDFC BALANCED ADVANTAGE FUND