sorting plastic bottles for recycling - plastics
TRANSCRIPT

SORTING PLASTIC BOTTLES FOR RECYCLING


1
Contents
1. ABOUT THIS GUIDE 3MRFs Included in the Study 3Canadian Study 4Organization of The Guide 4
2. HOW DATA WERE OBTAINED FOR THIS GUIDE 5Sampling of Incoming Material 5Outgoing Material 6Measurement of Sorting Rates 6
3. THE IMPACT OF COLLECTION PROGRAMS ON PROCESSINGEFFICIENCY 7Estimating Incoming Quantities 7Material Densities 7Composition of Recyclables Delivered to the MRF 8
4. MATERIAL RECEIVING AND STORAGE 11Elimination of Material Storage Backlogs 11
5. IMPROVING MANUAL SORTING EFFICIENCY 12Factors Impacting Sorting Efficiency 12Contamination of Material Presented to the Sorter 12Sequence of Material Sorting 12Burden Depth and Consistency 13Density of Material Presented to the Sorter on the Lights Line 14Sorting Belt Speed 15Environmental Conditions For Sorting 16Sorter Training and Experience 16Manual Sorting Rates 16Sorter Error Rates 17
6. AUTOMATED SORTING 19Description of Single Line Automated Sorting Systems 19Description of a Binary System 20Performance of an Automated MSS Single Line System at a MRF 20Performance of an MSS Single Line System at the Garten Services PRF 24Automated System Costs 24Labor Requirements 25Summary of Automated Sorting System Findings 25
7. MATERIAL DENSIFICATION AND MRF OUTPUT 26Composition of Annual MRF Container Line Output 26
8. COMPUTER MODELING OF MRF OPERATIONS AND COSTS 28
TABLE OF CONTENTS
2
9. ALLOCATION OF COSTS AMONG MATERIALS 30Buildings and Land Capital Cost 31Equipment Capital Cost 31Labor 32Building/Equipment Maintenance and Operations 32Administrative 32Impact of Residues 32Allocation of Cost By Cost Category 32
10. APPENDIX A1EPIC MRF Model for Assessing MRF Operations and Costs
ACKNOWLEDGMENTS
DSM Environmental Services, Ascotney, Vermont, was the prime contrac-tor responsible for preparing this manual. They were assisted by R.W. Beck,Orlando, Florida and Proctor & Redfern Limited, Ontario, Canada.
This manual could not have been completed without the consent andassistance of the MRF owners/operators who willingly participated in theproject. To maintain the confidentiality of the MRFs, individuals cannot bespecifically credited, however it is hoped that the results of the project will beof benefit to them.
The information contained in this publication is believed to be accurate as of February 2000.However, no warranty is provided with respect to the accuracy of the information or itssuitability for any reader’s particular purpose. Statements in this publication with respect toparticular equipment or other products are merely reports of the factual observations of suchequipment or products under certain operating conditions. The statements are for purposes ofinformation only and are not intended and may not be construed as endorsements or recom-mendations for or against the equipment or other products or as any warranty, express orimplied, and any such warranties are hereby expressly disclaimed, including, without limita-tion, any implied warranty of merchantability or fitness for any particular purpose.
3
In 1996, there were 363 MaterialsRecovery Facilities (MRFs) process-ing commingled containers and paperfor recycling in the United States.1
MRF operators have little controlover the prices received for thematerials they recover. Therefore, it isimportant to minimize handling costsunder all market conditions. This isespecially the case for high volumeplastic containers.
The American Plastics Council(APC) published “How To CollectPlastic For Recycling” (CollectionManual) in May 1995. The CollectionManual was intended to providereliable data and information toanyone seeking to improve collectionefficiencies to reduce collection costs.
It was recognized at the time ofpublication of the Collection Manualthat there was a similar need toprovide reliable information to thegrowing number of MRFs separatingand processing collected plasticcontainers in a commingled containerstream.
This Guide is intended to fill thisgap. The decision that a guide ratherthan a manual would be more appro-priate to address the handling ofplastic after collection is based on thefollowing:
� References are currently availablefor those interested in the designof MRFs (see, for example,Material Recovery DesignManual, CalRecovery and PEERConsultants, 1993).
� A majority of MRFs are privatelyowned and the owners/operatorsconsider their design or operationsto be proprietary. As such, theparticipating MRFs are not identi-fied to protect the confidentialitypromised to the owners/operators.
Within these constraints, it ishoped that existing MRF operators,and potential new MRF owners anddesign engineers, can use the infor-mation presented in this Guide toimprove the efficiency of sorting andrecovering plastic containers collectedfrom the residential and commercialrecyclables streams.
MRFS INCLUDED IN THESTUDY
Seven MRFs accepting a wide varietyof plastic containers and representa-tive of the major MRF owners andoperators in the United States wereselected for this project.
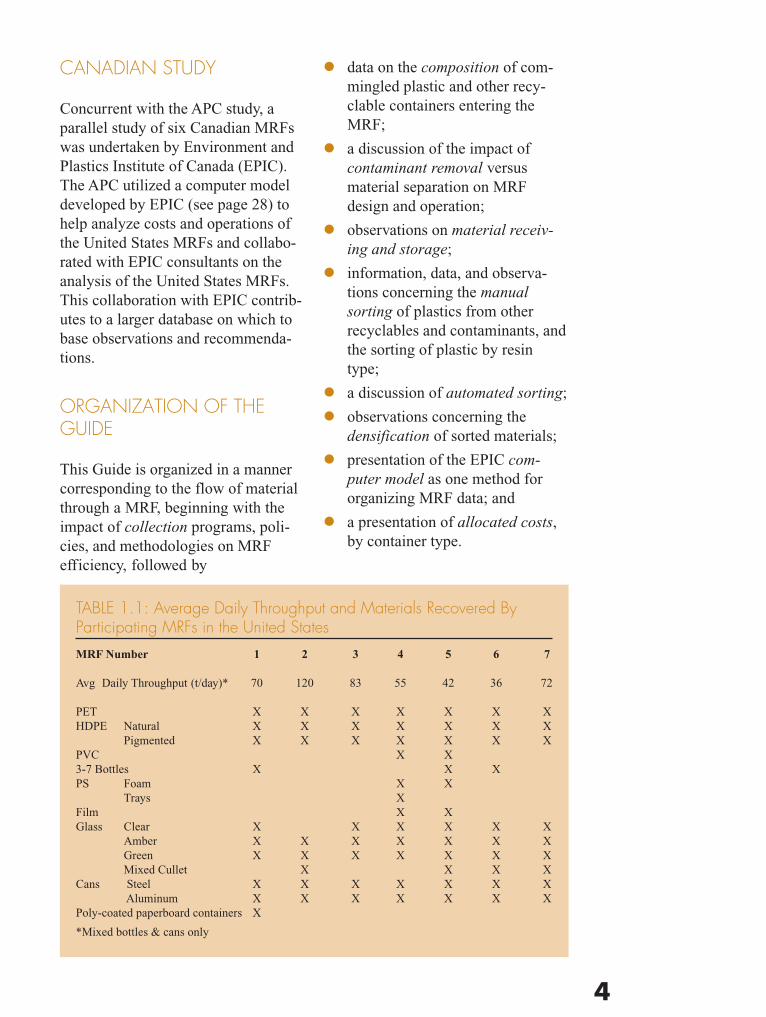
Table 1.1 identifies the packagingcontainers recovered and the dailythroughput of the container line ateach of the participating MRFs.
1. ABOUT THIS GUIDE
1 Government Advisory Associates, “TheMaterials Recycling and Processing Industry in theUnited States: 1995-96 Yearbook, Atlas, andDirectory.”
4
� data on the composition of com-mingled plastic and other recy-clable containers entering theMRF;
� a discussion of the impact ofcontaminant removal versusmaterial separation on MRFdesign and operation;
� observations on material receiv-ing and storage;
� information, data, and observa-tions concerning the manualsorting of plastics from otherrecyclables and contaminants, andthe sorting of plastic by resintype;
� a discussion of automated sorting;
� observations concerning thedensification of sorted materials;
� presentation of the EPIC com-puter model as one method fororganizing MRF data; and
� a presentation of allocated costs,by container type.
CANADIAN STUDY
Concurrent with the APC study, aparallel study of six Canadian MRFswas undertaken by Environment andPlastics Institute of Canada (EPIC).The APC utilized a computer modeldeveloped by EPIC (see page 28) tohelp analyze costs and operations ofthe United States MRFs and collabo-rated with EPIC consultants on theanalysis of the United States MRFs.This collaboration with EPIC contrib-utes to a larger database on which tobase observations and recommenda-tions.
ORGANIZATION OF THEGUIDE
This Guide is organized in a mannercorresponding to the flow of materialthrough a MRF, beginning with theimpact of collection programs, poli-cies, and methodologies on MRFefficiency, followed by
TABLE 1.1: Average Daily Throughput and Materials Recovered ByParticipating MRFs in the United States
MRF Number 1 2 3 4 5 6 7
Avg Daily Throughput (t/day)* 70 120 83 55 42 36 72
PET X X X X X X XHDPE Natural X X X X X X X
Pigmented X X X X X X XPVC X X3-7 Bottles X X XPS Foam X X
Trays XFilm X XGlass Clear X X X X X X
Amber X X X X X X XGreen X X X X X X XMixed Cullet X X X X
Cans Steel X X X X X X X Aluminum X X X X X X X
Poly-coated paperboard containers X
*Mixed bottles & cans only
5
The input to a MRF is heterogeneous,varying with the seasons, on a day-to-day basis, and even by the hour.Sorter efficiency and the output of theMRF also vary, depending on thequality of the incoming material,sorter productivity on any given day,and the operating condition of equip-ment used for moving and separatingmaterials.
As a result, development ofdefinitive data on the operatingcharacteristics of a MRF requires asignificant sampling effort over anextended period of time. Such aneffort was outside the scope of thisproject and, in most cases, wouldhave been too disruptive to MRFoperations to be acceptable to theMRF owners/operators.
Data collection at each MRFranged from a minimum of two to amaximum of four days at each MRF.First, detailed information on operat-ing parameters and costs for thecommingled container line werecollected from the MRF manager forinput into the EPIC model. Then, oneto three full days of sampling ofincoming and outgoing material wasundertaken, together with videotaping of sorting lines. Finally, themodel and data collection results werereviewed with the MRF manager.
Given the admittedly short timespent at each MRF and the samplingprocedures used, data presented in
this Guide should be viewed as a“snapshot” of each MRF.
SAMPLING OF INCOMINGMATERIAL
Sampling of incoming commingledcontainer material varied dependingon the specific constraints at eachMRF. At MRF 1, grab samples weretaken at the top of the initial inclinefeed conveyor every 30 minutesduring the day. In this case, the 40-pound grab samples representedmaterial that had been tipped on thefloor, pushed into a storage pile,pushed from the storage pile into apit, and dragged out of the pit and upa steep incline conveyor.
At MRFs 2 and 4, full bucketloads were taken at random fromvarious locations in the storage pileusing a front-end loader. Thesesamples represented material that hadbeen tipped on the floor, then mixedwith additional material and pushedinto a pile.
Samples collected at MRFs 5 and6 consisted of full (10 to 15 cubicyard) truckloads of commingledbottles and cans. At MRF 7, wherematerial is delivered in plastic bags,the sample consisted of 30 plasticbags of commingled containers pulledat random from trucks entering thefacility throughout the day.
2. HOW DATA WERE OBTAINED FOR THIS GUIDE
6
No sampling of incoming materialwas conducted at MRF 3.
OUTGOING MATERIAL
Sampling of outgoing processedplastic was conducted at five of theseven MRFs. Sampling consisted ofeither (1) sorting of bales of materialselected at random (MRFs 1 and 7) or(2) sorting of skid steer loaderbucketloads of loose plastic storedprior to baling.
MEASUREMENT OF SORTINGRATES
Videotaping of manual sorting wascarried out at all of the participatingMRFs. The video recording was thenused to count the number of throws,by material type, for each sorter onthe plastic or “lights” line, and toallocate sorting time among materialsand residue.
7
ESTIMATING INCOMINGQUANTITIES
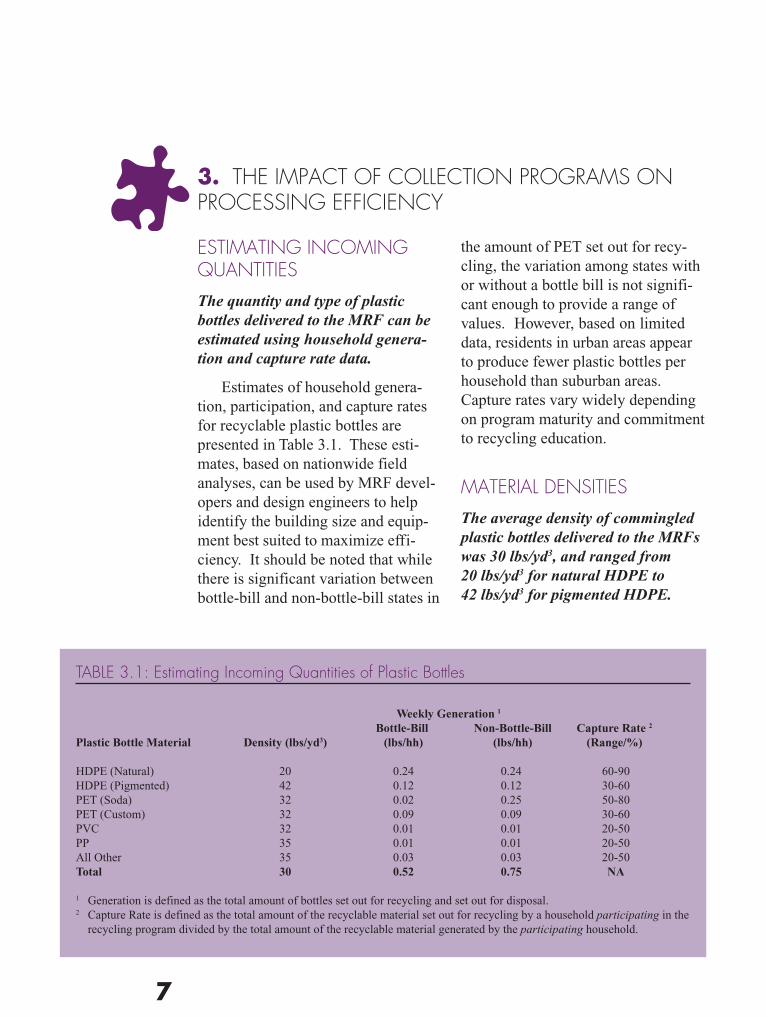
The quantity and type of plasticbottles delivered to the MRF can beestimated using household genera-tion and capture rate data.
Estimates of household genera-tion, participation, and capture ratesfor recyclable plastic bottles arepresented in Table 3.1. These esti-mates, based on nationwide fieldanalyses, can be used by MRF devel-opers and design engineers to helpidentify the building size and equip-ment best suited to maximize effi-ciency. It should be noted that whilethere is significant variation betweenbottle-bill and non-bottle-bill states in
the amount of PET set out for recy-cling, the variation among states withor without a bottle bill is not signifi-cant enough to provide a range ofvalues. However, based on limiteddata, residents in urban areas appearto produce fewer plastic bottles perhousehold than suburban areas.Capture rates vary widely dependingon program maturity and commitmentto recycling education.
MATERIAL DENSITIES
The average density of commingledplastic bottles delivered to the MRFswas 30 lbs/yd3, and ranged from20 lbs/yd3 for natural HDPE to42 lbs/yd3 for pigmented HDPE.
3. THE IMPACT OF COLLECTION PROGRAMS ONPROCESSING EFFICIENCY
TABLE 3.1: Estimating Incoming Quantities of Plastic Bottles
Weekly Generation 1
Bottle-Bill Non-Bottle-Bill Capture Rate 2
Plastic Bottle Material Density (lbs/yd3) (lbs/hh) (lbs/hh) (Range/%)
HDPE (Natural) 20 0.24 0.24 60-90HDPE (Pigmented) 42 0.12 0.12 30-60PET (Soda) 32 0.02 0.25 50-80PET (Custom) 32 0.09 0.09 30-60PVC 32 0.01 0.01 20-50PP 35 0.01 0.01 20-50All Other 35 0.03 0.03 20-50Total 30 0.52 0.75 NA
1 Generation is defined as the total amount of bottles set out for recycling and set out for disposal.2 Capture Rate is defined as the total amount of the recyclable material set out for recycling by a household participating in the
recycling program divided by the total amount of the recyclable material generated by the participating household.
8
The mix of plastic bottles, andtherefore the density of the mix, willvary depending on the location of theMRF. Densities reported in the Col-lection Manual for commingledplastic bottles ranged from 27 to 37lbs/yd3. The following factors mayaffect density:
� Beverage container depositlegislation will significantlyreduce the quantity of PET in therecycling stream. The resultingdensity of the remaining plasticbottles will therefore be less dueto the greater percent of light-weight HDPE natural milk andwater bottles.
� Use of powdered detergents (soldin boxes or bags) as opposed toliquid detergents will affect thequantity of heavier HDPE pig-mented detergent bottles.
� The preference for purchase ofmilk in natural HDPE containers(the lightest plastic bottles) asopposed to polycoated paperboardcontainers may have an impact ondensities of the mixed plasticcontainers.
� Consumption of large amounts ofbottled water in HDPE gallon jugsin certain areas will reduce aver-age densities.
� The significant increase in single-serve PET containers is (due totheir higher weight-to-volumeratios) increasing the averagedensity of the mix of PET bottlesdelivered to the MRF.
COMPOSITION OFRECYCLABLES DELIVEREDTO THE MRF
The composition of material deliv-ered to the MRF has a significantimpact on processing efficiency.Contaminants entering MRFs 5, 6,and 7 represented between 3.7percent and 6.7 percent of the in-coming material. This seeminglysmall amount of incoming contami-nation was responsible for between31 and 67 percent of sorting labor atthese three MRFs.
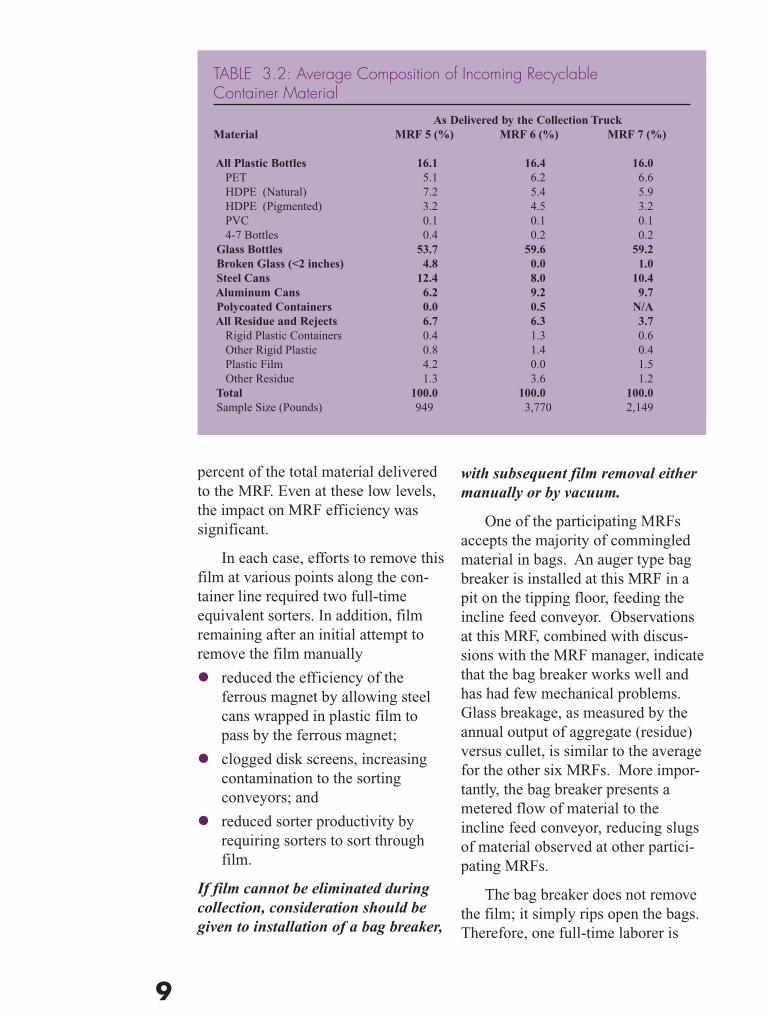
Table 3.2 illustrates measuredcontaminant levels in recyclablesdelivered in the collection vehicles toMRFs 5, 6, and 7. Measurement ofmanual sorting time devoted toremoval of contaminants, as opposedto sorting of recyclables, was madefrom the videotapes of sorters at thesesame three participating MRFs, aswell as at three of the other participat-ing MRFs. These findings indicatethe critical importance of educatingcustomers and collectors of theimportance of minimizing contamina-tion.
Acceptance of even small amounts ofrecyclables in plastic bags willsignificantly reduce equipment andmanual sorting efficiency unless allof the film is removed with a filmremoval system at the front end.
Two of the seven participatingU. S. MRFs accepted commingledcontainers from some communitiesusing plastic bags for storage of thematerial. In both cases, it was re-ported that material from these com-munities represented less than 20
9
percent of the total material deliveredto the MRF. Even at these low levels,the impact on MRF efficiency wassignificant.
In each case, efforts to remove thisfilm at various points along the con-tainer line required two full-timeequivalent sorters. In addition, filmremaining after an initial attempt toremove the film manually
� reduced the efficiency of theferrous magnet by allowing steelcans wrapped in plastic film topass by the ferrous magnet;
� clogged disk screens, increasingcontamination to the sortingconveyors; and
� reduced sorter productivity byrequiring sorters to sort throughfilm.
If film cannot be eliminated duringcollection, consideration should begiven to installation of a bag breaker,
with subsequent film removal eithermanually or by vacuum.
One of the participating MRFsaccepts the majority of commingledmaterial in bags. An auger type bagbreaker is installed at this MRF in apit on the tipping floor, feeding theincline feed conveyor. Observationsat this MRF, combined with discus-sions with the MRF manager, indicatethat the bag breaker works well andhas had few mechanical problems.Glass breakage, as measured by theannual output of aggregate (residue)versus cullet, is similar to the averagefor the other six MRFs. More impor-tantly, the bag breaker presents ametered flow of material to theincline feed conveyor, reducing slugsof material observed at other partici-pating MRFs.
The bag breaker does not removethe film; it simply rips open the bags.Therefore, one full-time laborer is
TABLE 3.2: Average Composition of Incoming RecyclableContainer Material
As Delivered by the Collection TruckMaterial MRF 5 (%) MRF 6 (%) MRF 7 (%)
All Plastic Bottles 16.1 16.4 16.0PET 5.1 6.2 6.6HDPE (Natural) 7.2 5.4 5.9HDPE (Pigmented) 3.2 4.5 3.2PVC 0.1 0.1 0.14-7 Bottles 0.4 0.2 0.2
Glass Bottles 53.7 59.6 59.2 Broken Glass (<2 inches) 4.8 0.0 1.0 Steel Cans 12.4 8.0 10.4 Aluminum Cans 6.2 9.2 9.7 Polycoated Containers 0.0 0.5 N/A All Residue and Rejects 6.7 6.3 3.7
Rigid Plastic Containers 0.4 1.3 0.6Other Rigid Plastic 0.8 1.4 0.4Plastic Film 4.2 0.0 1.5Other Residue 1.3 3.6 1.2
Total 100.0 100.0 100.0 Sample Size (Pounds) 949 3,770 2,149
10
responsible for manually removingfilm after the material has left the bagbreaker. Videotaping of the sortinglines indicates that some film ispassing the film removal sortingstation, reducing sorting efficiency.At the time of the analysis of thisMRF, a vacuum removal system wasbeing installed to aid the sorter in theremoval of film. The MRF operatorwas hopeful that this system wouldimprove removal of film.
Increased public education is neces-sary to better inform participatinghouseholds which plastic containersare acceptable in the recyclingprogram.
Exclusive of broken glass,nonbottle rigid plastic containers andnon-container plastic represented thelargest single contaminant, by weight,of residential recyclables entering theparticipating MRFs.
Nonbottle, rigid plastic containers(e.g., yogurt and deli containers) andnoncontainer plastic (e.g., plasticbags, plastic toys) ranged from a lowof 33 percent to a high of 83 percentof all commingled container contami-nants.
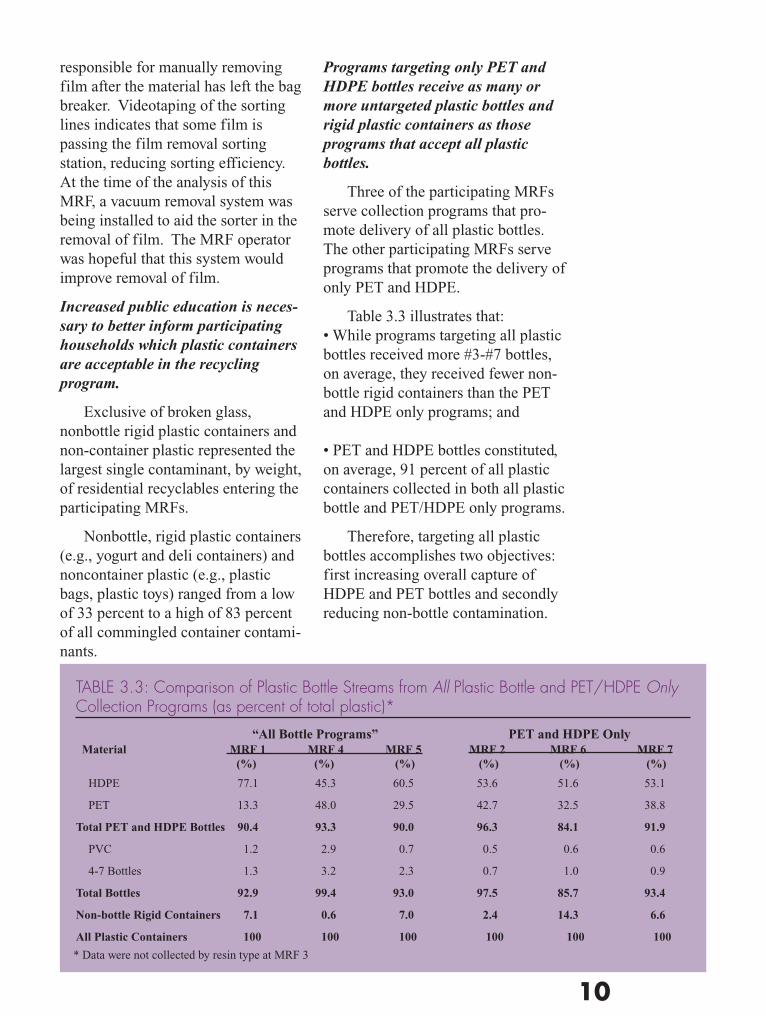
Programs targeting only PET andHDPE bottles receive as many ormore untargeted plastic bottles andrigid plastic containers as thoseprograms that accept all plasticbottles.
Three of the participating MRFsserve collection programs that pro-mote delivery of all plastic bottles.The other participating MRFs serveprograms that promote the delivery ofonly PET and HDPE.
Table 3.3 illustrates that:• While programs targeting all plasticbottles received more #3-#7 bottles,on average, they received fewer non-bottle rigid containers than the PETand HDPE only programs; and
• PET and HDPE bottles constituted,on average, 91 percent of all plasticcontainers collected in both all plasticbottle and PET/HDPE only programs.
Therefore, targeting all plasticbottles accomplishes two objectives:first increasing overall capture ofHDPE and PET bottles and secondlyreducing non-bottle contamination.
TABLE 3.3: Comparison of Plastic Bottle Streams from All Plastic Bottle and PET/HDPE OnlyCollection Programs (as percent of total plastic)*
“All Bottle Programs” PET and HDPE Only Material MRF 1 MRF 4 MRF 5 MRF 2 MRF 6 MRF 7
(%) (%) (%) (%) (%) (%)
HDPE 77.1 45.3 60.5 53.6 51.6 53.1
PET 13.3 48.0 29.5 42.7 32.5 38.8
Total PET and HDPE Bottles 90.4 93.3 90.0 96.3 84.1 91.9
PVC 1.2 2.9 0.7 0.5 0.6 0.6
4-7 Bottles 1.3 3.2 2.3 0.7 1.0 0.9
Total Bottles 92.9 99.4 93.0 97.5 85.7 93.4
Non-bottle Rigid Containers 7.1 0.6 7.0 2.4 14.3 6.6
All Plastic Containers 100 100 100 100 100 100
* Data were not collected by resin type at MRF 3
11
ELIMINATION OF MATERIALSTORAGE BACKLOGS
Minimizing incoming materialstorage time improves processingefficiency.
A comparison of MRF 6, whichprocessed all material delivered eachday, with the other six MRFs, whichmaintained a backlog of materialsranging from one day of delivery toas much as one week of deliveries,revealed that:
� The quality of the material forprocessing appeared to be higherbecause of the lack of contactwith other materials and withcontaminants. Specifically, thereappeared to be less imbeddedglass in the plastics, and there wasless liquid contamination on theoutside of the plastic containers.
� Traffic flow on the tipping floorwas smoother and less con-strained, reducing waiting timesfor the collection trucks, therebyimproving collection efficiency.
� A smaller skid steer loader couldbe used to push material onto thepit conveyor because there was noneed to manage large piles ofmaterial.
� The MRF was generally muchcleaner, providing the workerswith an environment more like amanufacturing plant than a wastehandling facility.
� Most importantly, the amount ofglass leaving MRF 6 as aggregate,as opposed to cullet, was approxi-mately one-half of the average forthe other participating MRFs (seeTable 7.1), due to less breakagefrom storage “management.”
It should be noted here that someof the benefits of processing allmaterial delivered each day may benegated by deliveries of 100 cubic-yard trailer loads of commingledmaterial. These loads may arrive atthe MRF with large amounts ofbroken glass.
The percent of broken glass in-creases as the length of time thematerial is stored on the tipping floorincreases.
MRFs 1 and 4 maintained the largestbacklog of material for processing.The amount of aggregate (<2 inches)as a percent of total glass marketedannually at these two MRFs averaged62 percent compared to 51 percent forthe remaining MRFs.
4. MATERIAL RECEIVING AND STORAGE
12
The greatest potential for reducing thecost of processing plastic is likely tocome from improvements on thesorting line. This section reviewsways to improve manual sortingefficiency. Section 6 provides areview of automated sorting equip-ment that can potentially replacemanual sorting labor.
FACTORS IMPACTINGSORTING EFFICIENCY
Videotaping of container flow andmanual sorting of plastic containerswas carried out at each participatingMRF. The videotapes were thenutilized to determine manual sortingrates. Manual sorting rates werecompared among MRFs and withsorting rates for the Canadian MRFsto develop maximum sustainablesorting rates by plastic bottle type andto identify factors that affect sortingrates. These factors include:
� Degree of contamination of thematerial presented to the sorter
� Sequence of material sorting
� Burden depth and consistency
� Density of material presented tothe sorter
� Sorting belt speed
� Environmental conditions forsorting
� Sorter training and experience
CONTAMINATION OFMATERIAL PRESENTEDTO THE SORTER
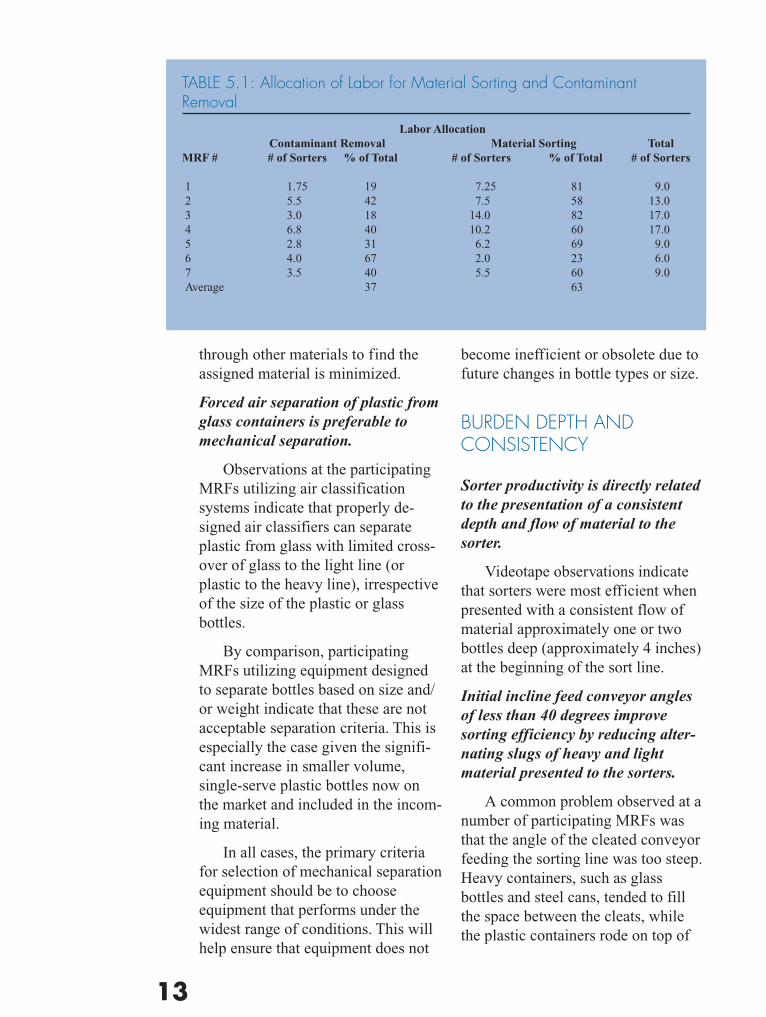
Removal of contaminants duringcurbside collection and prior tosorting at the MRF can reduce laborrequirements and increase sortingproductivity.
Table 5.1 illustrates that an aver-age of 37 percent of observed sorteractivity (ranging from 18 to 67 per-cent) was devoted to removal ofcontaminants that, on average, repre-sent only 3.7 percent of the incomingmaterial stream (see Table 3.2) and11.2 percent of MRF output. Thediscrepancy between contaminantlevels measured entering three of theparticipating MRFs and residue ratesreported by all seven participatingMRFs is a function of labels andbottle caps falling off containers asthey travel through the MRF, as wellas missed containers that end up inthe residue.
SEQUENCE OF MATERIALSORTING
The first sorter(s) should be assignedto the highest volume material,typically HDPE natural.
Assigning sorters based on thehighest volume material ensures thatthe amount of time spent searching
5. IMPROVING MANUAL SORTING EFFICIENCY
13
through other materials to find theassigned material is minimized.
Forced air separation of plastic fromglass containers is preferable tomechanical separation.
Observations at the participatingMRFs utilizing air classificationsystems indicate that properly de-signed air classifiers can separateplastic from glass with limited cross-over of glass to the light line (orplastic to the heavy line), irrespectiveof the size of the plastic or glassbottles.
By comparison, participatingMRFs utilizing equipment designedto separate bottles based on size and/or weight indicate that these are notacceptable separation criteria. This isespecially the case given the signifi-cant increase in smaller volume,single-serve plastic bottles now onthe market and included in the incom-ing material.
In all cases, the primary criteriafor selection of mechanical separationequipment should be to chooseequipment that performs under thewidest range of conditions. This willhelp ensure that equipment does not
become inefficient or obsolete due tofuture changes in bottle types or size.
BURDEN DEPTH ANDCONSISTENCY
Sorter productivity is directly relatedto the presentation of a consistentdepth and flow of material to thesorter.
Videotape observations indicatethat sorters were most efficient whenpresented with a consistent flow ofmaterial approximately one or twobottles deep (approximately 4 inches)at the beginning of the sort line.
Initial incline feed conveyor anglesof less than 40 degrees improvesorting efficiency by reducing alter-nating slugs of heavy and lightmaterial presented to the sorters.
A common problem observed at anumber of participating MRFs wasthat the angle of the cleated conveyorfeeding the sorting line was too steep.Heavy containers, such as glassbottles and steel cans, tended to fillthe space between the cleats, whilethe plastic containers rode on top of
TABLE 5.1: Allocation of Labor for Material Sorting and ContaminantRemoval
Labor Allocation Contaminant Removal Material Sorting Total
MRF # # of Sorters % of Total # of Sorters % of Total # of Sorters
1 1.75 19 7.25 81 9.0 2 5.5 42 7.5 58 13.0 3 3.0 18 14.0 82 17.0 4 6.8 40 10.2 60 17.0 5 2.8 31 6.2 69 9.0 6 4.0 67 2.0 23 6.0 7 3.5 40 5.5 60 9.0 Average 37 63
14
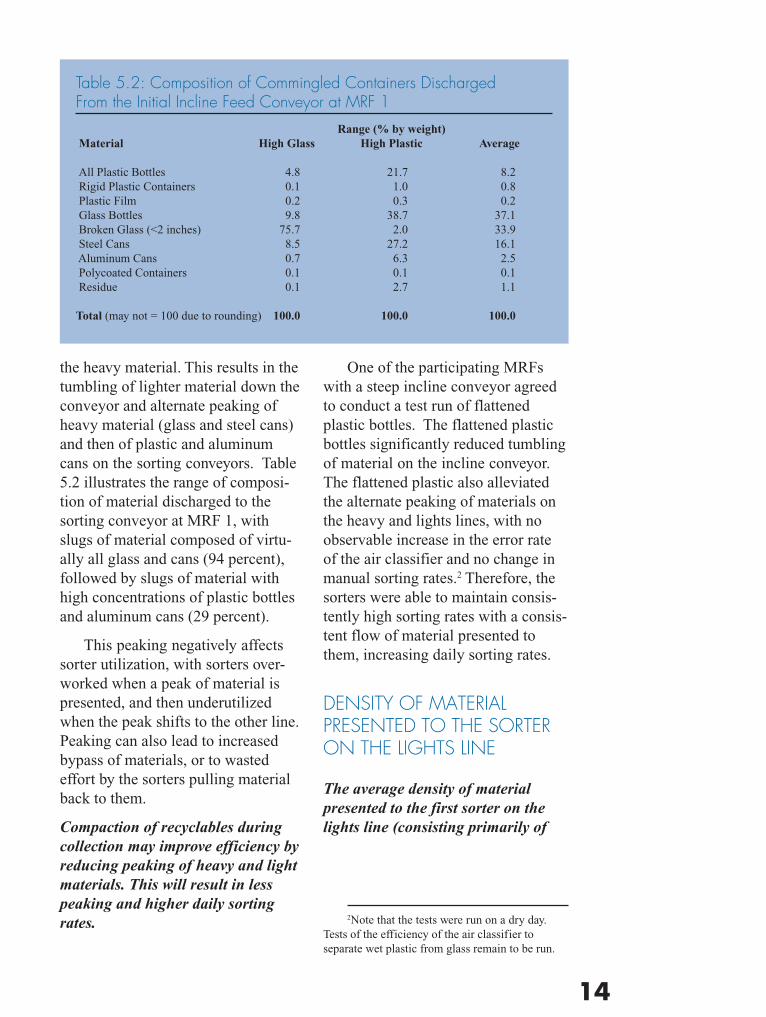
the heavy material. This results in thetumbling of lighter material down theconveyor and alternate peaking ofheavy material (glass and steel cans)and then of plastic and aluminumcans on the sorting conveyors. Table5.2 illustrates the range of composi-tion of material discharged to thesorting conveyor at MRF 1, withslugs of material composed of virtu-ally all glass and cans (94 percent),followed by slugs of material withhigh concentrations of plastic bottlesand aluminum cans (29 percent).
This peaking negatively affectssorter utilization, with sorters over-worked when a peak of material ispresented, and then underutilizedwhen the peak shifts to the other line.Peaking can also lead to increasedbypass of materials, or to wastedeffort by the sorters pulling materialback to them.
Compaction of recyclables duringcollection may improve efficiency byreducing peaking of heavy and lightmaterials. This will result in lesspeaking and higher daily sortingrates.
One of the participating MRFswith a steep incline conveyor agreedto conduct a test run of flattenedplastic bottles. The flattened plasticbottles significantly reduced tumblingof material on the incline conveyor.The flattened plastic also alleviatedthe alternate peaking of materials onthe heavy and lights lines, with noobservable increase in the error rateof the air classifier and no change inmanual sorting rates.2 Therefore, thesorters were able to maintain consis-tently high sorting rates with a consis-tent flow of material presented tothem, increasing daily sorting rates.
DENSITY OF MATERIALPRESENTED TO THE SORTERON THE LIGHTS LINE
The average density of materialpresented to the first sorter on thelights line (consisting primarily of
Table 5.2: Composition of Commingled Containers DischargedFrom the Initial Incline Feed Conveyor at MRF 1
Range (% by weight) Material High Glass High Plastic Average
All Plastic Bottles 4.8 21.7 8.2 Rigid Plastic Containers 0.1 1.0 0.8 Plastic Film 0.2 0.3 0.2 Glass Bottles 9.8 38.7 37.1 Broken Glass (<2 inches) 75.7 2.0 33.9 Steel Cans 8.5 27.2 16.1 Aluminum Cans 0.7 6.3 2.5 Polycoated Containers 0.1 0.1 0.1 Residue 0.1 2.7 1.1
Total (may not = 100 due to rounding) 100.0 100.0 100.0
2Note that the tests were run on a dry day.Tests of the efficiency of the air classifier toseparate wet plastic from glass remain to be run.
15
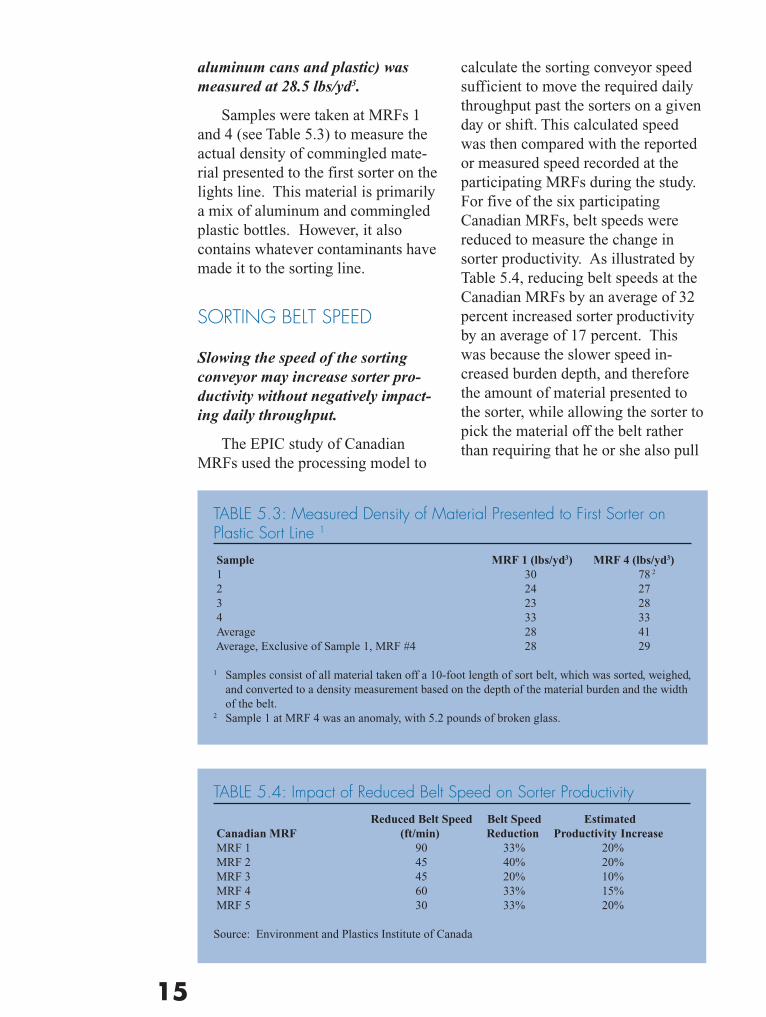
aluminum cans and plastic) wasmeasured at 28.5 lbs/yd3.
Samples were taken at MRFs 1and 4 (see Table 5.3) to measure theactual density of commingled mate-rial presented to the first sorter on thelights line. This material is primarilya mix of aluminum and commingledplastic bottles. However, it alsocontains whatever contaminants havemade it to the sorting line.
SORTING BELT SPEED
Slowing the speed of the sortingconveyor may increase sorter pro-ductivity without negatively impact-ing daily throughput.
The EPIC study of CanadianMRFs used the processing model to
calculate the sorting conveyor speedsufficient to move the required dailythroughput past the sorters on a givenday or shift. This calculated speedwas then compared with the reportedor measured speed recorded at theparticipating MRFs during the study.For five of the six participatingCanadian MRFs, belt speeds werereduced to measure the change insorter productivity. As illustrated byTable 5.4, reducing belt speeds at theCanadian MRFs by an average of 32percent increased sorter productivityby an average of 17 percent. Thiswas because the slower speed in-creased burden depth, and thereforethe amount of material presented tothe sorter, while allowing the sorter topick the material off the belt ratherthan requiring that he or she also pull
TABLE 5.3: Measured Density of Material Presented to First Sorter onPlastic Sort Line 1
Sample MRF 1 (lbs/yd3) MRF 4 (lbs/yd3) 1 30 78 2
2 24 27 3 23 28 4 33 33 Average 28 41 Average, Exclusive of Sample 1, MRF #4 28 29
1 Samples consist of all material taken off a 10-foot length of sort belt, which was sorted, weighed,and converted to a density measurement based on the depth of the material burden and the widthof the belt.
2 Sample 1 at MRF 4 was an anomaly, with 5.2 pounds of broken glass.
TABLE 5.4: Impact of Reduced Belt Speed on Sorter Productivity
Reduced Belt Speed Belt Speed Estimated Canadian MRF (ft/min) Reduction Productivity Increase MRF 1 90 33% 20% MRF 2 45 40% 20% MRF 3 45 20% 10% MRF 4 60 33% 15% MRF 5 30 33% 20%
Source: Environment and Plastics Institute of Canada
16
the material back up the belt to finishsorting it.
ENVIRONMENTALCONDITIONS FOR SORTING
There was general agreement amongMRF managers that the quality ofthe work environment affected sorterproductivity.
Although videotape measure-ments of sorting rates did not appearto correlate the work environmentwith sorter productivity, there wasgeneral agreement among the MRFmanagers that adequate lighting, heatand ventilation, and attention tocleaning the sorting area improvedsorter productivity.
Sorters should be throwing forwardinto a bunker, as opposed to pullingthe material back off the belt.
The highest observed sorting ratescorresponded with pushing or throw-ing material forward as opposed topulling material back off the belt.
SORTER TRAINING ANDEXPERIENCE
Full-time, properly trained staff hadhigher sorting rates.
Videotape measurements ofsorting rates clearly showed highersorting rates for full-time, trained, andexperienced sorters.
Assigning too many tasks to anindividual sorter reduced sortingspeed.
Whenever possible, sorters shouldbe assigned to a specific material tominimize the number of sortingdecisions required as the material ispresented to them.
Sorters should be trained to sort withboth hands.
Sorters should be presented withsufficient flow of material so that theyare consistently using both hands tosort material.
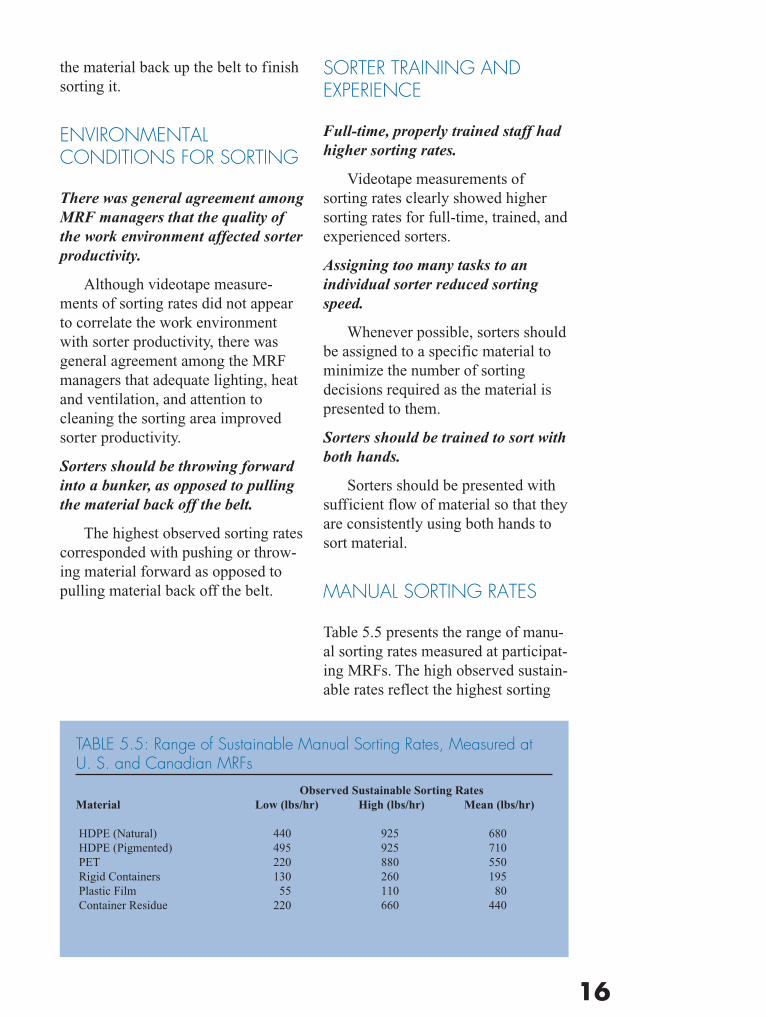
MANUAL SORTING RATES
Table 5.5 presents the range of manu-al sorting rates measured at participat-ing MRFs. The high observed sustain-able rates reflect the highest sorting
TABLE 5.5: Range of Sustainable Manual Sorting Rates, Measured atU. S. and Canadian MRFs
Observed Sustainable Sorting RatesMaterial Low (lbs/hr) High (lbs/hr) Mean (lbs/hr)
HDPE (Natural) 440 925 680 HDPE (Pigmented) 495 925 710 PET 220 880 550 Rigid Containers 130 260 195 Plastic Film 55 110 80 Container Residue 220 660 440
17
rates observed that could be main-tained over the sorting day. Themeasured sustainable rates can beused by other MRFs to compare theirsorting rates against the high observedsustainable rates. Where their ratesfall in the lower range of measuredsustainable rates, the factors discussedabove can be assessed to improvesorter productivity.
It should be noted that the highsustainable sorting rates are based onpositive sorting of targeted materialonly, with no sorting of contaminantsinterspersed within the material. Ifsorters are required to positively sortcontaminants as well as a targetedmaterial, then hourly sorting rates forsorting the targeted material will becorrespondingly reduced.
Sustainable sorting rates alsodepend on a steady flow of the tar-geted material to the sorter. Often, thefirst sorter on the line is assigned tosort HDPE natural, with the nextsorter sorting HDPE pigmented orPET. Especially in states with bever-age container deposit legislation, thequantity of PET bottles may not begreat enough to ensure a steady flowof this material to the sorter, thusreducing the sorting rate.
SORTER ERROR RATES
Manual sorters are capable ofsorting to low levels of contamina-tion, even at high sustainable sortingrates. On average, total contaminantlevels were less than 3 percent and
ranged from a high of 5.3 percent toa low of 0.3 percent.
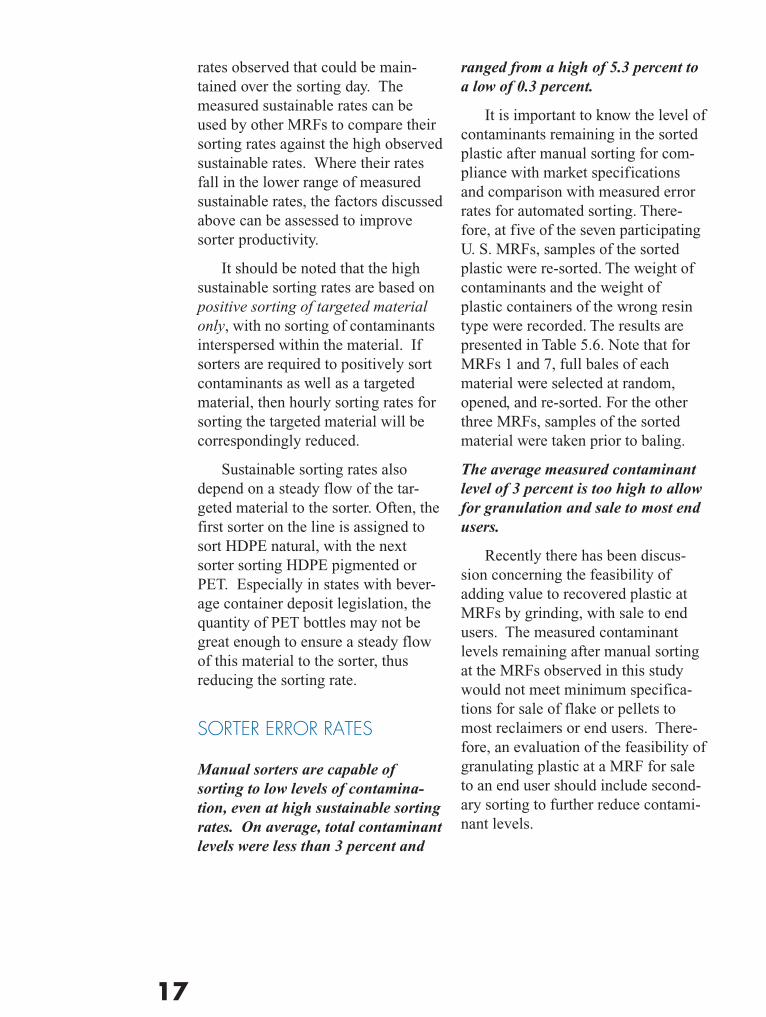
It is important to know the level ofcontaminants remaining in the sortedplastic after manual sorting for com-pliance with market specificationsand comparison with measured errorrates for automated sorting. There-fore, at five of the seven participatingU. S. MRFs, samples of the sortedplastic were re-sorted. The weight ofcontaminants and the weight ofplastic containers of the wrong resintype were recorded. The results arepresented in Table 5.6. Note that forMRFs 1 and 7, full bales of eachmaterial were selected at random,opened, and re-sorted. For the otherthree MRFs, samples of the sortedmaterial were taken prior to baling.
The average measured contaminantlevel of 3 percent is too high to allowfor granulation and sale to most endusers.
Recently there has been discus-sion concerning the feasibility ofadding value to recovered plastic atMRFs by grinding, with sale to endusers. The measured contaminantlevels remaining after manual sortingat the MRFs observed in this studywould not meet minimum specifica-tions for sale of flake or pellets tomost reclaimers or end users. There-fore, an evaluation of the feasibility ofgranulating plastic at a MRF for saleto an end user should include second-ary sorting to further reduce contami-nant levels.
18
TABLE 5.6: Composition of Outgoing Plastic Bottle Bales
MRF 1 (%) MRF 2 (%) MRF 4 (%) MRF 5 (%) MRF 7 (%)
HDPE Natural Bales HDPE Natural Bottles 98.0 97.0 99.6 98.1 Contaminants 2.1 3.9 0.4 1.9
HDPE Bottles (Pigmented) 0.5 0.1Other Plastic Bottles 0.1 0.0 0.3Loose Caps 0.3Rigid Plastic Containers 0.5Film Plastic 0.1Glass 0.7 3.8
HDPE Pigmented Bales HDPE Bottles (Pigmented) 99.2 98.1 99.7 92.8 94.5 Contaminants 0.9 1.9 0.3 7.3 5.5
HDPE Bottles (Natural) 0.0 0.2 0.2 1.0Other Plastic Bottles 0.5 0.9 0.1 0.2 0.8Rigid Plastic Containers 0.4Film Plastic 0.1 5.0 2.6Paper 0.2 0.6 0.1Glass 0.1Aluminum Cans 0.1 0.2 0.1Other Residue 0.1 0.4 2.0
PET Bottle Bales PET Bottles 97.6 95.1 98.9 99.3 91.1 Contaminants 2.4 4.9 1.1 0.7 8.9
HDPE Bottles 0.4 0.6 0.0 0.8PVC Bottles 1.1 0.6 0.8 0.3 1.1Other Plastic Bottles 0.0 0.2 0.3 0.3 1.2Rigid Plastic Containers 0.2Aluminum Cans 0.0 0.1Glass 3.2Other Residue 0.9 0.1 5.8
1 MRF 7 markets a mixed natural and pigmented bale.

19
Labor represents the largest singlecost category at the commingledcontainer MRFs, averaging 44 percentof annual per ton costs (see Section 9;Table 9.2) at the participating MRFs.For this reason, there is continuedinterest in automated sorting systems.
Currently, two manufacturers inthe United States produce automatedsystems for sorting whole plasticbottles: National Recovery Technolo-gies, Inc. (NRT), Nashville, Tennes-see, and Magnetic Separation Sys-tems, Inc. (MSS), Nashville, Tennes-see.
Both MSS and NRT have operat-ing systems at MRFs and PlasticsRecovery Facilities (PRFs) in theUnited States. Because of the interestin automated sorting, this studyincluded one MRF utilizing an auto-mated sorting system for sorting ofplastic bottles. In addition, the APChas been actively involved with thedevelopment of the Garten ServicesPRF in Salem, Oregon. Both theparticipating MRF and the PRF useMSS single line automated sortingsystems capable of sorting 1200 to1500 pounds per hour of singulatedplastic containers. However, thisshould not imply APC’s endorsementof an MSS system compared to anNRT system.
One other participating MRF wasinterested in adding an automated
sorting system. The EPIC model wasused to evaluate the cost effectivenessof adding a binary bottle sortingsystem at this MRF. Both NRT andMSS supply binary bottle sortingsystems.
DESCRIPTION OF SINGLELINE AUTOMATED SORTINGSYSTEMS
Plastic containers must first be sepa-rated mechanically or manually fromglass and cans. The plastic containersmust then be singulated prior topassing by the resin detectors. At theparticipating MRF, singulation isaccomplished using a sloped con-veyor that forces all bottles to oneside of the conveyor. They are dis-charged to a narrow conveyor that iswide enough to hold only one bottle.The bottles that fall off the narrowconveyor are conveyed back to thesloped conveyor.
The PRF uses a series of90-degree turns and diverters toaccomplish singulation.
After singulation, the plasticcontainers pass through an array of upto four detectors (depending on thenumber of separations desired) at arate of up to three containers persecond. The PRF, which utilizes allfour detectors, was separating plastic
6. AUTOMATED SORTING

20
bottles at the time of this study asfollows:
� An infrared light high densityarray recognizes clear, translucentand opaque containers.
� A machine vision color sensor,programmed to ignore labels,identifies the color of pigmentedcontainers.
� An X-ray transmission unitidentifies PVC plastic by sensingthe chlorine atom.
� A near infrared spectrum detectoridentifies resin type and recon-firms data from the other detec-tors.
Once the container has beenidentified, the system computer tracksthe item as it travels down the con-veyor until it reaches the ejectionpoint along the conveyor belt. Thecomputer then triggers a concentratedair jet to blow the container into thedesignated storage cage or onto anincline conveyor feeding a storagecage.
Each storage cage holds theequivalent of 1 to 1.5 bales of sortedmaterial. The storage cages areemptied onto the baler feed conveyor.The separated plastic containers arethen manually inspected and anyremaining contaminants, or plasticcontainers of the wrong resin type, areremoved prior to the baler.
DESCRIPTION OF A BINARYSYSTEM
A binary system sorts a single resintype of bottles from the remainingmass of plastic bottles or containers ina mixed plastic stream that has notbeen singulated. The primary benefits
of the binary system are (1) that theplastic containers do not need to besingulated prior to sorting and (2)throughput is significantly greaterthan for a singulated system (e.g.,3000 pounds per hour compared to1500 pounds per hour). The ability tofeed nonsingulated containers signifi-cantly reduces the space require-ments, allowing for potential installa-tions in existing MRFs with limitedspace. The disadvantage of a binarysystem is that it can only achieve onesort, instead of multiple sorts.
Typical binary sorts that can beachieved include:
� PET from pigmented and naturalHDPE
� Pigmented PET from clear PET
� Natural HDPE and clear PETfrom pigmented HDPE
� Natural HDPE from pigmentedHDPE
� PVC from PET
Because only one sort can beaccomplished at a time, multiple sortsrequire back-to-back binary systems,with each system sorting one type ofplastic and the remaining plasticcontainers discharged to a second (orthird) binary system sorting a second(or third) plastic type.
PERFORMANCE OF ANAUTOMATED MSS SINGLELINE SYSTEM AT A MRF
An automated sorting system can beefficiently integrated into a com-mingled MRF environment.
Based on three full days of sam-pling over three seasons at the partici-pating MRF, and one full year of
21
operating history, it is clear that anMSS system can operate in the MRFenvironment at costs that are competi-tive with manual sorting.
The quality of the plastic streampresented to the automated equip-ment is critical to the efficient opera-tion of an automated system within aMRF environment.
An automated system must bepresented with a clean, plastic-onlystream to efficiently sort by resintype. At the participating MRF, themajority of manual sorting on thecommingled line was devoted tocontaminant removal prior to theMSS line.
For this reason, the automatedsorting system must be combinedwith upfront contaminant removalequipment and sorters. The use of airclassification and/or eddy currentsystems to remove paper, labels,aluminum, etc. can be critical toachieving optimum automatic sortingefficiency. It may be most efficient tocontract with the automated systemsupplier to design and install thisinitial sorting and contaminant re-moval system to ensure that it is fullycompatible with the automated sort-ing system.
Cost-effective operation of an auto-mated sorting system requires thatthe system be fully utilized as manyhours as possible per day.
The participating MRF operates16 to 18 hours per day. Capital costsfor an automated system are high (see“Automated System Costs”), espe-cially when necessary upfront con-taminant removal, perforation, andsurge capacity are included. There-fore, in addition to keeping the auto-
mated system operating as manyhours as possible per day, it is impor-tant to make sure that the automatedsystem is supplied with a constantstream of plastic bottles (between 900and 1500 pounds/hour) throughoutthe MRF operating day, irrespectiveof manual sorter breaks and balerdown time. In most cases, this willrequire surge capacity, both in front ofand at the discharges from the system.
Maintenance of the automatedsystem requires computer and elec-trical system knowledge and mainte-nance skills.
Mechanical skills necessary formaintenance of most MRF equipmentmay not be sufficient to maintain anautomated system adequately. Inmost cases, it will be necessary tohave one or more maintenance staffmembers knowledgeable in computerand electrical systems. Lack ofmaintenance will result in higher errorrates and increased manual sorting forquality control, negating the expectedlabor savings.
PVC removal at the participatingMRF is designed to maximize re-moval of PVC from PET, not toproduce a pure PVC stream. As aconsequence, the PVC stream typi-cally includes significant quantitiesof bottles made from other resins.
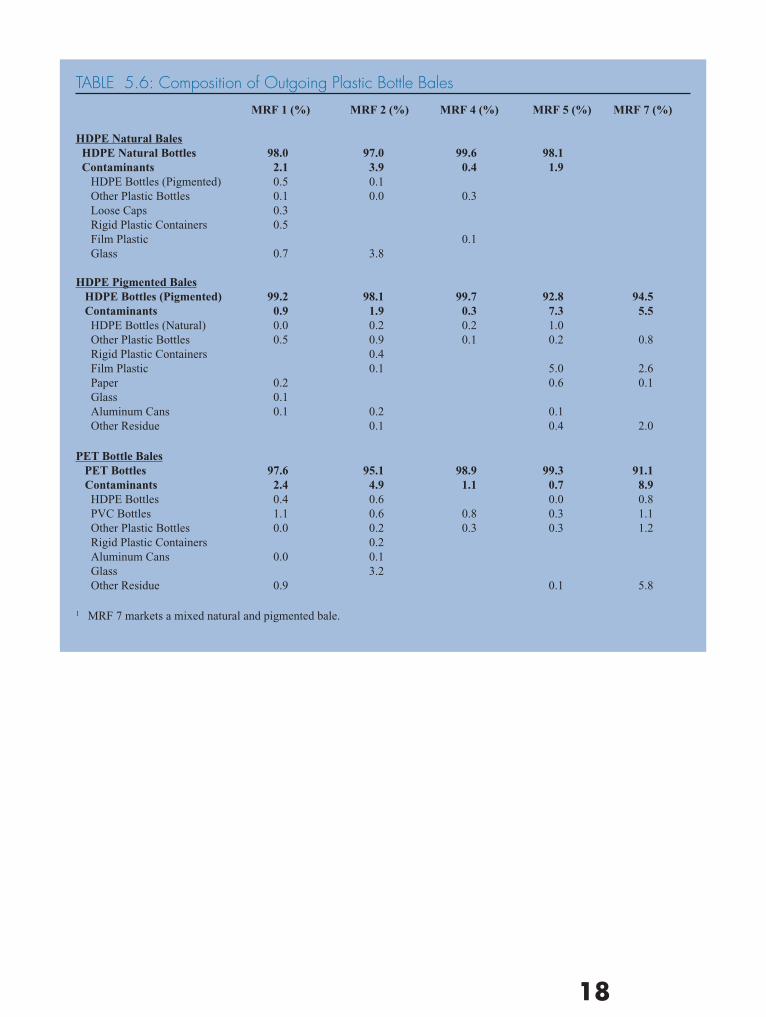
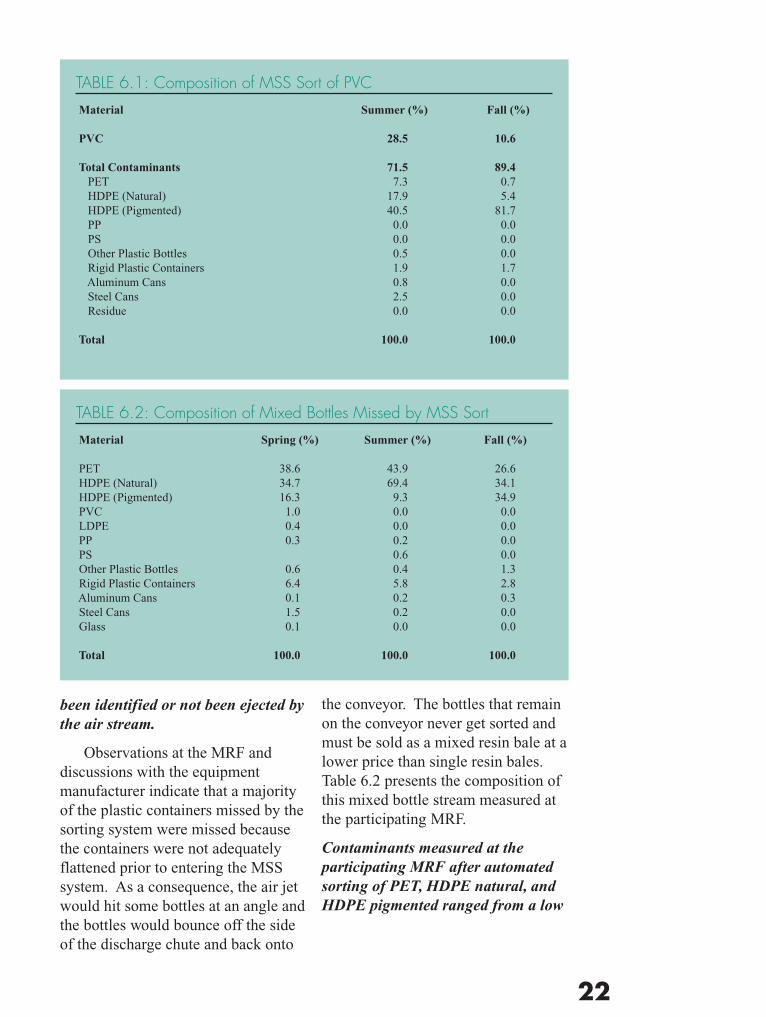
Table 6.1 illustrates the composi-tion of the PVC stream leaving theMSS line at the participating MRF.Between 71 and 89 percent of thematerial sampled over a two-dayperiod was not PVC.
Seventeen percent of the annualthroughput of the automated sortingline at the participating MRF wasmixed bottles that had either not
22
TABLE 6.2: Composition of Mixed Bottles Missed by MSS Sort
Material Spring (%) Summer (%) Fall (%)
PET 38.6 43.9 26.6 HDPE (Natural) 34.7 69.4 34.1 HDPE (Pigmented) 16.3 9.3 34.9 PVC 1.0 0.0 0.0 LDPE 0.4 0.0 0.0 PP 0.3 0.2 0.0 PS 0.6 0.0 Other Plastic Bottles 0.6 0.4 1.3 Rigid Plastic Containers 6.4 5.8 2.8 Aluminum Cans 0.1 0.2 0.3 Steel Cans 1.5 0.2 0.0 Glass 0.1 0.0 0.0
Total 100.0 100.0 100.0
been identified or not been ejected bythe air stream.
Observations at the MRF anddiscussions with the equipmentmanufacturer indicate that a majorityof the plastic containers missed by thesorting system were missed becausethe containers were not adequatelyflattened prior to entering the MSSsystem. As a consequence, the air jetwould hit some bottles at an angle andthe bottles would bounce off the sideof the discharge chute and back onto
TABLE 6.1: Composition of MSS Sort of PVC
Material Summer (%) Fall (%)
PVC 28.5 10.6
Total Contaminants 71.5 89.4 PET 7.3 0.7 HDPE (Natural) 17.9 5.4 HDPE (Pigmented) 40.5 81.7 PP 0.0 0.0 PS 0.0 0.0 Other Plastic Bottles 0.5 0.0 Rigid Plastic Containers 1.9 1.7 Aluminum Cans 0.8 0.0 Steel Cans 2.5 0.0 Residue 0.0 0.0
Total 100.0 100.0
the conveyor. The bottles that remainon the conveyor never get sorted andmust be sold as a mixed resin bale at alower price than single resin bales.Table 6.2 presents the composition ofthis mixed bottle stream measured atthe participating MRF.
Contaminants measured at theparticipating MRF after automatedsorting of PET, HDPE natural, andHDPE pigmented ranged from a low

23
of 5.3 percent to a high of 12.6percent.
Table 6.3 presents the sortingresults, over three different seasons,of material sorted by the MSS singleline system at the participating MRF.A small amount of quality controllabor (3 person-hours per 8-hour
shift) stationed on the baler feedconveyor was sufficient to furtherreduce contaminants to levels thatwere acceptable to plastic reclaimers.
TABLE 6.3: Composition of Outgoing Bottle Bales Sorted by an MSSSystem Integrated Into a MRF
Spring Summer Fall Material (%) (%) (%)
HDPE (Natural) 94.6 91.3 90.9 Total Contaminants 5.4 8.7 9.1 PET 1.5 3.3 3.5 HDPE (Pigmented) 1.5 2.0 3.1 PVC 0.3 0.0 0.0 PP 0.4 1.6 1.3 PS 0.0 0.0 0.0 Other Plastic Bottles 1.8 1.6 1.1 Miscellaneous Residue 0.0 0.1 0.2
HDPE (Pigmented) 87.4 94.7 93.0 Total Contaminants 12.6 5.3 7.0 PET 3.3 1.2 2.5 HDPE (Natural) 5.4 3.3 0.5 PVC 0.3 0.0 0.0 LDPE 0.0 0.0 0.0 PP 0.1 0.4 1.4 PS 0.0 0.0 0.0 Other Bottles 0.4 0.1 0.4 Rigid Plastic Containers 1.7 0.0 1.4 Aluminum 0.2 0.2 0.2 Steel 0.5 0.1 0.0 Polycoated Containers 0.1 0.0 0.0 Residue 0.6 0.0 0.7
PET 92.0 93.0 93.1 Total Contaminants 8.0 7.0 6.9 Brown PET 0.5 0.0 0.9 HDPE (Natural) 4.8 4.4 4.0 HDPE (Pigmented) 1.3 1.1 1.3 PVC 0.3 0.0 0.0 PP 0.2 1.4 0.6 PS 0.0 0.0 0.0 Other Plastic Bottles 0.2 0.0 0.1 Rigid Plastic Containers 0.6 0.0 0.0 Aluminum Cans 0.0 0.0 0.0 Steel Cans 0.0 0.0 0.0 Residue 0.0 0.0 0.0
Total may not add due to rounding.
24
PERFORMANCE OF AN MSSSINGLE LINE SYSTEM AT THEGARTEN SERVICES PRF
The Garten Services PRF provides analternative to sorting mixed plastic ata MRF. Garten Services receivesmixed plastic bales which are thensorted using an MSS single linesystem and manual quality controlsorters to produce single-resin balesfor sale to reclaimers.
The mixed bales are first brokenapart using a bale breaker consistingof a series of counter-rotating bladesthat separate the baled plastic intoindividual bottles and containers. Theseparated plastic containers enter thesorting conveyor and travel past asingle manual sorter/inspector who isresponsible for pulling off contami-nants (primarily film and paper). Theplastic containers then pass over atwo-stage screen. In the first stage,small pieces of plastic, dirt, gravel,and caps are removed. The secondstage separates small bottles andcontainers (<8 ounces), which arebaled and shipped commingled to aprocessor for reclamation.
Larger plastic containers pass overthe screen and onto the singulatingconveyors, which use three 90-degreeturns and a series of baffles located oneither side of a smaller conveyor toforce the plastic containers into asingulated stream. A gap filler sensesopenings on the singulated streamconveyor and drops plastic bottlesonto these areas to create a more evenflow to the MSS sorting line.
The MSS system uses four detec-tors to sort the plastic into as many asseven categories. The categories can
be varied based on market conditions.At the time of the MRF study, theGarten Services PRF was sorting intothe following categories:
� PVC
� HDPE Blue and White
� HDPE Red, Orange, and Yellow
� HDPE Colored
� PET
� HDPE Natural
� PP
After the appropriate scanner hasidentified the plastic resin, the bottleis tracked on the sorting conveyoruntil it reaches the appropriate ejec-tion point where a concentrated air jetblows the container onto an inclinefeed conveyor feeding the storage bin.Conveyors at the bottom front andback of the these bins are used toempty the bins and deliver the sortedplastic to quality control sorting lines.Sorters positively sort out any remain-ing contaminants and plastic contain-ers of the wrong resin type. Thenegatively sorted plastic is fed to ahorizontal baler, with the baled plasticsent to reclamation facilities.
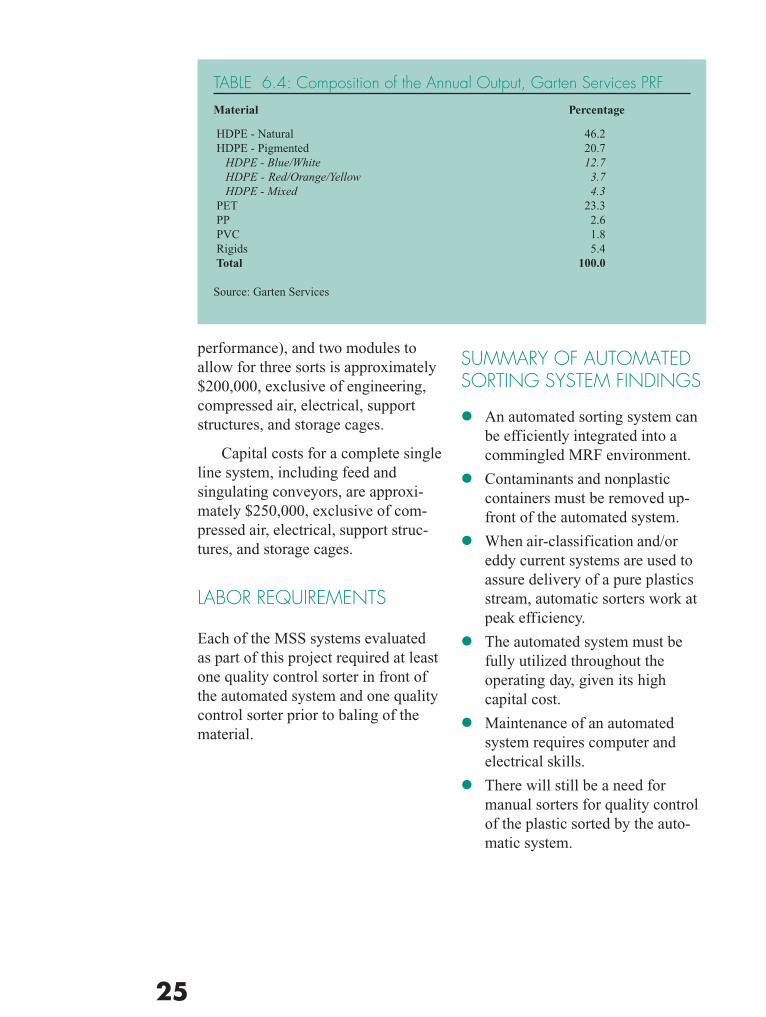
During the last fiscal year forwhich data are available, GartenServices sold approximately 3.6million pounds of plastic and dis-posed of an additional 252,000pounds of residue (6.5 percent residuerate). Table 6.4 illustrates the compo-sition of the output of the GartenServices PRF.
AUTOMATED SYSTEM COSTS
Capital costs for a complete binarysystem including a feed conveyor,perforator/flattener (to enhance
25
performance), and two modules toallow for three sorts is approximately$200,000, exclusive of engineering,compressed air, electrical, supportstructures, and storage cages.
Capital costs for a complete singleline system, including feed andsingulating conveyors, are approxi-mately $250,000, exclusive of com-pressed air, electrical, support struc-tures, and storage cages.
LABOR REQUIREMENTS
Each of the MSS systems evaluatedas part of this project required at leastone quality control sorter in front ofthe automated system and one qualitycontrol sorter prior to baling of thematerial.
SUMMARY OF AUTOMATEDSORTING SYSTEM FINDINGS
� An automated sorting system canbe efficiently integrated into acommingled MRF environment.
� Contaminants and nonplasticcontainers must be removed up-front of the automated system.
� When air-classification and/oreddy current systems are used toassure delivery of a pure plasticsstream, automatic sorters work atpeak efficiency.
� The automated system must befully utilized throughout theoperating day, given its highcapital cost.
� Maintenance of an automatedsystem requires computer andelectrical skills.
� There will still be a need formanual sorters for quality controlof the plastic sorted by the auto-matic system.
TABLE 6.4: Composition of the Annual Output, Garten Services PRF
Material Percentage
HDPE - Natural 46.2 HDPE - Pigmented 20.7
HDPE - Blue/White 12.7HDPE - Red/Orange/Yellow 3.7HDPE - Mixed 4.3
PET 23.3 PP 2.6 PVC 1.8 Rigids 5.4 Total 100.0
Source: Garten Services
26
Baling of sorted plastic bottles is asignificant cost and processing issueat MRFs. However, because there aremany good references available toMRF owners/operators concerningbaler design and operation,3 thisGuide does not attempt to duplicatethis information. Instead, only obser-vations that affect MRF efficiency arepresented.
Where automated feed horizontalbalers are used, the ability to feed theplastic to the baler, not baler cycletime, is the limiting factor in theproduction of a bale of plasticbottles.
Typically, the ability to convey asufficient number of plastic bottles tothe baler using a common conveyor isthe limiting factor. This is especiallythe case if quality control is occurringon the baler feed conveyor, or if aperforator is used to increase baledensity.
Perforation can increase plastic baledensity by 20 percent, reducingtrucking costs for plastic.
Use of a perforator/flattener toflatten plastic bottles prior to balingcan increase a tractor trailer load ofbaled plastic from 30,000 to between36,000 and 40,000 pounds. Transpor-tation of full truck loads significantlyreduces transportation costs, improv-
ing revenues received per pound ofplastic material.
However, perforators can slowdown baling time requiring that surgecapacity be installed between theperforator and the baler to maximizebaler efficiency.
COMPOSITION OF ANNUALMRF CONTAINER LINE OUTPUT
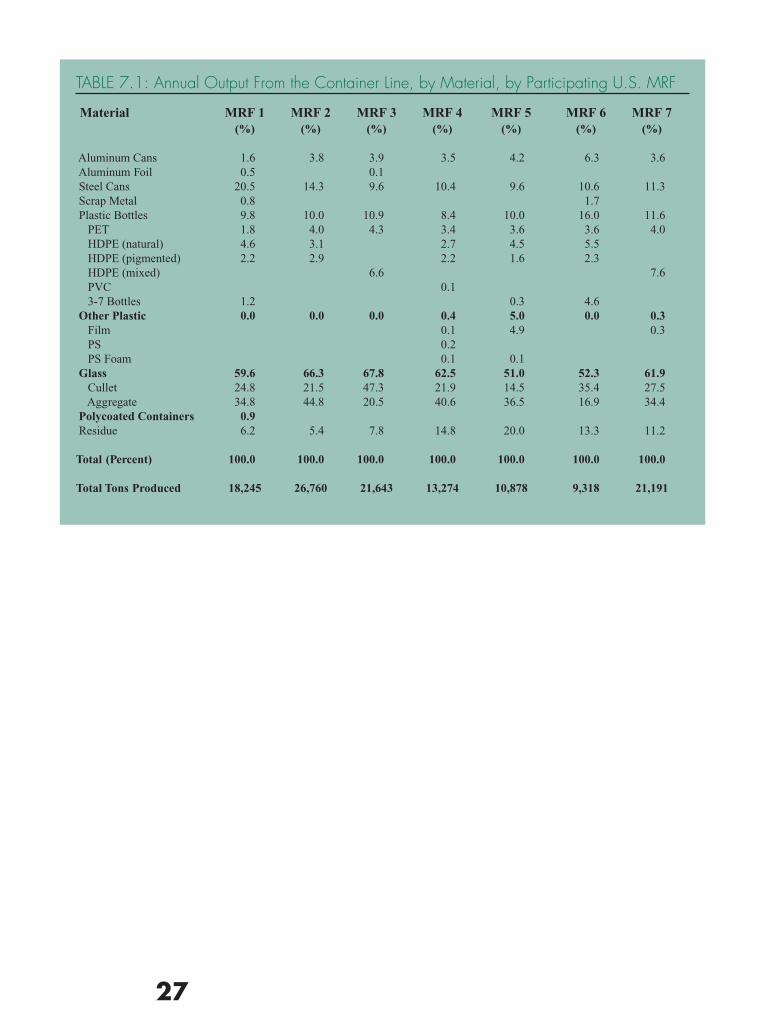
Data were obtained from all of theparticipating MRFs on the annualoutput of material, by type. Asillustrated by Table 7.1, plastic bottlescomprised 8.4 to 16.0 percent of totalcontainer tonnage processed.
Glass aggregate, material not re-turned for use in glass containers, onaverage represented 32.4 percent oftotal output from the container lineat the participating MRFs, andranged from 17 percent to 45 per-cent.
As previously discussed in thisGuide, management of the incomingmaterial to reduce storage time cansignificantly reduce glass breakage.MRF 6, which has a policy of clean-ing the tipping floor at the end of eachday, has a glass aggregate output ofless than one-half the average for theparticipating MRFs. The large rangein glass aggregate indicates that this isan area with significant potential forimprovement at some MRFs.
7. MATERIAL DENSIFICATION AND MRF OUTPUT
3See, for example Recycling Today, “BalerGuide,” February 1997.
27
TABLE 7.1: Annual Output From the Container Line, by Material, by Participating U.S. MRF
Material MRF 1 MRF 2 MRF 3 MRF 4 MRF 5 MRF 6 MRF 7 (%) (%) (%) (%) (%) (%) (%)
Aluminum Cans 1.6 3.8 3.9 3.5 4.2 6.3 3.6 Aluminum Foil 0.5 0.1 Steel Cans 20.5 14.3 9.6 10.4 9.6 10.6 11.3 Scrap Metal 0.8 1.7 Plastic Bottles 9.8 10.0 10.9 8.4 10.0 16.0 11.6 PET 1.8 4.0 4.3 3.4 3.6 3.6 4.0 HDPE (natural) 4.6 3.1 2.7 4.5 5.5 HDPE (pigmented) 2.2 2.9 2.2 1.6 2.3 HDPE (mixed) 6.6 7.6 PVC 0.1 3-7 Bottles 1.2 0.3 4.6 Other Plastic 0.0 0.0 0.0 0.4 5.0 0.0 0.3 Film 0.1 4.9 0.3 PS 0.2 PS Foam 0.1 0.1 Glass 59.6 66.3 67.8 62.5 51.0 52.3 61.9 Cullet 24.8 21.5 47.3 21.9 14.5 35.4 27.5 Aggregate 34.8 44.8 20.5 40.6 36.5 16.9 34.4 Polycoated Containers 0.9 Residue 6.2 5.4 7.8 14.8 20.0 13.3 11.2
Total (Percent) 100.0 100.0 100.0 100.0 100.0 100.0 100.0
Total Tons Produced 18,245 26,760 21,643 13,274 10,878 9,318 21,191
28
8. COMPUTER MODELING OF MRF OPERATIONSAND COSTSOne valuable way to assess options toimprove processing efficiency is toorganize processing and cost data in acomputer spreadsheet, or “model.”Some of the larger MRF operatorshave developed their own models,which are not publicly available.Other models have been developed toanalyze a specific MRF or processingissue, but are not readily available foruse by other MRF operators. Addi-tional models are currently beingdeveloped.4
EPIC and the Ontario Ministry ofEnvironment and Energy (OMEE)contracted with Proctor & RedfernLimited to develop a computer modelthat could be used by EPIC and byMRF operators to examine the re-source and equipment requirementsand the cost impacts of processingrecyclable materials in a MRF.
After development and testing ofthe model, EPIC utilized the model toanalyze plastic container sorting andprocessing costs and efficiency at sixCanadian MRFs in 1996. The APCagreed with EPIC to utilize the sameprocessing model for the parallelU. S. study. The intent was to use acommon tool so that data would beorganized in a uniform manner allow-ing for comparison of the results andcombination of information.
The model is in a spreadsheetformat based on Microsoft Excelsoftware. It is, of necessity, a largespreadsheet, in order to adequatelyincorporate all of the processing andcost parameters of a commingledMRF. It has been utilized in thisproject for the container line of theMRF only, although it can be appliedto paper processing lines as well.
MRF operators may find that themodel is a useful planning and man-agement tool for organizing data ontheir MRF, especially for assessingnecessary belt speeds and comparingsorter productivity against otherMRFs. The model can also be used asa tool to assess contemplated changesin processing equipment, labor inputs,or materials accepted at a MRF.
The model can be downloadedfrom APC’s website atwww.plasticsresource.com/recycle ora disk containing the model can bemailed to you by calling APC (800-2-HELP-90).
The appendix to this Guide,“EPIC MRF Model for AssessingMRF Operations and Costs,” is ageneral user guide for the model. Adetailed line-by-line description of themodel is available from EPIC, 5925Airport Road, Suite 500, Mississauga,Ontario, M3C3K3.
4See, for example, MRF Software Model,Analytical Research and Economic Strategies,Inc., Bethesda, Maryland.

29
It should be noted that the modelis the property of EPIC and theOntario Ministry of Environment andEnergy. Model assumptions andformulas are locked and cannot beaccessed by the user. Therefore, itmust be used with caution because theassumptions and related formulas maynot be consistent with the relevant
ones for any given MRF. However,despite this limitation, the modelremains a useful tool for organizingdata on an operating MRF, especiallyfor those MRF operators who havenot developed their own spreadsheetmodels or who do not have access tocompany models.
30
Ultimately, improvements in process-ing efficiency must be measured inimprovements to the bottom line,through reduced costs and increasedrevenues. Detailed information oncosts are proprietary and thereforebeyond the scope of this Guide. Inaddition, many costs are unique toeach MRF. For example, labor andutility rates vary from region toregion, and land, building, and equip-ment costs are often affected by thearrangements between the publicsector using the MRF and the privateMRF operator/owner.
For these reasons, data on costs atthe participating MRFs are presentedas ranges only, not as specific costsfor each MRF. The range of costs canbe used by MRF operators as a roughindication of other MRF costs.
More importantly, the EPICmodel can be used to organize costsfor a specific MRF. Changes toimprove efficiency can then be evalu-ated to estimate the potential cost andrevenue impacts on the specific MRF.
To fully understand where costsavings might be, it is useful toallocate MRF capital and operatingcosts among the various materialsprocessed at the MRF. These allo-cated costs can then be used to assessways to improve efficiency on amaterial-by-material basis.
9. ALLOCATION OF COSTS AMONG MATERIALS
There are many ways to allocatecosts, and no single methodology isuniversally accepted. Therefore, it isimportant to specify the assumptionsthat are made as part of the allocationprocess.
The EPIC model divides costsinto the following five categories:
� Buildings and Land Capital Cost
� Equipment Capital Cost
� Labor
� Building/Equipment Operationand Maintenance
� Administrative
The model allows the user toallocate costs among materials withineach category on the basis of weight,volume, or units of recyclable mate-rial recovered. The user can alsoassign all or a portion of the costs ofspecific equipment or individualsorters to a specific material, irrespec-tive of weight, volume, or units.
It should be noted here that themodel is only useful for examiningcosts in a single year, with capitalcosts either amortized at specifiedinterest rates and terms or depreciatedat a specified rate. The model is notset up to perform more sophisticatedinvestment analysis, such as netpresent value or internal rate of returncalculations. Finally, the model isstructured to present average costs asopposed to marginal costs, althoughmarginal costs can be estimated from
31
the difference in average costs undertwo sets of conditions.
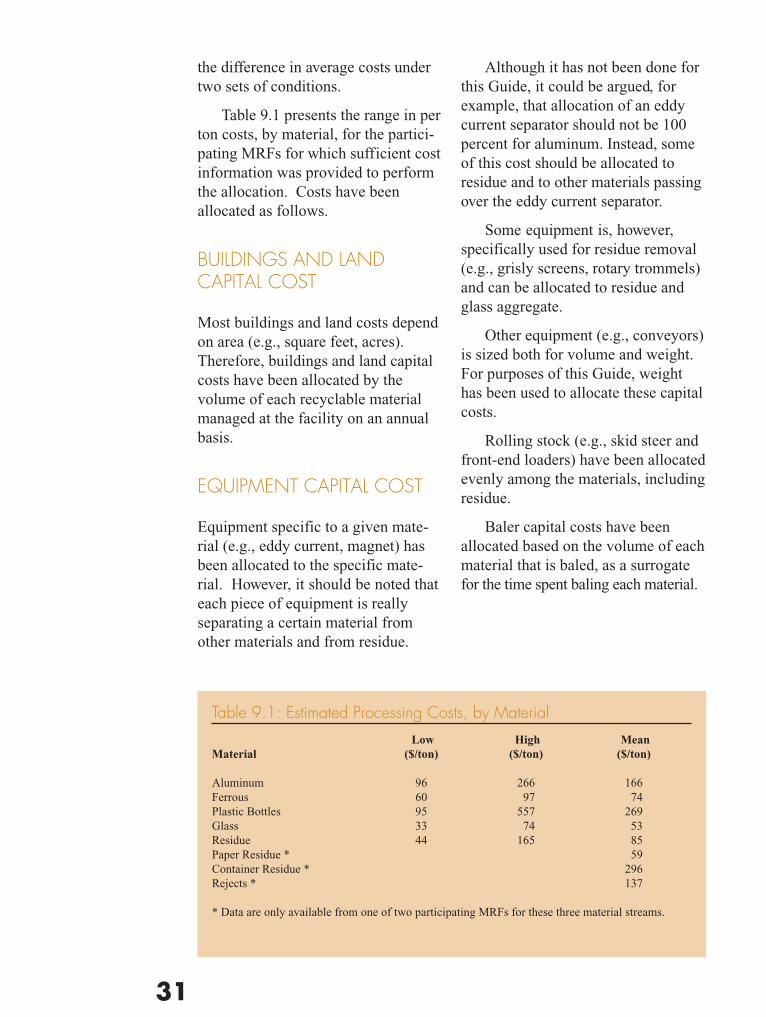
Table 9.1 presents the range in perton costs, by material, for the partici-pating MRFs for which sufficient costinformation was provided to performthe allocation. Costs have beenallocated as follows.
BUILDINGS AND LANDCAPITAL COST
Most buildings and land costs dependon area (e.g., square feet, acres).Therefore, buildings and land capitalcosts have been allocated by thevolume of each recyclable materialmanaged at the facility on an annualbasis.
EQUIPMENT CAPITAL COST
Equipment specific to a given mate-rial (e.g., eddy current, magnet) hasbeen allocated to the specific mate-rial. However, it should be noted thateach piece of equipment is reallyseparating a certain material fromother materials and from residue.
Although it has not been done forthis Guide, it could be argued, forexample, that allocation of an eddycurrent separator should not be 100percent for aluminum. Instead, someof this cost should be allocated toresidue and to other materials passingover the eddy current separator.
Some equipment is, however,specifically used for residue removal(e.g., grisly screens, rotary trommels)and can be allocated to residue andglass aggregate.
Other equipment (e.g., conveyors)is sized both for volume and weight.For purposes of this Guide, weighthas been used to allocate these capitalcosts.
Rolling stock (e.g., skid steer andfront-end loaders) have been allocatedevenly among the materials, includingresidue.
Baler capital costs have beenallocated based on the volume of eachmaterial that is baled, as a surrogatefor the time spent baling each material.
Table 9.1: Estimated Processing Costs, by Material
Low High MeanMaterial ($/ton) ($/ton) ($/ton)
Aluminum 96 266 166Ferrous 60 97 74Plastic Bottles 95 557 269Glass 33 74 53Residue 44 165 85Paper Residue * 59Container Residue * 296Rejects * 137
* Data are only available from one of two participating MRFs for these three material streams.

32
LABOR
Sorting labor has been allocatedbased on videotape observations ofthe material sorted, including residue.
Rolling stock labor has beenallocated evenly among materials.
Maintenance labor is more diffi-cult to allocate. However, given theimpact of broken glass on equipment,especially conveyor maintenance,maintenance labor has been allocatedbased on weight of materials.
BUILDING/EQUIPMENTMAINTENANCE ANDOPERATIONS
Building and equipment maintenanceand operation have been allocated byweight.
ADMINISTRATIVE
Administrative costs have beenallocated evenly among materials, bydividing total administrative costs bythe number of materials managed atthe MRF.
IMPACT OF RESIDUES
As illustrated in Table 9.1, residueremoval has significant impacts onlabor and equipment costs at allMRFs. For this reason, residue istreated as a material, and costs allo-cated to residue similar to othermaterials.
ALLOCATION OF COST BYCOST CATEGORY
It is also useful to allocate costsamong the EPIC cost categories tohighlight areas with the greatestpotential for efficiency improvements.
As illustrated by Table 9.2, labor,averaging 42 percent of overall cost,is the largest single cost category.Therefore, improving sorter produc-tivity should be of utmost importanceto all MRF operators.
Table 9.2: Allocation of Costs by Cost Category (percent of totalannual costs)
Low High Mean
Buildings/Land Capital 1 7 19 13 Equipment Capital 2 9 17 13 O & M 12 42 22 Labor 28 52 44 Administration 5 20 12
1 Amortized over 15 years.2 Amortized over 7 years.