sorana d. bolboacăsorana.academicdirect.ro/pages/doc/eng2014/course_12.pdf · ©2013 ‐ sorana d....
TRANSCRIPT

HYPOTHESIS TESTING III
Sorana D. Bolboacă

©2013 ‐ Sorana D. BOLBOACĂ
OUTLINEANOVA testChi‐square testTests on proportions
16‐Dec‐2013
2

©2013 ‐ Sorana D. BOLBOACĂ
THREE OR MORE MEANS: ANOVA
Are the means of k groups different?H0: There are no differences among the mi.H1: A difference exists somewhere among the groups
Is the t‐test appropriate? No, because the t‐test compare two groups and this approach will increase the size of the error to 9.75% instead of 5%
16‐Dec‐2013
3
©2013 ‐ Sorana D. BOLBOACĂ
THREE OR MORE MEANS: ANOVA
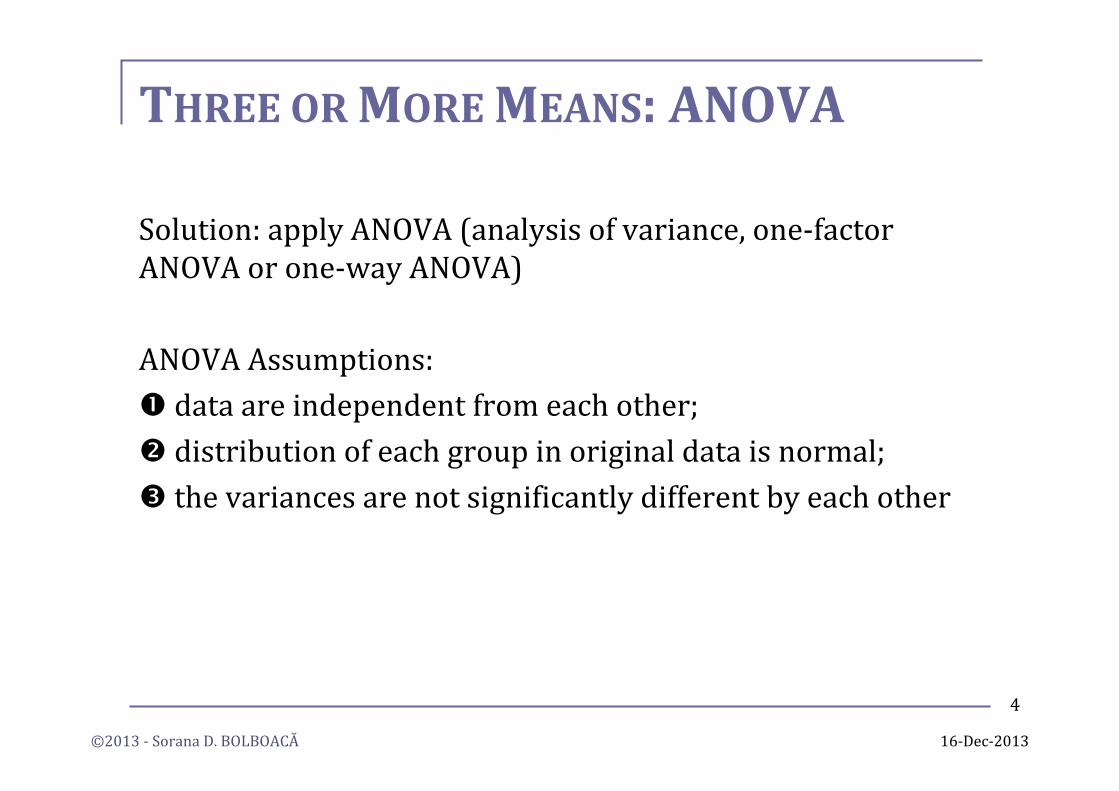
Solution: apply ANOVA (analysis of variance, one‐factor ANOVA or one‐way ANOVA)
ANOVA Assumptions: data are independent from each other; distribution of each group in original data is normal; the variances are not significantly different by each other
16‐Dec‐2013
4

©2013 ‐ Sorana D. BOLBOACĂ
THREE OR MORE MEANS: ANOVAHypotheses: H0: There are no differences among means vs. H1: There are one or more differences somewhere among meansVerify assumptions: normal distribution; not statistically different variancesα = 0.05 – df = k‐1 (numerator) and df = n‐k (denominator)F = MSM/MSEIf F > Fcrit→ reject H0; F < Fcrit→ failed to reject H0
16‐Dec‐2013
Source of variability
Sum of Squares Mean of squares
Abb Formula df Abb Formula
Mean SSM ∑k ni·(mi‐m)2 k‐1 MSM SSM/(k‐1)Error SSE SST – SSM n‐k MSE SSE/(n‐k)Total SST ∑n(xi‐m)2 n‐1 MST SST/(n‐1)
5

©2013 ‐ Sorana D. BOLBOACĂ
THREE OR MORE MEANS: ANOVA PROBLEMα=0.05; df: k‐1=3‐1=2; n‐k=301‐3=298; Fcrit = 3.03; m = 66.8;
SST = 19670.3; MST = 65.57
16‐Dec‐2013
PSA CaP risk group n m s
< 4 ng/ml Low 89 66.1 9.1
4−10 ng/ml Uncertain 164 66.3 7.8>10 ng/ml High 48 69.6 6.4PSA=prostate‐specific antigen; CaP = prostate cancer; n = sample size; m = mean; s = standard deviation
Source of variability
Sum of Squares Mean of squares
Abb Formula df Abb Formula
Mean SSM ∑k ni·(mi‐m)2 k‐1 MSM SSM/(k‐1)Error SSE SST – SSM n‐k MSE SSE/(n‐k)Total SST ∑n(xi‐m)2 n‐1 MST SST/(n‐1)
6

©2013 ‐ Sorana D. BOLBOACĂ
THREE OR MORE MEANS: ANOVA PROBLEM
SSM = ∑k ni·(mi‐m)2 = 89*(66.1‐66.8)^2+ 164*(66.3‐66.8)^2+ 48*(69.6‐66.8)^2 = 460.93MSM = SSM/2 = 460.93/2 = 230.47SSE =SST‐SSM = 19670.3 ‐ 460.93 = 19209.37MSE = SSE/298 = 19209.37/298 = 64.46F = MSM/MSE = 230.47/64.46 = 3.58Since 3.58 > 3.03 → a difference among means exists
16‐Dec‐2013
PSA CaP risk group n m s
< 4 ng/ml Low 89 66.1 9.1
4−10 ng/ml Uncertain 164 66.3 7.8>10 ng/ml High 48 69.6 6.4PSA=prostate‐specific antigen; CaP = prostate cancer; n = sample size; m = mean; s = standard deviation
7

©2013 ‐ Sorana D. BOLBOACĂ
TESTING ASSOCIATION IN CONTINGENCY TABLE
We can perform a hypothesis test on a contingency table. The test we will use most often is the Chi‐square test (χ2 test).χ2 TestIs proper to be applied if the sample size is largeThe test is valid if the expected frequency of each cell is at least equal to 1 and the observed frequency is of 5If the above‐described conditions are not meet, the Fisher exact test is the proper test
8
9‐Dec‐2013
8

©2013 ‐ Sorana D. BOLBOACĂ
χ2 TEST
Indicate if that the two variables are or are not independent BUT DO NOT quantify the power of association between them.Steps:1. Define the hypotheses2. Define the parameter of the test3. Define the significance level4. Define the critical interval5. Calculate the observed value of the parameter of
the test6. Make a decision 9
9‐Dec‐2013
9

©2013 ‐ Sorana D. BOLBOACĂ
χ2 TEST: PROBLEM
The association between Streptococcus mutans (as risk factor) and dental caries was studied. A sample of 620 patients was investigated. The sample contains: 150 patients with caries and Streptococcus mutans, 230 patients without caries and without Streptococcus mutans and 60 patients with caries but without Streptococcus mutans. The presence of Streptococcus mutans is asscoiated with dental caries? (df=1; α=0.05; χ2critical = 3.84).
10
9‐Dec‐2013
10

©2013 ‐ Sorana D. BOLBOACĂ
χ2 TEST: 1. HYPOTHESES
H0:There is no association between Streptococcus mutansand dental caries.The presence of Streptococcus mutans and dental caries are independent.
H1/Ha:There is an association between Streptococcus mutansand dental caries.The presence of Streptococcus mutans and dental caries are not independent.
11
9‐Dec‐2013
11

©2013 ‐ Sorana D. BOLBOACĂ
χ2 TEST: 2. PARAMETER OF THE TEST
Follow a distribution law with (r‐1)·(c‐1) degree of freedom
whereχ2 = the parameter of χ2 testfio = observed frequencyfit = expected/theoretic frequency
∑⋅
=
−=χ
cr
1iti
2ti
0i2
f)ff(
12
9‐Dec‐2013
12

©2013 ‐ Sorana D. BOLBOACĂ
χ2 TEST: 3. SIGNIFICANCE LEVEL
Let α = 0.05 (5%) be the significance level.
13
χ2 TEST: 4. CRITICAL REGION
Critical region: [χα2, ∞)For α = 0.05:χα2 = 3.84[3.48, ∞)
9‐Dec‐2013
13

©2013 ‐ Sorana D. BOLBOACĂ
χ2 TEST: 5. PARAMETER OF THE TESTobservedobserved DC+ DC‐ TotalSP + TP = 150 FP = 180 330SP ‐ FN = 60 TN = 230 290Total 210 410 620
expectedexpected DC+ DC‐ TotalSP + = 330×210/620 = 330×410/620 330SP ‐ = 290×210/620 = 290×410/620 290Total 210 410 620
9‐Dec‐2013
14

©2013 ‐ Sorana D. BOLBOACĂ
χ2 TEST: 5. PARAMETER OF THE TEST
observedobserved DC+ DC-SP + 150 180SP - 60 230
192)192230(
98)9860(
218)218180(
112)112150( 2222
2 −+
−+
−+
−=χ
expectedexpected DC+ DC-SP + = 112 = 218SP - = 98 = 192
192)38(
98)38(
218)38(
11238 2222
2 +−
+−
+=χ
77.4152.773.1463.689.121921444
981444
2181444
11214442 =+++=+++=χ
15
9‐Dec‐2013
15

©2013 ‐ Sorana D. BOLBOACĂ
Χ2 TEST:6. MAKING DECISION
If χ2 ∈[3.84, ∞) H0 is rejected with a risk of error of type I(α).
If χ2 ∉[3.84, ∞) H0 is accepted with a risk of error of type II (β).
Since 41.77∈[3.84, ∞) H0 is rejected with a risk of error of 5%.There is an association between There is an association between Streptococcus Streptococcus mutansmutans and dental caries.and dental caries.
9‐Dec‐2013
16

©2013 ‐ Sorana D. BOLBOACĂ
CONTINUITY CORRECTION (YATES'S CORRECTION)
For small sample sizes the χ2 test is too likely to reject the null hypothesis (it tends to spot differences where none really exist). A continuity correction can be made to allow for this. Two conditions have to be met:
All expected frequencies must be greater than 1 80% of observed frequencies must be greater than 5
17∑⋅
=
−−=χ
cr
1iti
2ti
0i2
f5.0|ff|
Yates’s correction
9‐Dec‐2013
17

©2013 ‐ Sorana D. BOLBOACĂ
FISHER'S EXACT TEST
Chi‐square procedures can be legitimately applied only if all values of E are equal to or greater than 5.If a 2×2 contingency table fails to meet the conditions required for the χ2 test then Fisher's exact test can be used.It is based on different mathematics to the χ2 test which are more robust when sample sizes are small.
18
9‐Dec‐2013
18

©2013 ‐ Sorana D. BOLBOACĂ
FISHER'S EXACT TESTH0: there is no association between smoking and dental cariesIf the null hypothesis is true ‐ if any ostensible association between smoking and dental caries were the result of nothing more than mere chance coincidence ‐how likely is it that we might end up with a result this large or larger?
observedobserved DC+ DC‐ Totalsmoking + TP = 2 FP = 7 9smoking ‐ FN = 8 TN = 2 10Total 10 9 19
9‐Dec‐2013
19

©2013 ‐ Sorana D. BOLBOACĂ
FISHER'S EXACT TEST
Suppose that the initial assessment was performed and the number of subjects who do and do not show characteristics (smoking and dental caries) were counted, but have not yet sorted the subjects according to the correspondences of smoking and dental caries. In this case, all they would have would be the marginal totals shown in the following table/Given these marginal totals, there are 10 possible ways in which the specific correspondences between smoking and dental caries.
DC+ DC- Totalsmoking + 9smoking - 10Total 10 9 19
20
9‐Dec‐2013
20
©2013 ‐ Sorana D. BOLBOACĂ
FISHER'S EXACT TEST
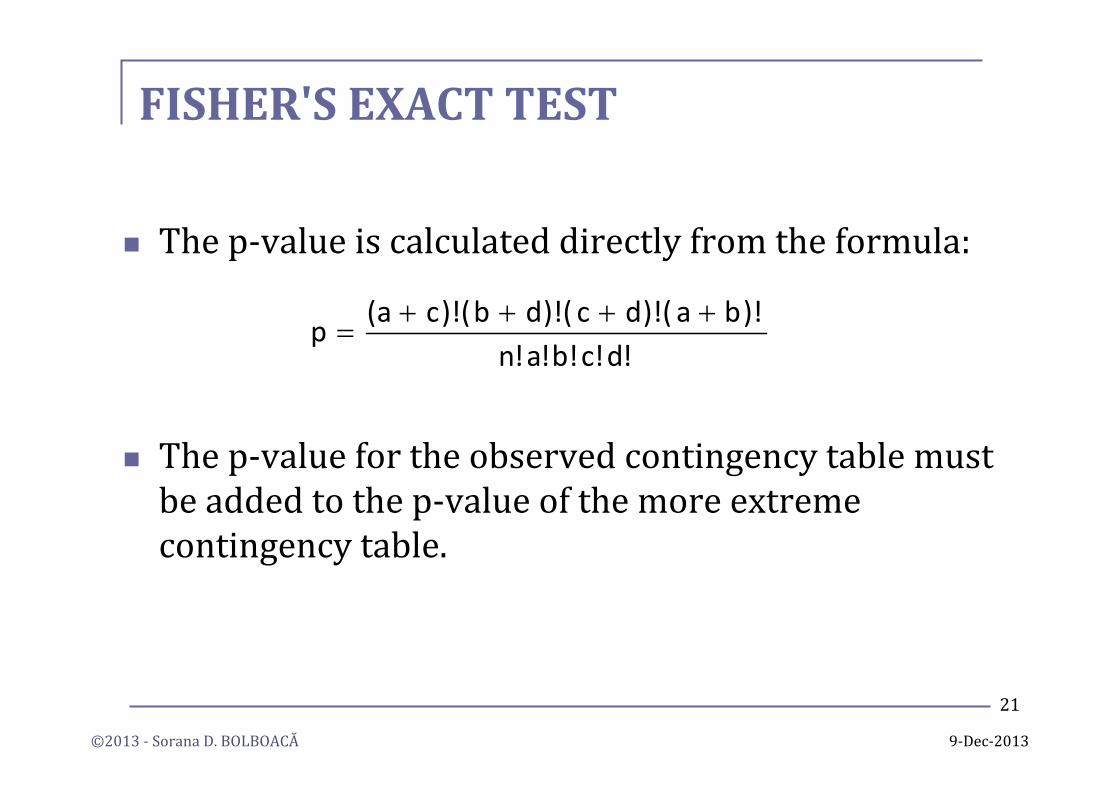
The p‐value is calculated directly from the formula:
The p‐value for the observed contingency table must be added to the p‐value of the more extreme contingency table.
!d!c!b!a!n)!ba)!(dc)!(db)!(ca(
p++++
=
21
9‐Dec‐2013
21

©2013 ‐ Sorana D. BOLBOACĂ
FISHER'S EXACT TEST
ObsObs DC+ DC- Totalsmoking + 6 2 8smoking - 1 6 7Total 7 8 15
ExpExp DC+ DC- Totalsmoking + 7 1 8smoking - 0 7 7Total 7 8 15
22
The p‐value must be calculated for the two contingency tables:
Therefore p = p1+p2 = 0.0305 + 0.0012 = 0.0317
0012.0!7!0!7!15!8!7!8!7
p0305.0!6!2!6!15!8!7!8!7
p 21 ====
The p‐value = 0.0317 < α = 0.05 ⇒ smoking is associated with dental caries.
9‐Dec‐2013
22

©2013 ‐ Sorana D. BOLBOACĂ 9‐Dec‐2013
23
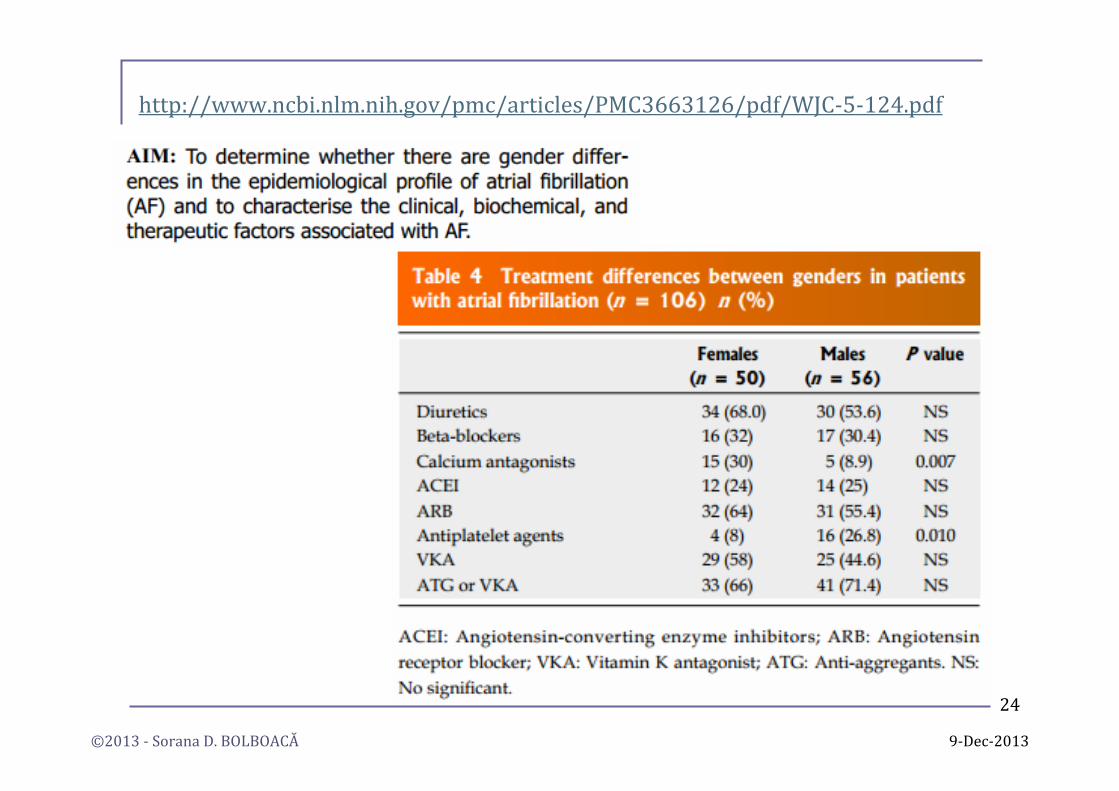
http://www.ncbi.nlm.nih.gov/pmc/articles/PMC3663126/pdf/WJC‐5‐124.pdf
©2013 ‐ Sorana D. BOLBOACĂ 9‐Dec‐2013
24
http://www.ncbi.nlm.nih.gov/pmc/articles/PMC3663126/pdf/WJC‐5‐124.pdf

©2013 ‐ Sorana D. BOLBOACĂ
TESTS ON PROPORTIONS
16‐Dec‐2013
25

©2013 ‐ Sorana D. BOLBOACĂ
TESTS ON PROPORTIONS
16‐Dec‐2013
26
©2013 ‐ Sorana D. BOLBOACĂ
TESTS ON PROPORTIONS – PROBLEM
16‐Dec‐2013
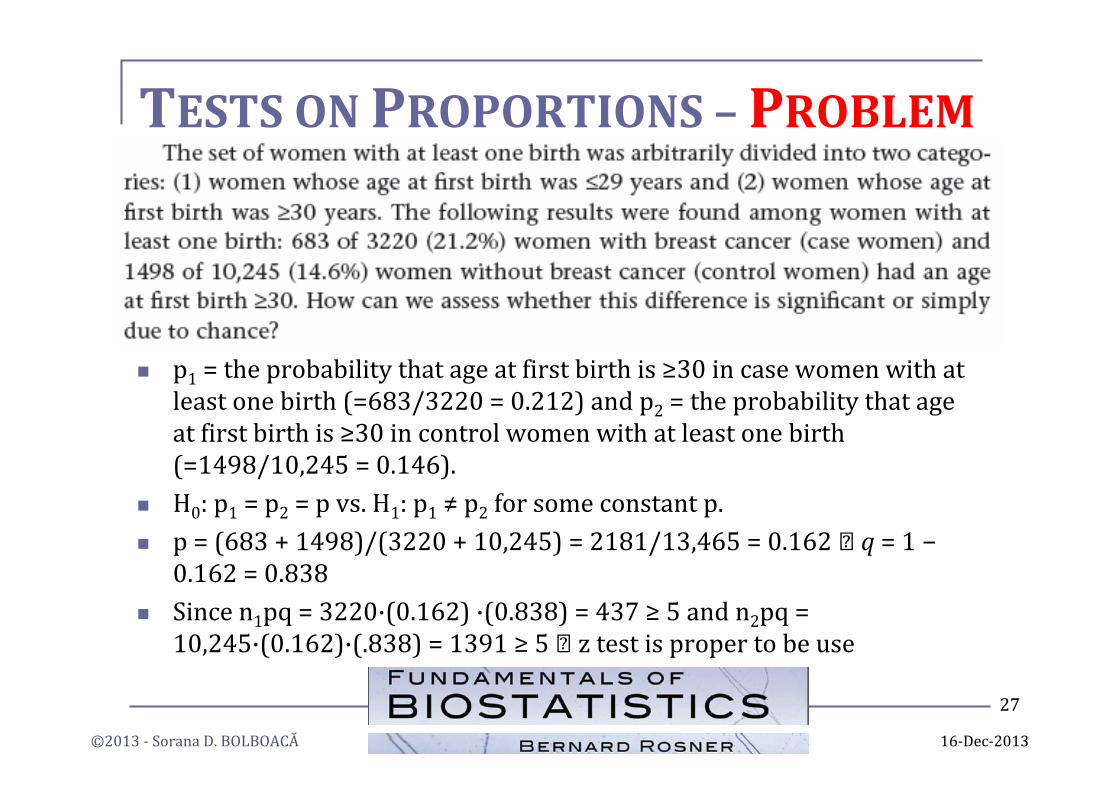
p1 = the probability that age at first birth is ≥30 in case women with at least one birth (=683/3220 = 0.212) and p2 = the probability that age at first birth is ≥30 in control women with at least one birth (=1498/10,245 = 0.146).H0: p1 = p2 = p vs. H1: p1 ≠ p2 for some constant p.p = (683 + 1498)/(3220 + 10,245) = 2181/13,465 = 0.162 q = 1 −0.162 = 0.838Since n1pq = 3220·(0.162) ·(0.838) = 437 ≥ 5 and n2pq = 10,245·(0.162)·(.838) = 1391 ≥ 5 z test is proper to be use
27

©2013 ‐ Sorana D. BOLBOACĂ
TESTS ON PROPORTIONS – PROBLEM
16‐Dec‐2013
28

©2013 ‐ Sorana D. BOLBOACĂ
TESTS BY EXAMPLE
Mihály O, Bolboacă SD, Rahaian R, Bodolea C, Chira C, Cristea T, Oblezniuc A, Mihály ZA, Coman I. Accuracy of Neutrophil Gelatinase‐Associated Lipocalin in Detecting Acute Kidney Injury after Urogenital Robotic Assisted Laparoscopic Surgery under General Anesthesia. Applied Medical Informatics 2012;30(2):47‐56.
16‐Dec‐2013
29

©2013 ‐ Sorana D. BOLBOACĂ
TESTS BY EXAMPLE
Badiu Tişa ID, Bolboacă S, Miu N, Iacob D. Efficiency of Oxygen Therapy by Simple Face Mask and Nasal Cannula for Acute Respiratory Failure in Infants and Young Children. Notulae Scientia Biologicae 2013;5(4):407‐411.
16‐Dec‐2013
30

©2013 ‐ Sorana D. BOLBOACĂ
TESTS BY EXAMPLE
Botar‐Jid C, Bolboacă SD, Damian L, Dudea SM, Pantilie C, Nedevschi S, Badea R. Assessment of Sonoelastography as Diagnosis Tool of Inflammatory Myopathies. Applied Medical Informatics 2010;27(4):81‐89.
16‐Dec‐2013
31
©2013 ‐ Sorana D. BOLBOACĂ
TESTS BY EXAMPLE
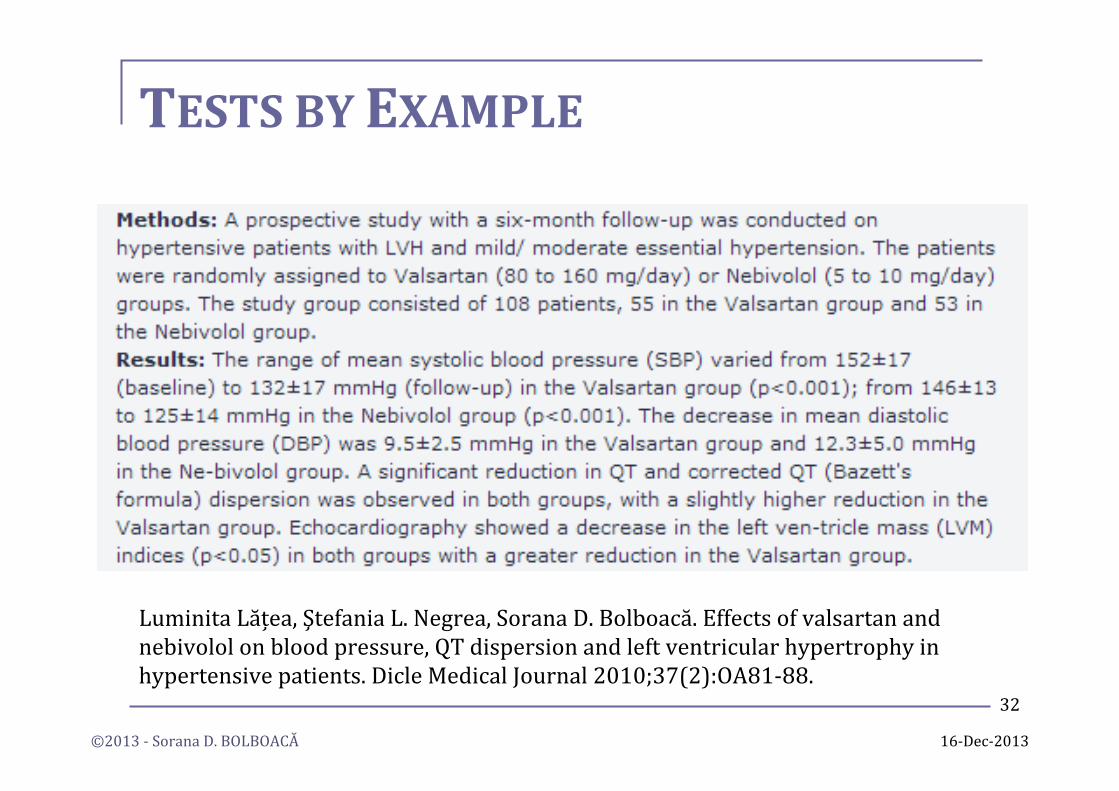
Luminita Lățea, Ştefania L. Negrea, Sorana D. Bolboacă. Effects of valsartan and nebivolol on blood pressure, QT dispersion and left ventricular hypertrophy in hypertensive patients. Dicle Medical Journal 2010;37(2):OA81‐88.
16‐Dec‐2013
32

©2013 ‐ Sorana D. BOLBOACĂ 9‐Dec‐2013
STATISTICS AND MEDICAL PRACTICE
33
Source: http://kingeofdremes.wordpress.com/