sonoma valley hospital 2012 three-year rolling strategic plan
TRANSCRIPT

Sonoma Valley Hospital 2012 Three-Year Rolling Strategic Plan

Sonoma Valley Hospital 2012 Three-Year Rolling Strategic Plan
2
Table of Contents
Executive Summary..................................................................................................... 3 Situation Analysis ................................................................................................................ 6
Strategic Initiatives ................................................................................................... 11 Quality and Service Excellence Theme ............................................................................. 11 People and Innovation Theme .......................................................................................... 12 Growth and Community Theme ....................................................................................... 13 Financial Stability Theme .................................................................................................. 14 Strategic Map .................................................................................................................... 15
Service Area Definition ............................................................................................. 16 Competitor Profile ............................................................................................................ 17 Labor and Market Statistics .............................................................................................. 18
Service Area Demographics ....................................................................................... 20 Population by Age and Zip Code ....................................................................................... 20 Population Growth by Zip Code ........................................................................................ 22 Population Growth by Age Cohort .................................................................................... 23 Hispanic Population by Zip Code ...................................................................................... 24 Median Household Income ............................................................................................... 25 2010 Patient Origin ........................................................................................................... 26
Hospital Utilization and Market Share ....................................................................... 27 Inpatient Market Share – California State Data ................................................................ 27 Inpatient Surgical Market Share – California State Data .................................................. 28 Outpatient Market Share – Ambulatory Surgery ............................................................. 29 Outpatient Market Share – Emergency Department Visits by Primary Payer ................. 30 Medicare Inpatient Market Share Trend .......................................................................... 31 Medicare Inpatient Market Share by Zip Code ................................................................. 32 Medicare Inpatient Market Share by Zip Code and Hospital ........................................... 33 Medicare Inpatient Market Share by Service Line ........................................................... 34 Medicare Inpatient Market Share – Surgeries .................................................................. 35 Medicare Patient Outmigration ........................................................................................ 36 Inpatient Demand Estimates ............................................................................................ 37 Outpatient Demand Estimates by Service Line ................................................................ 38
Cultural Assessment .................................................................................................. 39 How Culture Works ........................................................................................................... 39 Sonoma Valley Hospital’s Current Culture ....................................................................... 40 Sonoma Valley Hospital’s Ideal Culture ............................................................................ 41 The Future ......................................................................................................................... 42

Sonoma Valley Hospital 2012 Three-Year Rolling Strategic Plan
3
Executive Summary The Sonoma Valley Hospital three-year rolling strategic plan is the culmination of planning sessions held with the Executive Management Team, Board and Physicians from September to December 2011. On December 7, 2011, the hospital held a public meeting at the Community Center and approximately 25 people attended and offered their input on the new strategic plan. The draft plan was distributed to over 100 Sonoma Valley leaders and community members prior to this meeting. Finally, a Board retreat was held on December 8, 2011, to review the market assessment and to prioritize the short-term initiatives (12 – 18 months.) The strategic planning process included the following objectives:
1. Conduct an environmental and market assessment to assess the future and determine the growth and financial opportunities in the marketplace;
2. Conduct a cultural assessment to determine the current culture and determine if we are in a position to continue to improve quality, customer service, staff development, accountability and ownership;
3. Develop a 3-Year rolling strategic plan based on a clear mission, vision, values and develop measurable objectives to be achieved within the first 12 – 18 months;
4. Understand the perspectives and needs of key stakeholders such as the physicians, community leaders, district residents, businesses and payers.
5. Quantify the demand for existing services as the analytical foundation for planning and then develop the hospital’s approach. .
Environment Assessment Hospitals and health systems face an unprecedented intensity and pace of changes in the near and longer-term future. The American Hospital Association Committee on Research issued its “Strategic Issues Forecast for 2015” which described the “health care transformation” being driven by two overriding themes: “achieving better value” and “improving health.” The committee projected five major strategic issues:
1) Efficiency - With a slow recovering economy and emergency health care policy changes, there will be increasing pressure on all health care organizations to increase efficiency. As the Affordable Care Act’s encouragement to extended healthcare coverage to more uninsured Americans, there will not be enough money in the system unless care is provided more efficiently.
2) New payment models – such as value-based purchasing, shared savings, quality improvement incentives, and bundled hospital-physician payments for episodes of care will shift fee for service payments and incentives to treating the sick to incentives to first keep people healthy as well as treating their ills safely and effectively when care is required.

Sonoma Valley Hospital 2012 Three-Year Rolling Strategic Plan
4
3) Reduce cost of care - Bending the cost curve will be essential for the long-term
financial sustainability of health care for the nation and maintaining global competitiveness for the economy.
4) New models of care – such as medical homes and accountable care organizations that emphasize care coordination across hospitals and health systems, other providers, and the community will be a critical element for quality improvement.
5) Quality – Quality is improving, but must be further accelerated. AHRQ found improvement has occurred in quality measures of hospital’s acute treatment, but significant opportunities still lie untapped in such areas as: access to prevention and primary care services, adoption of evidence-based best practices, and reduction of disparities in mortality following complications among minority groups.
Market Assessment
The strategic planning process for Sonoma Valley Hospital includes a comprehensive market assessment. The major findings from the market assessment are follows:
Combined Service area (which includes the majority of the healthcare district) population is 38,426 of which SVH has 47.8% if all inpatient admissions and 48.6% market share in the primary service area in 2010. This is up from 2007 of which it was 46.4%.
Kaiser Hospitals have 17.9% of all inpatient admissions from our service area.
19.5% of the combined service area is over 65 years of age which is significantly higher than the 13% average in the United States. Sonoma’s population is projected to decrease slightly over 5 years and the hospital’s growth is not expected to come from increases in population.
Our highest inpatient market share is in Rehabilitation or “Skilled Nursing” at 95%. The other service lines performing above 50% are: Gynecology at 59.1%, by Medicine at 56.7%, Gastroenterology at 54.4%, Pulmonary at 50.9%.
Opportunities for improving inpatient market share based on our primary hospital services include Orthopedics which is currently at 37% up from 2007 at 33.9%; Obstetrics which is currently 47.5% down from 53.3% in 2007; and General Surgery which is currently 32.9% down from 39.7% in 2007.
Overall surgery market share continues to be flat in 2010 at 27% with outpatient surgery market share at 31.8%. The highest market share is in Gynecology at 59.4%, followed by Orthopedics at 33.9% and General Surgery at 32.9%.
Emergency market share continues to be high at 69.5% for the combined service area. Seventy three percent of these patients were Medicare and 10% were Medi-Cal.

Sonoma Valley Hospital 2012 Three-Year Rolling Strategic Plan
5
Forty one percent of Medicare patients in our combined service area are receiving care outside of Sonoma Valley Hospital.
The Hispanic population is expected to grow from 25.2% of the total population in 2010 to 28.9% in 2015.
Our greatest Medicare inpatient market share is held in the city of Sonoma and no significant market share is held in any target service areas. We do have 15.3% of the market in Kenwood.
Based on national trends and the iVantage demand model, inpatient demand is expected to increase by 2.1% from 2010 – 2015.
Based on national trends and the iVantage demand model, demand is expected to increase in diagnostics by 7.1% and outpatient visits by 5.6%
Average physician age is improving after the addition of 3 new primary care physicians, 2 general surgeons and 1 orthopedic physician. There is still a need for an additional GYN.
Medicare is our largest payor at 74% and pays us 89% of current costs. Medi-cal is our second largest payer and pay us 72% of current costs.
A significant number of Sonoma businesses in our service area are small they do not qualify or cannot afford most commercial insurance plans, therefore local employers often choose Kaiser.
Culture Assessment
An organization culture inventory was performed in October, 2011 to determine if our organization has a constructive culture and if we have the ability to effectively execute strategic initiatives. It was determined that the “right” behaviors are currently expected and encouraged at Sonoma Valley Hospital and there is clear direction and high intensity to achieve results.
Balanced Dashboard
In keeping with the balanced dashboard and our continued focus on positive results in all areas, we decided to identify our strategies by the following themes:
Quality and Service Excellence
People and Innovation
Growth and Community
Financial Stability Since the hospital is performing well compared to the national averages in Quality and Service Excellence and the culture assessment shows that SVH is in an excellent position for continued positive change with our “people,” the leadership and board chose to focus on the growth, community, financial stability and innovation for the major strategies beginning in 2012. The hospital is committed to become a best practice quality hospital and to guide Sonoma residents through their healthcare journey. Success will be measured in 12 – 18 months on the following 5 major initiatives:

Sonoma Valley Hospital 2012 Three-Year Rolling Strategic Plan
6
1) Continue to enhance and grow our regional system for financial stability
and be positioned for healthcare reform
2) Reduce out-migration through partnerships with commercial and senior insurance companies to encourage local businesses to stay local
3) Increase efficiency and become profitable with Medicare patients
through improved utilization and efficient inpatient care
4) Partner with physicians on the borders of the healthcare district to encourage patients to travel the same distance and yet use Sonoma Valley Hospital especially for Orthopedics, Bariatrics and Women’s Health
5) Improve the health of the community with a special focus on our growing populations: Seniors and Latino.
Situation Analysis
SVH is a nonprofit district hospital located in the city of Sonoma California, with a publicly elected Board of Directors. The hospital has 83 licensed beds, 6 of which are critical care beds and 27 of which are skilled nursing beds, and an average daily census of approximately 44. Sonoma Valley Hospital is completing our transformation as we continue to ensure that quality health care services are easily accessible and local. We strive to fortify our financial position so that we can continue to reinvest in our community and infrastructure. SVH is affiliated with Marin General Hospital in Marin County through a management services agreement. This partnership has helped SVH develop financial stability by enhancing clinical affiliations and continuing to recruit top providers to Sonoma. Through collaboration and consolidation with other hospitals, we are in a better position for healthcare reform and expenses are better controlled. Physicians are the lifeline of our hospital. We have created excellent partnerships with our local medical community, including Sonoma Community Health Center. We strive to achieve a seamless continuum of care that serves both the physician and patient. SVH has over 100 physicians on the medical staff, with most specialties represented locally. In 2011, Sonoma Valley Hospital joined in an alliance with Prima Medical Foundation which now employs 7 physicians in Sonoma. Marin General Hospital is also a member of this physician foundation.

Sonoma Valley Hospital 2012 Three-Year Rolling Strategic Plan
7
Clinical and service excellence is our foundation. With excellent clinical outcomes as demonstrated by national core quality measures, we continue to modernize our care through our new Electronic Health Record and care management. Our patient satisfaction is our motivation. With the assistance of Studer Group, we are now above the hospital average in satisfaction and continue to rise. The master facility plan was completed in 2011. With the support of our community, the hospital is completing the necessary improvements to become seismically stable and is breaking ground on our new Emergency and Surgical Wing in early 2012. As we enhance our community trust, we have begun to see more philanthropic support which will be the mechanism to bring Sonoma Valley residents a state of the art healthcare facility.
Sonoma Valley Hospital 2012 Three-Year Rolling Strategic Plan
8
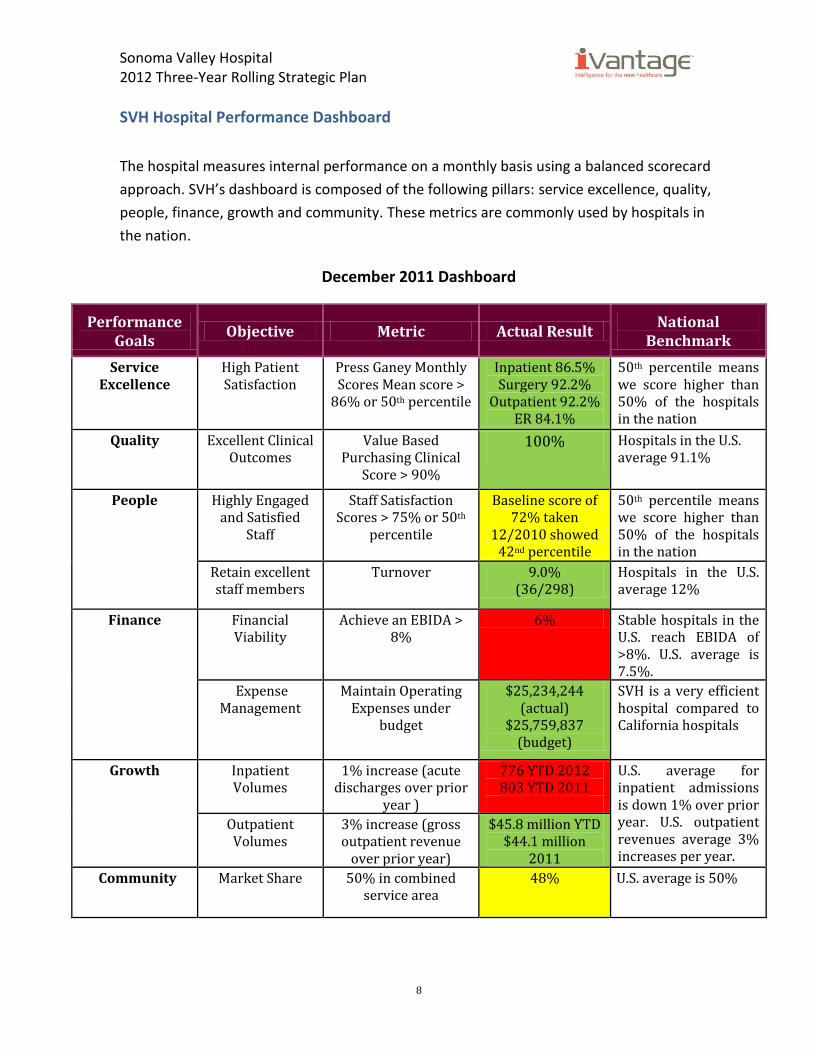
SVH Hospital Performance Dashboard
The hospital measures internal performance on a monthly basis using a balanced scorecard
approach. SVH’s dashboard is composed of the following pillars: service excellence, quality,
people, finance, growth and community. These metrics are commonly used by hospitals in
the nation.
December 2011 Dashboard
Performance Goals
Objective Metric Actual Result National
Benchmark
Service Excellence
High Patient Satisfaction
Press Ganey Monthly Scores Mean score >
86% or 50th percentile
Inpatient 86.5% Surgery 92.2%
Outpatient 92.2% ER 84.1%
50th percentile means we score higher than 50% of the hospitals in the nation
Quality
Excellent Clinical Outcomes
Value Based Purchasing Clinical
Score > 90%
100%
Hospitals in the U.S. average 91.1%
People
Highly Engaged and Satisfied
Staff
Staff Satisfaction Scores > 75% or 50th
percentile
Baseline score of 72% taken
12/2010 showed 42nd percentile
50th percentile means we score higher than 50% of the hospitals in the nation
Retain excellent staff members
Turnover
9.0% (36/298)
Hospitals in the U.S. average 12%
Finance
Financial Viability
Achieve an EBIDA > 8%
6% Stable hospitals in the U.S. reach EBIDA of >8%. U.S. average is 7.5%.
Expense Management
Maintain Operating Expenses under
budget
$25,234,244 (actual)
$25,759,837 (budget)
SVH is a very efficient hospital compared to California hospitals
Growth
Inpatient Volumes
1% increase (acute discharges over prior
year )
776 YTD 2012 803 YTD 2011
U.S. average for inpatient admissions is down 1% over prior year. U.S. outpatient revenues average 3% increases per year.
Outpatient Volumes
3% increase (gross outpatient revenue
over prior year)
$45.8 million YTD $44.1 million
2011
Community Market Share 50% in combined service area
48% U.S. average is 50%

Sonoma Valley Hospital 2012 Three-Year Rolling Strategic Plan
9
SVH Historical Financial Performance Trends
(Dollars in Thousands)
FY 2007 FY 2008 FY 2009 FY 2010 FY 2011 Projected FY 2012
Net Revenues 38,208 39,037 40,905 40,063 45,764 48,714
Labor Expense 22,195 22,454 23,185 22,841 24,436 24,999
Nonlabor Expense 18,509 20,741 20,100 20,489 25,362 27,607
Total Expenses 40,704 43,195 43,285 43,329 49,978 52,605
Net Income (434) (3,079) 955 842 1,217 1,100
SVH Payer Mix
Sonoma Valley Hospital has experienced a dramatic shift in payer mix, and this explains the struggle with financial stability. The Medicare payer mix exceeds the state average of 36.3 percent and continues to increase as our area’s over 65 population grows. Medicare payments are low and cover only 89 percent of the cost of hospital operations. Our Medi-Cal payer mix is below the national average of 25%, but it covers only 72 percent of current costs. Our medically indigent payer mix is also increasing. Charity care and bad debt costs have increased from $2,364,621 in FY 2007 to $3,874,865 in FY 2011.
SVH Payer Mix
Medicare 54.3%
Medi-Cal 11.7%
Third Party 30.9%
Indigent & Other 3.1%

Sonoma Valley Hospital 2012 Three-Year Rolling Strategic Plan
10
Our Mission
To restore, maintain and improve the health of everyone in our community.
Our Vision
SVH will be a nationally recognized, compassionate place of healing and known
for excellence in clinical quality. We serve as the guide and indispensable link for
our community’s health care journey.
Our Values (CREATING)
Compassion: We always show consideration of the feelings of others at all times.
Respect: We always acknowledge the value and gifts of another person.
Excellence: We exceed the expectations of the people we serve.
Accountability: We are reliable, self-responsible owners of the
outcomes of our organization.
Teamwork: We are productive and participative staff members
who energize others.
Innovation: We seek new and creative solutions and ways to exceed expectations.
Nurturing: We cultivate, develop and educate those with whom we work to achieve their highest potential.
Guidance: We direct and lead our community members
through their healthcare journey and in health improvement.

Sonoma Valley Hospital 2012 Three-Year Rolling Strategic Plan
11
Strategic Initiatives under the Balanced Dashboard
Quality and Service Excellence
People and Innovation
Growth and Community
Financial Stability
Strategic Initiatives:
Quality and Service Excellence Case for Action:
Our vision is to be known as a place of healing and be recognized as a best practice quality hospital. This requires that quality, safety and customer service be major hospital priorities. Quality must be evident and transparent and requires buy-in and ownership of the physicians, providers and employees to achieve our high strategic goals. Patient safety is the first dimension of quality, and unless patients are safe in our organization, quality of care is not delivered. Continuous performance improvement monitoring is integrated throughout the hospital to insure the hospital is always meeting standards. As the hospital is refurbished and the new addition is added, the patient focus and healing environment will be evident to all visitors. Sonoma Valley Hospital will strive to achieve the best quality and customer service standards while reducing costs and improving efficiency. Executive Champion: Goni Naidoo, Chief Nursing Officer Objective: Provide the highest level of healthcare in partnership with our providers,
staff, and community members. Measures of Success:
Achieve top 10 percentile for CMS Core Measures or > 80 in VBP Clinical score
Achieve 50% improvement in patient satisfaction scores and strive to achieve 95th percentile by 2014
Achieve 100% of selected patient safety goals
Reach a “most wired” level of 5 out of 7 Major Activities/ActionSteps over the next 36 Months:
1. Create a culture of safety so each and every employee feels empowered to take actions for improved patient safety
2. Provide outstanding customer service and achieve 95th percentile for all

Sonoma Valley Hospital 2012 Three-Year Rolling Strategic Plan
12
satisfaction scores (inpatient, outpatient, surgery and emergency) by partnering with Studer Group and offering patient centered care as we complete the Master Facility Plan
3. Adopt the Institute for Healthcare Improvement’s eight steps to achieving patient safety and high reliability and use a best practice hospital safety culture system and adopt IHI’s Board on Board’s for improved quality
4. Continue to improve case management to give the right care and the right time with the most efficiency and at the lowest cost
5. Achieve the Meaningful Use Objectives identified in the CMS Electronic Health Record (EHR) Incentive Program through the development of a complete community-wide electronic health record and reach 5/7 in “most-wired” hospital survey
6. Achieve high physician satisfaction and engagement through involvement and monitoring of Medical Director goals and results and creating checklist culture
7. Participate in the national Nursing Quality Indicators to continuously build nursing skill level, increase competency and achieve magnet status
People and Innovation
Case for Action: The values of SVH spell CREATING and are the touchstone for our positive culture. We will foster cultural practices that retain and reward our outstanding employees. We will sustain a workforce environment that attracts and retains talented physicians and providers. We will continue to strengthen and sustain physician, administrative and staff leadership and require accountability at all levels of the organization. Creative and innovative solutions will be fostered for complex clinical quality and other issues. The staff will proactively meet standards, anticipate change and participate in continuous education. Executive Champion: Paula Davis, Chief Human Resources Officer Objective: Recruit and retain quality employees and create a safe and rewarding work
environment and offer state of the art, efficient technology to support high satisfaction
Measures of Success:
Maintain a turnover rate of <10%
Achieve an employee survey return rate of 75%
Achieve 60th percentile in employee satisfaction. Strive to reach 95% employee satisfaction.
Major Activities/Action Steps Next 36 Months:
1. Conduct annual staff satisfaction and engagement survey with high participation to understand opportunities for improvement and implement action plans to improve

Sonoma Valley Hospital 2012 Three-Year Rolling Strategic Plan
13
results 2. Assess the effectiveness of Sonoma Valley’s reward and recognition program to
insure we recognize the right behavior, have a consistent system and involve staff members
3. Implement hiring practices that ensure the right person (staff, leadership and physicians) for the right position
4. Invest in continued development of SVH leadership and staff knowledge and skills in quality, team building and process improvement techniques
5. Create a reliable communication system whereby all stakeholders are informed 6. Offer a wellness program that inspires stakeholders to become health role models
for our patients and community 7. Build employee education and growth through expanded SVH offerings and
encourage team members to visit other hospitals to learn best practices
Growth and Community
Case for Action: A major key to the success of the vision is growth in volume and offering the appropriate mix of primary and specialty care. SVH’s combined service area population is projected to decrease 1.47% over the next five years. SVH had a 48.6% inpatient market share in the primary service area and a 39.5% in the secondary service area. Half of all patients are leaving the SVH’s service area for inpatient services. Inpatient surgical share is 27.2% in the primary service area while outpatient surgery share in the primary service area is 33.2%. There is a need to secure additional volume from the service area through clinical reputation, growth in targeted service/specialty lines, acquiring existing inpatient and outpatient market share and clinical affiliation opportunities with Marin General Hospital. Executive Champion: Kelly Mather, Chief Executive Officer Objective: To increase SVH’s total revenue and market share through enhancements of
existing and expansion of new services. Measures of Success:
Inpatient market share increase to > 50% by 2012
Revenue growth in targeted zip codes of Kenwood and Novato by 5%
Increased annual outpatient volumes by 3% annually Major Activities/Action Steps Next 36 Months:
1. Create a viable Regional Care Management system with 3–5 local District Hospitals implementing select clinical partnerships with Marin General Hospital and affiliates to enhance the services in Sonoma and position ourselves for healthcare reform
2. Reduce out-migration through partnerships with health plans to offer both commercial and senior health insurance products that are competitive and encourages patients to stay local for healthcare Grow select service lines to drive net

Sonoma Valley Hospital 2012 Three-Year Rolling Strategic Plan
14
margin growth in the following areas: Primary Care, Orthopedic Surgery, General Surgery (including Bariatrics) and Women’s Health
3. Partner with physicians in our bordering areas of Kenwood and Novato encourage patients to drive the same distance and choose Sonoma Valley Hospital
4. Open the new Surgery wing with a special focus on attracting patients in the North Bay needing Total Joint Replacement, Orthopedics, Uro-Gynecology and Bariatric services
5. Partner with community organizations and schools to offer health screenings and education with a focus on improving the health of our Senior and Latino residents
6. Develop and implement a Physician Development and Succession Plan that includes recruitment of new and retention of existing physicians
7. Create a new Diagnostics Center by upgrading the lobby, Laboratory, Imaging and Cardiopulmonary environment for better patient access and technology
8. Work with other healthcare providers in the area to improve health and reduce costs such as Hospice By the Bay and Sonoma Valley Community Health Center
9. Explore other clinical partnership opportunities using telemedicine programs
Financial Stability Case for Action: Maintaining a preferred level of financial performance may be challenging in the SVH service area. There is a compelling need to focus on growth of revenues that result in achieving a greater share of the marketplace for both inpatients and outpatients. Meeting SVH’s financial requirements through marketing initiatives, continued facility improvements, investment in technology and creating the best place to work will be important to our future performance. Executive Champion: Rick Reid, Chief Financial Officer Objective: Achieve desired level of profitability by increasing net revenue, controlling
costs, maintaining an effective investment strategy, and streamlining the revenue cycle.
Measures of Success:
Increase net revenue by 5% over 2010
Maintain departmental revenue and expenses within 5% of budget
Decrease Accounts Receivable Days to 50
Increase EBIDA % to > 8% Major Activities/Action Steps Next 36 Months:
1. Improve financial stability by breaking even on Medicare through focused case management to give the right care and the right time in the most efficient way with physicians actively leading best practice utilization
2. Evaluate, monitor and provide direction for the fundraising efforts of the Sonoma

Sonoma Valley Hospital 2012 Three-Year Rolling Strategic Plan
15
Valley Hospital’s philanthropy to ensure maximum return on contributions
3. Continue to follow and update the 3-year financial plan that includes capital, facility
renovations and technology investment as well as other investments that are
required to improve and maintain operations
4. Optimize the revenue cycle management process to improve financial performance and customer service and benchmark financial performance against published best practices.
5. Explore select partnership opportunities to decrease operating costs and improve third party contracting.
Sonoma Valley Hospital Strategic Map, 2012 - 2013
Goal Initiative Initiative Person Target Date
Patient Safety Culture of safety (AAHRQ) IHI’s 8 steps for pt. safety LL 12/2012
Care Management Medicare profitability Low readmission rates LL 2/2013 Patient Centered Care Facility upgrades for patient
healing & experience Studer Group partnership for 75th percentile
KM/MK 5/2013
Nursing Competency Nursing education Magnet status LL/MK 2/2013 Medical Staff Engagement
Succession plan & recruitment
Checklist reliability RC 6/2013
Technology Most Wired level of 4 Meaningful use – Stage 1 RR 1/2013 Financial Stability Net revenue increases Better line of credit RR 10/2012 Revenue Cycle Meet national benchmarks Cash on hand > 45 days RR 6/2013 Staff Satisfaction Annual Improvement Action
Plans 75% participation rate PD 6/2012
Staff Retention 60th percentile on staff satisfaction
50th percentile pay practices
PD 6/2013
Staff Wellness Staff participation rate > 75% Wellness Education Program for staff
DK 1/2013
Service Line Growth Targeted Marketing for Ortho, Bariatrics, Women, Seniors & Latinos
Border Strategy with Physicians
MD 9/2012
Improving Health Active Aging wellness program for Seniors
Better access to care & prevention for Latinos
DK 3/2013
Regional Care System District Hospital System Health Plan partners KM 1/2013 Master Facility Plan Complete Phase 1 w/ New
Wing Plan new Diagnostics Center KM 6/2013
Philanthropy Capital Campaign for ER/OR Cultivate donors for lifetime giving
KM 12/2012

Sonoma Valley Hospital 2012 Three-Year Rolling Strategic Plan
16
Service Area Definition
Sonoma Valley Hospital is located approximately 45 miles north of San Francisco in Sonoma, California. Recent population estimates show Sonoma’s combined service area having a population of 38,426 in 2010 with 16% ages 14 and younger, 35% between 15-44, 30% between the ages of 45-64, and 20% 65+. Sonoma Valley Hospital’s combined service area is listed below and mapped out in figure 1.
Sonoma Valley Hospital Service Area
Primary Service Area Secondary Service Area
95476-Sonoma 95442-Glen Ellen
Target Service Area 1 Target Service Area 2 Target Service Area 3
94558-Napa 95409-Santa Rosa 94952-Petaluma
94559-Napa 95452-Kenwood 94954-Petaluma
94599-Yountville 94945-Novato
94947-Novato
Combined Service Area = Primary+Secondary Area 94949-Novato
Total Service Area= Combined+Target Areas
Figure 1: Sonoma Valley Hospital Primary Service Area

Sonoma Valley Hospital 2012 Three-Year Rolling Strategic Plan
17
Competitor Profile Listed below are Sonoma Valley Hospital’s competitors in terms of market presence. Sonoma captured 47.8% of all inpatient admissions from the combined service area in 2010. Kaiser Hospitals in Santa Rosa and San Rafael each captured 8% of the combined service area.
Tables 2 and 3 below show the facility operating indicators as well as beds and days information for Sonoma Valley Hospital and its competitors in 2010.
Table 1: Sonoma Valley Hospital’s Market Competitors
Combined Service Area
Table 2: 2010 Market Competitors Operating Indicators
*Combined service area all-payer market share

Sonoma Valley Hospital 2012 Three-Year Rolling Strategic Plan
18
Labor and Market Statistics Figure 2 shows the annual labor force vs. employment figures in Sonoma County since 2006. Since 2006 the county’s labor force has decreased only 0.5% and employment fell almost 7%. The unemployment rate during the same time period rose from 4 to 10.1 and was as high as 10.5 in 2010 (Figure 3).
Table 3: 2010 Market Competitors Bed and Days Information
Figure 2: Labor Force v. Employment – Sonoma County 2006-2011
244,452 246,672 245,067
231,761 227,565 227,722
254,620 257,825 259,891 256,483 254,195
253,346
210,000
220,000
230,000
240,000
250,000
260,000
270,000
2006 2007 2008 2009 2010 2011
Employment Labor Force

Sonoma Valley Hospital 2012 Three-Year Rolling Strategic Plan
19
Table 4 compares and contrasts state and national utilization rates over the 5-year period from 2005-2009. During this time the US saw an increase in utilization rates for emergency visits and ‘other’ outpatient visits. California also saw an increased utilization of emergency visits and ‘other’ outpatient visits. Utilization rates for all other categories below decreased from 2005-2009.
Figure 3: Unemployment Rate – Sonoma County
2006-2011
4 4.2
5.6
9.5
10.5 10.1
0
2
4
6
8
10
12
2006 2007 2008 2009 2010 2011
Unemployment Rate
Table 4: U.S. and California Utilization Rates:
2005-2009
CA Admissions 95.9 95.3 90.4 94.6 92.9
Inpatient Days 509.4 508 473.5 493.3 475.7
Inpatient Surgeries 25.7 25.4 26.3 24.7 24.3
Births 14 14.6 14.2 14.4 13.5
Emergency Visits 265 285.6 276.2 275.2 285.5
Other Outpat ient Visits 1104.9 1213.5 991.8 1060.9 1020
Outpat ient Surgeries 35.5 34.4 34.5 35.8 33.8
TrendUtilization Rates 2005 2006 2007 2008 2009
US Admissions 119.1 118.5 117.2 117.5 115.7
Inpatient Days 666.3 657.6 645.1 644.2 627.5
Inpatient Surgeries 34.1 33.8 33.8 33.2 32.9
Births 13.5 13.6 13.5 13.4 12.9
Emergency Visits 388 396.4 400.6 404.2 414.6
Other Outpat ient Visits 1588.1 1611.5 1599.9 1646.2 1676.4
Outpat ient Surgeries 59 57.7 56.9 57 56.5
Source: State Stat ist ics - AHA Stat ist ics
Source: US Dept of Labor, Bureau of Labor Statistics
2011 Annual is average of first 8 Months

Sonoma Valley Hospital 2012 Three-Year Rolling Strategic Plan
20
Service Area Demographics
Population by Age and Zip Code Sonoma Valley Hospital’s combined service area has a population which includes the City of Sonoma. Figure 4 shows population densities for the combined service area. The target service area population totals more than 256,000. Table 6 shows each zip code’s population distribution by age.
Figure 4: 2010 Service Area Population Densities
Table 5: 2010 Service Area Populations by Age and Zip Code

Sonoma Valley Hospital 2012 Three-Year Rolling Strategic Plan
21
Figure 6 shows Sonoma Valley Hospital’s combined and total service area age distribution contrasted with state and national figures. Sonoma’s combined service area is older (45+) than California and The United states as a whole. Table 7 shows the age distributions that are graphed below.
15.8% 34.5% 30.2% 19.5%
21.3%
43.1%
24.5%
11.1% 20.1%
40.6%
26.3%
13.0%
17.5%
36.6%
29.5%
16.5%
0%
5%
10%
15%
20%
25%
30%
35%
40%
45%
50%
0-14 15-44 45-64 65+
Combined Service Area California United States Total Service Area
Figure 5: Age Distribution Comparison
Table 6: Population Age Distribution

Sonoma Valley Hospital 2012 Three-Year Rolling Strategic Plan
22
Population Growth by Zip Code
Sonoma Valley Hospital’s combined service area population is projected to slightly decrease from 2010-2015. Most zip codes will see moderate population growth with the hometown of Sonoma projected to lose 1.4% of the population. Figure 7 shows projected population change by zip code.
Table 7: Population Change 2000-2015
Figure 6: Population Change 2010-2015

Sonoma Valley Hospital 2012 Three-Year Rolling Strategic Plan
23
Population Growth by Age Cohort
Sonoma Valley Hospital’s combined service area is projected to slightly decrease from 2010-2015. Figure 8 shows projected population change by age cohort. Sonoma’s combined service area is projected to lose a disproportionate number of people ages 45-64 when compared to the United States as they become part of the senior (65+) population. Figure 9 shows the current concentration of the senior population.
Figure 7: Population Growth by Age Cohort – Combined Service Area 2010 - 2015
Figure 8: 2010 Service Area Senior (65+) Populations
4.4%
0.9%
1.6%
16.4%
4.1%
1.4%
1.8%
15.3%
-2.5%
-1.3%
-10.8%
13.6%
-15.0% -10.0% -5.0% 0.0% 5.0% 10.0% 15.0% 20.0%
0-14
15-44
45-64
65+
Combined Service Area United States California

Sonoma Valley Hospital 2012 Three-Year Rolling Strategic Plan
24
Hispanic Population by Zip Code
Table 5 shows the Hispanic population by zip code. In 2010 25% of the combined service area population was Hispanic. This demographic is projected to grow 13% from 2010 to 2015 and will comprise 29% of the combined service area population. Figure 4 shows the concentration of the Hispanic population by zip code.
Table 8: Hispanic Population by Zip Code: 2010
Figure 9: Hispanic Population Concentration: 2010

Sonoma Valley Hospital 2012 Three-Year Rolling Strategic Plan
25
Median Household Income
Sonoma Valley Hospital’s combined service area has a median household income of $65,051. The median household incomes for the State of California and the United States are $64,966 and $57,283, respectively. The combined service area median household income is projected to increase 15% to $74,574 by 2015.
Figure 10: 2010 Service Area Median Household Incomes
Table 9: Service Area Median Household Income Change 2010-2015

Sonoma Valley Hospital 2012 Three-Year Rolling Strategic Plan
26
2010 Patient Origin Table 10 below shows dependency ratios for each of the zip codes included in the combined service area. 85% of Sonoma Valley Hospital’s Medicare inpatient discharges came from its hometown of Sonoma. 3.7% of Sonoma Valley Hospital’s 801 Medicare discharges are dispersed among the zip codes and is denoted with an asterisk (*).
Observations and Conclusions about Service Area Demographics:
Sonoma and Glen Ellen’s population will decrease over the next 5 years and strategically the hospital’s growth will not come from increases in the population. Noteworthy, is the fact that the 65+ population will grow 13.6% from 2010 to 2015. The population over 65 years uses healthcare services at three times the rate of the rest of the population. Also noteworthy is the fact that the Latino population is projected to grow 13% from 2010 to 2015 and will comprise 29% of the combined service area population.
Table 10: Sonoma Valley Hospital Patient Origin

Sonoma Valley Hospital 2012 Three-Year Rolling Strategic Plan
27
Hospital Utilization and Market Share
Inpatient Market Share – California State Data
Tables 11a and 11b show all-payer inpatient market share using data obtained from the California Office of Statewide Health Planning and Development (OSHPD). Sonoma Valley Hospital holds a 47.8% market share in the combined service area. The majority of cases seen were in rehabilitation (95%), gynecology (59.1%), medicine (56.7%), gastroenterology (54.4%), pulmonary (50.9%), and OB-delivery (47.5%).
Table 11a: Inpatient Market Share- 2010 CA State Data
Combined and Total Service Area
Table 11b: Inpatient Market Share-2010 CA State Data
Combined and Total Service Area

Sonoma Valley Hospital 2012 Three-Year Rolling Strategic Plan
28
Inpatient Surgical Market Share – California State Data
Tables 12a, b, and c show the all-payer inpatient surgical market share using data from the OSHPD. Sonoma Valley Hospital holds a 26.6% market share in the combined service area. The greatest market share was in gynecology (59.4%), orthopedic (33.9%), and general surgery (32.9%).
Table 12a: Inpatient Surgical Market Share-2010 CA State Data
Combined and Total Service Area
Table 12b: Inpatient Surgical Market Share-2010 CA State Data
Combined and Total Service Area
Table 12c: Inpatient Surgical Market Share-2010 CA State Data
Combined and Total Service Area

Sonoma Valley Hospital 2012 Three-Year Rolling Strategic Plan
29
Outpatient Market Share – Ambulatory Surgery Tables 13a and 13b show the ambulatory surgery market share for the total service area using data from the California OSHPD. Sonoma Valley Hospital held 4.7% of the total service area and 31.8% of the ambulatory surgery cases in the combined service area in 2010.
Table 13a: 2010 Ambulatory Surgery Market Share Combined and Total Service Area
Table 13b: 2010 Ambulatory Surgery Market Share
Combined and Total Service Area

Sonoma Valley Hospital 2012 Three-Year Rolling Strategic Plan
30
Outpatient Market Share – Emergency Department Visits by Primary Payer Tables 14a and 14b show emergency department visits by primary payer type. Sonoma Valley Hospital captured 69.5% of all ED visits in the combined service area and 8.6 in the total service area. Sonoma Valley Hospital saw 73.8% of Medicare and 10% of all Medi-Cal cases in the total service area.
Table 14a: 2010 ED Visits by Primary Payer
Combined and Total Service Area
Table 14b: 2010 ED Visits by Primary Payer
Combined and Total Service Area

Sonoma Valley Hospital 2012 Three-Year Rolling Strategic Plan
31
Medicare Inpatient Market Share Trend Table 15 below shows the Medicare inpatient market share trend for Sonoma Valley Hospital and its competitors. From 2008-2010 Sonoma has held, on average, 43.4% of the Medicare inpatient market share in the combined service area, peaking at 44.7% in 2008.
Table 15: Medicare Inpatient Market Share-3 Year Trend
Combined Service Area

Sonoma Valley Hospital 2012 Three-Year Rolling Strategic Plan
32
Medicare Inpatient Market Share by Zip Code
Table 16 shows Sonoma Valley Hospital’s 2010 Medicare inpatient market share by zip code. Sonoma Valley Hospital holds its greatest Medicare inpatient market share in its home city of Sonoma (43.6%). Sonoma Valley Hospital captured 29.7% of the secondary service area. No significant market share is held in any of the target service areas excluding Kenwood (target area 2) in which Sonoma Valley Hospital captured 15.3%.
Table 16: Medicare Inpatient Market Share by Zip Code
Total Service Area

Sonoma Valley Hospital 2012 Three-Year Rolling Strategic Plan
33
Medicare Inpatient Market Share by Zip Code and Hospital Tables 17a and 17b below show the combined service area’s distribution of Medicare inpatients by hospital and zip code in the combined service area.
Table 17a: 2010 Medicare Inpatient Market Share by Zip Code and Hospital
Combined Service Area
Table 17b: 2010 Medicare Inpatient Market Share by Zip Code and Hospital
Combined Service Area

Sonoma Valley Hospital 2012 Three-Year Rolling Strategic Plan
34
Medicare Inpatient Market Share by Service Line
Table 18a and 18b below show the 2010 combined service area Medicare inpatient market share by service line. Sonoma Valley Hospital holds market share in portions of many service lines listed below. The greatest market share came from medicine (52.6%), neurology (37.1%), orthopedics (37.1%), pulmonary (36.7%) and cardiology (36.3%).
Table 18a: 2010 Medicare Inpatient Market Share by Service Line Combined Service Area
Table 18b: 2010 Medicare Inpatient Market Share by Service Line Combined Service Area

Sonoma Valley Hospital 2012 Three-Year Rolling Strategic Plan
35
Medicare Inpatient Market Share – Surgeries Tables 19a and 19b show Medicare inpatient market share for surgeries in the combined service area. Sonoma Valley Hospital captured 27% of all Medicare surgeries in the combined service area. The greatest market share came from gynecology (80%), orthopedics (33.3%) and general surgery (31%).
Table 19a: 2010 Medicare Inpatient Market Share – Surgeries Combined Service Area
Table 19b: 2010 Medicare Inpatient Market Share – Surgeries Combined Service Area

Sonoma Valley Hospital 2012 Three-Year Rolling Strategic Plan
36
Medicare Patient Outmigration Patient outmigration analysis looks at the percentage of patients who seek inpatient services outside of the service area. Sonoma Valley Hospital is the only hospital located within the combined service area. 56% of the Medicare cases are leaving Sonoma to receive care and 70% are leaving Glen Ellen. The combined service area has a total outmigration of 58%.
Table 20: 2010 Medicare Inpatient Outmigration

Sonoma Valley Hospital 2012 Three-Year Rolling Strategic Plan
37
Inpatient Demand Estimates Inpatient demand in the combined service area is projected to increase 2.1% from 2010-2015. Table 21 below shows the current and projected demand for each service line.*
* The demand projections are based on national trends.
Table 21: Inpatient Demand Estimates Combined Service Area

Sonoma Valley Hospital 2012 Three-Year Rolling Strategic Plan
38
Outpatient Demand Estimates by Service Line Tables 22 below shows outpatient demand estimates by service line. Sonoma Valley Hospital’s combined service area is projected to see increased demand for all service lines listed below, most notably in diagnostic (7.1%) and total outpatient visits (5.6%).
Table 22: Outpatient Demand Estimates: Combined and Total Service Area

Sonoma Valley Hospital 2012 Three-Year Rolling Strategic Plan
39
Cultural Assessment

Sonoma Valley Hospital 2012 Three-Year Rolling Strategic Plan
40
Sonoma Valley Hospital’s Current Culture

Sonoma Valley Hospital 2012 Three-Year Rolling Strategic Plan
41
Sonoma Valley Hospital’s Ideal Culture

Sonoma Valley Hospital 2012 Three-Year Rolling Strategic Plan
42
The Future Sonoma Valley Hospital’s vision is becoming a reality. We have made significant progress in stabilizing the organization and are now exceeding average national benchmarks in service excellence and quality. Because of the support from our community, we break ground on the new emergency and surgery wing in spring, 2012. In 2011 the hospital was financially able to address the long standing deferred maintenance issues to bring our older facilities up to seismic requirements and allow these areas to function for another 20 years. We continue to be able to serve the hospital district even when our reimbursement from Medicare and Medi-Cal is significantly lower than cost due to the support of the community through the annual parcel tax. Our philanthropic support has improved drastically in the past year which has led us to offer comfortable, state of the art beds, medical equipment and excellent diagnostic services. We look forward to continued success as we guide our community through their healthcare journey.
New Emergency and Surgery Departments Open 2013