some statistical information regarding the feifer
TRANSCRIPT

Some Statistical Information Regarding the Feifer Assessment of Reading (FAR) by Steven G. Feifer (Lutz, FL: PAR, 2015).
https://www.parinc.com/Products/Pkey/110

A clinical psychologist, a school psychologist, and a psychological research statistician are out hunting. The clinical psychologist shoots at a deer and misses 5 feet to the left. The school psychologist takes a shot and misses 5 feet to the right. The statistician yells, "We got him!"

https://www.parinc.com/Products/Pkey/110
• Professional Manual by Steven G. Feifer, DEd, and Rebecca Gerhardstein Nader, PhD (Lutz, FL: PAR, 2015)
• https://www.parinc.com/Resources/Training-Portal
• In addition to an interactive course, pronunciation guides for
various FAR subtests are available on the PAR Training Portal.

FAR NORMS • FAR norms are based on grade placement.
• A sort of approximately equivalent age [a single year] is listed in parentheses, e.g., Grade 5 (Age 10 years).
• The standard score for a raw score remains the same throughout the entire grade.
• In the example below, the same raw scores give the same standard scores in September and June!

FAR NORMS

FAR NORMS
Same raw scores 4 months later = same standard scores.

FAR NORMS
Same raw scores 9 months later = same standard scores.
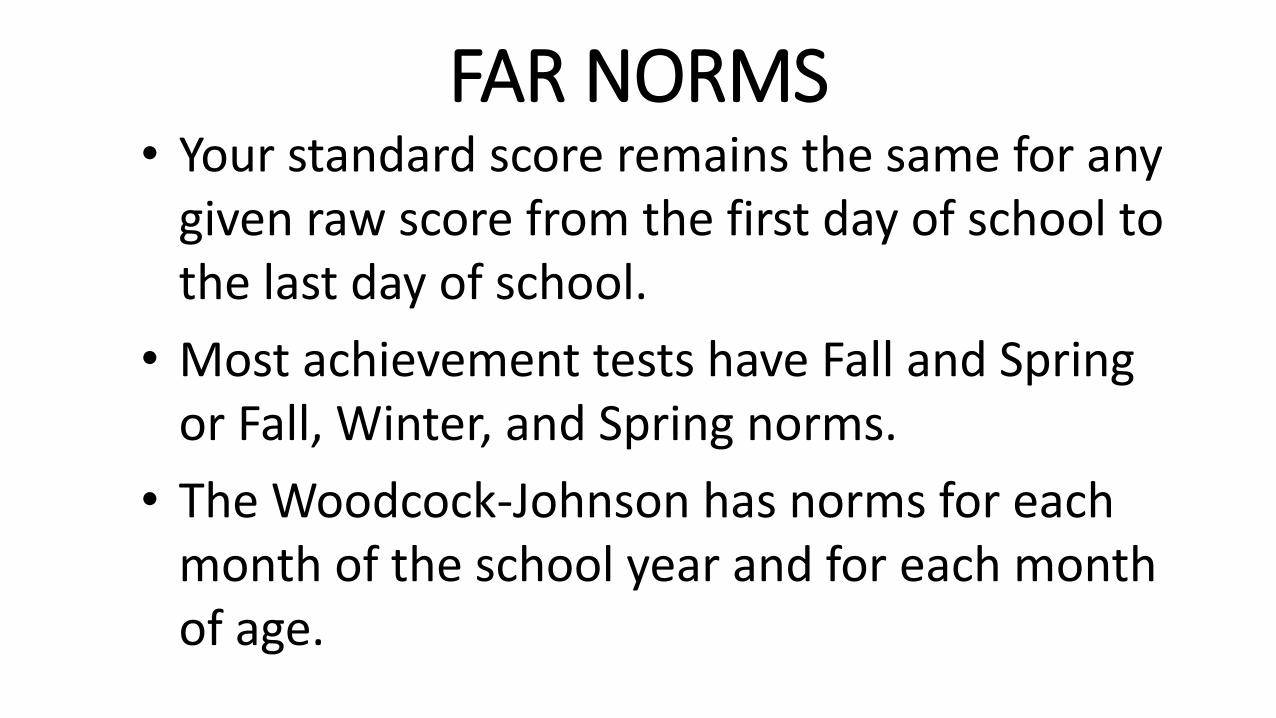
FAR NORMS • Your standard score remains the same for any
given raw score from the first day of school to the last day of school.
• Most achievement tests have Fall and Spring or Fall, Winter, and Spring norms.
• The Woodcock-Johnson has norms for each month of the school year and for each month of age.

FAR NORMS • Most achievement tests have age-based
norms as well as grade-based norms. Most have age norms at intervals of less than a year (e.g., 10:0 – 10:3 or 10:0 – 10:6), at least for younger ages.
• Each norming system has its own special set of problems.

FAR NORMS • Think carefully when interpreting scores on
any test. Neither scores compared to same-age students nor scores compared to same-grade students may tell the whole story.
• Consider reporting two separate tables of scores (age- and grade-based), especially if the student has been retained in grade.

FAR NORMS • Always label scores in table titles and in text with
modifiers such as "compared to other students in third grade" or "for third grade" or "compared to other students of age 12 years" or "for age 12."
• The Professional Manual does permit you to use grade level as a proxy for age, using Figure 4.1 (FAR Professional Manual, p. 95). Again, scores are for whole grade years, not terms, trimesters, or tenths of a year.

FAR NORMS • Figure 4.1 (FAR Professional Manual, p. 95)
shows grades vertically on the left and ages horizontally on the bottom with a series of bars showing the mean age (± 1 and 2 SDs) for each grade, so you can draw a vertical line up from the student’s age (in years and months) and select the whole-year grade that best matches the student’s age.

FAR NORMS • Some readers of our evaluation reports have
never seen an evaluation report in their lives.
• Some have seen many reports and may be reading other reports on their child or student along with our report. Both groups of readers are likely to be confused by contradictory information in different reports.

FAR NORMS • The parent, teacher, or attorney may have
just read, for example, that standard scores of 85 to 115 are "Average" on the WIAT-III and that 90 to 110 is "Average" on the WJ IV, and may then read that 90 to 109 is "Average" on the FAR. (The KTEA-3 allows either of two different classification systems for standard scores.)

FAR NORMS • For purposes of reading intervention, many
specialists call standard scores of 96 to 109 "on grade level" and 90 to 95 "some risk."
• All of these classifications are arbitrary, and must be explained very clearly in evaluation reports!

"Qualitative descriptors are only suggestions and are not evidence-based; alternate terms may be used as appropriate" [emphasis in original]. Wechsler, D. (WISC-V Research Directors, S. E. Raiford & J. A. Holdnack) (2014). Wechsler Intelligence Scale for Children (5th ed.): Technical and Interpretive Manual. Bloomington, MN: Pearson, p. 152.]

Label scores consistently!

&& && There are 200 &s. &&&&&& &&&&&& each && = 1%. &&&&&& &&&&&& && &&&&&& &&&&&& && &&&&&& &&&&&& &&&&&& &&&&&& &&&&&& &&&&&& &&&&&& &&&&&& & &&&&&& &&&&&& &&&&&& &&&&&& & &&&&&& &&&&&& &&&&&& &&&&&& &&&&&& &&&&&& & & & & &&&&&& &&&&&& &&&&&& &&&&&& &&&&&& &&&&&& & & & &
Standard Scores – 69 70 – 79 80 – 89 90 – 109 110 – 119 120 – 129 130 –
Percentile Ranks – 02 03 – 08 09 – 24 25 – 74 75 – 90 91 – 97 98 –
WISC-V
Classification
Extremely
Low
Very
Low
Low
Average Average
High
Average
Very
High
Extremely
High
FAR & RIAS
Classification Significantly
Below Av.
Moderately
Below Av.
Below
Average Average
Above
Average
Moderately
Above Av.
Significantly
Above Av.
Woodcock-
Johnson Classif.
Very
Low Low
Low
Average
Average
(90 – 110)
High Average
(111 – 120) Superior
(121 – 130)
Very Superior
(131 – )
KTEA-3 15-pt.
Classification
Very Low
40-54 Low 55-69
Below Average
70 – 84
Average
85 – 115
Above Average
116 – 130
High 131-
145
Very
High 146—
160 KTEA-3 10-pt.
Classification
Very Low
– 69
Low
70 – 79
Below
Average
Average
(90 – 109)
Above
Average
High
120 – 129
Very High
130 –
WIAT-III
Classification
Very
Low
<55
Low
55 –
69
Below Average
70 – 84
Average
85 – 115
Above Average
116 – 130
Super
-ior
131-
145
Very
Super
-ior
146 –
Stanines Very Low
– 73
Low
74 – 81
Below
Average
82 - 88
Low
Average
89 – 96
Average
97 – 103
High
Average 104 - 111
Above
Average 112 – 118
High 119 – 126
Very High
127 –
Adapted from Willis, J. O. & Dumont, R. P., Guide to Identification of Learning Disabilities (3rd ed.) Peterborough, NH: Authors, 2002, pp.
39-40). Also available at http://www.myschoolpsychology.com/testing-information/sample-explanations-of-classification-labels/
110

FAR NORMS • My standard score of 110 (percentile rank 75)
is Above Average, High Average, or Average.
• At least that much is clear.
• There is something to be said for skipping labels and just using percentile ranks.

Suggested Explanations of Percentile Ranks
1. Mordred’s standard score of 85 was as high as or higher than the scores of 16 percent of students in his grade and lower than the other 84 percent (percentile rank 16).
2. Mordred scored 80, percentile rank 9 (as high as or higher than 9 percent of students in his grade).

3. Mordred’s score of 95 was in the 37th
percentile.
• Occasionally recycle wording #1 and #2 in case readers forget.
• People can use their judgment to decide, for example, whether scoring lower than 84% of fellow students is acceptable.
Suggested Explanations of Percentile Ranks
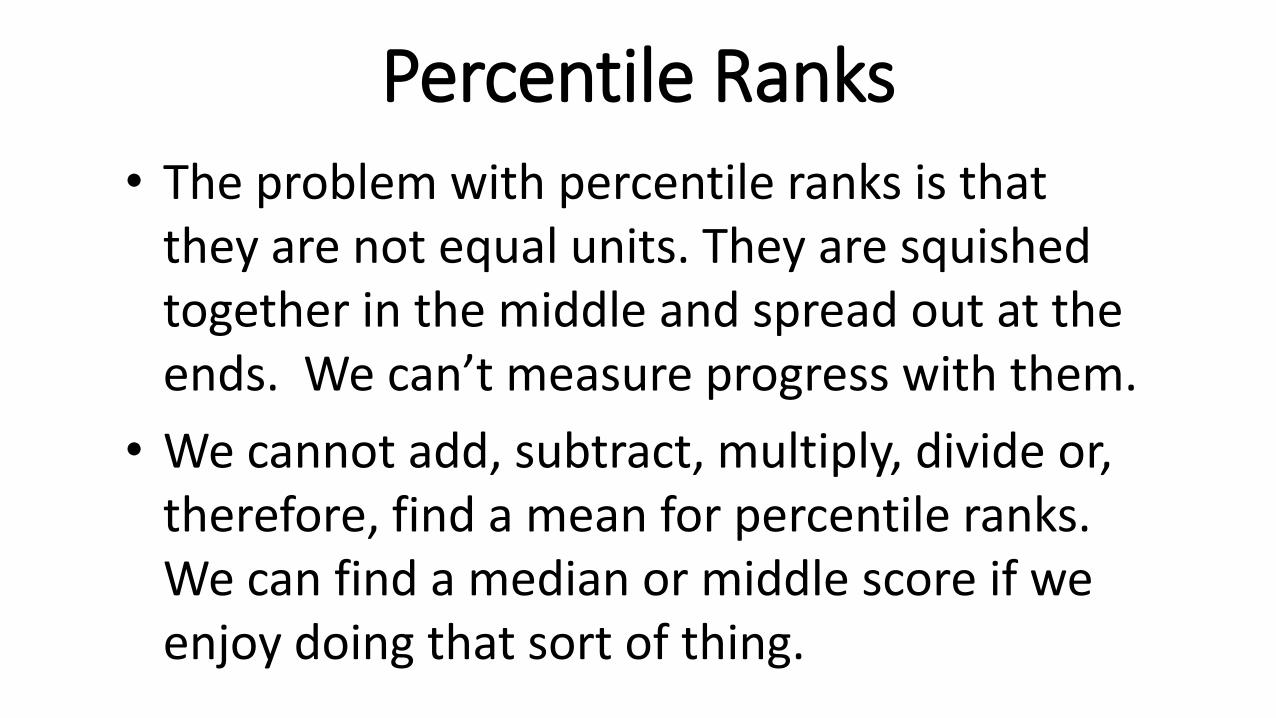
Percentile Ranks • The problem with percentile ranks is that
they are not equal units. They are squished together in the middle and spread out at the ends. We can’t measure progress with them.
• We cannot add, subtract, multiply, divide or, therefore, find a mean for percentile ranks. We can find a median or middle score if we enjoy doing that sort of thing.

.
Percentiles 1-10 Percentiles 51-60

FAR NORMS • Norming samples for tests are like the responders
chosen for a political poll.
• Norming samples must be truly representative of the entire the the population to be accurate.

FAR NORMS • The FAR reportedly went through extensive
development and pilot testing before they normed the final edition. Those steps are essential for deglitching.
• The final norms were based on 62 to 70 students in each grade from PK through 12, 71 in grades 13/14, and 63 in grades 15/16, a total of 1,074 students.

FAR NORMS • 62 to 70 students in each grade, PK – 12
• 71 in grades 13/14 (35.5 per grade)
• 63 in grades 15/16 (31.5 per grade)
• Even with continuous norming, we think these are small numbers. We would prefer at least 100 per year, but nobody asked us.

FAR NORMS • The sample was drawn from 31 states and
matched the 2012 U.S. Census data reasonably well for gender, ethnicity, parent education, and region. “Weighting” procedures brought the matches even closer.
• They used “continuous norming” procedures, which improve the accuracy of the norms.

FAR RELIABILITY

FAR RELIABILITY Reliability is the statistical term for “consistency,” not “trustworthiness.”
• .00 - .59 very low or very poor
• .60 - .69 low or poor
• .70 - .79 moderate or fair
• .80 - .89 moderately high or good
• .90 - .99 high or excellent
Murphy, K. R., & Davidshofer, C. O. (2005). Psychological testing: Principles and applications (6th ed.). Upper Saddle River, NJ: Pearson Education.
> .80 preferred for individual assessment ≥ .90 for making decisions

FAR RELIABILITY • Test reliability is essential. If a test cannot
even be consistent with itself, it certainly cannot measure anything else.
• A test cannot be valid for any purpose without being reliable. However, a test can be reliable without being valid for a particular purpose, or even any purpose.

Correlation • Psychologists used to believe that brain size, as
estimated from head circumference, was a valid measure of intelligence. Adult head circumfer-ence is normally a very reliable measure and it predicted that men were smarter than women. Male psychologists were very disappointed eventually to discover that it turned out not to be correlated with IQ. Reliable, but not valid.


Correlation The following scatter plots illustrate various levels of correlations between two variables. With a correlation of .90, there is an obviously strong relationship between the two variables. If you knew the score on one variable, you would be able to predict the score on the second fairly accurately.
33

34

With a correlation of .60, there is still a relationship, but your predictions of scores on one variable from scores on another would be much weaker. When the correlation drops to .30, the upper left and lower right corners are still empty (extremely high scores on one variable are not associated with extremely low scores on the other), but that is about all you have.
35

At r = .10, there is almost no relationship at all. Keep the following pictures in mind as you consider correlation values in research reports and test manuals. A Correlation Coefficient of 1.00 indicates a "perfect" relationship. With a Correlation Coefficient of 1.00, knowledge of an individual's score on one test allows exact prediction of the individual's score on the other test.
36

A Correlation Coefficient of 0.00 indicates no relationship at all. One might just as well guess the second score with dice. A statistically significant correlation, or one that is too high to be likely to occur by pure chance (p < .05, p < .01, etc.), does not necessarily mean that the correlation is high enough to make very useful predictions, just that it is greater than chance.
37

38

Note that, although the QAT and ZAT are highly correlated (.93), the mean ZAT score (108.8) is 20 points higher than the mean QAT score (88.7)! If this difference were demonstrated in a large, random sample, then any particular score would not indicate the same level of performance on the two tests.
39

Correlation There are several ways of measuring reliability, including:
• Internal consistency, e.g., correlation between partial scores based on odd- and on even-numbered items, and
• Stability, or correlation between scores of a group on two administrations of the test.

Correlation In case you were wondering, the correlation coefficient tells us how much of the variance of the predicted scores can be accounted for by the predictor scores.
You just square the correlation coefficient (multiply it by itself).

Correlation


FAR VALIDITY • Validity of a test is the accuracy with which it
measures whatever it purports to measure.
• Validity is measured for a specific purpose; it does not exist by itself.
• The FAR Professional Manual offers a good deal of evidence regarding validity.

FAR VALIDITY • FAR raw scores correlate with grade level at .76 or
higher except for NWD and VP.
• Correlations are provided between the FAR and Process Assessment of the Learner (PAL-II), Gray Silent Reading Test (GSRT), Gray Oral Reading Test (GORT-5), Academic Achievement Battery (AAB), Child and Adolescent Memory Profile (ChAMP), and Reynolds Intellectual Assessment Scales (RIAS-2).

FAR VALIDITY • Based on scores of 33 students (not a big
sample), correlations between the FAR and the PAL-II are mixed, partly because the PAL-II is a complex test with many unusual subtest formats. For the most part, correlations were higher between the FAR and PAL-II subtests with similar content.

FAR VALIDITY • "Interestingly, the FAR Morphological
Processing subtest was only moderately correlated with the PAL-II Reading and Writing Morphological Decoding Accuracy subtest (r = .35), suggesting that the FAR's ability to measure morphological word completion taps into a more unique skill than merely reading a complete word list" (Professional Manual, p. 102).

FAR VALIDITY LESSONS:
1. Never trust subtest names (e.g., the RIAS has a subtest named "Guess What").
2. Subtle differences in content, format, and administration can greatly affect scores.
3. It is possible, after all, for one thing to be "more unique" than another.

FAR VALIDITY • FAR Irregular Word Reading Fluency was
correlated r = .76 with PAL-II Orthographic Coding Composite (.762 = 56% overlap).
• FAR Isolated Word Reading Fluency was correlated r = .75 with PAL-II Morphological Decoding Fluency (.752 = 58% overlap).
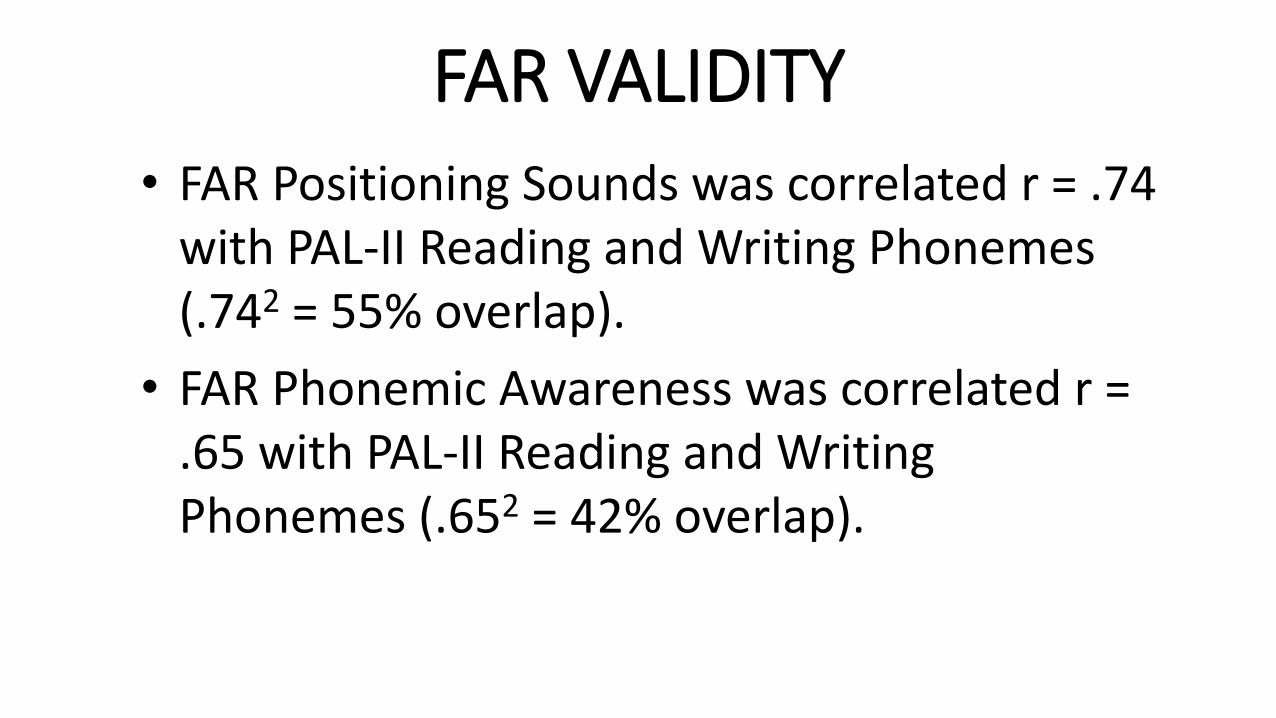
FAR VALIDITY • FAR Positioning Sounds was correlated r = .74
with PAL-II Reading and Writing Phonemes (.742 = 55% overlap).
• FAR Phonemic Awareness was correlated r = .65 with PAL-II Reading and Writing Phonemes (.652 = 42% overlap).
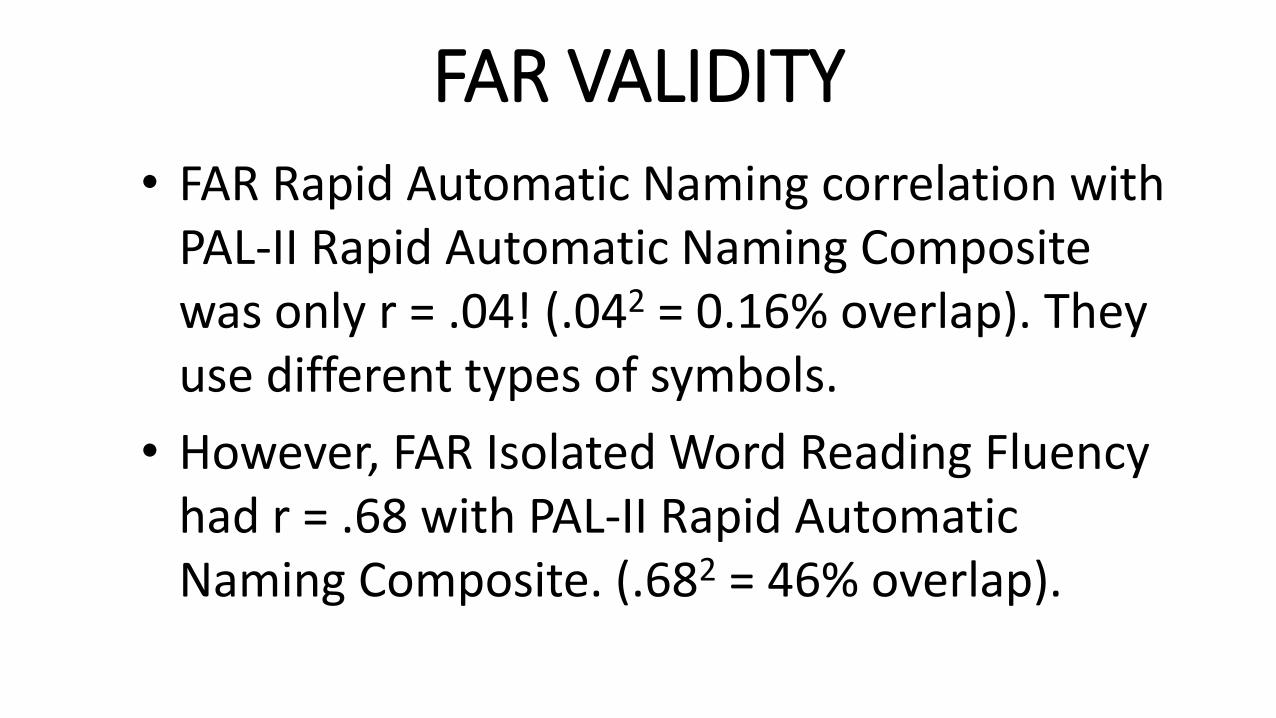
FAR VALIDITY • FAR Rapid Automatic Naming correlation with
PAL-II Rapid Automatic Naming Composite was only r = .04! (.042 = 0.16% overlap). They use different types of symbols.
• However, FAR Isolated Word Reading Fluency had r = .68 with PAL-II Rapid Automatic Naming Composite. (.682 = 46% overlap).

?
?
?
? ? = I would have expected a significant correlation.

FAR VALIDITY • The correlations are based on the scores of
25 students (definitely not a big group).
• FAR Phonemic Awareness, RAN, Verbal Fluency, Visual Perception, Orthographical Processing, and Word Recall had no significant correlations with any of the Gray subtests or quotients.

FAR VALIDITY • All statistical measurements are subject to
some random variation. A "significant" difference, correlation, or other statistic is one too great to occur just by random variation more than a certain proportion of the time.
• p ≤ .05 means no more than 5 times in 100.
• p ≤ .01 means no more than 1 time in 100.

A Quick Digression • In evaluation reports, we often refer to "significant differences" between scores. The evaluator could include footnotes such as the following.
Scores cannot be perfectly accurate on even the best tests. Lucky and unlucky guesses, barely beating or missing a time limit, and other random factors influence test scores.
Digression In this report, a "significant difference" is one too great to occur just by random variation more than 5 times in 100.
Even significant differences may not be uncommon. In this report, an "uncommon difference" is one so great that it is not seen in more than 10 percent of examinees.

Digression • Footnotes

Digression • Most readers ignore these (and other
footnotes, such as "Your Kindle is about to explode."), but the footnotes are there for those who want to know.
• The evaluator might write "in this report," because the choice of cut-offs for significance and uncommonness is, within reason, arbitrary.

FAR VALIDITY: ACHIEVEMENT TESTS • In a study with 109 students, all FAR Index
scores had significant correlations with all Academic Achievement Battery (AAB) composite scores, including Mathematical Calculation and Reasoning.
• The mean FAR Total Index was 99.0 and the mean AAB Total Achievement was 99.5.

FAR VALIDITY: ACHIEVEMENT TESTS • Correlations of FAR index scores with AAB
Basic Reading and Reading Comprehension composites were .39 to .64, median .59.
• Correlations of FAR index scores with AAB Listening Comprehension and Expressive Communication composites were .22 to .51, median .44.

FAR VALIDITY: ACHIEVEMENT TESTS • Correlations of FAR index scores with the
AAB Written Expression composite were .47 to .61, median .58.
• Correlations of FAR index scores with the AAB Mathematical Calculation composite were .24 to .35, median .33.
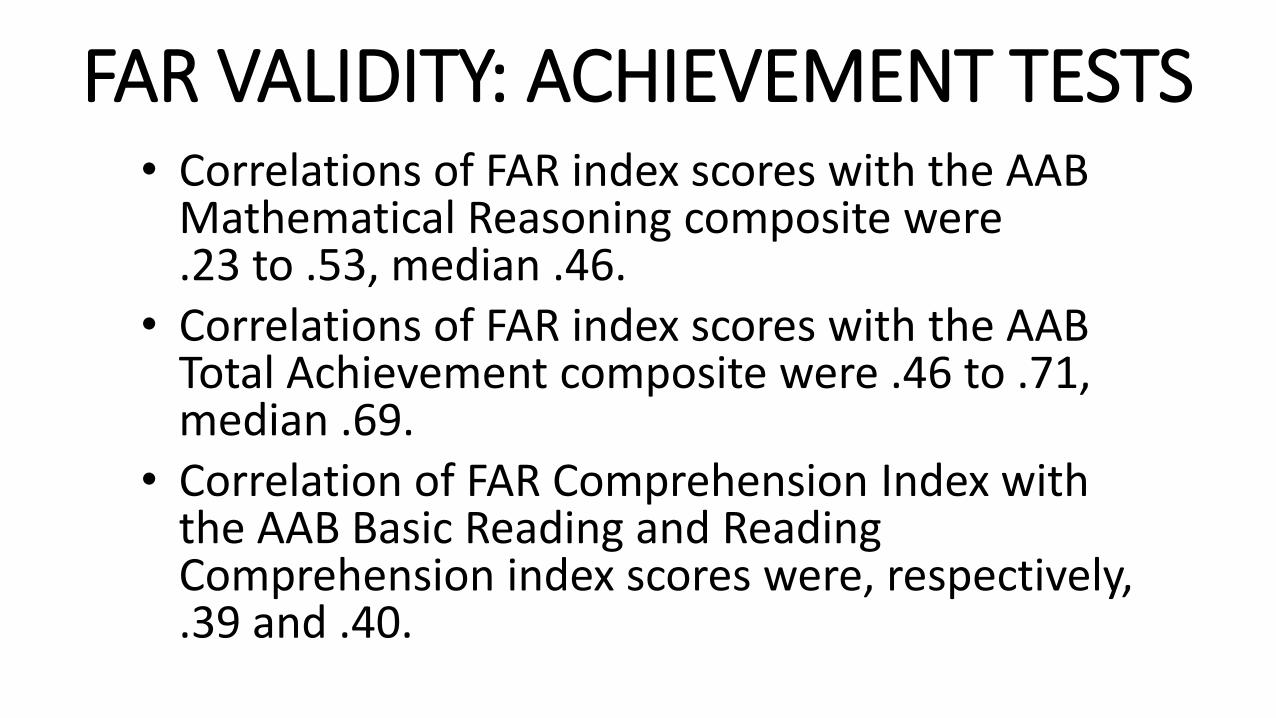
FAR VALIDITY: ACHIEVEMENT TESTS • Correlations of FAR index scores with the AAB
Mathematical Reasoning composite were .23 to .53, median .46.
• Correlations of FAR index scores with the AAB Total Achievement composite were .46 to .71, median .69.
• Correlation of FAR Comprehension Index with the AAB Basic Reading and Reading Comprehension index scores were, respectively, .39 and .40.

FAR VALIDITY: MEMORY TESTS • Correlations of 129 students' FAR subtest scores
with the Child and Adolescent Memory Profile (ChAMP) were generally low, although some were statistically significant.
• The higher of the low correlations make sense, such as RAN, Verbal Fluency, and Word Recall with the ChAMP Lists and Lists Delayed. (Print Knowledge correlations were inflated by the narrow grade range [PK – 1] in case you're keeping score.)

FAR VALIDITY: INTELLIGENCE TESTS • Correlations, for 144 students, of FAR index
scores with the Reynolds Intellectual Assessment Scales (RIAS-2) Composite Index were .33 to .52, median .46.
• The mean FAR Total Index was 98.5 and the mean RIAS-2 Composite Index was 101.5. Close enough for government work.

FAR VALIDITY

FAR VALIDITY • Correlations, especially for Comprehension,
are higher with verbal than with nonverbal intelligence on the RIAS-2.
• The Fluency correlations make sense.
• The FAR Total Composite and RIAS-2 Composite are correlated .48 (23% overlap), so 77% of variance on the FAR total must be accounted for by variables other than IQ.

FAR VALIDITY • That 78% might include measurement error,
quality of reading instruction, number of books in the home, number of words spoken to the child, hours of screen time, dyslexia, other disabilities, and other factors. The correlation of .48 looks pretty reasonable.

FAR VALIDITY • The Professional Manual includes scores of
samples of students diagnosed with IDD (28), ADHD (36), and LD (59) compared with matched control groups, whose index scores were close to 100.
• For the IDD group, the mean Total was 52. All subtest means were < 70, except VP (79), WR (75), SRF-R (72).
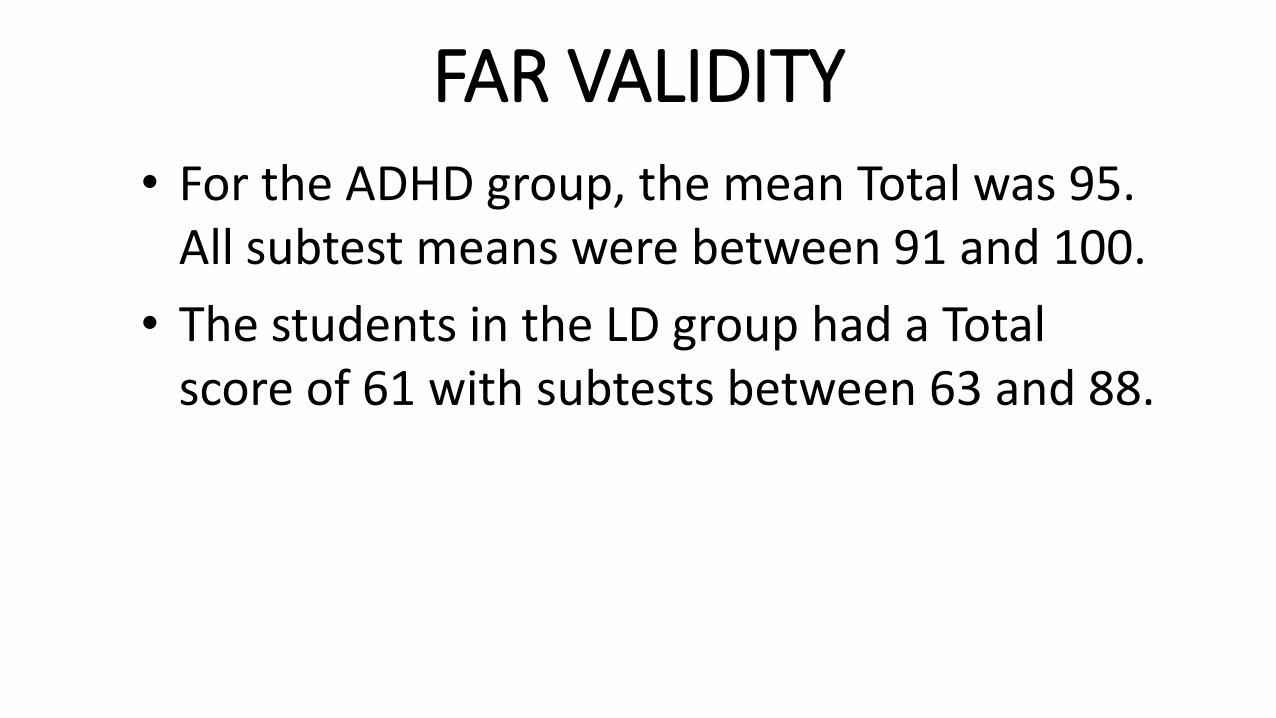
FAR VALIDITY • For the ADHD group, the mean Total was 95.
All subtest means were between 91 and 100.
• The students in the LD group had a Total score of 61 with subtests between 63 and 88.


FAR VALIDITY • If we use cut-off scores to diagnose a
condition or disability, we will make two kinds of errors:
• False Positive: person without the disability is diagnosed as having it.
• False Negative: person with the disability is not diagnosed as having it.

FAR VALIDITY • We can adjust the cutoff to alter the balance
of false positives and false negatives. If, for instance, I decide that the cutoff for a diagnosis of dyslexia is a reading standard score of 160, I will not have many false negatives, but an awful lot of false positives.

FAR VALIDITY • These decisions are value judgments based
on the costs of false positives and negatives.
• For instance, a false negative test for a lethal, but curable, disease is disastrous.
• However, a false positive for a terrifying disease that requires a painful and debilitating treatment is not good, either.

FAR VALIDITY • The FAR Professional Manual authors tell us,
“These results indicate that an optimal cutoff score for the FAR Total Index is in the low- to mid-70s. . . . Several potential cutoff scores were identified. . . . The user can consider this information when choosing the cutoff score [to] use to identify individuals with a potential learning disability” (p. 112).
FAR
Val
idit
y


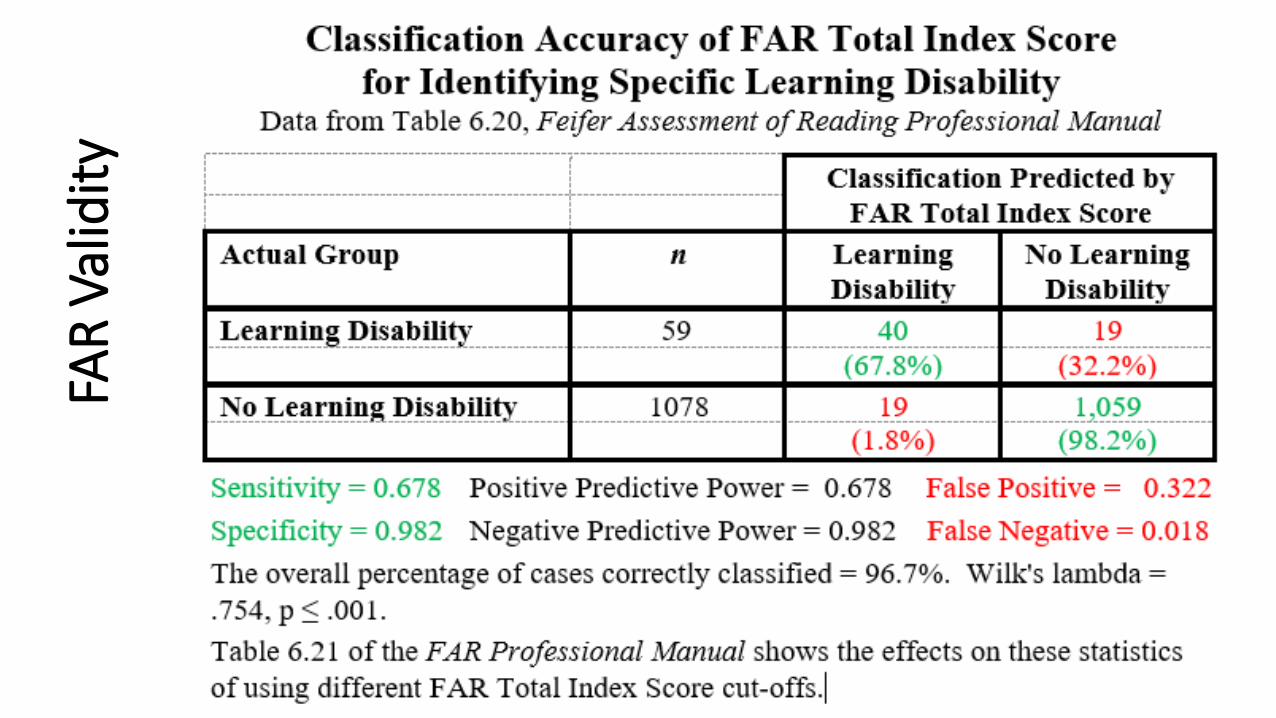
Note It is only a coincidence that the Sensitivity and Positive Predictive Power are the same (0.678) and that the Specificity and Negative Predictive Power are the same (0.982) in this example. Because of the chosen cut-off, there just happen to be 19 false positives and also 19 false negatives.
• Sensitivity = (True Positive)/(True Positive + False Negative)
• Specificity = (True Negative)/(True Negative + False Positive)
• Positive Predictive Power = (True Positive)/(True Positive + False Positive)
• Negative Predictive Power = (True Negative)/(True Negative + False Negative)
• False Positive = (False Positive)/(True Positive and False Positive)
• False Negative = (False Negative)/(True Negative and False Negative)

FAR VALIDITY • With any test, if you use a higher cut-off score,
you will identify more examinees as having a learning disability, but that will include more falsely identified students who had no disability (false positive).
• If you use a lower cut-off score, you will identify more examinees as not having a learning disability (LD), but that will include more falsely non-identified students who actually did have a learning disability (false negative).

Grade PA NWD ISO ORF PS RAN VF VP IRR OP SC WR PK MP SRF-C SRF-R
PK 70 85 70 70 70 75 70 70 K 58 70 70 70 57 66 69 75 70 67 50 1 50 58 64 60 50 62 69 64 66 63 50 2 50 75 57 60 50 50 57 68 70 62 52 57 70 65
3 50 72 50 55 50 50 52 68 63 59 50 50 68 65 63
4 50 68 51 50 50 50 50 64 54 50 50 50 65 66 55
5 50 61 50 50 50 50 50 50 50 50 50 50 62 57 50
Lowest Possible FAR Subtest Standard Scores (Raw Score = 0) Scores above the first percentile (lowest 1% of all scores) are in red.
By fifth grade (age 10 years), a child who makes no response at all will score in the lowest one percent of same-grade and same-age students on all FAR subtests. In PK, a totally unresponsive child's scores would range from 70 (percentile rank 2) to 85 (percentile rank 16). A totally unresponsive Kindergartener would have scores from 50 (percentile rank 0.1) to 75 (percentile rank 5).

Grade PA NWD ISO ORF PS RAN VF VP IRR OP SC WR MP SRF-C SRF-R 15-16 120 120 130 150 120 130 150 141 130 120 139 143 130 148 150 13-14 120 120 131 150 120 130 150 141 131 120 147 143 132 150 150 12 121 121 135 150 120 131 150 141 132 120 148 144 137 150 150 11 121 122 140 150 120 132 150 142 134 123 150 144 141 150 150 10 122 124 150 150 121 134 150 143 137 127 150 144 142 140 150 9 125 126 150 150 122 137 150 145 141 128 150 145 150 150 150 8 127 129 150 150 128 141 150 146 146 131 150 146 150 142 150 7 129 133 150 150 131 146 150 148 150 136 150 150 150 143 150 6 133 137 150 150 135 150 150 150 150 143 150 150 150 143 150
Highest Possible FAR Subtest Standard Scores (Perfect Raw Score) Scores below the 99th percentile (highest 1% of all scores) are in red.
In sixth grade (age 11 years), a child who earns the highest possible raw score (no errors at all or greatest measured speed) will score in the highest one percent of same-grade and same-age students on all FAR subtests. In 12th grade, a perfect raw score would range from 120 (percentile rank 91) to 150 (percentile rank 99.9).

Reliable Score Changes
•Appendix H of the FAR Professional Manual provides tables to determine whether changes in test scores are statistically significant (too large to be likely to have occurred just by random variation).
• The tables do not appear to take into account the span of time or the times of year for first and second tests.
•Values are given for probabilities of less than .01 or .05 (1 or 5 chances in 100), but also .10 and .15, which we would not recommend considering significant.

RELIABLE CHANGE SCORES
Libertine Liberal Conservative Libertarian Moderate

Skills and Error Analyses
Examiners spend too much time testing and too little analyzing.
• The FAR offers Skills and Error Analyses forms in Appendix I.
• Unfortunately, these analyses are not normed, but they are useful.
• They compare categories within subtests (e.g., % correct for Synonyms vs. Antonyms)
• and same items on two subtests (e.g., target word on ISO vs. ORF).
• A few examples follow.

Skills and Error Analyses
This is what the authors call the optional Level 5 of interpretation.
"An error analysis identifies the types of miscues the examinee tends to make during the reading process. Being aware of consistent error patterns is extremely useful for intervention planning and decision making. For instance, if an examinee consistently has difficulty with medical vowel positions in words, targeted interventions can be applied directly at fostering this particular skill" (p. 74).

Skills and Error Analyses
•Maximum number of phonemic blends and segmentations helps determine phonological working memory capacity, important for planning interventions.
•Phonological categories help differentiate between basic skills, such as Rhyming and Blending, and advanced Manipulation skills.
•Maximum number of syllables in a single Nonsense Word helps estimate phonological working memory capacity.

Skills and Error Analyses
•On Oral Reading Fluency, examiners can compare rate and accuracy.
•Comparing Oral Reading Fluency and Isolated Word Reading Fluency allows the obvious contrast.
•Verbal Fluency. "If repetitions are far apart in proximity, a working memory deficit may be present. If repetitions are close together or consecutive, a true perseverative error has occurred [which] generally reflect rigid and inflexible thinking" (p. 75).

Skills and Error Analyses
There are similar grade-level error analyses for: •RAN (shown on previous slide) •Verbal Fluency •Visual Perception •Word Recall Repetitions •Word Recall Intrusions

Skills and Error Analyses • Positioning Sounds
• Long Vowel • Short Vowel • R-controlled Vowel • Diphthong • Digraph • Schwa • Blend/cluster
• Morphological Processing • Prefix • Root • Suffix • Infix