some science aspects of wide-area data transport
TRANSCRIPT

Managed by UT-Battellefor the Department of Energy
Some Science Aspects of Wide-Area Data Transport
Nagi Rao
Oak Ridge National Laboratory
Mini-Symposium on Data over Distance:
Convergence of Networking, Storage, Transport, and Software Frameworks
July 19, 2018
Hanover, MD
Sponsored by
U.S. Department of Energy
U.S. Department of Defense

Managed by UT-Battelle for theU. S. Department of Energy
Outline
• Background
• Through Profiles of Infrastructures
– Memory and File transfers
– Convexity and Utilization
• Profile Estimation: Machine Learning
– Generalization
• Cyber-Physical Aspects: Game Theory
– Extension using LNet
• Looking Into Future
Collaborators: S. Sen, Q. Liu (ORNL); Foster, Z. Liu, R. Kettimuthu(ANL); D. Katramatos (BNL), B. Settleymyer, H. B. Chen (LANL); D. Towsley, G. Vardoyan (UMASS); F. He (Texas A&M); J. Zhuang (UBuffalo); C.Y.T Ma (Hong Kong); D. Yau (Singapore)

Managed by UT-Battelle for theU. S. Department of Energy
Big-data science and commercial data transport across networks
– Science codes on supercomputers generate large data sets to be transferred to remote storage sites for archival and post-analysis
– Science facilities generate large datasets to be transported to remote supercomputing centers
• Spallation Neutron Sources at Oak Ridge National Laboratory
– Commercial big data and distributed information systems
• Google B4 SDN dedicated networks
• Dedicated Connections
‒ Increasing deployments and availability
▪ DOE OSCARS. Google B4
– Desirable features: dedicated capacity and low loss rates
– Expectations for transport methods: Simple and predictable flow dynamics
– Surprisingly, show much more complex profiles and dynamics
▪ concave-convex profile vs. convex profile from literature
▪ rich dynamics lead to lower performance
Background

Managed by UT-Battelle for theU. S. Department of Energy
emulated connections: RTT: 0-800ms: 9.6 Gbps
ANUE
OC192
Ciena
CN4500
Ciena
CN4500
dedicated
connection
rtt: 0-366ms
10/9.6 Gbps
host host
client
ANUE
10GigE
HP 32/48-core
2/4-socket
6.8/7.2 Linux
e300
10GE-OC192
HP 32/48-core
2/4-socket
6.8/7.2 Linux
e300
10GE-OC192
Cisco
Nexus 7k
Cisco
Nexus 7k
ORNL-ATL-ORNL connection : rtt: 11.6 ms: 100Gbps
10GigE emulated connections: rtt: 0-800ms
server
ORNL Testbed : Emulated and Physical Connections
RTTs used in measurements:
• cross-country (0-100ms)
• across continents (100-200ms)
• across globe (366ms)

Managed by UT-Battelle for theU. S. Department of Energy
TCP Memory Throughput Measurements: Uniform Nodes
Throughput traces and profiles: qualitatively similar across TCP variants
CUBIC (Linux default), Hamilton TCP, Scalable TCP
As expected:
• profile: decreases with RTT
• trace: sort of periodic in time
Not expected:
• profile: concave at lower RTT
• trace: significant variations
• larger at higher RTT
0
1( ) ( , )
OT
O
O
t dtT
= ( , ) :t throughput at time t over
connection with RTT
Trace: Throughput Profiles: over periodOT

Managed by UT-Battelle for theU. S. Department of Energy
TCP Throughput Profiles
• Most common TCP throughput profile
– convex function of rtt
– example, Mathis et al (1997)
• Observed Dual-mode profiles: throughput measurement
– CUBIC, STCP, HTCP
Smaller RTT
• Concave region
Larger RTT
• Convex region
concave
regionconvex
region
*( )M
MSS k
p
=
throughput at rtt loss-rate p
RTT - ms
Th
rou
gh
pu
t -
Gb
ps
Concave-convex
Function is concave
over interval : for
for all
Informally, function is above
the linear interpolation
Convex: use in place of
( )f x
1 2 I I
[0,1]x
( )
( ) ( )
1 2
1 2
(1 )
(1 )
f x x
xf x f
+ −
+ −
Managed by UT-Battelle for theU. S. Department of Energy
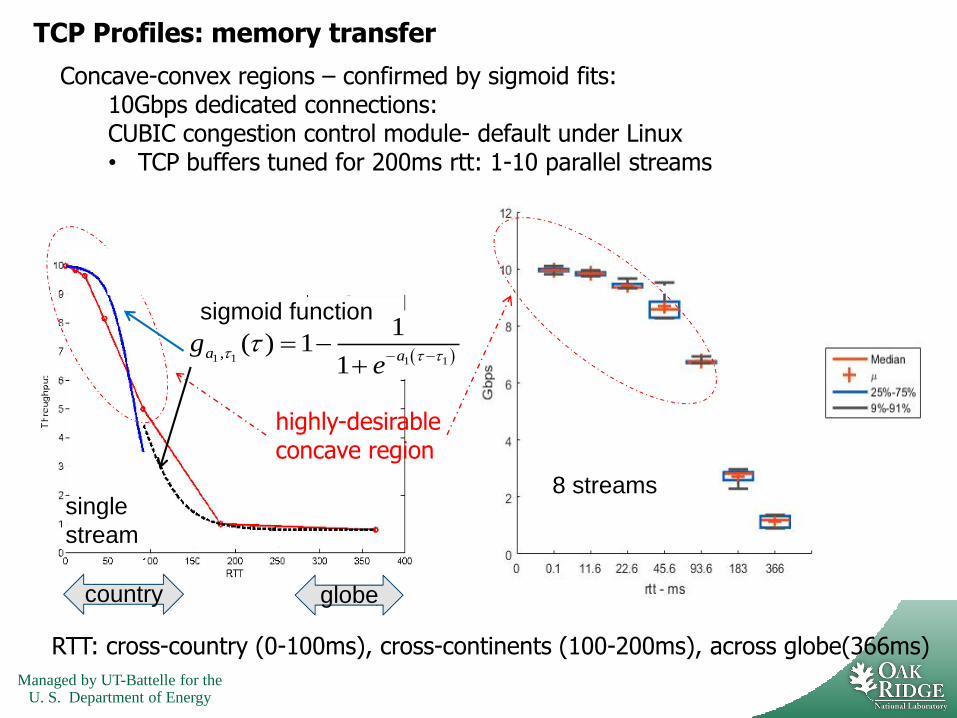
TCP Profiles: memory transfer
Concave-convex regions – confirmed by sigmoid fits:10Gbps dedicated connections: CUBIC congestion control module- default under Linux• TCP buffers tuned for 200ms rtt: 1-10 parallel streams
RTT: cross-country (0-100ms), cross-continents (100-200ms), across globe(366ms)
single
stream
8 streams
country globe
highly-desirable concave region
( )1 1 1 1,
1( ) 1
1a a
ge
− −= −
+
sigmoid function

Managed by UT-Battelle for theU. S. Department of Energy
• Ramp-up Phase
– throughput increases from initial value to around capacity
• Sustainment Phase
– Throughput is maintained around a peak value
• TCP congestion avoidance
– time trace of throughput during sustainment
Basic Throughput Model
time t
throughputramp-up sustainment
peak
• connection
capacity
• buffer limit
( )0
1( , )
RT
R
R
t dtT
=
OT
RTST
( )1
( , )O
R
T
S
S T
t dtT
=
, ( , )B n
V t
( )R t ( )S t
( )S t
0
1( ) ( , )
OT
O
O
t dtT
=
Throughput trace of n streams of TCP version V with buffer size B:
,( ) ( , )B n
Vt t =
,B nC

Managed by UT-Battelle for theU. S. Department of Energy
decreasing function of
Faster than Slow Start and Multiple TCP flows:
Expand Concavity
Faster than Slow Start:
Average Throughput:
logkn C=
112 log( ) O
O
O O
C T CC
T T
++ − = +
1logR kT n C +
= =
More increases than slow start:
data sent: 1 11 2 2 2 1 2 1k kn nC
+ ++ + + = − = −1
1
2
log
nk
R
C
C
+
+
( )1 logO
O
C Cd
d T
+
= −
implies concavity of ( )O
0, 1

Managed by UT-Battelle for theU. S. Department of Energy
Well-Known tool for analyzing time series – used in chaos theory
• Poincare map
– Time series:
– generated as
• Effect of Poincare map:
– range specifies achievable throughput
– complexity indicates rich dynamics – lower throughput and narrow concave
Poincare Map
: d dM →
0 1 1, , , , ,i iX X X X +
( )1i iX M X+ =
combined throughput
10 individual flows
scatteredmap

Managed by UT-Battelle for theU. S. Department of Energy
Lyapunov Exponent: Stability and Concavity• Log derivative of Poincare map
• Provides critical insights into dynamics
– Stable trajectories:
– Chaotic trajectories:
• indicate exponentially diverging trajectories with small state variations
• larger exponents indicate large deviations
– protocols are operating at peak at rtt
– stability implies average close to peak - implies concavity
– positive exponents imply lowered throughput – trajectories can only go down
» then, weak sustainment implies convexity
L lnM
dM
dX=
L 0M
L 0M
zero
crossings
scattered
map
large implies low
throughput
LM
Managed by UT-Battelle for theU. S. Department of Energy
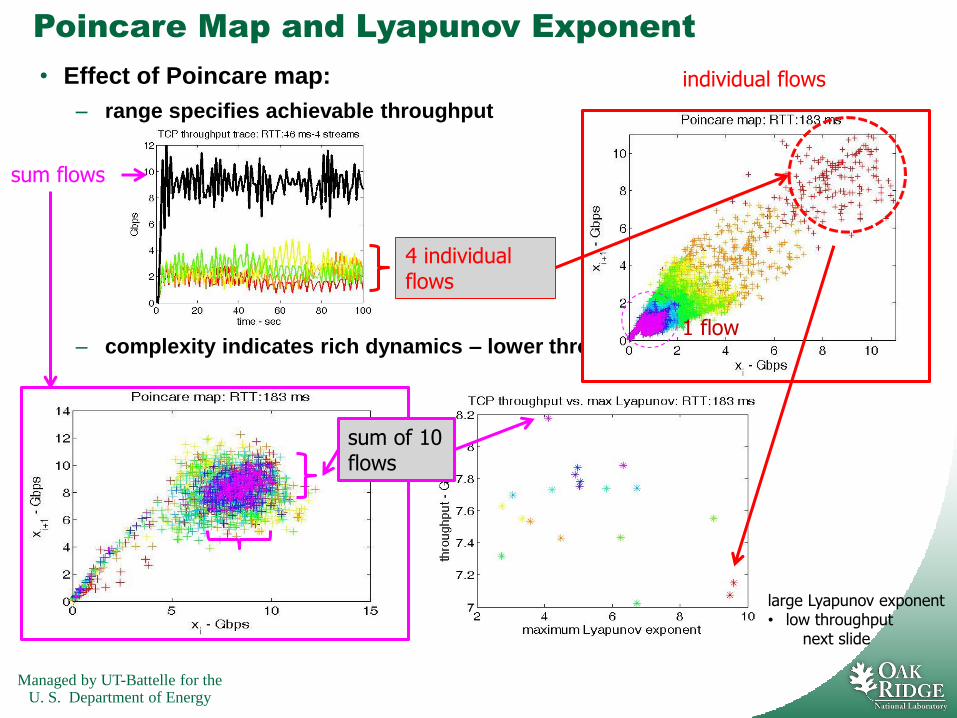
Poincare Map and Lyapunov Exponent
• Effect of Poincare map:
– range specifies achievable throughput
– complexity indicates rich dynamics – lower throughput and narrow concave
individual flows
1 flow
large Lyapunov exponent• low throughput
next slide
sum of 10 flows
4 individual flows
sum flows
Managed by UT-Battelle for theU. S. Department of Energy
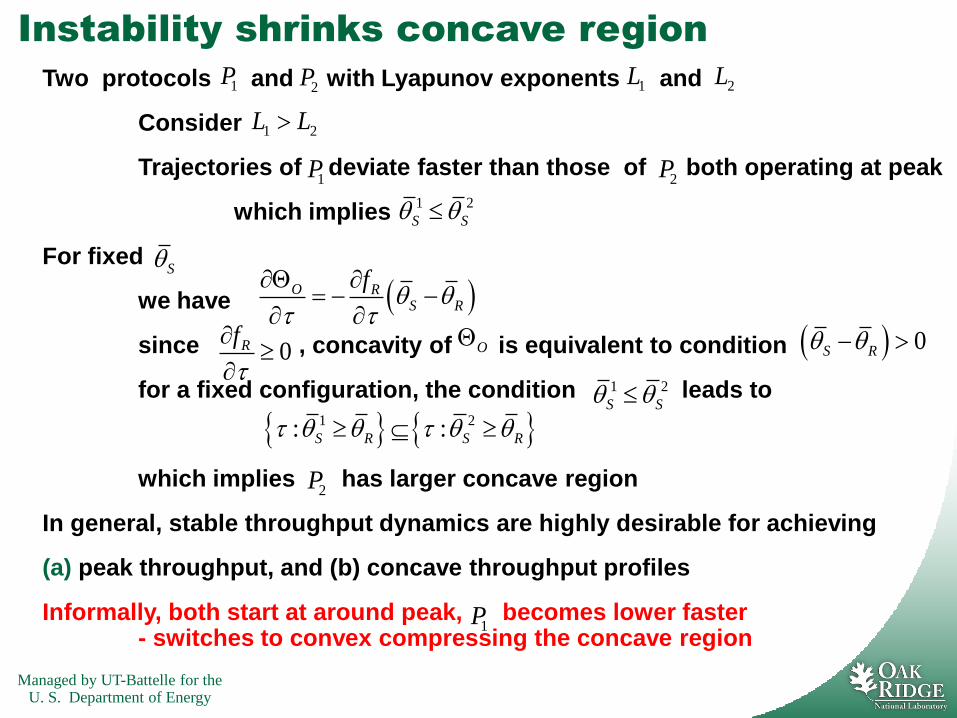
Instability shrinks concave region
Two protocols and with Lyapunov exponents and
Consider
Trajectories of deviate faster than those of both operating at peak
which implies
For fixed
we have
since , concavity of is equivalent to condition
for a fixed configuration, the condition leads to
which implies has larger concave region
In general, stable throughput dynamics are highly desirable for achieving
(a) peak throughput, and (b) concave throughput profiles
Informally, both start at around peak, becomes lower faster - switches to convex compressing the concave region
1P2P 1L 2L
1 2L L
1P 2P
1 2
S S
S
( )O RS R
f
= − −
0Rf
O ( ) 0S R −
1 2
S S
1 2: :S R S R
2P
1P

Managed by UT-Battelle for theU. S. Department of Energy
Network and IO Systems:
Wide-area file transfers involve complex systems
Peak IO rates: xddprof on hosts
xfs: ~40 Gbps
lustre: ~32 Gbps
Peak n/w throughput:
iperf: 0ms rtt
TCP: > 9Gbps
UDP/T: > 8Gbps
Individually, more IO flows lead to higher IO throughputmore parallel TCP streams lead to higher network throughput
But, not necessarily true when composed: 8 Lustre IO + 8 TCP flows : 2Gbps

Managed by UT-Battelle for theU. S. Department of Energy
buffer buffer
buffer buffer
XDD source XDD destination
source
file
dest.
file
Qthread 0 Qthread 0
Qthread N-1 Qthread N-1network
XDD:
#IO threads = # parallel TCP streams = #flows
Utilizes its own buffers – different from Lustre buffers
Lustre file parameters
• stripe number: #OST
• stripe size
XDD: host-to-host file transfer tool
• XDD uses parallel flows to move files
– each flow is composed of
• source IO/file flow + TCP flow + destination IO/file flow
• data is read/written in blocks – sizes 8k,65k, 148k
Intuitively, more flows must provide high file transfer rate
But, our measurements show more complex dependency

Managed by UT-Battelle for theU. S. Department of Energy
TCP CUBIC and xfs file systems
• xdd host-to-host file transfers: peak: 10Gbps
xdd file IO throughput is close to TCP throughput
• 8 IO threads and 8 TCP parallel streams
• Impedance mismatch is quite small
8 threads 8 threads
memory
10Gbpsxfs write
10Gbps
Managed by UT-Battelle for theU. S. Department of Energy
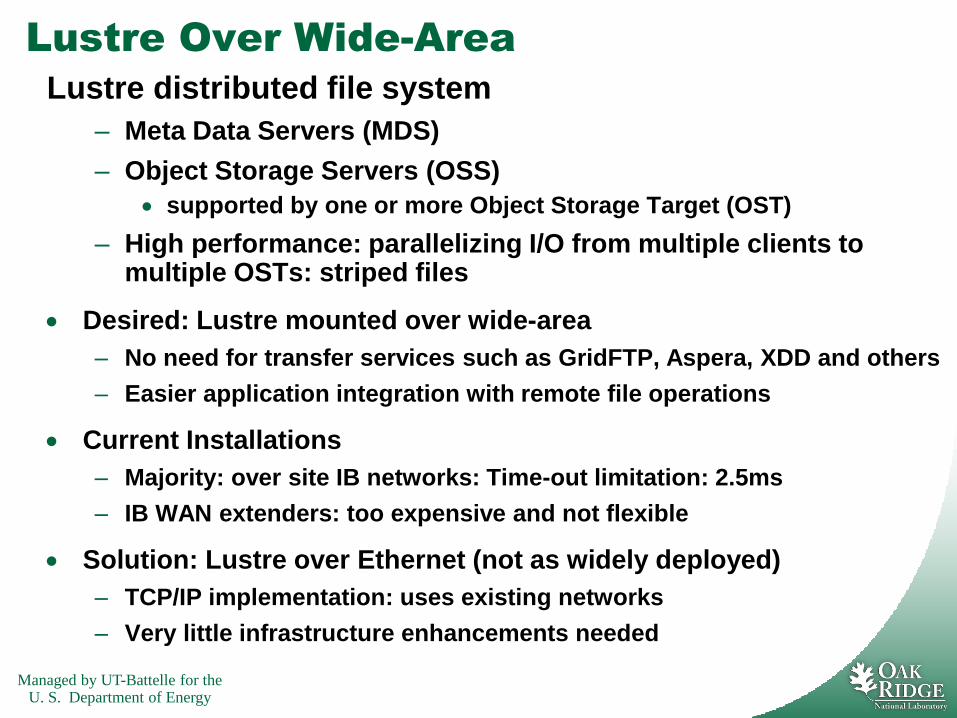
Lustre Over Wide-Area
Lustre distributed file system
– Meta Data Servers (MDS)
– Object Storage Servers (OSS)
• supported by one or more Object Storage Target (OST)
– High performance: parallelizing I/O from multiple clients to multiple OSTs: striped files
• Desired: Lustre mounted over wide-area
– No need for transfer services such as GridFTP, Aspera, XDD and others
– Easier application integration with remote file operations
• Current Installations
– Majority: over site IB networks: Time-out limitation: 2.5ms
– IB WAN extenders: too expensive and not flexible
• Solution: Lustre over Ethernet (not as widely deployed)
– TCP/IP implementation: uses existing networks
– Very little infrastructure enhancements needed

Managed by UT-Battelle for theU. S. Department of Energy
server
Lustre over IB-Ethernet: LNet routers
OSS node
OST OST
OSS node
OST OST
MDS node
MDT
Lustreclient
IB switch
IB
Ethernet switchEthernet
LNet router LNet router
LNet:Flexible bridging between different networks• IB and Ethernet here• Using Linux hosts
Lustreserver

Managed by UT-Battelle for theU. S. Department of Energy
Lustre wide-area: bohr – Hamilton TCP
bohr IO servers – TCP tuned
• 48core, opteron, 2.2 GHz
• write peak throughput: ~6Gbps
• lower than lowest iperf throughput
• Centos 6.8
Hamilton TCP: Not much difference
Recommended for large transfers over long (cross-country and inter-continental) distances
- Used in DOE Data Transfer Nodes (DTNs)
- CUBIC is default in Linux

Managed by UT-Battelle for theU. S. Department of Energy
IO or Network Bottleneck?
TCP memory transfers: concave-convex regions10Gbps: CUBIC TCP buffers tuned for 200ms rtt
Concave region: indicates buffer, IO bottleneckOur Lustre configuration indicates IO limit
RTT: cross-country (0-100ms), cross-continents (100-200ms), across globe(366ms)
8 streams
country globe
desirable concave region
convex region: buffer or IO bottleneck

Managed by UT-Battelle for theU. S. Department of Energy
increasing function of
Generic Model for Data, Disk and File Transfers
Buffer size, IO throughput or available processing power limit data in transit:connection capacity (bps):RTT:data unacknowledged within a slot of period:
no IO or processor limit:under IO or processor limit:
example: limited buffer size
Throughput averaged over each slot of width :
0
1( ) ( )
OT
O
O
Bt dt
T
= =
2
Od B
d
= −
implies convexity of ( )O
C
( )B
t
=
CB C
Throughput profile:
Throughput derivative:
C
CB B
C C
no limit – protocol A, B
IO limit – protocol A
CB B
IO limit – protocol B
Transport methods may have different shapes of B – but subject to convexity• convex profile indicates disk or file throughput limit • due to peer credits on IB and Ethernet sides of LNet

Managed by UT-Battellefor the Department of Energy
ORNL
ANL
PNNL
LBNL
NERSC
BNL
13ms
67ms
86ms
54ms
73ms
150,
366ms
29ms
105ms
22ms
NCSA
183ms
LHC
other
Data transfer infrastructures:
Sites vary: file system, transfer hosts, …

Managed by UT-Battelle for theU. S. Department of Energy
Profiles of infrastructures
XDD
Transfers
- uniform
nodes
LNet Lustre
- uniform
nodes
Globus file transfers
- production infrastructure
- site variations lead to
complex profiles

Managed by UT-Battelle for theU. S. Department of Energy
Utilization-Concavity Coefficient
• Scalar
▪ Normalized with respect to throughput and rtt
▪ Incorporates both concavity and utilization throughput profiles
concavity
no
rma
lize
dth
rou
gh
put
normalized RTTRTTutilization

Managed by UT-Battellefor the Department of Energy
Production
Esnet
Globus
Esnet
Physical
Testbed
Globus Emulation
Testbed
TCP
File
transfer
Coefficient for 8 different transport infrastructures

Managed by UT-Battelle for theU. S. Department of Energy
Foundational Limits of Machine Learning Codes
finite samplescomputability
expressability
machine
learning
codes
Turing Limit
Vapnik-
Valiant-
Devroye
Limit
Tarski’s Limit
Computations executed on machine with data and models
learnability
domain data and
models
Throughput profiles have monotonicity properties: effectively learnable

Managed by UT-Battelle for theU. S. Department of Energy
Confidence Estimatesrandom with distribution that depends on
- TCP version and parameters
- host and connection parameters
( , ) :t ( )OP
Profile regression: ( )( ) ( ) ( )OO O OE P = =
Profile mean based on measurements: ( , ) : 1,2, , ; 1,2, ,k
k i kt k n i n = =
1
1ˆ ( ) ( , )kn
k
O k k i
ik
tn
=
=
Estimate of profile regression chosen from class of monotone functions
TCP profile decreases with RTT
Error of estimate
Best estimate:
Linear interpolation based on profile mean is close to optimal probabilistically
Gets better with more measurements
f M
2
( , )( ) ( ) ( , ) tI f f t P = −* *: ( ) min ( )
f Mf I f I f
=
*ˆ( ) ( )OP I I f − 2
2
(1 / )log (4 / )
/(2 )^232
C C
n Cnne
+
− =
Intuitively, profile is close to
optimal with high probability
machine learned profile

Managed by UT-Battelle for theU. S. Department of Energy
Multi-Site Cloud Computing Infrastructure
network
site
users
server 1
site router
site 1 site k
expanded site view
server 2 server
cyber attacks
on servers
physical fiber
attacks
SN
kL
Single fiber attack:
same effect as
cyber attacks on all
site servers

Managed by UT-Battelle for theU. S. Department of Energy
Infrastructure: Systems of Components
Consists of individual systems:
each system consists of cyber and physical components
N
:defenders investment in system in defending iSix
:attackers investment in attacking system iSiy
example: number of reinforced components of
example: number of reinforced components of iS
:survival probability of system iSiP
example: contest success function
m
ii m m
i i
xP
x y=
+
:survival probability of multiple system infrastructure
In general, it depends on:
defenses
attacks
correlations
This formulation captures cloud computing infrastructure
- Not flexible to capture varying complexities of systems
IP
1 2, , , Nx x xL
1 2, , , Ny y yL
iS

Managed by UT-Battelle for theU. S. Department of Energy
( )
( ) ( )
( ) ( )
1 1
, 1 1 1 1
, 1 1 1
, , , ,
, , , , , , , ,
, , , , , ,
S S
S S S S
S S S
D N N
D G N N D N N
D L N N D N
U x x y y
F x x y y G x x y y
F x x y y L x x
=
+
L L
L L L L
L L L
Defender Utility: General Form
Defender minimization utility function:
Defender: reinforces Attacker:
cost term
number of components
reinforced of basic systemix number of components
attacked of basic systemiy
iSiS
reward term
Managed by UT-Battelle for theU. S. Department of Energy
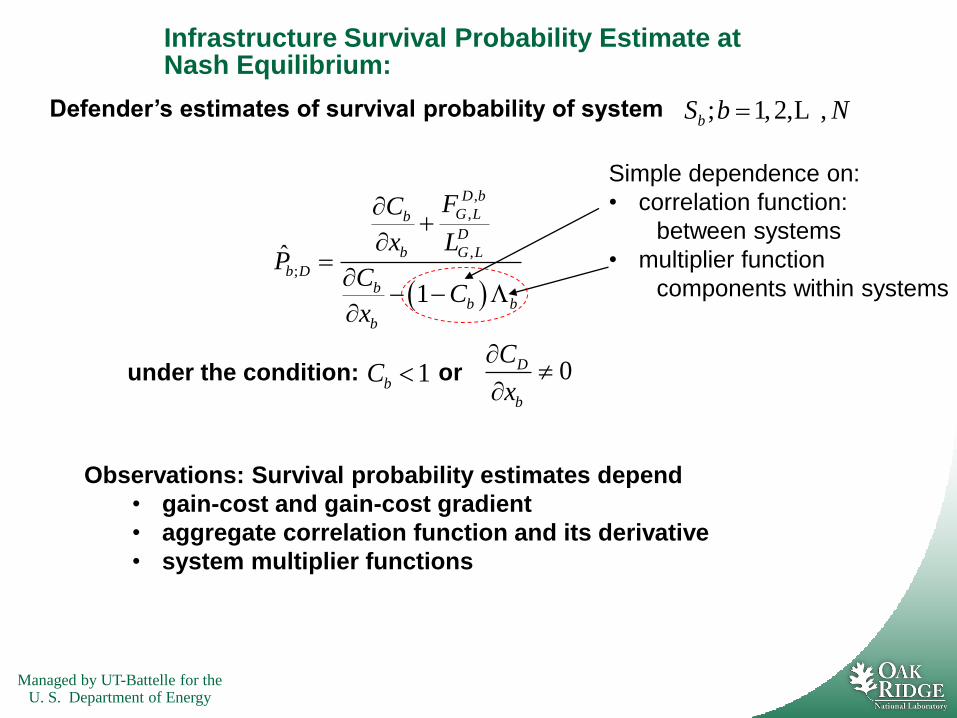
Infrastructure Survival Probability Estimate at Nash Equilibrium:
Defender’s estimates of survival probability of system
under the condition: or
; 1,2, ,bS b N= L
1bC 0D
b
C
x
Observations: Survival probability estimates depend
• gain-cost and gain-cost gradient
• aggregate correlation function and its derivative
• system multiplier functions
( )
,
,
,
;ˆ
1
D b
G Lb
D
b G L
b Db
b b
b
FC
x LP
CC
x
+
=
− −
Simple dependence on:
• correlation function:
between systems
• multiplier function
components within systems

Managed by UT-Battellefor the Department of Energy
super-
computerscience
instrument
performance-
enabled science
Infrastructure
network
analytics
diagnosis, trend detection, strategyperformance optimization
provisioning and scheduling
storage analysis
visualize
instruments and
measurementsfacility and network
scheduling and control
AI search, game theory,
stochastic approximation
sm
art
syste
ms
machine learning, chaotic-
map, design of experiments
sm
art
analy
tics a
nd s
trate
gie
ssm
art m
easure
ments
and c
ontro
l
control-plane
data-plane
data-plane
self-optimization; self diagnosis and healing
adaptive allocation and scheduling
S-
SDN
S-SDS
S-sched S-SDSI
S-SDAV
Looking into Future:
Integrated Softwarized Federated Instruments for Science:
Managed by UT-Battelle for theU. S. Department of Energy
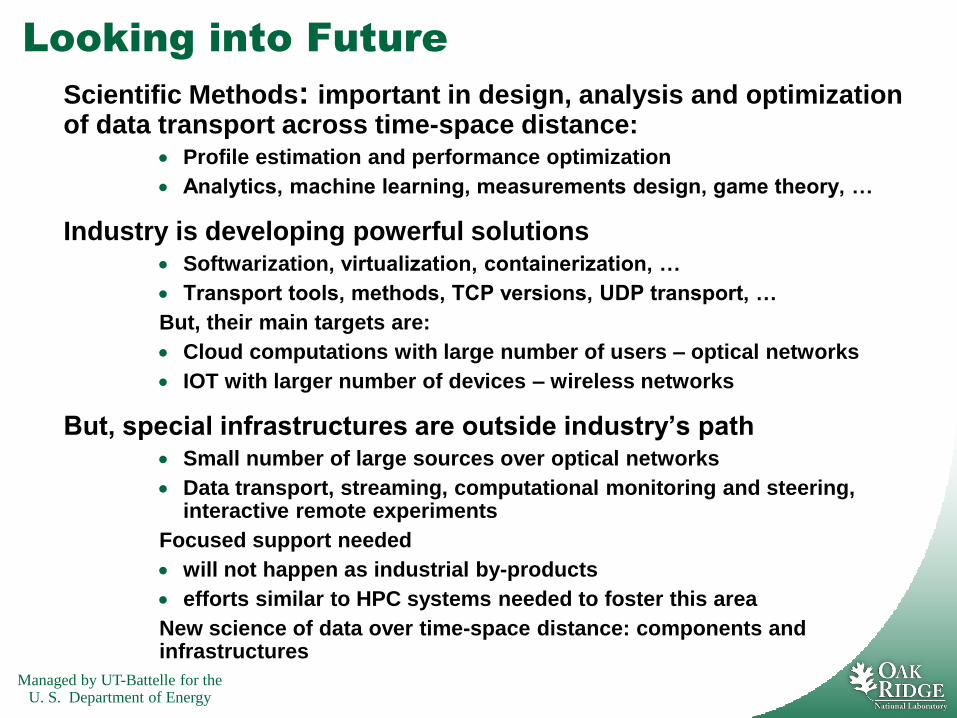
Looking into Future
Scientific Methods: important in design, analysis and optimization of data transport across time-space distance:
• Profile estimation and performance optimization
• Analytics, machine learning, measurements design, game theory, …
Industry is developing powerful solutions • Softwarization, virtualization, containerization, …
• Transport tools, methods, TCP versions, UDP transport, …
But, their main targets are:
• Cloud computations with large number of users – optical networks
• IOT with larger number of devices – wireless networks
But, special infrastructures are outside industry’s path• Small number of large sources over optical networks
• Data transport, streaming, computational monitoring and steering, interactive remote experiments
Focused support needed
• will not happen as industrial by-products
• efforts similar to HPC systems needed to foster this area
New science of data over time-space distance: components and infrastructures

Managed by UT-Battelle for theU. S. Department of Energy
Thank you
Managed by UT-Battelle for theU. S. Department of Energy
References1. N. S. V. Rao, C. Y. T. Ma, K. Hausken, F. He, D. K. Y. Yau, J. Zhuang, Defense
strategies for asymmetric networked systems with discrete components, Sensors, vol.
18, 2018, pp. 1421.
2. N. S. V. Rao, SDN solutions for switching dedicated long-haul connections:
Measurements and comparative analysis, International Journal on Advances in
Networks and Services, vol. 9, no. 3-4, 2016.
3. N. S. V. Rao, Q. Liu, S. Sen, R. Kettimuthu, J. Boley, B. W. Settlemyer and D.
Katramatos, Regression-based analytics for response dynamics of SDN solutions and
components, Workshop on Emerging Trends in Softwarized Networks (ETSN 2018),
co-located with Netsoft2018, 2018.
4. Q. Liu, N. S. V. Rao, On concavity and utilization analytics of wide-area network
transport protocols, IEEE International Conference on High Performance Computing
and Communications, (HPCC), June 28-30, 2018.
5. Q. Liu, N. S. V. Rao, S. Sen, B. W. Settlemyer, H. B. Chen, J. Boley, R. Kettimuthu,
and D. Katramatos, Virtual environment for testing software-defined networking
solutions for scientic workows,Workshop on AI-Science -Autonomous Infrastructure
for Science, in conjunction with HPDC, 2018.
6. 12. Z. liu, R. Kettimuthu, I. Foster, N. S. V. Rao, Cross-geography scientic data
transfer trends and user behavior patterns, 27th ACM International Symposium on
High Performance Parallel and Distributed Computing (HPDC), 2018.
7. N. S. V. Rao, C. Y. T. Ma, F. He, On defense strategies for recursive system of
systems using aggregated correlations, International Conference on Information
Fusion, 2018.

Managed by UT-Battelle for theU. S. Department of Energy
References1. N. S. V. Rao, N. Imam, J. Haley, S. Oral, Wide-Area lustre le system using LNet
routers, 12th Annual IEEE International Systems Conference (SYSCON2018), 2018.
2. N. S. V. Rao, C. Y. T. Ma, F. He, Defense strategies for multi-site cloud computing
server infrastructures, 19th International Conference on Distributed Computing and
Networking, (ICDCN 2018), 2018.
3. S. Sen, N. S. V. Rao, Q. Liu, N. Imam, I. Foster, R. Kettimuthu, Experiments and
analyses of data transfers over wide-area dedicated connections, First International
Workshop on Workow Science (WOWS), 2017.
4. N. S. V. Rao, Q. Liu, S. Sen, J. Hanley, I. Foster, R. Kettimuthu, C. Q. Wu, D. Yun, D.
Towsley, G. Vardoyan, Experiments and analyses of data transfers over wide-area
dedicated connections, The 26th International Conference on Computer
Communications and Networks (ICCCN 2017), 2017.
5. N. S. V. Rao, Q. Liu, S. Sen, D. Towsley, G. Vardoyan, R. Kettimuthu, I. Foster, TCP
throughput proles using measurements over dedicated connections, 26th ACM
International Symposium on High Performance Parallel and Distributed Computing
(HPDC), 2017.
6. N. S. V. Rao, N. Imam, C. Y. T. Ma, K. Hausken, F. He, J. Zhuang, On defense
strategies forsystem of systems using aggregated correlations, 11th Annual IEEE
International Systems Conference(SYSCON2017), 2017.
7. N. S. V. Rao, Q. Liu, S. Sen, G. Hinkel, N. Imam, I. Foster, R. Kettimuthu, B.
Settlemyer, C. Q. Wu, D. Yun, Experimental analysis of le transfer rates over wide-area
dedicated connections, 18th IEEE International Conference on High Performance
Computing and Communications (HPCC), 2016.