some recent trends in commercial banking - gies...
TRANSCRIPT

Some Recent Trends inCommercial Banking
Huberto M. Ennis
I n this article I review some recent trends in the evolution of U.S. commer-cial banks. The banking industry has experienced a series of significanttransformations in the last two or three decades. Among the most im-
portant of them is the change in the type of organizations that dominate thelandscape. Since the eighties, banks have increased the scope and scale oftheir activities, and several banks have become very large institutions with apresence in multiple regions of the country. After this long period of trans-formations, now is a good time to stop and look back at the changes that haveoccurred.
Reviewing these trends over the last thirty years may also help to put inperspective the behavior of the banking system during the 2001 recession.We have not had many recessions since the major transformations in bankinghappened. In fact, the only other recession took place in 1991–1992 and foundthe banking system in the middle of the resolution of a widespread crisis. Aftertwo years of slow recovery, this is an appropriate time to assess how the newbanking system behaved during the last recession. For such evaluation, it isuseful to have a long-run (thirty year) perspective on the direction of changein the relevant variables. This perspective is the focus of the present article.
This study concentrates only on commercial banks, most of which arepart of a larger company, a bank holding company. Sometimes, more thanone commercial bank belongs to the same bank holding company. Thesebanks are called sister banks. In general, sister banks tend to be managed asdifferent branches of a single bank rather than as independent banks. In fact,
Research Department, Federal Reserve Bank of Richmond, [email protected]. Iwould like to thank Margarida Duarte, Tom Humphrey, Jennifer Sparger, John Walter, JohnWeinberg, and Steven Zunic for their useful comments. I would also like to thank Fan Ding,Dan Herlihy, and Sam Malek for providing able research assistance. All errors are, of course,my own. The views expressed here do not necessarily reflect those of the Federal ReserveBank of Richmond or the Federal Reserve System.
Federal Reserve Bank of Richmond Economic Quarterly Volume 90/2 Spring 2004 41

42 Federal Reserve Bank of Richmond Economic Quarterly
until the mid-1980s, the creation of sister banks was partly a response to strictregulations on branching. In this sense, looking at sister banks as differentbanks can be somewhat misleading, even from the perspective of regulators,since sister banks are subject to cross-guarantee provisions by which onebank can be liable for its sister bank’s losses. However, only 30 percentof U.S. banks belong to multi-bank holding companies. Furthermore, theparent organization is subject to limited liability protection rules with respectto the losses in the bank. These rules make the financial situation of theindividual banks still important for regulatory purposes, to the extent that thelosses associated with a bank’s failure may still be transferred to the insurancefund, even when the bank holding company does not go bankrupt. For thesereasons, and since the data on commercial banks is readily available, it seemsappropriate to focus on the population of commercial banks to identify therelevant major trends in the industry.
When possible, I will discuss the evolution of the industry from 1970 tothe present. Boyd and Gertler (1993) reviewed the trends in U.S. commercialbanking since the fifties. My analysis complements theirs, as I extend the dataperiod to include the last ten years (see also Carlson and Perli 2002). In somecases, data availability allows me to go back only to 1984 when the proceduresused by banks to report information to the regulators (The Call Reports) werethoroughly revised.
The article is organized as follows. In Section 1, I provide a quick overviewof the changes in the structure of the industry. In Section 2, I study the majortrends in the balance sheet of all commercial banks, taken as a group. Wheninformative, I divide the banks into four different groups, according to theirsize measured by total assets. In Section 3, I perform a similar analysis of theevolution of the income statement of banks. Finally, I reserve Section 4 forsome conclusions.
1. THE INDUSTRY STRUCTURE
For the period under study, one of the main changes in the structure of thebanking industry has been a movement toward consolidation. An entire lit-erature has developed around this subject (see Ennis [2001] for a summarydiscussion and further references). Here I present only some major trends thatreflect this process.
In general, advances in communication have made the U.S. economy muchmore integrated at the national level. The tendency to run national operations(as opposed to regional) is quite evident in the retail sector, for example. Theconsequences of this trend to banking come directly and indirectly. The directeffect originates in the fact that a large portion of the activities of banks, suchas the provision of checking accounts and other payment instruments, is retailin nature and hence subject to the same forces to become national. More

H. M. Ennis: Commercial Banking 43
Figure 1 The Number of Commercial Banks
A. Number of Commercial Banks16,000 -
14,000 -
12,000 -
10,000 -
8,000 -
6,000 -
4,000 -
2,000 -
0 - - 20
02
- - 2
00
0- - 1
99
8- - 1
99
6- - 1
99
4- - 1
99
2- - 1
99
0- - 1
98
8- - 1
98
6- - 1
98
4- - 1
98
2- - 1
98
0- - 1
97
8- - 1
97
6- - 1
97
4- - 1
97
2- - 1
97
0
700 -
600 -
500 -
400 -
300 -
200 -
100 -
0 -
B. Exit and Entry
- 20
02
- - 2
00
0- - 1
99
8- - 1
99
6- - 1
99
4- - 1
99
2- - 1
99
0- - 1
98
8- - 1
98
6- - 1
98
4- - 1
98
2- - 1
98
0- - 1
97
8- - 1
97
6- - 1
97
4- - 1
97
2- - 1
97
0
Mergers
New Charters
Failures
70,000 -
60,000 -
50,000 -
40,000 -
30,000 -
20,000 -
10,000 -
0 - - 2002
- - 2
000
- - 1
998
- - 1
996
- - 1
994
- - 1
992
- - 1
990
- - 1
988
- - 1
986
- - 1
984
- - 1
982
- - 1
980
- - 1
978
- - 1
976
- - 1
974
- - 1
972
- - 1
970
C. Total Number of Branches
- 2002
- - 2
000
- - 1
998
- - 1
996
- - 1
994
- - 1
992
- - 1
990
- - 1
988
- - 1
986
- - 1
984
- - 1
982
- - 1
980
- - 1
978
- - 1
976
- - 1
974
- - 1
972
- - 1
970
10,000 -
9,000 -
8,000 -
7,000 -
6,000 -
5,000 -
4,000 -
3,000 -
2,000 -
1,000 -
0 -
Institutions with branches
Unit Institutions
D. Unit Banking
Source: Federal Deposit Insurance Corporation (Annual Data for FDIC-Insured Commer-cial Banks: Tables CB01, CB02, CB03).
indirectly, it is also the case that some of the major customers of banks areretailers, which, having acquired national presence, are now more likely tobenefit from a relationship with a nationwide bank. The natural response hasthen been for banks to move toward consolidation.
At the beginning of the eighties, the number of commercial banks wasmore than 14,000, but by 2002, this number was less than 8,000 (see PanelA of Figure 1). It is striking to see the sharp change in 1985 to a significantdownward trend in the number of commercial banks. Several factors areassociated with this change. Panel B of Figure 1 shows that the numberof mergers increased during the eighties and nineties. It should be noticed,however, that this time series is quite volatile. The number of new charters

44 Federal Reserve Bank of Richmond Economic Quarterly
also decreased during the eighties, but the creation of new banks went back upto historical levels during the second half of the nineties. Finally, the numberof bank failures increased significantly during the second half of the eightiesbut again went back to normal levels (or even lower) after 1994.1
The late eighties and early nineties were a period of crisis in the commer-cial banking industry, clearly reflected by the increase in the number of bankfailures. However, the time series for the number of commercial banks doesnot seem to reflect this abnormal period: the number of banks is decreasingat an almost constant rate since 1985 (see Panel A of Figure 1). One possibleinterpretation for this lack of response in the number of banks during the cri-sis is that the trend in this variable is dictated by changes in long-run factorslike technological progress (see Broaddus [1998] for a similar argument). Inthis sense, we can think that at each point in time there is a target numberof banks in the economy which is determined by the technology of produc-tion, the factors influencing demand, and, of course, government regulations.Under this interpretation, the target number of banks has been subject to arelatively constant decreasing trend that started in the mid-eighties, and thecrisis that occurred during the late eighties and early nineties was an abruptchange affecting only who were the participants in the industry (but not howmany participants the industry should have). In other words, during the crisissome banks failed and some new banks were created, but this process had nosignificant effect on the underlying speed of consolidation.
In spite of the decreasing trend in the number of banks, it is interesting tonote that the number of branches has actually been increasing (and at about thehistoric trend) during this consolidation period (see Panel C in Figure 1). Oneof the fears commonly associated with a move toward consolidation is thatcompetition may be reduced as fewer and bigger banks dominate the market.However, the increase in the number of branches may be an indication thatthe level of competition in regional markets has not significantly decreased.2
Panel D in Figure 1 shows the declining trend in the number of unit banks.In the seventies, unit banks were being replaced by institutions with branches.After the mid-eighties, both the number of unit banks and the number of insti-tutions with branches trended downward. At first, consolidation was mostlyreducing the number of small unit banks, but by the early nineties the strongmove to consolidation also reached the intermediate and large-size banks withbranches (hence the decrease in their number). One important caveat with
1 The number of banking organizations, that is, the number of banks adjusted to treat allbanks within the same holding company as a single bank, decreased steadily from more than12,000 in 1980 to less than 6,000 in 1998. See Rhoades (2000), which also provides an excellentreview of the patterns on merger activity during the period.
2 Berger and Mester (2003) calculate the average Herfindahl index of concentration in localdeposit markets and conclude that the increase in market concentration from 1984 to 1997 hasbeen very moderate.

H. M. Ennis: Commercial Banking 45
respect to the decreasing trend in unit banking is that before the completeremoval of branching regulations in the early nineties, unit banks were oftenpart of the same bank holding company and hence were managed as, essen-tially, one bank. Furthermore, after 1989, the cross-guarantee provision inFIRREA3 implied that solvent banks affiliated with a failing bank were li-able for the losses associated with the failure (Walter 1996). In this sense,the distinction between unit banking and banks with branches became lessmeaningful, and a group of sister banks (that is, banks owned by the sameholding company) became not only managed as a single bank, but also legallyliable for each other’s losses. In summary, the move away from unit bankingpresented in Panel D of Figure 1, if not interpreted with caution, can induceus to overestimate the economic significance of the change involved.
At the same time that the banking industry was under transformation, thedevelopment of money markets and mutual funds created new possibilitiesfor firms to finance their investment and for investors to allocate their funds.It is then a natural question to ask whether the role of banks has been losingimportance in the U.S. economy (see also Boyd and Gertler 1994). Panel Aof Figure 2 shows that banks’ total assets as a proportion of nominal grossdomestic product have been relatively stable since the beginning of the sev-enties. If we interpret gross domestic product as a proxy for the size of theeconomy, then we may say that commercial banks have roughly kept pacewith the secular growth in economic activity. Deposits, though, have becomeless predominant, but the downward trend is very moderate.4
On the other hand, of the total liabilities outstanding in the economy,commercial banks hold a smaller proportion now than they did in the earlyseventies (see the bold line in Panel B of Figure 2). It is interesting to notice,however, that the decreasing trend has been tapering off and that, as a conse-quence, the proportion of total debt owed to banks is stabilizing at about 15percent.5 A similar long-run trend appears when we consider financial assetsheld by banks as a proportion of the total liabilities owed by the domesticnonfinancial sector (the thin line in Panel B of Figure 2). This ratio is harderto interpret since some of the financial assets held by banks are liabilities ofentities that belong to the financial sector (and hence, they are included in thenumerator but not in the denominator). But some interesting facts arise fromits evaluation. First, we can see that in the last ten years bank assets have beengrowing faster than the total debt owed by the nonfinancial sector. Second, theamount of debt owed by the financial sector has been growing faster than the
3 FIRREA is the acronym for the Financial Institutions Reform, Recovery, and EnforcementAct of 1989.
4 The main reason why bank assets have been able to grow at about the same speed of GDPwhile deposits have not, is that banks have increased their reliance on other borrowed funds tofinance their activities (see Figure 3).
5 Note that by combining the evidence in Panel A and B we can conclude that the totalamount of debt outstanding has been increasing faster than nominal GDP. In fact, the ratio oftotal debt to GDP was 1.75 in 1984, and it is now higher than 3.0.

46 Federal Reserve Bank of Richmond Economic Quarterly
Figure 2 Banking and the Economy
- 20
02
- - 2
00
0- - 1
99
8- - 1
99
6- - 1
99
4- - 1
99
2- - 1
99
0- - 1
98
8- - 1
98
6- - 1
98
4- - 1
98
2- - 1
98
0- - 1
97
8- - 1
97
6- - 1
97
4- - 1
97
2- - 1
97
0
80% -
70% -
60% -
50% -
40% -
30% -
20% -
10% -
0% -
Pe
rce
nt
of
GD
P
Bank Assets
Deposits
Loans
A. Bank Assets, Loans, and Deposits- 2
00
2:3
- 20
00
:3
- 19
98
:3
- 19
96
:3
- 19
94
:3
- 19
92
:3
- 19
90
:3
- 19
88
:3
- 19
86
:3
- 19
84
:3
- 19
82
:3
- 19
80
:3
- 19
78
:3
- 19
76
:3
- 19
74
:3
- 19
72
:3
- 19
70
:3
40% -
35% -
30% -
25% -
20% -
15% -
10% -
5% -
0% -
B. Commercial Banks Credit Market Assets
Pe
rce
nt
of To
tal C
red
it M
ark
et
De
bt
Note: The bold line in Panel B is the ratio of the total credit market assets held byU.S.-chartered commercial banks to the total credit market debt held by all sectors inthe economy. The thin line (top) is the ratio of the total credit market assets held byU.S.-chartered commercial banks to the total credit market debt held by the domesticnonfinancial sector. Sources: In Panel A, nominal GDP is from the Bureau of EconomicAnalysis; bank deposits are from the FDIC-Insured Commercial Banks Table CB15, andbank loans and assets are from the FDIC-Insured Commercial Banks Table CB09. InPanel B, all data are from Table L.1 of the Federal Reserve Board Release Z.1, Flow ofFunds Accounts.
amount of debt owed by the nonfinancial sector.6 In fact, this is true even if
6 This explains why in the last ten years the thick line in Panel B of Figure 2 has beenfairly flat while the thin line has been increasing.

H. M. Ennis: Commercial Banking 47
we exclude from the financial sector debt the part that is owed by government-sponsored enterprises (GSE) and other federally related mortgage pools. Inother words, financial sector debt has been growing faster, not just at GSEs (awell-known fact), but across the board.
2. THE BALANCE SHEET
During the thirty years under consideration, together with the consolidationtrend in banking, the U.S. financial system has experienced several other im-portant changes that, directly or indirectly, influenced the evolution of com-mercial banks’balance sheets. One prominent example of these developmentsis the increased participation of mutual funds in financial markets. While theamount of assets held by mutual funds represented less than 1 percent of to-tal financial assets in the economy at the beginning of the 1970s, they nowrepresent more than 11 percent. Since mutual funds are a direct alternativeto bank deposits as a channel for savings, their expansion has surely changedthe competitive conditions faced by banks in the deposit market. The plan forthis section is to review some of the major trends in the evolution of commer-cial bank balance sheets in order to put in perspective the impact on bankingactivities of the changes in financial markets occurring in the last thirty years.
Commercial Banks Balance SheetAsset Side Liability Side
Cash DepositsLoans and Leases Borrowed FundsSecurities OthersOthers Equity Capital
Panel A of Figure 3 shows the long-run trends on the asset side of theU.S. commercial banks’ aggregate balance sheet. The proportion of assetsrepresented by loans and leases has stabilized at 60 percent since the early1980s.7 Holdings of securities fluctuate around 20 percent, and cash holdingshave been trending downwards consistently, partly as a consequence of theimplementation of better techniques for cash management.
Panel B of Figure 3 presents the composition of total gross loans (excludinginterbank loans) at all commercial banks. We see that real estate loans havebeen gaining ground while the proportion of commercial and industrial (C&I)loans have been declining for almost twenty years. Since loans are a relativelystable proportion of total assets (see Panel A), the same trends also hold whenwe look at each type of loan as a proportion of total assets.
7 During the three decades prior to 1980, the proportion of loans and leases increased from40 percent to 60 percent while the proportion represented by securities decreased (see Boyd andGertler 1993).

48 Federal Reserve Bank of Richmond Economic Quarterly
Figure 3 Trends in Commercial Banks Balance Sheet
- 20
02
- - 2
00
0- - 1
99
8- - 1
99
6- - 1
99
4- - 1
99
2- - 1
99
0- - 1
98
8- - 1
98
6- - 1
98
4- - 1
98
2- - 1
98
0- - 1
97
8- - 1
97
6- - 1
97
4- - 1
97
2- - 1
97
0
70% -
60% -
50% -
40% -
30% -
20% -
10% -
0% -
Cash
Securities
Loans
A. Assets
Other Earning Assets
Perc
ent of Tota
l A
ssets
100% -
90% -
80% -
70% -
60% -
50% -
40% -
30% -
20% -
10% -
0% - - 20
02
- - 2
00
0- - 1
99
8- - 1
99
6- - 1
99
4- - 1
99
2- - 1
99
0- - 1
98
8- - 1
98
6- - 1
98
4- - 1
98
2- - 1
98
0- - 1
97
8- - 1
97
6- - 1
97
4- - 1
97
2- - 1
97
0
B. Compostion of Total Loans
C&I Real Estate Consumers Others
- 20
02
- - 2
00
0- - 1
99
8- - 1
99
6- - 1
99
4- - 1
99
2- - 1
99
0- - 1
98
8- - 1
98
6- - 1
98
4- - 1
98
2- - 1
98
0- - 1
97
8- - 1
97
6- - 1
97
4- - 1
97
2- - 1
97
0
90% -
80% -
70% -
60% -
50% -
40% -
30% -
20% -
10% -
0% -
Borrowed Funds
Deposits
C. Liabilities
Perc
ent of Tota
l A
ssets
Equity
100% -
90% -
80% -
70% -
60% -
50% -
40% -
30% -
20% -
10% -
0% - - 20
02
- - 2
00
0- - 1
99
8- - 1
99
6- - 1
99
4- - 1
99
2- - 1
99
0- - 1
98
8- - 1
98
6- - 1
98
4- - 1
98
2- - 1
98
0- - 1
97
8- - 1
97
6- - 1
97
4- - 1
97
2- - 1
97
0
D. Composition of Domestic Deposits
Demand Savings Time
Note: Borrowed funds represent federal funds purchased, securities sold under repur-chase agreements, demand notes issued to the U.S. Treasury, Federal Home Loan Bankadvances, mortgage indebtedness, liabilities under capitalized leases, and all other lia-bilities for borrowed money. Subordinated notes and all other liabilities constitute avery small (yet growing) portion of the liabilities and hence are not included the fig-ure. Source: The data in Panels A, C, and D are from the Federal Deposit InsuranceCorporation (Annual Data, Table CB09, CB14). The data in Panel B are from the FederalReserve Statistical Release (H8, End of Year Data).
It is worth mentioning here that, over the last twenty years, one of the mostpronounced changes in the composition of bank loans across the industry isthe increasing share of real estate loans in the investment portfolio of smallbanks (not in the figures). From a level of 22 percent of total assets in 1988,real estate loans at small commercial banks steadily increased their share to alevel of more than 37 percent at the beginning of 2003.

H. M. Ennis: Commercial Banking 49
Another interesting change in the composition of loans is the strong de-crease in the C&I loans’ share of total loans during the last three years (seePanel B of Figure 3). This decline is mostly explained by the correspondingdecline occurring at large banks (those banks with more than $300 millionin assets) where the proportion of C&I loans over total assets went from 19percent in mid-2000 to around 12 percent in July 2003.
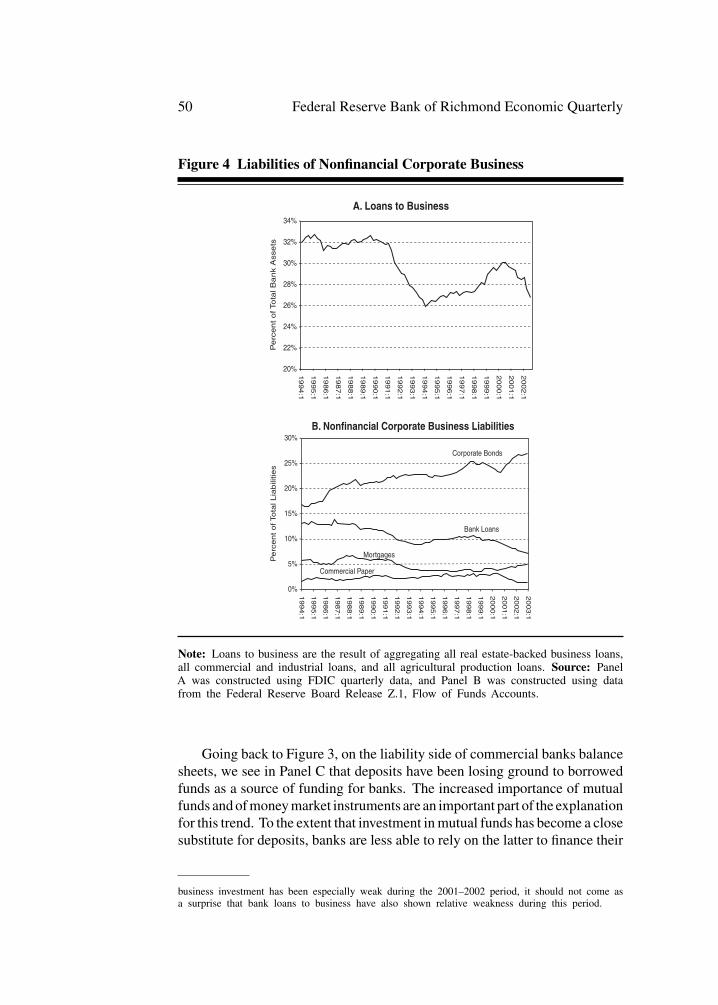
Figure 2 in the previous section suggested that banking has not declined inimportance relative to the aggregate economy, or at least not very much. Onerelated question would be to ask whether banking has lost ground as a source offunding for business undertakings. The decreasing contribution of C&I loansto the loan portfolio of banks could be a symptom of such a trend. For a moredirect assessment of this question, I constructed Figure 4. PanelA provides theevolution of bank loans to businesses (including not only C&I loans, but alsoreal estate-backed loans to businesses and others) as a proportion of total bankassets. We see that there has been a significant drop in this proportion in thelast ten to fifteen years. In principle, this decrease could be the consequence ofa slowdown in business activities (relative to other activities in the economy).However, Panel B shows that, during the same period, bank loans have alsobeen losing ground as a source of funds for the nonfinancial corporate businesssector. In summary, bank loans to business are becoming less important bothfor banks and for businesses.
Another important observation coming from Panel A of Figure 4 is thatin the last couple of years there has been a steep decrease of the proportion offunds that banks loan to businesses. Even though real estate-backed loans tobusiness (as a proportion of total bank assets) have actually been increasingduring the last five years, this increase has not been large enough to offsetthe pronounced decrease in the contribution of C&I loans in the last two orthree years (shown in Panel B of Figure 3). Panel B of Figure 4 shows that,since 1999, bank loans have also been losing share in the total liabilities ofnonfinancial corporate businesses.
It is interesting to compare these recent developments with those takingplace at the beginning of the 1990s. The decline in bank loans to businesseswas very stark during the first three years of the last decade. This decline couldbe part of the motivation for the “credit-crunch concerns” that were expressedat that time (see Green and Oh 1991). Considering that both 1991 and 2001were recession years, it seems clear that loans to businesses have shown astrong procyclicality in the last twenty years. This pattern is consistent withthe idea of a lending cycle. Yet, it should be clarified that more evidence wouldbe necessary to argue that such a lending cycle is a matter of concern.8
8 Weinberg (1995) clearly explains why, even in an efficient credit market, the intensity ofloan activity in banks would fluctuate with aggregate conditions. In this sense, to the extent that
50 Federal Reserve Bank of Richmond Economic Quarterly
Figure 4 Liabilities of Nonfinancial Corporate Business
- 2002:1
- 2001:1
- 2000:1
- 1999:1
- 1998:1
- 1997:1
- 1996:1
- 1995:1
- 1994:1
- 1993:1
- 1992:1
- 1991:1
- 1990:1
- 1989:1
- 1988:1
- 1987:1
- 1986:1
- 1995:1
- 1994:1
34% -
32% -
30% -
28% -
26% -
24% -
22% -
20% -
A. Loans to Business
Pe
rce
nt
of To
tal B
an
k A
sse
ts
- 2003:1
- 2002:1
- 2001:1
- 2000:1
- 1999:1
- 1998:1
- 1997:1
- 1996:1
- 1995:1
- 1994:1
- 1993:1
- 1992:1
- 1991:1
- 1990:1
- 1989:1
- 1988:1
- 1987:1
- 1986:1
- 1995:1
- 1994:1
30% -
25% -
20% -
15% -
10% -
5% -
0% -
B. Nonfinancial Corporate Business Liabilities
Pe
rce
nt
of To
tal L
iab
ilitie
s
Corporate Bonds
Bank Loans
Mortgages
Commercial Paper
Note: Loans to business are the result of aggregating all real estate-backed business loans,all commercial and industrial loans, and all agricultural production loans. Source: PanelA was constructed using FDIC quarterly data, and Panel B was constructed using datafrom the Federal Reserve Board Release Z.1, Flow of Funds Accounts.
Going back to Figure 3, on the liability side of commercial banks balancesheets, we see in Panel C that deposits have been losing ground to borrowedfunds as a source of funding for banks. The increased importance of mutualfunds and of money market instruments are an important part of the explanationfor this trend. To the extent that investment in mutual funds has become a closesubstitute for deposits, banks are less able to rely on the latter to finance their
business investment has been especially weak during the 2001–2002 period, it should not come asa surprise that bank loans to business have also shown relative weakness during this period.

H. M. Ennis: Commercial Banking 51
lending activities. Also, banks are using more money market instruments tomanage their short-run liquidity needs, and such liabilities are included in the“borrowed funds” category. Finally, in the last ten years, there has been anincrease in the amount of loans that commercial banks take from the FederalHome Loan Banks system. These loans are also part of the borrowed fundsaggregate.
Panel D shows that the proportion of deposits represented by time depositshas been relatively stable over the years, but the proportion of demand depositshas been decreasing steadily, from being more than 50 percent of total depositsin 1970 to less than 15 percent in 2003.9 Panel D also shows that in the lastten years, savings accounts have been crowding out both time and demanddeposits.10
During the nineties, the share of total bank assets funded by core deposits(total deposits less time deposits that are larger than $100,000) has been de-creasing even faster than the share of total deposits (see Genay 2000).11 Bankshave increased their reliance on more interest-sensitive liabilities for fundingtheir loan activities. In fact, the loan-to-deposit ratio is now above one (fromabout 0.6 at the beginning of the seventies), implying that banks are loaningout a higher amount of funds than they have in deposits.12 While borrowedfunds are more sensitive to interest rate changes, they also require lower re-serve levels to satisfy unexpected swings in the demand for liquidity. Thelower need for reserves increases the propensity of banks to loan availablefunds and hence increases the loan-to-deposit ratio.
One of the most important components of the liability side of banks’balance sheets is, of course, equity capital. Table 1 shows some interestingpatterns in the holdings of equity capital by U.S. commercial banks.
First, smaller banks tend to hold higher capital ratios (defined as equitycapital over total assets). This evidence is consistent with the view that smallerbanks tend to be less diversified and need to hold relatively more equity capital
9 Since the 1980s a type of transaction account called Negotiable Order of Withdrawal (NOW)has become more widely used. NOW accounts are not included in the demand deposit categoryused in Panel D of Figure 4. It is interesting to note, however, that their increase in importancehas not been enough to compensate for the ground lost by demand deposits (another type oftransaction account). By dividing deposits into transaction and nontransaction accounts we canobserve that in the seventies, transaction accounts were around 50 percent of the total, but, sincethen, they have been steadily losing participation to become less than 20 percent in 2002.
10 This increase in the importance of savings accounts versus demand deposits accounts ispartly associated with the increase in the use of “sweeping” since 1994. Sweep accounts allowbanks to periodically reclassify balances from retail transactions deposits into savings accounts soas to reduce their reserve requirements (see Krainer 2001 for details).
11 This decreasing trend in core deposits has been reversed in the last couple of years, apattern consistent with the fact that this has been a period of low interest rates and especiallyweak performance of the stock market (see Carlson and Perli 2002).
12 The loan-to-deposit ratio is calculated as the ratio of total gross loans and leases and totaldomestic deposits in all FDIC insured commercial banks.

52 Federal Reserve Bank of Richmond Economic Quarterly
Table 1 Equity Capital (Percent of Total Assets)
Size <$100 Million $100 Million– $ 1 Billion– >$10 Billion$ 1 Billion $10 Billion
1985 8.50 7.20 5.84 4.911990 8.98 7.67 6.33 5.261995 10.42 9.39 8.57 7.192000 11.06 9.59 8.98 8.072003* 11.27 9.94 10.61 8.52
Note: (*) The data for 2003 are only for the first half of the year. Source: FDICQuarterly Banking Profile.
to control the impact of agency costs in their access to external financing (see,for example, Ennis 2001).
Second, we can see that capital ratios have been increasing through timefor all bank sizes. During the eighties and nineties important changes in bankregulation have increased the role of capital as a way of limiting the riskexposure of banks. The Basel Accord in 1988 is, without a doubt, a clearmove toward increasing bank holdings of capital.13 In fact, the biggest jumpin capital ratios at commercial banks occurred during the first four years ofthe nineties when both the capital-to-asset ratio (in Table 1) and the risk-adjusted capital ratio increased around 2 to 3 percent, on average. The risk-adjusted capital ratio is calculated using a risk-adjusted asset base on whicheach component of the bank’s assets is weighted according to a regulatory-risk classification. It should be said, however, that the risk classification isrelatively coarse and hence the adjustment may fail to accurately reflect theevolution of risk in banks’ portfolios. Still, to the extent that the adjustmentdoes take into account, at least partially, the changes in risk, it is interesting tonote that, since 1992, the risk-adjusted capital ratio has been relatively constantat around 12.5 percent. This evidence, combined with the information in Table1, suggests that asset portfolios of banks have become riskier during the lastten years.14
The risk-adjusted capital ratio started to be calculated officially only after1990, and hence it is not possible to take a long-run perspective on its evolution.The simpler captial-to-assets ratio presented in Table 1 allows us to obtain alonger-run perspective on the evolution of capital (since 1985). Even though
13 The “prompt corrective action” clause introduced in the FDICIA uses Basel capital re-quirements to determine when the regulators should intervene in the case of an undercapitalizedbank. As a consequence, the importance of capital ratios as a supervisory tool has increased since1991.
14 The measure of risk-adjusted assets contains a component representing off-balance-sheetexposure of banks, which has been gaining importance during the last decade.

H. M. Ennis: Commercial Banking 53
this simpler ratio fails to account for changes in assets’ risk, it can still beinformative (as a complement to the risk-adjusted ratio) to the extent thatbanks exercise regulatory-capital arbitrage to artificially reduce the measureof adjusted assets. In support of this view, for example, Estrella, Park, andPeristiani (2000) argue in favor of using simple capital ratios as informativesignals for predicting bank failures.
3. THE INCOME STATEMENT
I now turn to reviewing the long-run trends in the components of the incomestatement of banks. Obviously, the changes in the structure of the industry(see Section 1) and in the composition of the balance sheet (see Section 2)can change the sources of income at banks. Another recent developmentin banking that had significant implications for the evolution of the incomestatement is the increase in importance of off-balance-sheet activities. Someof the most common off-balance-sheet activities are the provision of linesof credit, the securitization and sale of loans, and the trading of derivativeinstruments. Outstanding lines of credit, for example, are an important sourceof fee income for banks. Some of these activities have become commonpractice only relatively recently, and the data that would allow for the kindof long-run perspective that I wish to provide in this article are not readilyavailable. For this reason, I will not explicitly cover this aspect of the evolutionof banking in the recent past, but it should be kept in mind when interpretingthe trends in the income statement that I will discuss next.15
There are five main components of the income statement of commercialbanks: interest income and expense, non-interest income and expense, andloan loss provisions. Interest income is the result of all interest and dividendsearned by banks on interest-bearing assets (such as loans and leases). Interestexpense is the result of all interest paid to depositors and other creditors ofthe bank. Net interest income, then, is the difference between interest incomeand interest expense. Non-interest income includes fee income, gains on se-curities transactions, and all other income not originated in interest payments.Non-interest expense includes personnel compensation, legal expenses, officeoccupancy and equipment expense, and other expenses. Finally, provision forloan losses is the amount charged as operating expenses to provide an ade-quate reserve to cover anticipated losses in the loan portfolio. These chargesbecome part of the allowance for loan losses, a negative component on theasset side of the banks balance sheet, which is then used to charge off loansafter they become nonperforming.
15 For a thorough discussion of commercial banks’ off-balance-sheet activities, see Boyd andGertler (1993, 1994).

54 Federal Reserve Bank of Richmond Economic Quarterly
Income Statement- Net Income
- Net Interest Income- Interest Income- Interest Expense (–)
- Provisions for Loan Losses (–)- Non-interest Income- Non-interest Expense (–)
Note: The negative sign in parenthesis (-) indicates that the componentis subtracted when computing net income.
In the last ten years, the annual return on assets (ROA) at commercialbanks in the United States has been historically high: the average since 1993has been 1.15 percent, while from 1950 to 1985 the average was 0.72 percent.16
There are several possible factors that could explain this sustained change inlevel. One possibility is that there has been an increase in the efficiency withwhich banks manage their assets. (This change constitutes a movement fromthe interior of the set of feasible risk-return combinations toward the frontierof that set.)17 A second possibility is that banks are engaging in riskier (on-and off-balance-sheet) activities that are associated with a higher rate of return.(This change is a movement along the risk-return frontier of the feasible set.)
The evidence seems to indicate that the explanation for this increase inreturn must be a combination of the two possible causes. On the one hand,banks may be moving toward increasing efficiency. In Figure 5 we can see thatsince the beginning of the nineties, coinciding with the increase in ROA, theratio of non-interest expenses to total assets has been decreasing steadily. Thedecrease of total operational expenses relative to assets could be indicative ofan improvement in the efficiency level with which banks handle their assets.Another way of thinking about aggregate movements toward the risk-returnfrontier is to think that an increasing number of institutions are getting closerto implementing the current best managerial practices for banks. Berger andMester (2003) provide some evidence that seems to indicate that the averageinability of banks to adopt best practices has decreased during the 1990s (seetheir Table 3). On this same line of inquiry, Berger and Humphrey (1992)undertake a detailed analysis of the 1980s, a period of rising inefficiency dueto dispersion inside the best-practice frontier.
On the other hand, banks may be taking more risks. As we saw in theprevious section, the risk-adjusted assets base used for regulatory purposes has
16 Annual return on assets is defined as the ratio of annual net income and total averageassets. Since the banking industry experienced a generalized crisis from 1986 to 1992, those yearswere left out for the sake of long-run trend comparison.
17 Inefficiency in banking may originate not only in banks having higher resource cost thannecessary, but also in the fact that some banks may be holding a portfolio of assets that, conditionalupon risk, is dominated in rate of return by other feasible portfolios.

H. M. Ennis: Commercial Banking 55
Figure 5 Income Statement
Commercial Banks Income
Net Interest Income
Non-interest Expense
Non-interest Income
Net Income (ROA)
Source: Annual data from the FDIC-Insured Commercial Banks Table CB04.
been growing at a higher rate than unadjusted bank assets during the nineties.This fact implies that under the (imperfect) regulatory risk classification ofassets, banks are indeed taking on more risk. Another piece of evidence thatsupports this view is given in Figure 6, which shows both the evolution ofreturn on assets and charge-offs at commercial banks since 1970. We can seein the figure that, together with the increase in return on assets since 1993, thelevel of charge-offs as a proportion of loans remained relatively high comparedwith its historic level of around 0.3 percent. If we think that the charge-offsto loans ratio is positively correlated with the risk of the loan portfolio, thenwe can conclude that since 1993 both risk and return have increased in thebanking industry.18
A third possible explanation for the increase in the return on banks’activi-ties is based on the notion that the 1990s was a period of repeated innovationsin banking (such as credit scoring, widespread ATM networks, and many oth-ers). Early adopters of new technologies tend to earn supernormal profits for
18 Berger and Mester (2003) use the average standard deviation of annual return on assetsas a proxy for bank risk. They show that this indicator has actually been decreasing during thenineties, but, due to lack of data, they do not present estimates for the seventies and early eighties.

56 Federal Reserve Bank of Richmond Economic Quarterly
Figure 6 The Risk-Return Frontier
Return on Assets and Charge-offs
Net Income to Assets
Change-offs to Loans
Source: Annual data from the FDIC-Insured Commercial Banks Table CB04 and TableCB08.
some time until the technology becomes widely used by competitors. Re-peated innovations can then explain a long period of high returns like theone the banking industry experienced during the 1990s. Berger and Mester(2003) suggest this possibility but do not provide direct evidence supportingthe hypothesis.
In general, the evolution of the return on assets has been relatively uniformacross bank sizes. In particular, ROA decreased for all bank sizes during thesecond half of the eighties and the beginning of the nineties and then recoveredto levels of above 1 percent after 1993. The exception to this uniformity ofbehavior across sizes is the large variation in ROA during 1987–88 (see Figure5). These variations at the industry level mostly reflect the changes in ROA atbanks with more than $10 billion in assets (the largest category).19
With respect to the evolution of charge-offs across bank sizes, the story issomewhat different. While small banks (those with less than $100 million in
19 In 1987, provision for loan losses at large banks spiked up significantly (creating the oppo-site effect on ROA). This increase in provisions is mostly explained by the need to write off largeinternational loans to less developed countries that became nonperforming after the internationaldebt crisis of the eighties.

H. M. Ennis: Commercial Banking 57
Figure 7 Interest Income at Commercial Banks
Net Interest Margin (by Bank Asset Size)
Note: The net interest margin is the ratio of net interest income and interest earningassets. The data are for four different sizes of banks: banks with more that $10 billionin assets, banks with $1 billion to $10 billion in assets, banks with $100 million to$1 billion in assets, and banks with less than $100 million in assets. Source: FDICQuarterly Banking Profile. The data for 2003 are only for the first half of the year.
assets) had relatively high levels of charge-offs during the mid-eighties, thespike in the late eighties and early nineties (see Figure 6) is fully explained bythe increase in charge-offs at medium-to-large banks (those with more than $1billion in assets). Similarly, the increase in charge-offs during 2001 is mostlyconcentrated in these medium-to-large size banks. Overall, charge-offs tendto be fairly procyclical, but, again, the behavior across different sizes of banksis not very uniform. In particular, during the 2001 recession, the level of thecharge-off ratio at banks with less than $1 billion in assets does not show anysignificant increase.
The net interest margin is one of the most common indicators of prof-itability in traditional banking activities (that is, holding deposits and lending).This indicator results from expressing net interest income as a percentage of(average) interest-earning assets. Figure 7 shows that medium-to-large banksexperience a significant increase in the net interest margin at the beginning ofthe nineties. On average, net interest margins have been higher at all banks

58 Federal Reserve Bank of Richmond Economic Quarterly
Figure 8 Non-interest Income and Expense
100% -
90% -
80% -
70% -
60% -
50% -
40% -
30% -
20% -
10% -
0% - - 20
02
- - 2
00
0- - 1
99
8- - 1
99
6- - 1
99
4- - 1
99
2- - 1
99
0- - 1
98
8- - 1
98
6- - 1
98
4- - 1
98
2- - 1
98
0- - 1
97
8- - 1
97
6- - 1
97
4- - 1
97
2- - 1
97
0
A. Composition of Non-interest Income
Fee Income Other
100% -
90% -
80% -
70% -
60% -
50% -
40% -
30% -
20% -
10% -
0% - - 2002
- - 2
000
- - 1
998
- - 1
996
- - 1
994
- - 1
992
- - 1
990
- - 1
988
- - 1
986
- - 1
984
- - 1
982
- - 1
980
- - 1
978
- - 1
976
- - 1
974
- - 1
972
- - 1
970
B. Composition of Non-interest Expense
Salaries Occupancy Other
Note: Fee income represents the amount of all service charges on deposit accounts indomestic offices such as maintenance fees, activity charges, administrative charges, over-draft charges, and check certification charges. Other non-interest income includes: incomefrom fiduciary activities; gains, losses, and fees relating to foreign currency or foreignexchange transactions; gains, losses, and fees from assets held in trading accounts; netgains from the sale or disposition of loans, premises (including branches and offices)and fixed assets, and other real estate owned; all service charges, fees, and commissions(other than those relating to deposits in domestic offices); fees charged on bank-issuedcredit cards; net gains on futures and forward contracts; and other miscellaneous income.Source: Annual data from the FDIC-Insured Commercial Banks Table CB07.
during the nineties. These higher margins are consistent with an increase indefault and interest-rate risk at banks.20 Angbazo (1997) provides further evi-dence on this link between interest margins and risks at banks. He also showsthat off-balance-sheet activities tend to increase risk and interest rate marginsat banks.
Figure 8 shows the trends in the composition of non-interest income andexpenses. While non-interest income has increased substantially during thelast twenty years (see Figure 5), its composition has not changed much (seePanel A of Figure 8). In particular, income from fees on deposit accountshas been stable at around 20 percent of total non-interest income for a longtime. In summary, it is true that in the last twenty years fee income hasbeen increasing relative to total gross income at banks, but other non-interest
20 Interest rate risk is the exposure of a bank’s financial condition to adverse movements ininterest rates (see Basle Committee 1997).
H. M. Ennis: Commercial Banking 59
income has also become increasingly important.21 Boyd and Gertler (1994)suggest that the evolution of the relative contribution of other non-interestincome to total income is a good proxy for the increase in importance of off-balance-sheet activities at banks. In this respect, after growing steadily for thelast twenty years, other non-interest income has gone from representing lessthan 10 percent of bank income in the seventies to representing more than 25percent of such income today.
With respect to non-interest expense, there is a clear trend toward a lowercontribution of salaries and employee benefits to total non-interest expenses.This decrease is almost exactly matched by the increase in the proportion ofother expenses, while the contribution of occupancy expenses remains con-stant. In the last couple of decades there has been a tendency for banks to out-source employment-intensive activities to other affiliates of the bank holdingcompany or to service bureaus (Berger and Mester 2003). The cost of theseoutsourced activities becomes part of the “other” component of non-interestexpense at the same time that it reduces the “salaries” portion of total expense.
4. CONCLUSION
The banking trends reviewed in this article suggest some conclusions. First,even though commercial banking activities have been changing significantly,banks as a group are still a very important player in the financial markets ofthe U.S. economy. Second, banks do seem to be moving away from theirtraditional activities of handling deposits and providing loans to business, butthis trend is fairly gradual. Third, while banking activities have become moreprofitable in general, the evidence suggests that they have also become riskier.
Finally, as I suggested in the introduction, taking a long-run perspectivecan help to identify some patterns of the response of modern banking to eco-nomic slowdowns. Although a careful study of this issue was beyond thescope of this article (see Schuermann 2004), from the comparison of the datafrom 1990–91 and 2001, some regularities can be identified. For example,bank loans to businesses seem to be very procyclical, and both charge-offsand net interest margins seem to be relatively countercyclical.
21 For a detailed study of the evolution of banks’ retail fees during the nineties, see Hannan(2001).

60 Federal Reserve Bank of Richmond Economic Quarterly
REFERENCES
Angbazo, Lazarus. 1997. “Commercial Bank Net Interest Margins, DefaultRisk, Interest-Rate Risk, and Off-Balance Sheet Banking.” Journal ofBanking and Finance 21: 55–87.
Basel Committee on Banking Supervision. 1997. “Principles for theManagement of Interest Rate Risk.” Basel Committee Publications 29(September).
Berger, Allen N., and David B. Humphrey. 1992. “Measurement andEfficiency Issues in Commercial Banking.” In Output Measurement inthe Service Sectors. Ed. Zvi Griliches. Chicago: University of ChicagoPress: 245–79.
, and Loretta J. Mester. 2003. “Explaining the DramaticChanges in Performance of U.S. Banks: Technological Change,Deregulation, and Dynamic Changes in Competition.” Journal ofFinancial Intermediation 12: 57–95.
Broaddus, J. Alfred, Jr. 1998. “The Bank Merger Wave: Causes andConsequences.” Federal Reserve Bank of Richmond EconomicQuarterly 84 (Summer): 1–11.
Boyd, John H., and Mark Gertler. 1993. “U.S. Commercial Banking: Trends,Cycles, and Policy.” National Bureau of Economic ResearchMacroeconomic Annual: 319–68.
. 1994. “Are Banks Dead? Or Are the Reports GreatlyExaggerated?” Federal Reserve Bank of Minneapolis Quarterly Review18 (Summer): 2–23.
Carlson, Mark, and Roberto Perli. 2003. “Profits and Balance SheetDevelopments at U.S. Commercial Banks in 2002.” Federal ReserveBulletin (June): 243–70.
Ennis, Huberto M. 2001. “On the Size Distribution of Banks.” FederalReserve Bank of Richmond Economic Quarterly 87 (Fall): 1–25.
Estrella, Arturo, Sangkyun Park, and Stavros Peristiani. 2000. “CapitalRatios as Predictors of Bank Failures.” Federal Reserve Bank of NewYork Economic Policy Review (July): 33–52.
Genay, Hesna. 2000. “Recent Trends in Deposit and Loan Growth:Implications for Small and Large Banks.” Chicago Fed Letter 160(December).

H. M. Ennis: Commercial Banking 61
Green, Edward J., and Soo Nam Oh. 1991. “Can a ‘Credit Crunch’ BeEfficient?” Federal Reserve Bank of Minneapolis Quarterly Review 15(Fall): 3–16.
Hannan, Timothy H. 2001. “Retail Fees of Depository Institutions,1994–99.” Federal Reserve Bulletin (January): 1–11.
Krainer, John. 2001. “Retail Sweeps and Reserves.” Federal Reserve Bankof San Francisco Economic Letter (January).
Rhoades, Stephen A. 2000. “Bank Mergers and Banking Structure in theUnited States, 1980–98.” Board of Governors of the Federal ReserveSystem Staff Study 174 (August).
Schuermann, Til. 2004. “Why Were Banks Better Off in the 2001Recession?” Federal Reserve Bank of New York Current Issues inEconomics and Finance 10 (January).
Walter, John R. 1996. “Firewalls.” Federal Reserve Bank of RichmondEconomic Quarterly 82 (Fall): 15–39.
Weinberg, John A. 1995. “Cycles in Lending Standards?” Federal ReserveBank of Richmond Economic Quarterly 81 (Summer): 1–18.