some key variables affecting liner shipping costsmartrans.org/documents/2009/prt/trb_paper...
TRANSCRIPT

Gkonis and Psaraftis Some key variables affecting liner shipping costs
1
Some key variables affecting liner shipping costs 1 2 Konstantinos G. Gkonis 3 Harilaos N. Psaraftis1 4 Laboratory for Maritime Transport 5 School of Naval Architecture and Marine Engineering 6 National Technical University of Athens 7 Athens, Greece 8 9 Abstract 10 11 The liner shipping sector is one of the most dynamic segments of ocean transportation, and one 12 that is also inextricably connected to the port and terminal sector and to land transport modes 13 due to its intermodal nature. This paper takes stock at some published work on liner shipping 14 costs, and tries to identify key variables that affect these costs and how each of these variables 15 impacts these costs. The impacts of ship size, speed, port time, route distance and bunker costs 16 are presented and discussed. 17
1. Introduction 18 19 It is fair to say that the overall literature on liner shipping is immense, covering a very broad 20 array of topics, ranging from the economics of the liner market to engineering aspects of 21 containership design, from liner network design to legal-regulatory aspects of the market, from 22 ship routing and scheduling to safety and security, and from containership air emissions to port 23 and terminal management, to name just a few. Clearly the liner shipping sector is one of the most 24 dynamic segments of ocean transportation, and one that is also inextricably connected to the port 25 and terminal sector and to land transport modes due to its intermodal nature. 26 27 This paper takes a look at liner shipping costs, as examined in some selected key references that 28 study this important attribute of the overall liner shipping operation. With the design size of 29 containerships already reaching the 15,000 TEU scale, and with sizes above 20,000 TEU already 30 being planned by major container lines, economies of scale are likely to be an important cost 31 factor in the future. Indeed, economies of scale suggest that a larger ship is cheaper per ton to 32 build, and running costs per ton also fall. At the end, the operating costs per container-mile 33 decrease (reduction of unit costs of container carriage). However, other cost components, 34 especially related to time spent in ports, may have the opposite trend, and thus it is not clear that 35 the total cost function is a monotonically decreasing function of ship size. Besides, other factors 36 such as speed, network design and the way a fleet is utilized may be just as important as size. It 37 should be clarified that due to paper size limitations, the review of literature connected with 38 operations research - optimization methods in liner shipping, is outside the scope of this paper, 39 even though there is an obvious ‘operational’ connection to the topic presented here. 40 41
1 Corresponding author: [email protected]

Gkonis and Psaraftis Some key variables affecting liner shipping costs
2
The rest of this paper is organized as follows. Section 2 starts with the topic of economies of 1 size. Section 3 examines the effect of port time, speed, and route distance and Section 4 2 investigates the impact of bunker costs. Section 5 presents the conclusions of the paper. 3 4 2. Economies of size 5 6 One can begin by citing the seminal work of Gilman (1999) and of Jansson and Shneerson 7 (1982), among others, on the topic of economies of size in container transport. According to Lim 8 (1994), the “economies of size” are measured by comparing unit earnings and unit costs for 9 different vessel sizes. Also, the distortions of the hypothesis that “larger is better” by certain 10 other factors were examined, such as the vessel's purchase price, the average freight rate level, 11 average voyage lengths for the trade, achieved load factors, and accounting procedures. 12 13 The Charter Base (CB) and Hire Base (HB) were used, the CB as a revenue index and the HB as 14 an expense index. The CB is the contribution margin (or marginal income) of a vessel per day for 15 a specific voyage. The contribution margin is equal to revenue minus variable expenses. CB is 16 calculated by subtracting variable operation costs from freight revenues and dividing the 17 difference by operation days. In this paper a further calculation of CB per TEU was made for 18 selected vessels. 19 20 CB: Freight Revenue - Variable Operation Costs (cargo related expenses + navigation expenses) 21 = Contribution Margin / Operation Days 22 23 HB reflects the daily costs allocated to the fully-manned ship whether in revenue-earning 24 operation or not. The expense items considered are crew and vessel expenses, and various 25 overheads such as administrative, facility and equipment, and various non-operation expenses 26 borne by the shipowner. The HB may be calculated by dividing total fixed costs (running costs + 27 capital costs + overhead) by operation days. 28 29 HB = [Fixed Costs (i.e. ship expenses + crew expenses + insurance + depreciation + overhead)] / 30 Operation Days 31 32 HB per TEU was used. If CB is higher than HB, the operation will be profitable. The examined 33 hypothesis is that HB/TEU decreases with increments of vessel size. 34 35 The operational performance of different size ocean container ships on different routes was 36 examined for a certain year. Details of freight revenue, cargo expenses, navigation expenses, 37 ship expenses, overhead were collected. Proportions of various expenses to total expenses were 38 also estimated. The considered cost structure of container shipping is represented in Table 1. 39 40 HB/TEU data did not support the hypothesis that unit costs necessarily decrease with increments 41 of vessel size. This implied that there are other components affecting unit costs and that ship size 42 is only one possible explanatory factor. Another conclusion reached was that it is desirable to use 43 container ships of uniform size on particular routes. 44 45

Gkonis and Psaraftis Some key variables affecting liner shipping costs
3
Another indicator used was the cost per TEU per mile carried. The cost per TEU-mile can be 1 calculated by dividing total costs by total amount of transport service produced during a specific 2 period of time. The total amount of transport service was calculated by multiplying total 3 navigated miles by the total number of containers a ship carried for a specific period of time. No 4 empirical evidence suggested that TEU-mile cost decreases as ship size increases. 5 6 The final conclusion was that the economies of container ship voyages depend on many factors 7 unrelated to size; for instance, on route characteristics, accounting practices, prevailing level of 8 freight rates, load factors, operation days and the shipbuilding market. Especially, the unit cost of 9 a vessel may be strongly biased by the ship's purchase price. Scale economies in the bulk trades, 10 especially the tanker trades, is much more dramatic and evident than in the container trades. 11 12 Table 1: Cost structure of container shipping (adapted from Lim, 1994) 13
Variable costs Cargo-related expenses
Cargo expenses: CFS charges (stuffing, stripping), measuring/weighing, tallying, cargo inspection, customs examination, documentation, non-containerized / overheight / overwidth / dangerous cargo surcharge, reefer cargo expenses (pre-trip inspection, pre-cooling, monitoring, storage), etc.
Terminal Handling Charges (THS): loading / unloading / receiving / delivery (lift onto chassis for empty despatch, lift off from chassis for receiving outbound load, load into vessel from stacking area for outbound cargo and discharge from vessel into stacking area, lift onto chassis for delivery, lift off from chassis for empty return for outbound cargo), shifting (from cell to cell, unload on the terminal and reload on the same vessel), transshipment (unload on the terminal and reload on another vessel on the same terminal), storage of full and empty container, stevedorers or equipments stand-by charge, overtime surcharge, etc.
Haulages: railroad charge, rail ramp fee, inland depot charge, inland transportation, local drayage, port equalization, port shuttle, feeder charge, etc
One-way short-term lease for container, chassis and trailer. Navigation expenses Port charges: pilotage, towage, dockage, wharfage, harbour /
tonnage / light / buoy / anchorage dues, mooring / unmooring and running lines, customs/quarantine fee, watchman / agency / cana1 fee, etc.
Bunker expenses: fuel and marine diesel oil. Fixed costs (running costs and capital costs) Crew expenses: wages, overtime, pensions, accident / sickness
insurance, traveling / repatriation, provisions, victualling and cabin stores, etc.
Vessel expenses: stores / spares, lubricants, maintenance / minor repair, annual survey, fresh water, communication charge, etc. (c) Insurance: hull / machinery, war risks, freight / demurrage

Gkonis and Psaraftis Some key variables affecting liner shipping costs
4
defence, P&I, other marine risks, etc. Depreciations: ship, container, chassis, trailer and other container
related equipment, terminal property and equipment, etc. Amortization for long-term terminal, container, chassis and
trailer leaseholds and leaseholds improvements, etc. Overhead Administrative expenses: compensation of officers and directors,
salaries and wages of employees, fringe benefits, rental expenses, office expenses, communication expenses, dues and subscription, travel expenses, advertising, entertainment and solicitation, legal fees, taxes, etc.
Non-operating revenues: interest income, dividend income, revenue from non-shipping operations, foreign exchange gains, income from affiliated companies, etc.
Non-operating expenses: interest expenses, foreign exchange losses, donations and contributions, miscellaneous losses, etc.
1 However, as for example Graham (1994) notes, one should be careful to omit revenue and cost 2 items which are not a function of ship size from a study designed to look at the economic effects 3 on service profitability of variations in ship size. For example, not all land-side costs should be 4 included and neither all kind of administrative costs. 5 6 Davies (1983) notes that in liner shipping the short-run may be defined as the period of time 7 within which it is not possible to vary either the size of the fleet operated by a company or the 8 frequency of service. Once a schedule has been agreed upon, cost items such as fuel, crew 9 wages, maintenance and repair (regarded as variable costs in other industries) become fixed, 10 which cannot be avoided in the short-run planning horizon. Variable costs, that change directly 11 with the magnitude of cargo carried, are associated with handling, loading and stowing cargo. 12 13 Stopford (2004) identifies six components of liner service costs: service schedule, ship costs, 14 port charges, container operations, container costs, and administration. Indicative figures for 15 these costs and for several ship sizes are provided in Table 2 that follows. 16 17 Regarding the service schedule (1st component), key decisions concern the service frequency, the 18 number of port calls and the size of the ships to be used. The ship cost (2nd component) is usually 19 expressed in terms of unit slot cost (e.g. cost of transport for 1 TEU per day). Operating, capital 20 and fuel costs are important elements. Since bunker costs are substantially higher for container 21 ships than bulk vessels, due to their higher speed, fuel consumption is a particularly important 22 variable. Economies of scale have an impact on unit slot cost. Port charges (3rd component) are 23 beyond the control of the shipowner and vary around the world. As they depend on the ship’s 24 tonnage, economies of scale are again important. Container operations (4th component) costs 25 depend on the mix of container types, container turnaround time and empty containers that must 26 be repositioned inter-regionally. Container costs (5th component) include daily cost, 27 maintenance, repair, and handling, among other. Administration costs (5th component) are related 28 to management, logistics, financial, and commercial aspects of the business. 29 30

Gkonis and Psaraftis Some key variables affecting liner shipping costs
5
Table 2: Building blocks of liner costs according to Stopford (2004) 1
2 3

Gkonis and Psaraftis Some key variables affecting liner shipping costs
6
In Table 3, Stopford (2004) combined the above cost information with revenue to determine the 1 financial performance of a liner service. Cost information are summarized into four sections, the 2 fixed cost of the ships (section 1), the cost of the containers (section 2), the administration costs 3 (section 3) and the cargo handling and onward transport cost (section 4). From these items, the 4 voyage cost per TEU is calculated in section 5. The voyage revenue (section 6) is then added to 5 calculate the voyage profit or loss (section 7). 6 7 Table 3: Liner service cash flows example according to Stopford (2004) 8
9 10

Gkonis and Psaraftis Some key variables affecting liner shipping costs
7
As different size ships are considered, it is shown that the effects of economies of scale are 1 especially important for the fixed costs of the ship shown in section 1, where the total cost of the 2 6,500 TEU ship is almost three times the cost of the 1,200 ship, but the cargo volume is almost 3 six times as great. As the size of ship increases, the fixed cost component falls from 42% to 26%. 4 The other cost components do not especially benefit from economies of scale. In section 5, the 5 average cost per TEU falls from USD771 for the 1,200 TEU vessel to USD554 for the 6,500 6 TEU vessel. In the end, and at the considered cargo levels, the 1,200 TEU vessel makes a profit 7 of USD25,000, a 2% return, while the 6,500 TEU vessel makes a profit of USD2.53 million, a 8 return of 29%. This example outlines the rationale behind the liner companies ordering bigger 9 ships. 10 11 3. The effect of port time, speed, and route distance 12 13 Cullinane and Khanna (2000) develop a model which quantifies the economies of scale in 14 operating large containerships. They note, as widely recognized, that costs at sea per tonne or per 15 TEU will decrease as ship size increases. However, the overall efficiency of a ship depends 16 ultimately on the total time the ship takes to complete a voyage, because the time spent in port is 17 unavoidable in the sense that cargo will need to be loaded and unloaded. So, there is a trade-off 18 between the positive returns earned at sea and the negative returns accruing while in port (during 19 the handling operation). Their model attempts to quantify this trade-off by considering only those 20 costs which are a function of ship size. 21 22 Given the size of the investment, the treatment of capital cost in the model is also important. To 23 ensure that economies of scale relative to the building cost are introduced to their analysis, a 24 submodel of newbuilding prices is used, which is functionally dependent on ship size. 25 Newbuilding contract prices are converted into an annual capital charge by applying a capital 26 recovery factor which assumes that the life of the vessel is 20 years, the interest rate is 10% and 27 the residual value is 0. 28 29 The time taken on a voyage and the distance travelled on that voyage are the two causal factors 30 which have a strong effect on costs. Their approach involves mainly three submodels, which 31 yield the following outputs: the Daily Fixed Cost per TEU; the Cost per TEU-Mile; the Total 32 Shipping Cost per TEU (see Figure 1). 33 34 The first submodel analyses cost variability in response to changes in time to derive a standard 35 cost per TEU per unit time. This is an input to the second submodel which assesses cost 36 variability in relation to distance travelled. The third submodel combines the output from both 37 the previous submodels yielding a composite picture of the total cost of a voyage. 38 39

Gkonis and Psaraftis Some key variables affecting liner shipping costs
8
1 Figure 1: Representation of the aggregate model (as adapted in Ng and Kee, 2008) 2 3 Cost per TEU-Mile and ship speeds for different ship sizes are shown in Figure 2 which 4 illustrates that, besides being more economical, larger ships are also faster and capable, 5 therefore, of providing a better service and better utilisation of assets. 6 7
8 Figure 2: Containership size vs. design speed and cost per TEU-mile 9 (Cullinane and Khanna, 2000) 10 11

Gkonis and Psaraftis Some key variables affecting liner shipping costs
9
The cost of time in port expressed in USD per TEU per voyage is given in Figure 3. This cost 1 has been calculated as the product of the estimated number of days spent in port during each of 2 the voyage scenarios and the daily cost. Port time depends on total cargo exchange, crane 3 density, average crane productivity, non-productive time in port, working time in port, etc. The 4 daily cost of ship’s time varies with factors such as capital cost, repairs and maintenance, 5 insurance, crew, diesel oil consumption and price, etc. 6 7 Dramatic improvements in port productivity are related to a significant improvement in average 8 crane productivity in recent years. Also, as ship size increases, there is an increase in the average 9 number of cranes employed on the ship. 10 11
12 Figure 3: Containership cost of time in port per voyage (Cullinane and Khanna, 2000) 13 14 Three main East-West routes were considered, i.e. Europe-Far East, trans-Pacific and trans-15 Atlantic. The resulting Total Shipping Cost per TEU for each of these three sample routes are 16 shown in Figure 4. For all three sample route lengths, the results suggest that economies of ship 17 size are enjoyed until about 8000 TEU. Also, for these three voyage lengths, the diseconomies of 18 ship size in port are outweighed by economies of size at sea. 19 20 Results also suggested that the benefits from scale economies in ship size decline as route 21 lengths shorten. Figure 4 shows that the shorter the route length, the flatter is the line graph 22 showing Total Shipping Cost per TEU. This implies that the economies of ship size are of 23 greater benefit on longer routes. 24 25

Gkonis and Psaraftis Some key variables affecting liner shipping costs
10
1 Figure 4: Distance comparison of total shipping costs per TEU 2 (Cullinane and Khanna, 2000) 3 4 Figure 5 graphically illustrates the decline in positive returns to scale as ship size and route 5 length increase. The deployment of large containerships is likely to depend most crucially on 6 voyage distance. 7
8 Figure 5: Comparison of economies of scale and route length 9 (Cullinane and Khanna, 2000) 10 11 Ting and Tzeng (2003) consider the cost items and categories that are useful in liner shipping 12 route planning. Voyage fixed costs and freight variable costs need to be estimated, in order to 13 conduct a profitability analysis 14 15 Voyage fixed costs are constant regardless of the volume of freight. These can be analysed on 16 one round-trip voyage basis, and include four major items: vessel costs, port charges, bunker 17 costs and equipment costs. 18 19 Vessel costs (of a carriers’ own vessels) include: (1) Crew costs: crew wages, provisions, health 20 insurance and other crew-related expenses; (2) Vessel maintenance costs: inspections, repairs, 21
Gkonis and Psaraftis Some key variables affecting liner shipping costs
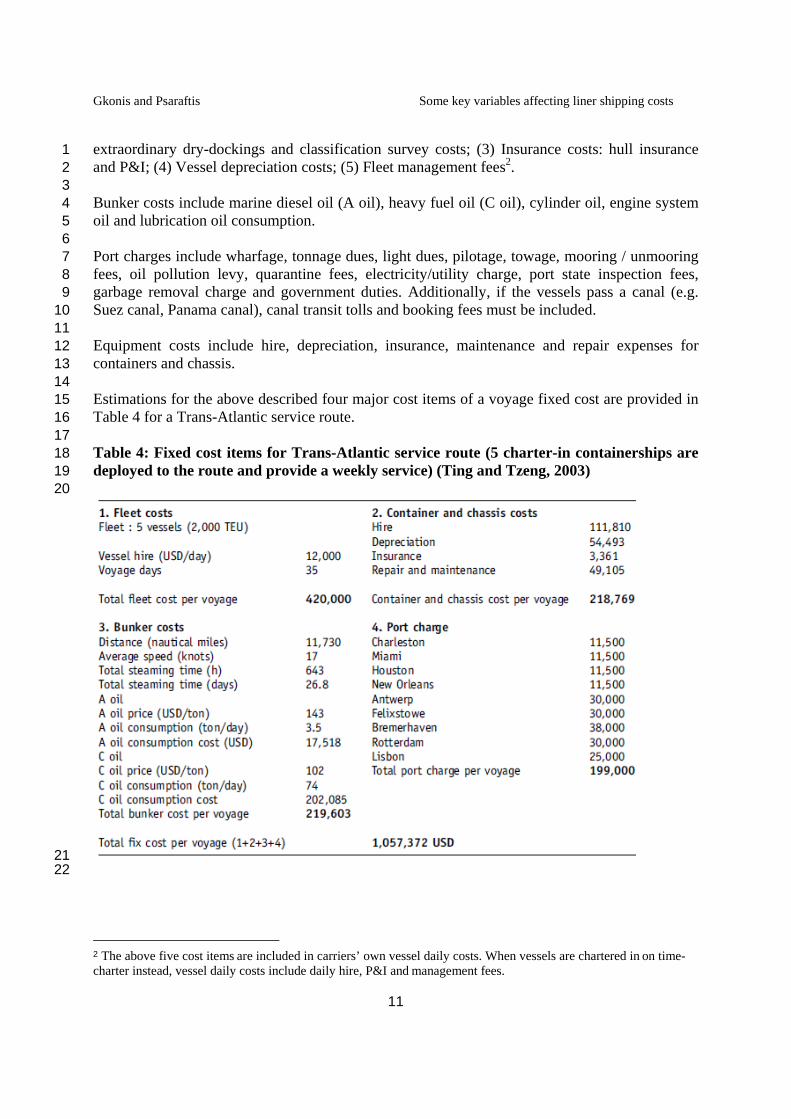
11
extraordinary dry-dockings and classification survey costs; (3) Insurance costs: hull insurance 1 and P&I; (4) Vessel depreciation costs; (5) Fleet management fees2. 2 3 Bunker costs include marine diesel oil (A oil), heavy fuel oil (C oil), cylinder oil, engine system 4 oil and lubrication oil consumption. 5 6 Port charges include wharfage, tonnage dues, light dues, pilotage, towage, mooring / unmooring 7 fees, oil pollution levy, quarantine fees, electricity/utility charge, port state inspection fees, 8 garbage removal charge and government duties. Additionally, if the vessels pass a canal (e.g. 9 Suez canal, Panama canal), canal transit tolls and booking fees must be included. 10 11 Equipment costs include hire, depreciation, insurance, maintenance and repair expenses for 12 containers and chassis. 13 14 Estimations for the above described four major cost items of a voyage fixed cost are provided in 15 Table 4 for a Trans-Atlantic service route. 16 17 Table 4: Fixed cost items for Trans-Atlantic service route (5 charter-in containerships are 18 deployed to the route and provide a weekly service) (Ting and Tzeng, 2003) 19 20
21 22
2 The above five cost items are included in carriers’ own vessel daily costs. When vessels are chartered in on time-charter instead, vessel daily costs include daily hire, P&I and management fees.

Gkonis and Psaraftis Some key variables affecting liner shipping costs
12
On the other hand, variable costs are directly related to the volume of freight, and include six 1 major items: (1) feeder costs; (2) trailer/railway costs; (3) container handling costs; (4) tally 2 costs; (5) container management and repositioning costs; (6) terminal stowage costs. 3 4 Estimations for these variable cost items are provided in Table 5 for the same Trans-Atlantic 5 service route. 6 7 Table 5: Variable cost items for Trans-Atlantic service route (due to transshipment pattern 8 differences between east-bound and west-bound voyages, variable costs are estimated 9 separately for each direction) (Ting and Tzeng, 2003) 10 11
12 13 Song et al. (2005) present a model that attempts to reproduce the overall incomes, costs, and 14 container movement patterns for the global container-shipping network. They collected and 15 adjusted realistic data in order to model the global patterns for the year 2002. 16 17 A cost model was adopted to calculate the vessel running cost. This included the bunker cost, 18 auxiliary cost, lube cost, capital cost, crew cost, insurance cost, maintenance cost, box cost and 19 port cost. The port cost was composed of three parts: stevedoring (lifting) charge, fixed charge 20 per vessel call, and vessel capacity-related due. The stevedoring charge was assumed to be $100 21 per lift, the fixed fee $1500 per vessel call and $1 per TEU for vessel capacity related due. A 22 load factor of 0.8 was assumed for all services. The shipping cost (freight rate) that a shipping 23 line charged a shipper was assumed to be the vessel running cost multiplied by a profit margin 24 ratio. A ratio of 2.0 was used, equivalent to an overhead cost of 100%. This factor was utilized to 25 reflect the missing costs such as management costs. 26 27 The results on incomes, costs and container movement patterns (including fleet capacity, total 28 box moves carried, total transhipment moves, port fixed cost, port lifting cost, total running cost, 29 total income and utilization) for the ten largest shipping lines by vessel fleet capacity are given in 30 Table 6. The port fixed cost is the cost that the shipping line must pay to ports even if there are 31 no containers lifted. The port lifting cost is proportional to the total number of lifts 32 (loads/unloads) at ports. Total cost represents the vessel running cost including port dues. 33 34 Although the proposed results of this paper are subject to the assumptions and limitations of the 35 model, as well as the use of sufficiently realistic input data, they are provided here as 36 approximate values representing cost aspects of the container shipping market. 37

Gkonis and Psaraftis Some key variables affecting liner shipping costs
13
Table 6: Incomes, costs and movement patterns for the top ten shipping lines by capacity 1 (Song et al., 2005) 2 3
4 5 Some additional estimations of container ships’ annual operating costs are provided in Table 7. 6 7 Table 7: Estimations of container ships annual operating costs (Youroukos, 2007) 8 9
10 11 Ng and Kee (2008) place their focus on liner feeder routes, which are also important components 12 in a hub-and-spoke system, while studies on optimal ship size mainly refer to major inter-13 continental trunk liner routes. They make a literature review investigating different cost 14 components of a containership, in order to assess economies of scale (which suggest that a lower 15 unit cost can be achieved when more units of a particular good/service are produced on a bigger 16 scale with less input costs). 17 18

Gkonis and Psaraftis Some key variables affecting liner shipping costs
14
Figure 6 displays the cost structure of a hypothetical ship with a breakdown in variable and fixed 1 costs, depending on whether an item varies with operational level. Generally speaking, in the 2 short run3, capital and repayment costs, tax, depreciation, labour and insurance are considered 3 fixed, while repairs, maintenance and daily running costs are partly fixed. Administrative 4 expenses have both fixed and variable components. Additional crew expenses are classified as 5 partially variable while bunkers, stevedoring, port and canal dues are classified as variable costs. 6 The operational (running) cost would comprise repairs and maintenance, daily running cost, 7 administrative cost and additional crew expenses. 8 9
10 Figure 6: Cost structure of a hypothetical ship (McConville, 1999) 11 12 Coming to the specific case of a containership, Table 8 shows a possible cost structure with a 13 breakdown in operation and fixed costs. 14 15 Table 8: Cost structure of a containership (Branch, 1998) 16
17 18
3 In the long term, fixed costs would become variable costs and so the limitation of timeframe is crucial in determining what costs should be categorized as fixed costs within a certain time period.

Gkonis and Psaraftis Some key variables affecting liner shipping costs
15
While bigger ships may enjoy lower unit cost, they need to tackle additional challenges. Big 1 ships are often harder to handle due to more demanding requests, in terms of both money and 2 time, related to navigation channels along rivers/canals, port’s berthing draught, port access 3 channels and cargo handling facilities. The major weakness of only analysing ship-related cost is 4 that such an approach neglects the potential externalities imposed on other components of the 5 logistical supply chain. Figure 7 displays a U-shaped average cost curve, when both ship and 6 non-ship-related costs are included in the analysis. 7 8
9 Figure 7: The total shipping cost including ship and non-ship related components (adapted 10 from Kendall, 1972) 11 12 4. The effect of bunker costs 13 14 Notteboom and Vernimmen (2008) examine the bunker fuel cost, which is a considerable 15 expense in liner shipping. Their paper assesses how shipping lines have adapted their liner 16 service schedules (in terms of commercial speed, number of vessels deployed per loop, etc.) to 17 deal with increased bunker costs. Bunker prices constantly fluctuate due to market forces and the 18 cost of crude oil. Increasing bunker prices generally affect earnings negatively. 19 20 Shipping lines have attempted to pass the costs on to the customer through variable charges. For 21 example, an increasing bunker price, especially in the short term, is (only partially) compensated 22 through surcharges to the freight rates via the so-called Bunker Adjustment Factor (BAF). All 23 freight rates in container shipping are exclusive of BAF. The BAF may be adjusted in response 24 to fluctuations in bunker oil prices and rate of exchange (USD) and it is applied to changes above 25 certain trade specific levels. The policy with respect to BAF changes depending upon how a 26 company or liner conference decides to apply the BAF. 27 28 About 80% of the total bunker fuel relates to heavy fuel oil. High sulphur crude will result in a 29 high sulphur heavy fuel oil HFO, referred to as HSFO. Sulphur emission controls and 30 environmental considerations encourage a gradual shift from heavy fuel to bunkers with a low 31

Gkonis and Psaraftis Some key variables affecting liner shipping costs
16
sulphur content, the so-called low sulphur fuel oil (LSFO) 4. Other bunker fuels than the HFO are 1 the marine diesel oil (MDO) and the marine gas oil (MGO). 2 3 The shift from HSFO to LSFO has implications on ship operating costs. Where both low and 4 high sulphur distillates are available, there is a premium of around USD 10 to 15 per metric ton 5 on the low sulphur fuel. This has made some shipping lines impose a new kind of surcharge, i.e. 6 the ‘low sulphur surcharge’ that ranges between USD 5 and 10 per TEU. 7 8 Figure 8 depicts the relation between service speed and fuel consumption for four types of 9 container vessels and nine different service speeds. This figure indicates that an increase in 10 service speed with just a couple of knots already results in a dramatic increase of fuel 11 consumption. With bunker prices of about USD 450 per ton, this translates into a daily cost 12 increase of USD 36,000. For a 12,500–13,000 TEU container vessel, the daily cost increase 13 would even amount to USD 51,750 when service speed is increased from 23 to 26 knots. 14 15
16 Figure 8: Daily fuel consumption for four types of container ships at different service 17 speeds (Notteboom and Vernimmen, 2008) 18 19 Table 9 gives an indication of the daily fuel costs at sea. The scale increases in vessel size have 20 resulted in lower bunker costs per slot. At a commercial speed of 22 knots, the bunker cost per 21 day on a 5000 TEU vessel typically amounts to USD 8.7 per TEU-slot, while the bunker costs 22 for a 12.000 TEU vessel reach only USD 5.4 per TEU-slot or a cost saving of 39%. 23 24
4 See, for instance, latest amendment of Annex VI of MARPOL, adopted at IMO’ MEPC 58 (London, October 2008), stipulating drastic reductions in the sulphur content of marine fuels.

Gkonis and Psaraftis Some key variables affecting liner shipping costs
17
Table 9: Fuel costs at sea for three types of container vessels and different service speeds 1 (USD per day) at end-July 2006 bunker prices (Notteboom and Vernimmen, 2008) 2 3
4 5 Moreover, shipowners have responded to rising fuel bills with a variety of cost-cutting measures 6 which have included lower vessel speeds and adding new ships to service routes to allow more 7 efficient scheduling. The global drive to reduce ship air emissions, which are directly 8 proportional to the amount of fuel burned, also contributes to this goal (more on this later). 9 10 For the purpose of their paper, the authors considered a typical liner service on the North 11 Europe–East Asia trade. They used a cost model to simulate the impact of bunker cost changes 12 on the operational costs of liner services. Their cost model consisted of the following cost 13 components (incorporates maritime-related costs and not inland transport costs): 14 15
• Ship costs (including the vessel operating costs, vessel capital costs, bunker costs and 16 port charges - excluding cargo handling), 17
• Container costs (including the cost of supplying containers, container repair and 18 maintenance costs and reefer costs), 19
• Administrative costs, 20 • Cargo handling costs (including terminal handling costs and cargo claims). 21
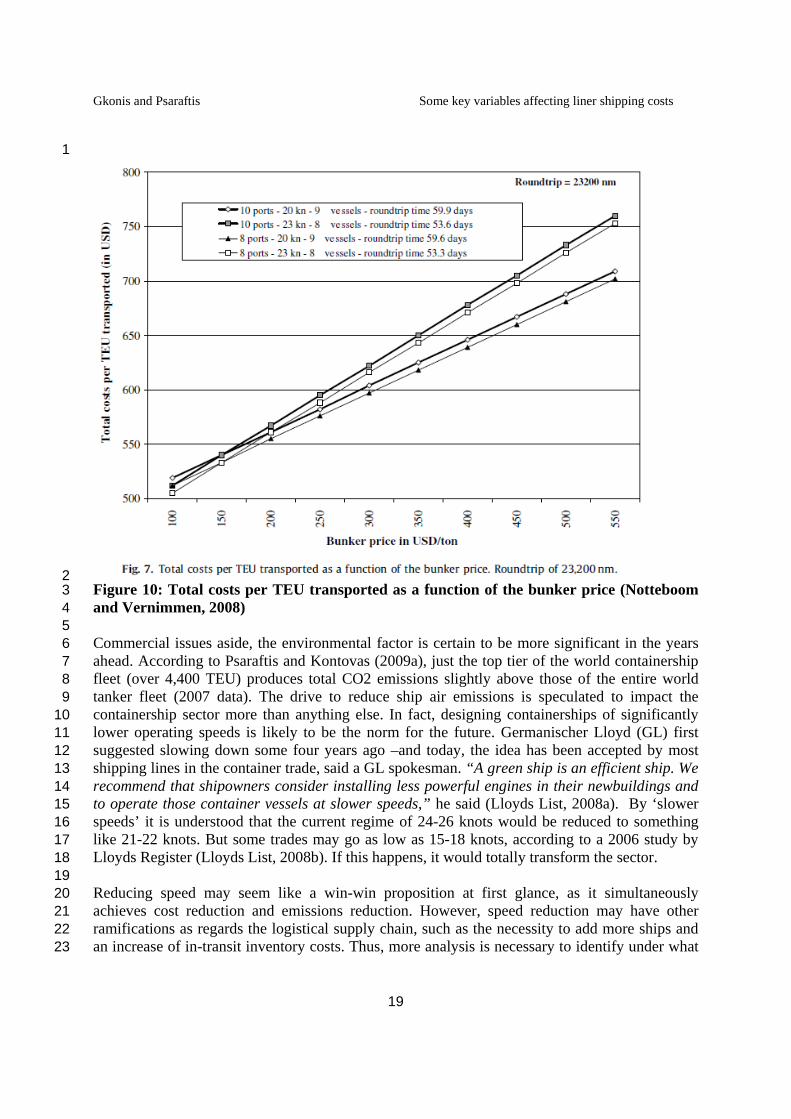
22 Table 10 summarizes the results of the cost model. For example, container vessels sailing at 24 23 knots incur a bunker cost that represents nearly 60% of the total ship costs and up to 40% of the 24 total costs (at a bunker cost of USD 450 per ton). At a bunker cost of USD 250 per ton these 25 figures were 44% and 28%, respectively. 26 27 Figures 9 and 10 provide more details on the relationship between bunker price per ton and total 28 liner service costs and costs per TEU transported respectively for the considered liner service. 29 The figures suggest for example that it is interesting for a shipping line to shift from eight to nine 30 vessels and reduce speed from 23 to 20 knots when the fuel price is higher than around USD 150 31 per ton. 32 33

Gkonis and Psaraftis Some key variables affecting liner shipping costs
18
Table 10: Cost comparison for different vessel sizes, bunker costs and vessel speed-cost in 1 USD per TEU transported (port-to-port basis) (Notteboom and Vernimmen, 2008) 2 3
4 5
6 Figure 9: Total liner service costs as a function of the bunker price. Roundtrip of 23,200 7 nm and 10 ports of call (Notteboom and Vernimmen, 2008) 8
Gkonis and Psaraftis Some key variables affecting liner shipping costs
19
1
2 Figure 10: Total costs per TEU transported as a function of the bunker price (Notteboom 3 and Vernimmen, 2008) 4 5 Commercial issues aside, the environmental factor is certain to be more significant in the years 6 ahead. According to Psaraftis and Kontovas (2009a), just the top tier of the world containership 7 fleet (over 4,400 TEU) produces total CO2 emissions slightly above those of the entire world 8 tanker fleet (2007 data). The drive to reduce ship air emissions is speculated to impact the 9 containership sector more than anything else. In fact, designing containerships of significantly 10 lower operating speeds is likely to be the norm for the future. Germanischer Lloyd (GL) first 11 suggested slowing down some four years ago –and today, the idea has been accepted by most 12 shipping lines in the container trade, said a GL spokesman. “A green ship is an efficient ship. We 13 recommend that shipowners consider installing less powerful engines in their newbuildings and 14 to operate those container vessels at slower speeds,” he said (Lloyds List, 2008a). By ‘slower 15 speeds’ it is understood that the current regime of 24-26 knots would be reduced to something 16 like 21-22 knots. But some trades may go as low as 15-18 knots, according to a 2006 study by 17 Lloyds Register (Lloyds List, 2008b). If this happens, it would totally transform the sector. 18 19 Reducing speed may seem like a win-win proposition at first glance, as it simultaneously 20 achieves cost reduction and emissions reduction. However, speed reduction may have other 21 ramifications as regards the logistical supply chain, such as the necessity to add more ships and 22 an increase of in-transit inventory costs. Thus, more analysis is necessary to identify under what 23

Gkonis and Psaraftis Some key variables affecting liner shipping costs
20
circumstances speed reduction is advisable (for an analysis of some of the relevant trade-offs see 1 Psaraftis and Kontovas (2009b)). 2 3 5. Conclusions 4 5 This paper has discussed various issues connected with liner shipping costs, as viewed through 6 some selected references. Through that literature we have also tried to identify the most 7 important variables that affect these costs, mainly related to economies of size, the effect of port 8 time, speed and route distance, and bunker costs. 9 10 The conclusions reached in the above-mentioned studies have suggested that empirical data do 11 not support the hypothesis that unit costs necessarily decrease with increments of vessel size, nor 12 that TEU-mile cost decreases as ship size increases. Instead, the economies of container ship 13 voyages appear to depend on many factors unrelated to size, such as route characteristics, freight 14 rates, load factors, and the shipbuilding market. However, it is rather evident that the effects of 15 economies of scale are especially important for the fixed costs of the ship. 16 17 Larger ships are also faster and capable, therefore, of providing a better service and better 18 utilisation of assets. On the negative side, larger ships need to tackle additional challenges. They 19 are often harder to handle due to more demanding requests, in terms of both money and time, 20 related to navigation channels along rivers/canals, port’s berthing draught, port access channels 21 and cargo handling facilities. The major weakness of only analysing ship-related cost is that such 22 an approach neglects the potential externalities imposed on other components of the logistical 23 supply chain. 24 25 Other conclusions suggested that the overall efficiency of a ship depends ultimately on the total 26 time the ship takes to complete a voyage. So, there is a trade-off between the positive returns 27 earned at sea and the negative returns while in port. Port time depends on total cargo exchange, 28 crane density, average crane productivity, non-productive time in port, working time in port, etc. 29 Dramatic improvements in port productivity have been experienced in recent years. Empirical 30 results suggested that economies of ship size are enjoyed until about 8,000 TEU, while within 31 certain voyage lengths, the diseconomies of ship size in port are outweighed by economies of 32 size at sea. Indeed, results also suggested that the benefits from scale economies in ship size 33 decline as route lengths shorten. Therefore, the deployment of large containerships is likely to 34 depend most crucially on voyage distance. 35 36 Analyses have also suggested that a small increase in service speed may result in a dramatic 37 increase of fuel consumption. However, it is true that the scale increases in vessel size have 38 resulted in lower bunker costs per slot. Other approaches concern lower vessel speeds and adding 39 new ships to service routes to allow more efficient scheduling. Environmental considerations 40 will certainly be a factor pushing for slower speeds in the future and the container sector will be 41 a prime target for such practices. 42 43 With the liner industry facing the effects of the world economic crisis these days, it is very 44 pressing to be able to know how each of these variables impacts total costs, so that the latter can 45 be reduced. Surely optimization techniques for the broad spectrum of strategic, tactical and 46

Gkonis and Psaraftis Some key variables affecting liner shipping costs
21
operational problems of liner shipping may also be relevant in that regard. Due to paper size 1 limitations, the survey and development of such methods was outside the scope of this particular 2 paper (see however Gkonis et al (2009) for a related discussion). It is noted that the authors and 3 their colleagues at NTUA are actively engaged in such an investigation, whose output will be 4 presented in future publications. 5 6 Acknowledgments 7 8 Opinions in the paper are those of the authors. Work on the paper has been funded in part from a 9 NOL Fellowship Grant to the National University of Athens in collaboration with the National 10 University of Singapore. The name of the collaborative project is “Optimal Containership Size 11 and its Impact on Liner Shipping Operations,” and its duration is two years (2008-2010). 12 13 References 14 15
Branch, A. E. (1998), “Maritime Economics and Marketing,” 3rd edn (Cheltenham: Stanley 16 Thornes). 17
Cullinane, K. and M. Khanna, (2000), “Economies of scale in large containerships: optimal size 18 and geographical implications”, Journal of Transport Geography, 8: 181-195. 19
Davies, E. (1983), “An Analysis of Cost and Supply Conditions in the Liner Shipping Industry”, 20 The Journal of Industrial Economics, Vol. 31, No. 4, 417-435. 21
Gilman, S. (1999). The size economies and network efficiencies of large containerships. 22 International Journal of Maritime Economics, 1(1), 39-59. 23
Gkonis, K.G., H.N. Psaraftis, P. Tsilingiris (2009) “Liner Shipping Costs and Logistics: A 24 Literature Survey and Taxonomy of Problems,” International Symposium on maritime Logistics 25 and Supply Chain Systems, Singapore, April. 26
Graham, M.G. (1994), “Comment - Scale and rationalization in container shipping”, Maritime 27 Policy & Management, 21:4, 331-337 28
Jansson, J. and D. Schneerson (1982). The optimal ship size. Journal of Transport Economics 29 and Policy, 16(3), 217-238. 30
Kendall, P.M. H. (1972), “A theory of optimum ship size”, Journal of Transport Economics and 31 Policy, 1(2), 128–146 32
Lim, S.-M. (1994), “Economies of container ship size: a new evaluation”, Maritime Policy & 33 Management, 21:2 149-160. 34
Lloyds List (2008a) “An Efficient Ship is a Green Ship, says GL,” Lloyds List, 30 July 2008. 35
Lloyds List (2008b) “High Oil Prices Forces rethink over Optimal Vessel Speed,” Lloyds List, 30 36 July 2008. 37

Gkonis and Psaraftis Some key variables affecting liner shipping costs
22
McConville, J. (1999), “Economics of Maritime Transport: Theory and Practice” (London: 1 Witherby). 2
Ng, A. K.Y. and J.K.Y. Kee, (2008) “The optimal ship sizes of container liner feeder services in 3 Southeast Asia: a ship operator's perspective”, Maritime Policy & Management, 35:4,353-376. 4
Notteboom, T.E., Vernimmen, B. (2008), “The effect of high fuel costs on liner service 5 configuration in container shipping”, Journal of Transport Geography, doi:10.1016/ 6 j.jtrangeo.2008.05.003. 7
Psaraftis, H.N., C. A. Kontovas (2009a), “CO2 Emissions Statistics for the World Commercial 8 Fleet”, WMU Journal of Maritime Affairs,Vol. 8, No.1, 1–25. 9
Psaraftis, H.N., Kontovas, C.A., (2009b) "Ship Emissions : Logistics and Other Tradeoffs", 10 International Marine Design Conference, Trondheim, Norway, May 2009. 11
Song, D, J. Zhang, J. Carter, T. Field, J. Marshall, J. Polak, K. Schumacher, P. Sinha-Ray and J. 12 Woods (2005), “On cost-efficiency of the global container shipping network”, Maritime Policy 13 & Management, 32:1, 15-30. 14
Stopford, M. (2004), “Maritime Economics,” 2nd edition, Routledge. 15
Ting, S.-C. G. –H. Tzeng (2003), “Ship Scheduling and Cost Analysis for Route Planning in 16 Liner Shipping”, Maritime Economics & Logistics, (2003) 5, 378–392. 17
Youroukos, E. (2007), “Economic Feasibility Study of ULMCS,” Diploma Thesis, National 18 Technical University of Athens, February 2007. 19
20