some (!) fundamentals of atmospheric radiation - … · some (!) fundamentals of atmospheric...
TRANSCRIPT

Some (!) Fundamentals of Atmospheric Radiation
Keith Shine
Department of Meteorology,
University of Reading, UK
ECMWF Annual Seminar, September 2015: Physical
processes in present and future large-scale models
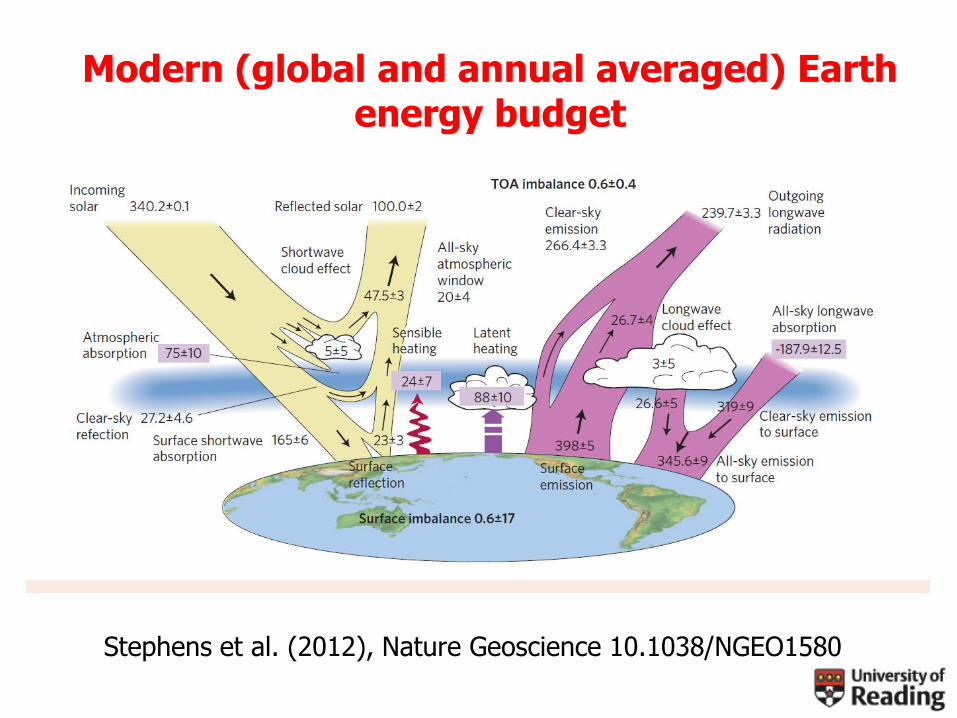
Modern (global and annual averaged) Earth energy budget
Stephens et al. (2012), Nature Geoscience 10.1038/NGEO1580

Contents
• Incoming solar radiation
• A brief introduction to molecular spectroscopy and the HITRAN database
• Some of my group’s work 1: water vapour continuum in the near-infrared
• Some of my group’s work 2: incoming solar spectral radiance in the near infrared

Contents
• Incoming solar radiation
• A brief introduction to molecular spectroscopy and the HITRAN database
• Some of my group’s work 1: water vapour continuum in the near-infrared
• Some of my group’s work 2: incoming solar spectral radiance in the near infrared

Incoming solar radiation
• Measured Total solar irradiance (TSI) So (used to be known as the Solar Constant) at solar minimum is about 1361±0.5 W m-2. This implies that the Sun is emitting as a black body at a mean temperature, Tsun, of about 5760 K
• Will show later that precision of total solar irradiance does not translate into good knowledge of the spectral distribution of incoming solar radiation
www.pmodwrc.ch

Average solar irradiance absorbed by Earth is
where p the planetary albedo, (by clouds, gases, aerosols and the surface) and re is the Earth’s radius. Satellite observations indicate p =0.3
Given a long term balance between the energy absorbed from the Sun and the energy emitted to space by the Earth-atmosphere system and assuming (for now!) that the Earth-atmosphere system emits as a black body to space at a temperature Te then
220
2
.(1 ) (1 ) 240
4 . 4
o ep p
e
S r SW m
r
Incoming solar radiation (continued)
4(1 )4
255 .
op e
e
ST
T K

Spectral variation of incident/emitted radiation
The top plot shows the Planck function for the Sun and Earth temperatures (in reality they are not black bodies
The Sun’s emission is diluted by the inverse square law and the amount absorbed per unit area of Earth requires multiplication by (1-αp)/4. Bottom plot
show the effect of both of these factors
[The bottom plot is plotted so that equal areas give equal irradiances, and shows that the amount absorbed by Earth is about the same as the amount emitted by Earth]
near-IR50%
UV15%
Visible35%
5
1
2(exp( ) 1)
cE
cT
Planck function describes the spectral variation of radiation emitted by a black body:

Contents
• Incoming solar radiation
• A brief introduction to molecular spectroscopy and the HITRAN database
• Some of my group’s work 1: water vapour continuum in the near-infrared
• Some of my group’s work 2: incoming solar spectral radiance in the near infrared

Characteristic spacing between energy levels (and hence the wavelength of absorption/emission) depends on the type of excitation
It takes, in relative terms, a lot of energy (and hence a high frequency/small wavelength) to lift a molecule’s electron into an excited state, but less energy to get it to rotate faster
Absorption and emission by atmospheric gases
Transition wavelength and wavenumberrange
Electronic 0.1–1 µm (vis, UV)(10,000 - 100,000 cm-1)
Vibration 1–20 µm (near-IR and IR)(10,000 – 500 cm-1)
Rotation 20–1000 µm (far IR and micro-wave); (500 – 10 cm-1)
Cartoons from Richards and Scott (1985) Structure and Spectra of Molecules, John Wiley

Absorption mechanisms
Molecules can possess (and change) simultaneously electronic/vibration/rotation– the large number of possible vibration-rotation transitions is what leads to the complexity in the molecular spectra
Petty, G. A First Course in Atmospheric Radiation, Sundog Publishing 2004
For a molecule to absorb or emit a photon is it must possess a electric (or magnetic) dipole (either a permanent one (e.g. H2O) or as a result of vibration (e.g. CO2))
The most abundant molecules (nitrogen and oxygen) do not have an electric dipole, and so play a more minor role in atmospheric radiation

When N2 and O2 vibrate, there is no change in dipole moment (except when an electric field is imposed from outside, as in Rayleigh scattering)
CO2 has no permanent dipole and hence no pure rotation spectrum; it can possess a dipole moment when it vibrates and therefore have a vibration -rotation spectrum
Water vapour and ozone have a permanent dipole and hence a pure rotation spectrum as well as a vibration-rotation spectrum
Petty 2004. Animations from http://www2.ess.ucla.edu/~schauble/molecular_vibrations.htm
Vibration-rotation spectra

Vibration-rotation spectra (continued)
Because •the rotational energy levels are not equally spaced in energy and • not all molecules start at the same energy level this leads to molecules possessing absorption bands where there are lots of transitions in a relatively narrow wavenumber region

Line Broadening Transitions are not at discrete wavelengths because of line broadening. In the atmosphere this is dominated by
•Collision (or pressure) broadening, due to the collisions between “air” molecules and emitting/absorbing molecules
•Doppler broadening, due to relative motion of absorbing/emitting molecules
In some cases, this broadening, can be so large, relative to the line spacing, that it is hard to actually see the individual lines, and we have more of a continuum of absorption
Petty 2004

Spectra for a simple molecule –carbon monoxide, … regular equally spaced lines
Vibration-rotation spectra
wavenumber
By contrast, water vapour has so many modes of vibration and rotation, that its spectrum looks almost random
Petty 2004

Major absorption bands – carbon dioxide
15 μm4.3 μm
CO2 has a strong band at 15μm (bending) and an even stronger band at 4.3 μm which is much less important for atmospheric radiation, as it falls in the “gap” between the solar and terrestrial Planck functions
spectra.iao.ru/en/home/

Pure rotation
band
combinations of vibrations …
16
6.3 μm
More complicated structure is because water vapour
absorption is due to many modes of rotation and vibration
that overlap
Major absorption bands – water vapour
spectra.iao.ru/en/home/
020, 100, 001 110, 011 021 ,200, 101010

17
Other molecules
The plot shows the
transmittance of a
vertical path through
the atmosphere for a
range of gases
This includes the strength
and abundance of the
molecules – note that
even some apparently
weak bands in earlier
sliders, are still
completely absorbing
over atmospheric
paths
Petty 2004

Profoundly important! It explains
(1) why the Planck Function can be used to determine atmospheric emission
(2) how the loss or gain of radiative energy by the (radiativelyactive) molecules is thermalised and shared by all molecules
The Boltzmann Distribution
• For a molecule to be excited from a lower state, it must be in the lower state to start with!
• In thermodynamic equilibrium, the number of molecules in a given state is determined by the Boltzmann Distribution
• Under atmospheric conditions (below ≈80 km), collisions determine how many molecules are in which state.
• They maintain the Boltzmann distribution, a state called “local thermodynamic equilibrium”
)/exp()( kTENEN iii

Radiative transfer calculations
To calculate the irradiances and heating rates for any particular atmospheric profiles, we need various inputs
radiative transfer code –
numerical solution of the
radiative transfer
equations and technique for calculating
transmittances.
vertical profile of radiativelyactive gases (H2O, O3, CO2
...) and temperature
database of spectroscopic properties of molecules (e.g. HITRAN, GEISA)
profiles of (and optical properties of) clouds and
aerosols
spectral and wavelength integrated irradiances and heating
rates
solar spectrum, solar zenith angle ...

from Petty, 2004
Real (non-black-body) spectraIr
rad
ian
ce
(W
m-2
(cm
-1)-
1)
From Sophie Casanova pers.comm.
Solar Thermal IR
Arctic
Arctic

IF. YEAR.THEN. NEW HITRAN VERSION

Includes both
new
measurements
and theoretical
analyses
The updating process

Line positions, intensities and widths are vital

47 species with line data available plus more with cross-section data

Contents
• Incoming solar radiation
• A brief introduction to molecular spectroscopy and the HITRAN database
• Some of my group’s work 1: water vapour continuum in the near-infrared
• Some of my group’s work 2: incoming solar spectral radiance in the near infrared
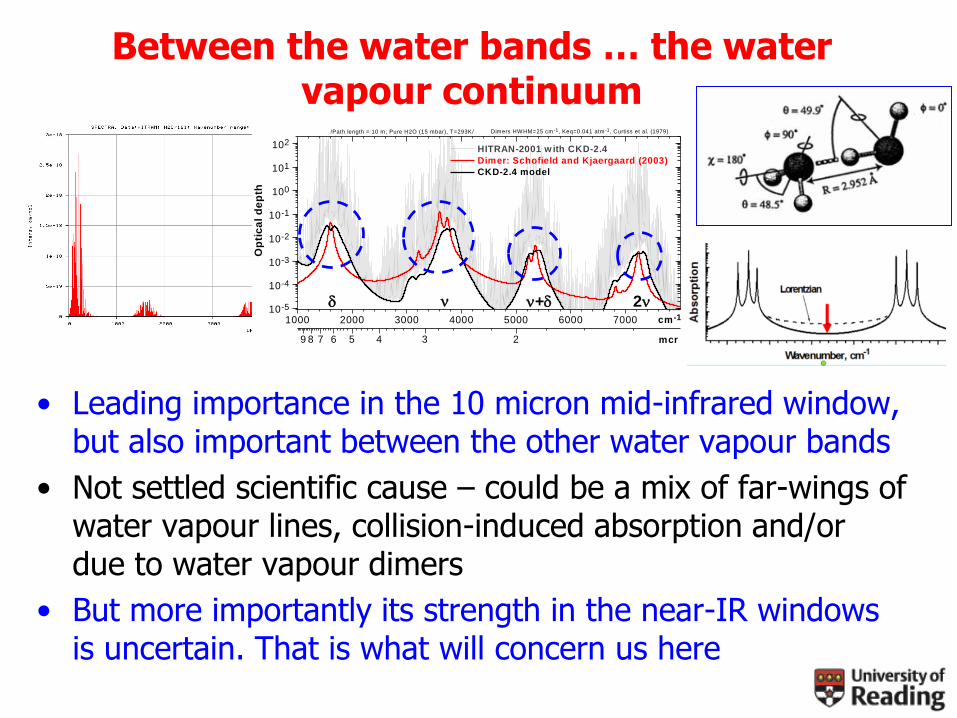
Between the water bands … the water vapour continuum
1000 2000 3000 4000 5000 6000 700010-5
10-4
10-3
10-2
10-1
100
101
102
mcr
cm -1
Dimers HW HM=25 cm -1, Keq=0.041 atm -1, Curtiss et al. (1979)/Path length = 10 m; Pure H2O (15 mbar), T=293K/
Op
tic
al
de
pth
HITRAN-2001 w ith CKD-2.4
Dimer: Schofield and Kjaergaard (2003)
CKD-2.4 model
9 8 7 6 5 4 3 2
+ 2
• Leading importance in the 10 micron mid-infrared window, but also important between the other water vapour bands
• Not settled scientific cause – could be a mix of far-wings of water vapour lines, collision-induced absorption and/or due to water vapour dimers
• But more importantly its strength in the near-IR windows is uncertain. That is what will concern us here

The CKD (Clough-Kneizys-Davies) continuum model
• A major step forward in the representation of continuum (rtweb.aer.com) – used in most radiative transfer schemes for models and satellite retrievals
• Based on empirical modification of the line shapes in “data rich” spectral regions to force agreement with continuum observations: this modified line shape is then used at all wavelengths
• Continually updated since 1980s … latest version is (Mlawer-Tobin) MT-CKD_2.5 with a somewhat different formulation
• Semi-empirical formulation means that it does not explainthe continuum

Original CKD model
• Limited spectral regions to fit the model to observations
• Therefore, continuum in many spectral regions lack experimental support
See Mlawer et al. (Phil Trans Roy Soc A, 2012)
Beyond CKD …
• To characterise the continuum over broad spectral regions and broad range of conditions in both lab and field
• To explain the continuum via advances in understanding of water spectroscopy
• CAVIAR ... Continuum Absorption in the Visible and Infrared and its Atmospheric Relevance ... multi-institute consortium led from Reading from 2006-2011

Experimental Challenges
• Continuum absorption, especially in near-IR, is very weak over “lab distances”
• Hence we need a combination of high vapour pressures and long-path lengths
• Water vapour condenses too easily! To get high vapour pressures we must observe at high temperatures
• But conditions are then not “atmospheric” – need to extrapolate to atmospheric conditions

(MT)-CKD self continuum appearsincorrect by typically an order of magnitude in some near-IR windows
But there is considerable controversy/uncertainty especially in the 1.6µm window …
Summary of CAVIAR near-infrared continuum measurements
(Shine et al 2012, Surveys in Geophysics)
Self
Foreign

Different laboratory techniques lead to dramatically different characterizations of continuum strength in this window
Is one right? Is one better suited for understanding atmospheric absorption?
CAVIAR extrapolate
Mondelain et al. (JGR 2014)
Continuum strength

Towards the edge of window, CAVIAR and CRDS are consistent with an assumed temperature dependence
But near the centre of the window this is not the case -surprisingly little temperature dependence in CRDS
Mondelain et al. (JGR 2014)
Temperature dependence

-80 -60 -40 -20 0 20 40 60 800.0
0.5
1.0
1.5
Global mean
extra Cs: 0.74 W/m2
C
Extr
a a
bso
rpti
on
(W/m
2)
Global meanextra Cf: 0.46 W/m2
Extra absorption of solar irradiance due to CAVIARself-continuum, as compared to the MTCKD-2.5 model
Dec-Feb Mar-May Jun-Aug Sep-Nov
Latitude (degree)
Global impact of new continuum for clear skies
Ptashnik et al. (Phil Trans Roy Soc, 2012)
Rädel et al. (QJRMS, 2015)
New continuum increases the global-mean clear-sky atmospheric shortwave absorption by 2% compared to CKD. Would be even more, if the 1.6 µm band is as strong as shown in some measurements
In a warming world, this absorption increases by 12% more using CAVIAR continuum

Impact on remote sensing of cloud
properties
Satellite retrievals of cloud droplet radius (and much else) use 4900 cm-1 window (amongst others)
If new continuum is used, it could systematically reduce the retrieved droplet radius by typically about 1 μm (in 10 μm). Depends on cloud height and location
2000 3000 4000 5000 6000 7000 8000 9000
10-27
10-26
10-25
10-24
10-23
10-22
Cs (1
0-2
1 c
m2m
ole
c-1atm
-1)
CAVIAR, 350 K CAVIAR, 372 K CAVIAR, 402 K CAVIAR, 431 K CAVIAR, 472 K
cm-1
MTCKD-2.5, 350 K MTCKD-2.5, 374 K MTCKD-2.5, 402 K MTCKD-2.5, 431 K MTCKD-2.5, 472 K MTCKD-2.4, 472 K
5 4.5 4 3.5 3 2.5 2 1.5 m
A
Shine et al., Surveys in Geophys, 2012

Where next at 1.6 µm?
• Analysis of sun-pointing FTS measurements made during CAVIAR (NERC student with NPL)
• Coupling RAL spectrometer to a new “super-continuum light source” – to increase path and signal-to-noise
• Need for a tight intercomparison of laboratory techniques for measuring continuum
• Is there subsidiary evidence (e.g. remote sensed versus in situ data) ?

Contents
• Incoming solar radiation
• A brief introduction to molecular spectroscopy and the HITRAN database
• Some of my group’s work 1: water vapour continuum in the near-infrared
• Some of my group’s work 2: incoming solar spectral radiance in the near infrared

Incoming top-of-atmosphere solar radiation in the solar near-infrared
• A quite surprising and little known controversy on a rather “basic” number
• How much solar radiation (and what is its spectral distribution) is there in the solar-near infrared?
• Our analysis of ground-based observations indicated existing solar spectra may be wrong by 7-8% (i.e. we have “lost” about 30 W m-2 of total solar irradiance )
Menang et al. (JGR 2013)
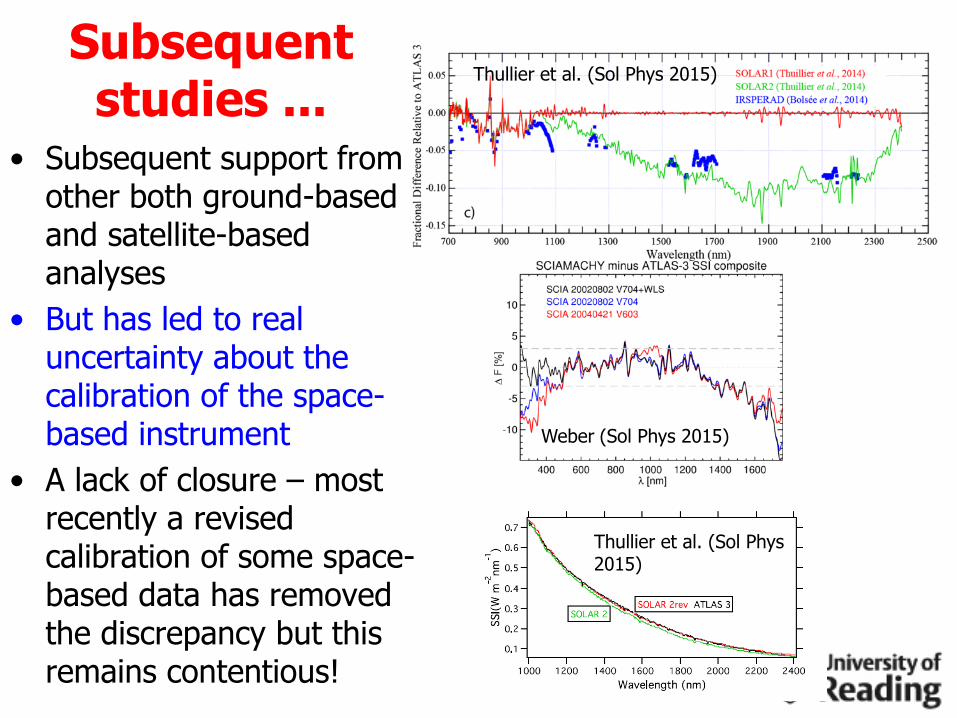
Subsequent studies ...
• Subsequent support from other both ground-based and satellite-based analyses
• But has led to real uncertainty about the calibration of the space-based instrument
• A lack of closure – most recently a revised calibration of some space-based data has removed the discrepancy but this remains contentious!
Thullier et al. (Sol Phys 2015)
Thullier et al. (Sol Phys 2015)
Weber (Sol Phys 2015)
Contents
• Incoming solar radiation
• A brief introduction to molecular spectroscopy and the HITRAN database
• Some of my group’s work 1: water vapour continuum in the near-infrared
• Some of my group’s work 2: incoming solar spectral radiance in the near infrared