some applications of electron back scattering diffraction
TRANSCRIPT

4
Some Applications of Electron Back Scattering Diffraction (EBSD) in Materials Research
Zhongwei Chen1, Yanqing Yang1,∗ and Huisheng Jiao2
1State Key Laboratory of Solidification Processing,
Shaanxi Materials Analysis & Research Center,
Northwestern Polytechnical University, Xi’an, 2Oxford Instruments Shanghai Office, Shanghai,
P.R. China
1. Introduction
Electron Back Scattering Diffraction (EBSD) is a technique based on the analysis of the
Kikuchi pattern by the excitation of the electron beam on the surface of the sample in a
scanning electron microscope (SEM). The crystal structure, orientation and correlative
information can be acquired by the technique. EBSD has a unique advantage in the
determination of the crystal orientation and microstructure compared with the traditional
analysis methods. It can observe the grain boundary types, misorientations, and the
distribution of them, and the statistical measurement and quantitative analysis also can be
carried out. Therefore, the quantitative relationship between grain boundary structure,
orientation, texture and material properties can be established. Consequently, it has been a
very important experimental technique in materials science and engineering.
This chapter presents a few examples of applying EBSD to characterize the microstructure of
different materials including steels and molybdenum sheets after rolling and heat treatment,
and casting aluminum alloys in order to reveal the formation mechanism of microstructure
during solidification.
2. Applications of EBSD in steel and molybdenum
In this section, we summarize the applications of EBSD in microstructure characterization, including second phase identification, texture analysis of steel and molybdenum after different heat treatments and rolling, in understanding the microstructure change during the cold and hot work processing, and the properties of the materials. EBSD also has been used to measure the Kurdjumov-Sachs orientation relationships between austenite and ferrite in stainless steel. The orientation relationships between the particles and the matrix show a spread around the Kurdjumov-Sachs relationship; the close packed planes in the FCC and BCC phases are usually parallel to or nearly parallel to each other. A model has
∗ Corresponding Author
www.intechopen.com

Scanning Electron Microscopy
56
been proposed for the interfacial structure in a duplex stainless steel based on the topological theory to explain the deviation angles. In order to verify the prediction of the distribution of the orientation relationship between BCC/FCC structures, EBSD provides a convenient approach for orientation relationship determination and fast data collection.
2.1 Microstructure characterization of steel after different heat treatments and rolling
Steel's mechanical properties and corrosion resistance are seriously affected by inclusions and precipitates at grain boundaries and inside grains. For example, in ferritic stainless steel, the precipitation of chromium carbides and nitrides at grain boundaries causes local depletion of chromium in the surrounding material, resulting in a much-reduced corrosion resistance [Kim et al., 2010; Park et al., 2006]. This will lead to a dramatic drop in the strength and stiffness of the materials. In order to prevent the formation of chromium carbide and nitride, stronger nitride and carbide formation elements are added to form more stable precipitates.
It is shown that, in this research, a number of precipitates have been formed in a ferritic stainless steel intended for a high temperature application during the steel making process. The precipitates vary in size from 50μm down to a few 10s of nanometers. The larger precipitates can be easily identified using a combination of EBSD and EDS chemical analyses, but the smaller ones make any chemical analysis problematical. However the superior resolution of the EBSD technique, coupled with a knowledge of the probable composition of the precipitates, makes their identification using EBSD alone relatively simple.
The sample was mechanical polished and the final polish with colloidal silica. Zeiss Supra 55 VP SEM was used for EBSD and EDS analysis with beam current around 1-2nA and 20kV. A combination of imaging and “point and click” phase identification (with an integrated EDS-EBSD system) has been used to identify and then map the larger particles; however, these are commonly intragranular particles and, as such, are less damaging to the properties of the steel. The finest particles lie on the grain boundaries – these have the potential to cause intergranular corrosion, and EBSD analysis alone was necessary for their identification. Different mapping step size was used for mapping coarse inclusions in grains and fine precipitates at grain boundaries, 0.5μm and 20nm respectively.
2.1.1 Phase identification of coarse precipitates
Imaging using the Nordlys forescatter system allows both orientation contrast images and atomic number contrast images to be collected, shown in Fig.1, simply by switching from the bottom to the top forescatter diodes. These clearly show 2 types of precipitates within the grains – a large precipitate (type 1) and a number of smaller precipitates (type 2).
The integrated EBSD+EDS system allows 1-click phase identification. From a single point, an EDS spectrum is collected along with the diffraction pattern (EBSP); the spectrum peaks are identified and this chemistry is used to search a phase database (or several databases) to find all matching phases. The EBSP is then indexed and the best matching phase is determined, shown in Fig.2. Here was used to identify the 2 types of precipitate: type 1 precipitates are aluminum nitrides (AlN - hexagonal), and the type 2 precipitates are chromium carbides (Cr23C6 - cubic).
www.intechopen.com

Some Applications of Electron Back Scattering Diffraction (EBSD) in Materials Research
57
Fig. 1. Forescatter images. (a) orientation contrast image collected using the lower forescatter diodes, showing grains and surface topography; (b) atomic number contrast image collected using the top diodes, showing 2 types of precipitate in the ferrite matrix – types 1 and 2.
Fig. 2. Indexed EBSPs from the 2 types of precipitate. (a) type 1, indexed as hexagonal AlN; (b) type 2, indexed as cubic Cr23C6.
With the identity of the precipitates now known, it is possible to map the area and to show the distribution of the phases. The CHANNEL5 EBSD system can discriminate between the 2 precipitates and the ferrite matrix, on the basis of crystallography alone. The resulting phase map is shown in Fig.3.
2.1.2 Identification of small grain boundary precipitates
A closer look at the microstructure shows that many of the grain boundaries have small, elongated precipitates, less than 200 nm across. Unlike the coarse AlN and Cr23C6 precipitates, their location at the boundaries could cause intergranular corrosion, and as such it is important to identify them (see Fig. 4).
The size of these particles makes chemical analysis by EDS problematic, as the signal will predominantly originate from the steel matrix. Therefore EBSD is the ideal technique to identify such precipitates. It is expected that these precipitates are either carbides or nitrides, and so matching phases that fit the chemistry (Fe, Cr)(N, C) were used to index the EBSPs. In all cases the precipitates were identified as having a hexagonal M7C3 structure –
(b)(a)
(a) (b)
www.intechopen.com

Scanning Electron Microscopy
58
(Fe,Cr)7C3. An automated EBSP map along one of these boundaries was collected, and this showed that some of the precipitates have a distinct crystallographic relationship with one of the neighbouring grains: (0001)carbide||(111)ferrite – a basal orientation relationship.
Fig. 3. Phase map showing the same area imaged in Fig. 1. Blue = ferrite, Red = AlN and
Green = Cr23C6. Black lines represent grain boundaries.
Fig. 4. (a) Forescatter orientation contrast map of grain boundary precipitates: white box
marks EBSD analysis area; (b) Phase and orientation map of the boundary zone. Ferrite is
shown in blue, with the (Fe,Cr)7C3 precipitates colored according to their orientation.
(a) (b)
www.intechopen.com

Some Applications of Electron Back Scattering Diffraction (EBSD) in Materials Research
59
2.2 Microtexture analysis in molybdenum sheets
EBSD is an ideal technique for microtexture analysis. With the development of the speed of detectors, macro texture analysis is also possible. Comparison with XRD, in characterizing texture EBSD provides not only the types and of percentages of textures, but also the microstructure information. In this section, microtextures of a cross-rolled molybdenum were analyzed using EBSD technique. Molybdenum and its alloys are used in a variety of markets, including the electronics, materials processing and aerospace industries. There are a number of different properties that make molybdenum so attractive, notably its strength at high temperature, high stiffness, excellent thermal conductivity and low coefficient of thermal expansion [Cockeram et al., 2005].
As with any metal, the physical characteristics of molybdenum can be tailored to suit particular applications. This is done using specific machining or metalworking procedures. One example of this is found in the aerospace industry, where molybdenum's strength and stiffness at high temperatures make it the ideal material for space satellite components. Sheets of molybdenum are cross-rolled in order to further enhance its properties [Oertel et al., 2008]. Cross-rolling involves rolling the original sheet both parallel and perpendicular to its length, producing a specific texture (defined as the {001}<110> texture).
This research looks at a specific case in which, during the production of a molybdenum dish, undesirable surface ripples were observed. Obviously these ripples would have a damaging effect on the dish's performance, and therefore it was decided that the microstructural and crystallographic textural characteristics of the molybdenum sheet should be investigated in order to deduce the cause of the ripple formation. Samples were mechanically polished; final electro-polishing with 10% sulphuric acid/methanol electrolyte at -25°C, 55V applied voltage.
The microstructure of the sample is shown in Fig.5, a low magnification backscattered electron micrograph. It is clear that the sample has partially recrystallized, producing large, strain free grains. The recrystallized and unrecrystallized (i.e. deformed) fractions are arranged in alternate bands parallel to the final rolling direction (RD). The scale bar represents 50 μm.
Fig. 5. Forescatter orientation contrast image
www.intechopen.com

Scanning Electron Microscopy
60
The results of the EBSD analysis are shown in this orientation map, Fig.6. The color scheme reflects the orientation (see the inverse pole figure, inset), with green color showing points with the crystallographic <110> direction aligned with the rolling direction. Grain boundaries (>10°) are marked in black, with subgrain boundaries (2-10°) in grey. Note that in this and all other maps, the final rolling direction is horizontal and the scale bar represents 300 μm.
There are many ways that the CHANNEL 5 data processing software can be used to characterize the extent of deformation and recrystallization in a sample such as this.
Fig. 6. Orientation map showing the orientation of each grain
In average misorientation map of Fig. 7(a) the misorientation between all the points in each
grain has been calculated, and assigned a color (as defined in the legend, inset). The blue
color indicates where grains have very little internal misorientation - these typically have
been recrystallized. The green, yellow and red colors represent progressively increasing
levels of internal misorientation, indicating no recrystallization. The software can also
determine the recrystallized fraction automatically, as shown in Fig.7(b). Here the
recrystallized grains are marked in blue and make up 54% of the total area. Unrecrystallized
grains are colored red. It is clear from the orientation map (Fig.6) that this sample has a
strong texture. This can be represented in pole figures or in orientation distribution
functions (ODFs) in Fig.8.
In Fig. 8(a) the contoured pole figures show the complex nature of this texture. As observed in the orientation map, there is a strong alignment of the <110> axes with the rolling direction. However, there are also significant {100} and {111} textures. In Fig. 8(b) plotting the texture in an ODF clearly illustrates the texture characteristics. There is a strong fibre texture that splits into 2 branches, as well as other less important texture components. The colors are the same as in Fig. 7(b), showing that there is little difference between the orientation of recrystallized (blue) and non-recrystallized grains (red).
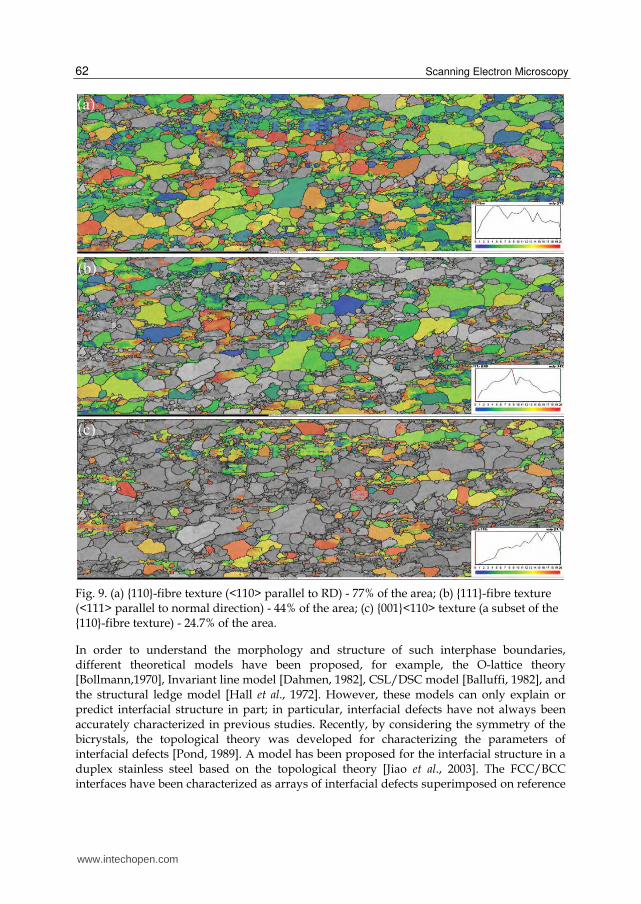
With a complex texture such as this, there are many individual "texture components" that can be used to describe parts of the overall texture. There are 2 main texture components that account for most of the texture in this sample, but if this sample has been fully cross-rolled, then a strong {001}<110> texture would be expected. In Fig.9, the inset shows the color scheme (up to a maximum 20° deviation) and the background grains are colored according to the pattern quality.
www.intechopen.com

Some Applications of Electron Back Scattering Diffraction (EBSD) in Materials Research
61
Fig. 7. (a) The average misorientation map and (b) recrystallised fraction map.
Fig. 8. (a) The contoured pole figures and (b) ODF showing texture characterisitics.
Cross-rolling should produce a dominant {001}<110> texture in BCC-metals (such as
molybdenum). However this texture accounts for less than 25% of the area in this sample, with
{110} and {111}-fibre textures more dominant. This indicates that the sheet has not been fully
cross-rolled, and this would explain the formation of undesired ripples on the sheet surface.
2.3 Measuring the Kurdjumov-Sachs orientation relationships between austenite and ferrite in stainless steel
The interface between FCC and BCC crystals can be found in many important metallic alloys. The orientation relationships between these two phases show a spread around the Kurdjumov-Sachs relationship (K-S OR), Nishiyama-Wassermann relationship or other relationship; the close packed planes in the FCC and BCC phases are usually parallel to or nearly parallel to each other.
(a)
(b)
{100} {110} {111}
(a) (b)
www.intechopen.com
Scanning Electron Microscopy
62
Fig. 9. (a) {110}-fibre texture (<110> parallel to RD) - 77% of the area; (b) {111}-fibre texture (<111> parallel to normal direction) - 44% of the area; (c) {001}<110> texture (a subset of the {110}-fibre texture) - 24.7% of the area.
In order to understand the morphology and structure of such interphase boundaries, different theoretical models have been proposed, for example, the O-lattice theory [Bollmann,1970], Invariant line model [Dahmen, 1982], CSL/DSC model [Balluffi, 1982], and the structural ledge model [Hall et al., 1972]. However, these models can only explain or predict interfacial structure in part; in particular, interfacial defects have not always been accurately characterized in previous studies. Recently, by considering the symmetry of the bicrystals, the topological theory was developed for characterizing the parameters of interfacial defects [Pond, 1989]. A model has been proposed for the interfacial structure in a duplex stainless steel based on the topological theory [Jiao et al., 2003]. The FCC/BCC interfaces have been characterized as arrays of interfacial defects superimposed on reference
(c)
(b)
(a)
www.intechopen.com

Some Applications of Electron Back Scattering Diffraction (EBSD) in Materials Research
63
bicrystal structures. This model predicted deviation angle ranged from 0.3° to 4.97° from the ideal K-S OR. In order to verify the prediction of the distribution of the orientation relationship between BCC/FCC structures, EBSD has been used for orientation relationship determination and fast data collection.
In this research, a sample of Zeron-100 duplex stainless steel was heat treated at 1400˚C for 30 minutes and followed by water quenching, and 10 seconds at 1000˚C for precipitating. Sample was electropolished with a solution of 10 wt% oxalic acid in H2O with a voltage of 10~15V at room temperature for 1~3 minutes.
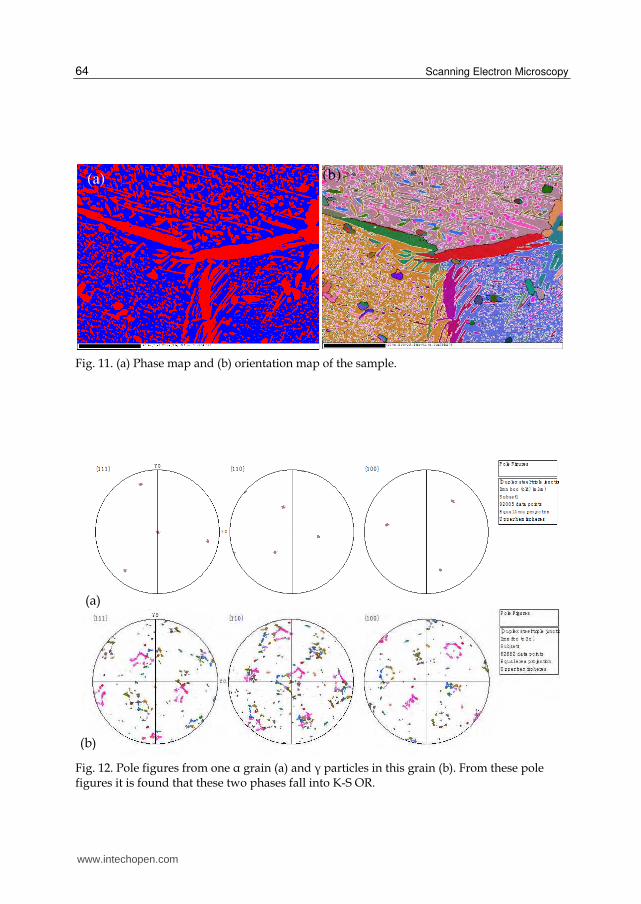
Fig. 10 shows the forescatter orientation contrast image of the duplex stainless steel. The
EBSD data was collected from the center area of the image. In Fig.11, it can be seen there are
two phases, FCC γ phase is in red and BCC α matrix is in blue. For the γ phase we can see
that there are three types: small particles, large particles in α grain and at grain boundaries.
From the pole figures in Fig.12 the orientation relationship (OR) between FCC and BCC
phases was determined as K-S OR. In Fig.11(b) the K-S OR interface boundaries are plotted
in white. If the deviation from K-S OR over 7° the interface boundaries are in black. From
the map we can see that the most of particles shows a K-S OR to matrix. However, the
particles at the grain boundaries only show K-S OR with one side, which is because of the
particle is nucleated from one grain. The large particles inside the α grain show non K-S OR
with the matrix; that because these particles are retained during homogenization.
Fig. 10. Forescatter orientation contrast image of the duplex stainless steel. The EBSD data
was collected from the center area of the image.
Although these two phases show a good consistent with K-S OR, there is always a small
deviation from the ideal OR; that means the {111} plane in γ phase is not exactly parallel to
{110} plane in BCC matrix. From the above distribution, it is found that most the particles
show a 1.5˚ away the K-S OR and with a range of 0.2˚ to 5.4˚, as shown in Fig. 13, which is in
a good agreement with the prediction from the topological interfacial model.
www.intechopen.com
Scanning Electron Microscopy
64
Fig. 11. (a) Phase map and (b) orientation map of the sample.
Fig. 12. Pole figures from one α grain (a) and γ particles in this grain (b). From these pole figures it is found that these two phases fall into K-S OR.
(a) (b)
(b)
(a)
www.intechopen.com

Some Applications of Electron Back Scattering Diffraction (EBSD) in Materials Research
65
Fig. 13. The distribution of the deviation angle from K-S OR.
3. EBSD analysis in the field of solidification
3.1 Preparation of EBSD samples by ion etching
Both electrolytic polishing and ion etching can be used to prepare EBSD samples, however,
the electrolyte for Al-Si alloy is relatively difficult to be prepared. On the other hand, for
A357 alloy, electrolytic polishing of α-Al dendrites is faster than that of the eutectic Si due to
the difference in electrochemical property, and then the prominency of eutectic Si phase is
visible, which influences the surface roughness awfully. As a result, the reflection of the
backscatter electron can not be received by the screen, inducing a low calibration rate,
consequently the sample could not be analyzed [Nogita & Dahle, 2001]. Ion etching, as a
new technique for EBSD sample preparation, is suitable for eliminating the surface stress
layer of most materials, and the etching speed could be selected according to the etching
voltage, ion beam current, geometrical shape and materials of the samples. Therefore, ion
etching is chosen for EBSD sample preparation of particular materials which contain some
hard brittle phases in microstructure.
Fig.14 shows the Kikuchi pattern of A357 alloy sample prepared by mechanical buffing and ion etching respectively. The difference between these two pictures is obvious. Rheology on the surface of the sample took place due to mechanical buffing, therefore no Kikuchi pattern could be observed, as shown in Fig. 14(a). Since the electron beam effects only 1-2µm deep on the surface of the sample, so ion etching must be performed to remove the surface stress layer in order that Kikuchi pattern could be observed. Fig.14(b) shows clear Kikuchi pattern.
3.2 Misorientation of secondary eutectic phase with primary phase in modification alloys
A357 aluminum alloy is casting alloy with the coarse α-Al dendrites and plate-like eutectic
silicon in cast microstructure, of which the volume fraction of the eutectic silicon phase is
www.intechopen.com

Scanning Electron Microscopy
66
more than 50% [Heiberg & Arnberg, 2001] and influences its mechanical properties. The
coarse primary α-Al dendrite could be refined and equiaxed by adding proper quantities of
Ti and B into the alloy [Easton & St John, 2001; Shabestari & Malekan, 2010], while Sr is a
good modificator, which improves the mechanical properties of Al-Si alloy by changing the
morphology of the eutectic Si [Chen & Zhang, 2010; Martínez et al., 2005]. In the section,
EBSD investigation of A357 alloy has been used to analyze the misorientation of eutectic
phase with primary phase in A357 aluminum alloy with and without Sr modification and to
study the nucleation and growth mechanism of the eutectic solidification by Sr modification.
Fig. 14. Kikuchi pattern of unmodified A357 alloy samples prepared by (a) mechanical polishing and (b) ion etching.
For EBSD samples of the cast A357 alloys, the ion etching was carried out for the EBSD sample preparation by Gatan 682 ion etching equipment. EBSD tests were performed on ZEISS SUPRA55 field emission gun scanning electron microscope (FEG-SEM) with HKL channel 5 backscattered electron diffraction camera. The parameter of FEG-SEM is set as following: acceleration voltage of 20kV, working distance of 21.0 mm.
Fig.15 shows the microstructure of the unmodified and modified A357 alloy. The coarse α-Al dendrites and the plate-like Al-Si eutectic both can be observed clearly, as shown in Fig.15 (a). The coarse plate-like eutectic Si phases were transformed to fine fibrous eutectic by Sr modification, as shown in Fig.15 (b). It is concluded that there are approximately 480 grains in a visual field of the unmodified A357 sample, of which the average grain size is 21.0μm, while about 1362 grains can be found in the same scanning region of the sample which was modified and the average grain size is 7.4μm, according to the EBSD statistical results. The average grain size of the sample decreases by nearly two times, indicating that the microstructure can be refined by Sr modification.
Fig.16 shows the crystal misorientation and its distribution with and without Sr modification. Low-angle grain boundaries (LAGBs) are dominate in the unmodified sample and few high-angle grain boundaries (HAGBs) can be observed, while both of them in the modified sample can be found that they distribute evenly and occupy certain proportion respectively, as shown in Fig.16(d). Fig.17 shows the polar figures of the samples with and without Sr modification. Crystal orientation of the sample without Sr modification is relatively concentrated, which basically tends to be two kinds of crystal orientation, represented as red and purple respectively, as shown in Fig.17 (a), while crystal orientation in the modified sample is changed and tends to be scattered, as shown in Fig.17 (b).
(b) (a)
www.intechopen.com

Some Applications of Electron Back Scattering Diffraction (EBSD) in Materials Research
67
Fig. 15. Microstructure of samples (a) unmodified and (b) modified.
Fig. 16. Misorientation angle distribution for the Al grains. (a) and (b) unmodified; (c) and (d) modified.
(a) (b)
(a) (b)
(c) (d)
www.intechopen.com

Scanning Electron Microscopy
68
Fig. 17. Pole figure maps of samples. (a) unmodified and (b) modified.
A357 alloy is hypoeutectic Al-Si alloy, and heterogeneous nucleation takes place during the solidification process of the primary α-Al dendrites and then the nuclei grows up. For A357 alloy, recent work has indicated that there are three different possible eutectic nucleating and growth modes depending on the solidification conditions [Dahle et al., 1997]: (1) nucleates on the casting wall and grows up in the opposite direction of thermal gradients, (2) nucleates on the primary α-Al dendrites and grows up, (3) nucleates on the heterogeneous nuclei located in the region between primary α-Al dendrites and grows up. As shown in Fig.16, with the low-angle grain boundary being responsible for the nucleation of the eutectic Si on the primary α-Al dendrites, the high-angle grain boundary is responsible for the nucleation of the eutectic Si on the heterogeneous nuclei located in the region between primary α-Al dendrites. It is obvious that the eutectic Si in the sample without Sr modification nucleates and grows up in mechanism (2) and those in the sample modified nucleates and grows up in mechanism (3). The results indicate that nucleation mechanism of the eutectic Si phase changes due to the modification, leading to the change of the growth patterns. Therefore, misorientation of secondary eutectic phase with primary phase in casting alloys can be detected by EBSD and used to study the nucleation and growth mechanism of modification.
3.3 Agglomeration of primary crystals during solidification
In suction casting, the extra force is provided by the differential pressure between the melting chamber and the suction chamber. Thus, suction casting is successful in preventing casting defects by means of suction force, and a high cooling rate in suction casting is generated due to the use of the Cu-mold. Although the primary solidification under the intensive force has been comprehensively understood [Chen et al., 2009], not much attention
(b)
(a)
www.intechopen.com

Some Applications of Electron Back Scattering Diffraction (EBSD) in Materials Research
69
has been paid to the solidification of the remaining liquid in the die-casting mould. However, the secondary solidification of the remaining liquid plays an important role in determining the final microstructure and corresponding mechanical properties [Stangleland et al., 2004; Vernède et al., 2006]. The secondary solidification was also found in rheo-diecasting (RDC) process of semi-solid metal (SSM) technology [Fan et al., 2005; Hitchcock et al., 2007]. Therefore, it is necessary to understand the secondary solidification behavior of the remaining liquid in relation to the final microstructure.
Agglomeration of primary crystals in the mushy zone during solidification is an important phenomenon influencing many aspects of casting processes and often affects the rheology of partially solid alloys and the microstructure of the as-cast component. Microstructural characterization of AlFeSi specimens produced by suction casting and die casting has been performed using EBSD. EBSD is used to study the agglomeration of equiaxed crystals in suction casting by analyzing the grain misorientation.
Typical as-cast microstructures produced by the two casting techniques are shown in Figs. 18(a) and 18(b). The primary grains have quasi-equiaxed morphology in two cases. From Fig. 18(b), it can be seen that in located region of the relatively large primary α-Al dendrites, there are fine α-Al particles, contributed by the solidification of the remaining liquid in the located region of α1 dendrites, which is referred to as “secondary solidification”.
Fig. 18. Optical metallographs of AA8011 alloy. (a) die casting sample and (b) central region in 2 mm diameter sample in suction casting.
Similar to previous research [Otarawanna et al., 2010], low-angle grain boundaries (LAGBs) and high-angle GBs (HAGBs) are defined here as boundaries with a misorientation between 5° and 15°, and more than 15°, respectively. Three types of GBs — LAGBs, HAGBs and coincidence-site-lattice GBs (CSL-GBs) — were determined after result extrapolation in each EBSD map. Fig. 19 shows extrapolated EBSD maps by LAGBs and HAGBs in each of the samples investigated. It shows that the fraction of low-energy GBs (LAGBs) is higher in the suction casting sample than in the die casting sample.
By producing samples with different casting methods where the solidifying alloy
experiences different levels of external mechanical stresses, the effects of mechanical stresses
applied during solidification can be assessed. The length percent of low-energy GBs shown
(a) (b)
www.intechopen.com

Scanning Electron Microscopy
70
in Fig. 19 is associated with crystal agglomeration during solidification. The high pressure
applied on the solidifying alloy during suction casting is likely to promote crystal collisions
and result in a strong degree of crystal agglomeration.
When two growing primary crystals impinge with one another, GB formation depends on the interfacial energy of the potential new GB. Coalescence or bridging is the transformation of two impinging solidification fronts into a solid bridge [Rappaz et al., 2003] and in this case a new agglomerate can form. Therefore, coalescence can be considered as the disappearance of
two solid–liquid interfaces, each with interfacial energy γs/l, and the formation of a GB with
interfacial energy γgb [Mathier et al., 2004]. When two solidifying crystals impinge on one
another, bridging occurs readily if γgb < 2γs/l [Rappaz et al., 2003]. On the other hand, some
energy is required to form a new boundary if γgb > 2γs/l. γgb is a function of the misorientation
between the two impinging crystals. γgb < 2γs/l occurs if the misorientation is less than 15° (LAGBs) [Mathier et al., 2004]. In this case, there is an attractive force to bring the two crystals together and coalescence occurs as soon as the two interfaces are close enough. Only GBs with
γgb < 2γs/l are thought to form after a collision of two crystals [Sannes et al., 1996]. If not, a liquid film is stable and the colliding crystals bounce back. In suction casting samples, the fraction of low-energy GBs among in-cavity solidified grains is significantly higher than in diecasting specimens. This is attributed to the increased number of crystal collisions during suction casting, which promotes agglomeration of favorably oriented crystals.
Fig. 19. EBSD micrographs by GB lines in color. White—HAGBs, Yellow—LAGBs, other color-- CSL-GBs. (a) die casting sample, (b) central region in 2 mm diameter sample in suction casting
4. Conclusions
Some examples of applications of EBSD to materials processing are presented in the chapter. It is shown that combined with SEM imaging and EDS composition analyzing, EBSD is very powerful for materials research. Phase identification, microtexture characterization and crystallographic orientation relationship determination are carried out in different steels and molybdenum sheet after heat treating and rolling in order to understand the microstructure evolution during the hot processing. It is also shown that EBSD analysis on casting aluminum alloys provides invaluable insight into mechanisms of nucleation and growth in modification during solidification, and agglomeration of equiaxed crystals in secondary solidification.
(a) (b)
www.intechopen.com

Some Applications of Electron Back Scattering Diffraction (EBSD) in Materials Research
71
5. Acknowledgement
The authors gratefully acknowledge the financial support from the Research Fund of the State Key Laboratory of Solidification Processing (No. 42-QP-009) and the Fundamental Research Fund of Northwestern Polytechnical University (No. JC200929).
6. References
Balluffi, R. W.; Brokman, A. & King, A. H. (1982). CSL/DSC Lattice model for general crystal boundaries and their line defects. Acta Metallurgica, Vol.30, No.8, (August 1982), pp. 1453-1470, ISSN 0001-6160
Bollmann, W. (1970). Crystal Defects and Crystalline Interfaces, Springer, ISBN 978-0387050577, New York, UAS
Chen, Z. W. & Zhang, R. J. (2010). Effect of strontium on primary dendrite and eutectic temperature of A357 aluminum alloy. China Foundry, Vol.7, No.2, (May 2010), pp. 149-152, ISSN 1672-6421
Chen, Z. W.; He, Z. & Jie, W. Q. (2009). Growth restriction effects during solidification of aluminium alloys. Transactions of Nonferrous Metals Society of China, Vol.19, No.2, (April. 2009), pp. 410-413, ISSN 1003-6326
Cockeram, B. V.; Smith, R. W. & Snead, L. L. (2005). Tensile properties and fracture mode of a wrought ODS molybdenum sheet following fast neutron irradiation at temperatures ranging from 300°C to 1000°C. Journal of Nuclear Materials, Vol.346, No.2-3, (November 2005), pp. 165-184, ISSN 0022-3115
Dahmen, U. (1982). Orientation relationships in precipitation systems. Acta Metallurgica, Vo.30, No.1, (January 1982), pp.63-73, ISSN 0001-6160
Dahle, A. K.; Hjelen, J. & Arnberg, L. (1997). Formation of eutectic in hypoeutectic Al-Si alloys, Proceedings of 4th Decennial International Conference on Solidification Processing, pp. 527-530, ISBN 0-9522507-2-1, Sheffield, UK, July 7-10, 1997
Easton, M. A. & St John, D. H. (2001). A model of grain refinement incorporating alloy constitution and potency of heterogeneous nucleant particles. Acta Materialia, Vol.49, No.10, (June 2001), pp. 1867-1878, ISSN 1359-6454
Fan, Z.; Liu, G. & Hitchcock, M. (2005). Solidification behaviour under intensive forced convection, Materials Science and Engineering: A, Vol.413-414, (December 2005), pp. 229-235, ISSN 0921-5093
Hall, M. G.; Aaronson, H. I. & Kinsma, K. R. (1972).The structure of nearly coherent fcc:bcc boundaries in a CuCr alloy, Surface Science, Vol.31, (June 1972), pp. 257-274, ISSN 0039-6028
Heiberg, G. & Arnberg L. (2001). Investigation of the microstructure of the Al–Si eutectic in binary aluminum–7 wt% silicon alloys by electron backscatter diffraction (EBSD). Journal of Light Metals, Vol.1, No.1, (February 2001), pp. 43-49, ISSN 1471-5317
Hitchcock, M.; Wang, Y. & Fan, Z. (2007). Secondary solidification behavior of the Al–Si–Mg alloy prepared by the rheo-diecasting process. Acta Materialia, Vol.55, No.5, (March 2007), pp. 1589-1598, ISSN 1359-6454
Jiao, H. S.; Aindow, M. & Pond, R. C. (2003). Precipitate orientation relationships and interfacial structures in duplex stainless steel Zeron-100. Philosophical Magazine, Vol.83, No.16, (June 2003), pp. 1867-1887, ISSN 1478-6435
www.intechopen.com

Scanning Electron Microscopy
72
Kim, J. K.; Kim, Y. H.; Lee, J. S. & Kim K. Y. (2010). Effect of Chromium Content on Intergranular Corrosion and Precipitation of Ti-stabilized Ferritic Stainless Steels. Corrosion Science, Vol.52, No.5, (May 2010), pp. 1847-1852, ISSN 0010-938X
Martínez, D. E. J.; Cisneros, G. M. A. & Valtierra, S. (2005). Effect of strontium and cooling rate upon eutectic temperatures of A319 aluminum alloy. Scripta Materialia, Vol.52, No.6, (March 2005), pp. 439-443, ISSN 1359-6462
Mathier, V.; Jacot, A. & Rappaz, M. (2004). Coalescence of equiaxed grains during solidification. Modeling and Simulation in Materials Science and Engineering, Vol.12, No.3, (May 2004), pp. 479-490, ISSN 0965-0393
Nogita, K. & Dahle, A. K. (2001). Eutectic solidification in hypoeutectic Al–Si alloys: electron backscatter diffraction analysis. Materials Characterization, Vol.46, No.4, (April 2001), pp. 305-310, ISSN 1044-5803
Oertel, C. G.; Huensche, I.; Skrotzki, W.; Knabl, W.; Lorich, A. & Resch, J. (2008). Plastic anisotropy of straight and cross rolled molybdenum sheets. Materials Science and Engineering: A, Vol.483-484, (June 2008), pp. 79-83, ISSN 0921-5093
Otarawanna, S.; Gourlay, C. M.; Laukli, H. I. & Dahle, A. K. (2010). Agglomeration and bending of equiaxed crystals during solidification of hypoeutectic Al and Mg alloys. Acta Materialia, Vol.58, No.1, (January 2010), pp. 261-271, ISSN 1359-6454
Park, C. J.; Ahn, M. K. & Kwon, H. S. (2006). Influences of Mo substitution by W on the precipitation kinetics of secondary phases and the associated localized corrosion and embrittlement in 29% Cr ferritic stainless steels. Materials Science and Engineering: A, Vol.418, No.1-2, (February 2006), pp. 211-217, ISSN 0921-5093
Pond, R. C. (1989). Line defects in interfaces, In: Dislocations in Solids, Vol.8, Nabarro, F.R.N. & Hirsh, J. P., (Eds.), pp. 1-62, Elsevier, ISBN 0-444-70515-5, Amsterdam, the Netherland
Rappaz, M.; Jacot, A. & Boettinger, W. J. (2003). Last-stage solidification of alloys: Theoretical model of dendrite-arm and grain coalescence. Metallurgical and Materials Transactions A, Vol.34, No.3, (March 2003), pp. 467-479, ISSN 11661-003-0083-3
Sannes, S.; Arnberg, L. & Flemings, M. C. (1996). Orientational relationships in semi-solid Al-6.5wt%Al, In: Light Metals 1996, Hale, W., (Ed.), pp. 795-798, TMS, ISSN 1096-9586, Warrendale, PA, USA
Shabestari, S. G. & Malekan, M. (2010). Assessment of the effect of grain refinement on the solidification characteristics of 319 aluminum alloy using thermal analysis. Journal of Alloys and Compounds, Vol.492, No.1-2, (March 2010), pp. 134-142, ISSN 0925-8388
Stangleland, A.; Mo, A.; Nielsen, Ø.; M’Hamdi, M. & Eskin, D. (2004). Development of thermal strain in the coherent mushy zone during solidification of aluminum alloys. Metallurgical and Materials Transactions A, Vol.35, No.9, (September 2004), pp. 2903-2915, ISSN 11661-004-0238-X
Vernède, S.; Jarry, P. & Rappaz, M. (2006). A granular model of equiaxed mushy zones: Formation of a coherent solid and localization of feeding. Acta Materialia, Vol.54, No.15, (September 2006), pp. 4023-4034, ISSN 1359-6454
www.intechopen.com

Scanning Electron MicroscopyEdited by Dr. Viacheslav Kazmiruk
ISBN 978-953-51-0092-8Hard cover, 830 pagesPublisher InTechPublished online 09, March, 2012Published in print edition March, 2012
InTech EuropeUniversity Campus STeP Ri Slavka Krautzeka 83/A 51000 Rijeka, Croatia Phone: +385 (51) 770 447 Fax: +385 (51) 686 166www.intechopen.com
InTech ChinaUnit 405, Office Block, Hotel Equatorial Shanghai No.65, Yan An Road (West), Shanghai, 200040, China
Phone: +86-21-62489820 Fax: +86-21-62489821
Today, an individual would be hard-pressed to find any science field that does not employ methods andinstruments based on the use of fine focused electron and ion beams. Well instrumented and supplementedwith advanced methods and techniques, SEMs provide possibilities not only of surface imaging but quantitativemeasurement of object topologies, local electrophysical characteristics of semiconductor structures andperforming elemental analysis. Moreover, a fine focused e-beam is widely used for the creation of micro andnanostructures. The book's approach covers both theoretical and practical issues related to scanning electronmicroscopy. The book has 41 chapters, divided into six sections: Instrumentation, Methodology, Biology,Medicine, Material Science, Nanostructured Materials for Electronic Industry, Thin Films, Membranes,Ceramic, Geoscience, and Mineralogy. Each chapter, written by different authors, is a complete work whichpresupposes that readers have some background knowledge on the subject.
How to referenceIn order to correctly reference this scholarly work, feel free to copy and paste the following:
Zhongwei Chen, Yanqing Yang and Huisheng Jiao (2012). Some Applications of Electron Back ScatteringDiffraction (EBSD) in Materials Research, Scanning Electron Microscopy, Dr. Viacheslav Kazmiruk (Ed.), ISBN:978-953-51-0092-8, InTech, Available from: http://www.intechopen.com/books/scanning-electron-microscopy/some-applications-of-electron-back-scattering-diffraction-ebsd-in-materials-research

© 2012 The Author(s). Licensee IntechOpen. This is an open access articledistributed under the terms of the Creative Commons Attribution 3.0License, which permits unrestricted use, distribution, and reproduction inany medium, provided the original work is properly cited.