solving the productivity puzzle: the role of demand …
TRANSCRIPT

EXECUTIVE SUMMARY
FEBRUARY 2018
SOLVING THE PRODUCTIVITY PUZZLE: THE ROLE OF DEMAND AND THE PROMISE OF DIGITIZATION

About MGI
Copyright © McKinsey & Company 2018Copyright © McKinsey & Company 2018
Since its founding in 1990, the McKinsey Global Institute (MGI) has sought to develop a deeper understanding of the evolving global economy. As the business and economics research arm of McKinsey & Company, MGI aims to provide leaders in the commercial, public, and social sectors with the facts and insights on which to base management and policy decisions.
MGI research combines the disciplines of economics and management, employing the analytical tools of economics with the insights of business leaders. Our “micro-to-macro” methodology examines microeconomic industry trends to better understand the broad macroeconomic forces affecting business strategy and public policy. MGI’s in-depth reports have covered more than 20 countries and 30 industries. Current research focuses on six themes: productivity and growth, natural resources, labor markets, the evolution of global financial markets, the economic impact of technology and innovation, and urbanization. Recent reports have assessed the digital economy, the impact of AI and automation on employment, income inequality, the productivity puzzle, the economic benefits of tackling gender inequality, a new era of global competition, Chinese innovation, and digital and financial globalization.
MGI is led by three McKinsey & Company senior partners: Jacques Bughin, Jonathan Woetzel, and James Manyika, who also serves as the chairman of MGI. Michael Chui, Susan Lund, Anu Madgavkar, Jan Mischke, Sree Ramaswamy, and Jaana Remes are MGI partners, and Mekala Krishnan and Jeongmin Seong are MGI senior fellows.
Project teams are led by the MGI partners and a group of senior fellows, and include consultants from McKinsey offices around the world. These teams draw on McKinsey’s global network of partners and industry and management experts. Advice and input to MGI research are provided by the MGI Council, members of which are also involved in MGI’s research. MGI council members are drawn from around the world and from various sectors and include Andrés Cadena, Sandrine Devillard, Richard Dobbs, Tarek Elmasry, Katy George, Rajat Gupta, Eric Hazan, Eric Labaye, Acha Leke, Scott Nyquist, Gary Pinkus, Sven Smit, Oliver Tonby, and Eckart Windhagen. In addition, leading economists, including Nobel laureates, act as research advisers to MGI research.
The partners of McKinsey fund MGI’s research; it is not commissioned by any business, government, or other institution. For further information about MGI and to download reports, please visit www.mckinsey.com/mgi.

Jaana Remes | San Francisco
James Manyika | San Francisco
Jacques Bughin | Brussels
Jonathan Woetzel | Shanghai
Jan Mischke | Zurich
Mekala Krishnan | Boston
SOLVING THE PRODUCTIVITY PUZZLE: THE ROLE OF DEMAND AND THE PROMISE OF DIGITIZATION FEBRUARY 2018

IN BRIEF
SOLVING THE PRODUCTIVITY PUZZLE: THE ROLE OF DEMAND AND THE PROMISE OF DIGITIZATIONLabor productivity growth is near historic lows in the United States and much of Western Europe. While growth in labor productivity has been slowing since the 1960s in many of these countries, the sharp drop to an average of 0.5 percent in 2010–14 from 2.4 percent a decade earlier has been particularly concerning. We attempt to shed light on this puzzle with economy-wide analyses, industry case studies, and corporate surveys, and draw implications for the future.
� We find there has been a job-rich but productivity-weak recovery, with low value added but high hours worked growth, and a broad-based decline with a distinct lack of productivity-accelerating sectors. While there are many schools of thought, we find three waves explain those patterns and the decline.
� Wave 1: The waning of a productivity boom that began in the 1990s dragged down productivity growth by about one percentage point. Around 2005, a decade-long productivity boom from a PC, software, and database system ICT revolution and the restructuring of domestic operations and global supply chains was ending. By then, retail supply chain management tools were broadly implemented and manufacturing offshoring momentum slowed.
� Wave 2: Financial crisis aftereffects, including weak demand and uncertainty, caused another percentage point drag. After the crisis hit, sectors such as financial services went from boom to bust, and companies reacted to weak demand and uncertainty by holding back investment, driving capital intensity growth down to the lowest rates since World War II. Weak demand further depressed productivity growth through negative economy of scale effects and downshifts in product and service mix. For example, in finance, growth in loan volumes dropped by about 10 percentage points or more across many countries.
� Wave 3: Digitization, often involving a transformation of operating and business models, promises significant productivity-boosting opportunities but the benefits have not yet materialized at scale. This is due to adoption barriers and lag effects as well as transition costs; the net effect on productivity in the short term is unclear. For example, in retail, online sales are two times more productive than store sales yet remain on average about 10 percent of total sales volume and come with transition costs like declining footfall in stores. Our surveys and sector analysis show that transition costs can include an initial duplication of structures and investment, cannibalization of incumbent business, and the diversion of management attention.
� The waves had different effects on countries. Sweden and the United States had a particularly strong ICT boom that waned, while the United Kingdom had experienced a financial services boom that ended with the crisis. Germany and France started from more moderate productivity-growth rates and experienced smaller declines mostly related to capital intensity. Italy and Spain started with zero productivity growth at the turn of the century and did not decline further.
� We expect productivity growth to recover and see the potential for at least 2 percent growth a year over the next ten years, with 60 percent coming from digital opportunities. However, while crisis-related aftereffects are diminishing, long-term drags on demand for goods and services may persist and hold back productivity from changing demographics, declining labor shares, rising income inequality, polarization of labor markets, and declining investment rates. Digital may amplify these demand leakages while potentially creating other barriers to productivity growth, such as winner-take-most effects on industry structure. Capturing the productivity potential of advanced economies will require a dual focus that promotes sustained demand growth and digital diffusion.

2%+
PROMOTE SUSTAINED DEMAND GROWTH
PROMOTE DIG
ITAL
DIF
FUSI
ON
Focus on productive
investment as a
fiscal priority
Grow the purchasing
power of low-income
consumers with the
highest propensity
to
consume
Unlock
priva
te bu
sines
s
and r
eside
ntial
inves
tmen
t
Supp
ort w
orke
r tra
ining
and
trans
ition
in an
era
of a
utom
ation
Digitize public services and leverage public procurement
and investment in R&DInvest in digital infrastructure
and ecosystems, and the
education of digital
specialists and consumers
Ensure global connectivity
for all, including SMEs
Clarify regulation
and standards
This could unlock productivity growth of
a year over the next ten years
BEYOND TRADITIONAL SUPPLY-SIDE APPROACHES, POLICY MAKERS NEED TO FOCUS ON PROMOTING
DEMAND AND DIGITAL DIFFUSION
WHAT IS BEHIND EXCEPTIONALLY WEAK PRODUCTIVITY GROWTH?Two waves dragged down productivity growth on average close to one percentage point each. A third wave contains the promise of significant productivity-boosting opportunities, but the benefits have not yet materialized at scale. This is due to adoption barriers, lags, and transitions costs.
PERCENTAGE POINTS
IMPACT ON PRODUCTIVITY GROWTH
0.5
AVERAGE PRODUCTIVITY GROWTH2000–04
AVERAGE PRODUCTIVITY GROWTH2010–14 (including a -0.2% residual)
?
2.4
WAVE 1 THE WANING OF A MID-1990S PRODUCTIVITY BOOM
WAVE 3DIGITIZATION
0.8
0.9
WAVE 2FINANCIAL CRISIS AFTEREFFECTS, INCLUDING WEAK DEMAND AND UNCERTAINTY
PRODUCTIVITY GROWTH MATTERS FOR MATERIAL LIVING STANDARDS BUT HAS DROPPED TO HISTORIC LOWS
of the decline in many countries is from decreasing capital per hour worked growth; at its lowest level post war
of sectors in the postcrisis period with accelerating productivity growth compared with up to 50% a decade earlier
of sectors with lower productivity growth today than ten years ago
>65% >50 % <5%TOO FEW JUMPING SECTORSCRITICAL ROLE OF INVESTMENTBROAD-BASED DECLINE
France
Germany
Spain
Italy
Sweden
United Kingdom
United States
Retail
Technology
Finance
UtilitiesTourism
Auto
We examine supply and demand factors across seven countries and six sectors
Capturing the labor productivity potential of advanced economies

viii McKinsey Global Institute
© Getty Images

EXECUTIVE SUMMARY
Nine years into recovery from the Great Recession, labor productivity-growth rates remain near historic lows across many advanced economies. Productivity growth is crucial to increase wages and living standards, and helps raise the purchasing power of consumers to grow demand for goods and services. Therefore, slowing labor productivity growth heightens concerns at a time when aging economies depend on productivity gains to drive economic growth.1 Yet in an era of digitization, with technologies ranging from online marketplaces to machine learning, the disconnect between disappearing productivity growth and rapid technological change could not be more pronounced.
While productivity growth has been declining since a boom in the 1960s in the United States and much of Western Europe, that decline accelerated after the financial crisis.
In this report, we shed light on the recent slowdown in labor productivity growth in the United States and Western Europe and outline prospects for future growth (see Box E1, “Our methodology”). We find that three waves collided to produce a productivity-weak but job-rich recovery: the waning of a productivity boom that began in the 1990s, financial crisis aftereffects, including weak demand and uncertainty, and digitization. The first two waves have dragged down productivity growth by 1.9 percentage points on average across countries since the mid-2000s, from 2.4 percent to 0.5 percent. In particular, financial crisis aftereffects include weak demand, uncertainty, excess capacity, contraction and expansion of hours, and, in some sectors, a boom-bust cycle. The third wave, digitization, is fundamentally different from the first two because it contains the potential to reignite productivity growth but the benefits have not yet materialized at scale. This is due to adoption barriers and lag effects as well as transition costs. As financial crisis aftereffects recede and more companies incorporate digital solutions, we expect productivity growth to recover; the good news is that we are seeing an uptick today in economic variables like productivity and GDP growth across many countries. We calculate that the productivity-growth potential could be at least 2 percent per year across countries over the next decade. However, capturing the productivity potential of advanced economies may require a focus on promoting both demand and digital diffusion in addition to more traditional supply-side approaches. Furthermore, continued research will be needed to better understand and measure productivity growth in a digital age.
1 Global growth: Can productivity save the day in an aging world? McKinsey Global Institute, January 2015. Please note that in this report, we often refer to labor productivity as simply “productivity”; we specify other types of productivity, such as total factor productivity, when referring to them.
2%+productivity-growth potential per year over the next ten years

2 McKinsey Global Institute Executive summary
Box E1. Our methodology
1 These include: mismeasurement; financial crisis–related factors such as weak investment postcrisis and the rise of zombie firms; and structural shifts such as the rate of technological diffusion, the increasing concentration of businesses, and declining business dynamism together with a growing divergence of productivity among firms, a mix shift toward less productive sectors, a maturation of global supply chains, and secular stagnation. For more detail about each explanation, please see Chapter 1.
2 For more details, see Chapter 1, Box 3, “How significant could the mismeasurement of productivity growth be?”
3 While we are aware that choosing specific years involves some degree of arbitrariness, after assessing the pros and cons of multiple periods, we determined that concentrating on the period following the crisis allowed us to isolate different factors at the sector level across many different countries more easily. We also conduct robustness tests to assess how much these years impact our results. See the technical appendix for a detailed discussion of our methodology.
We analyze the productivity-growth slowdown across a sample of seven countries: France, Germany, Italy, Spain, Sweden, the United Kingdom, and the United States. These countries were chosen to cover a large and diverse portion of GDP in advanced economies, representing about 65 percent. We do not include any analysis of emerging markets, which have a different productivity-growth dynamic compared to mature markets. In addition to country aggregate analysis, we analyze six sectors across our sample of economies to identify what patterns are similar across sectors and what features are sector-specific, in order to understand what drives aggregate productivity trends. We chose these sectors—automotive manufacturing, finance, retail, technology, tourism, and utilities—because they represent a large and diverse share of the economies in our sample countries and played a significant role in explaining the recent slowdown. In our analysis across countries and sectors, we assess the evidence for today’s leading explanations for the productivity-growth slowdown.1 We find evidence of a non-measurement-related productivity-growth slowdown and therefore focus our work in this report on explaining the productivity slowdown as measured.2
We take an integrated analytical approach across supply and demand to assess the linkages and “leakages” around the virtuous cycle of economic growth (from production of goods and services, leading to incomes for households and profits for companies, in turn resulting in continued demand for goods and services). This allows us to diagnose why productivity growth has slowed, particularly as many of the leading explanations today take a supply-focused view rather than an integrated one. In our analysis, we often compare the turn of the century (2000–04)—a five-year period before the start of the recent productivity-growth slowdown in the United States that encompasses the late boom of 2000, recession of 2001, and recovery period—with the postrecession years (2010–14), a somewhat stable period a decade later (though encompassing the double dip recession in Europe). Looking closely at the recent slowdown allows us to identify short-term factors behind the productivity-growth slowdown that are likely to be resolved, as well as long-term trends that are likely to remain in place, helping us to determine the potential for productivity growth in the future.3
While our methodology allows us to provide a much better understanding of the productivity-growth slowdown and the implications for the future, questions for further research surely remain such as how to better measure the digital economy and understand the economic impact of digital transitions.

3McKinsey Global Institute Solving the productivity puzzle: The role of demand and the promise of digitization
PRODUCTIVITY GROWTH REMAINS NEAR HISTORIC LOWS, FOLLOWING A JOB-RICH, PRODUCTIVITY-WEAK RECOVERYWhile labor productivity growth has been declining across the United States and Western Europe since a boom in the 1960s, it decelerated further after the financial crisis to historic lows (Exhibit E1). We focus this study on the slowdown since the early 2000s and identify three major patterns of the productivity-growth slowdown across our sample of countries: low “numerator” (value added) growth accompanied by robust “denominator” (hours worked) growth, creating a job-rich but productivity-weak recovery across most countries; too few and too small “jumping” sectors; and the critical importance of declining capital intensity growth across countries (see Box E2, “Patterns of the productivity-growth slowdown”). These patterns indicate that the productivity-growth slowdown is broad-based across countries and sectors, point to a set of common, overarching factors at work, and reveal the importance of demand-side as well as supply-side factors.
While we find many similar patterns of the productivity-growth slowdown across our sample of countries, there are also notable differences. Sweden and the United States experienced a strong productivity boom in the mid-1990s and early-2000s followed by the largest productivity-growth decline, and much of that decline predated the financial crisis. France and Germany started from more moderate levels and experienced less of a productivity-growth decline, with most of the decline occurring after the crisis. Productivity growth was close to zero in Italy and Spain for some time well before the crisis, so severe labor shedding after the crisis actually accelerated productivity growth.
While many key economic variables such as GDP growth and investment as a share of GDP, as well as productivity growth, have started to pick up recently in the United States and Europe, productivity growth remains low relative to historical levels, with many countries in our sample seeing around 1 percent productivity growth or less.
Exhibit E1
Productivity growth has fluctuated over time; it has been declining since the 1960s and today stands near historic lows
SOURCE: A. Bergeaud, G. Cette, and R. Lecat, "Productivity trends in advanced countries between 1890 and 2012," Review of Income and Wealth, volume 62, number 3, 2016; McKinsey Global Institute analysis
1 Simple average of France, Germany, Italy, Spain, Sweden, and the United Kingdom.NOTE: Productivity defined as GDP per hour worked. Calculated using Hodrick Prescott filter. Drawn from similar analysis in Martin Neil Baily and Nicholas
Montalbano, Why is productivity growth so slow? Possible explanations and policy responses, Brookings Institution, September 2016.
Trend line of labor productivity growth, total economy% year-over-year
United StatesEurope1
Short version
ProductivityExecutive summaryms 0216
World War I
Great Depression
World War II
Great Recession
Focus of this study
-2
6
8
2
4
0
20005030 70190090 2019801871 10 201660 10908040

4 McKinsey Global Institute Executive summary
Box E2. Patterns of the productivity-growth slowdown
1 That is not to say economies experienced a jobs boom but that solid job growth continued over a long time through and beyond the period from 2010 to 2014. While some considered this recovery “jobless” early on (see, for example, Natalia A. Kolesnikova and Yang Liu, Jobless recoveries: Causes and consequences, Federal Reserve Bank of St. Louis, 2011), because it took so long for unemployment to recover, we find that hiring has been exceptionally steady over a long period. The time periods in this exhibit were chosen to allow us to compare a long-term trend (1985 to 2005, ending prior to the crisis, to eliminate the impact of the crisis) with the most recent trends in the recovery (the period of the particularly low productivity growth).
2 A sector is classified as “jumping” in year Y if its compound annual growth rate of productivity for years Y-3 through Y is at least three percentage points higher than it was for 1995 to 2014 as a whole (a “long-term” average).
3 Similar trends are also seen in Europe. Less than 5 percent of sectors in France, Germany, Sweden, and the United Kingdom are classified as jumping today. See Chapter 2 for more details.
Any explanation of the productivity puzzle should take into account the micro patterns of the slowdown and not just the headline aggregate productivity numbers. We find three major micro patterns. First, the recovery from the financial crisis has been “job-rich” and “productivity-poor” with low “numerator” (value added) growth accompanied by robust “denominator” (hours worked) growth (Exhibit E2).1 The broad-based pattern of job-rich but productivity-weak recovery across most countries raises the question of why companies are increasing employment without corresponding increases in productivity growth (see Chapter 3 for more details). It also highlights the importance of examining demand-side drivers for slow value-added growth and low productivity growth.
Second, looking across more than two dozen sectors, we find few “jumping” sectors today, and the ones that are
accelerating are too small to have an impact on aggregate productivity growth.2 For example, only 4 percent of sectors in the United States were classified as jumping in 2014, compared with an average of 18 percent over the last two decades, and they contributed only 4 percent to value added.3 The distinct lack of jumping sectors we have found across countries is consistent with an environment in which digitization and its benefits to productivity are happening unevenly.
Third, since the Great Recession, capital intensity, or capital per hour worked, in many developed countries has grown at the slowest rate in postwar history. Capital intensity indicates access to machinery, tools, and equipment and is measured as capital services per hour. An important way productivity grows is when workers have better tools such as machines for production, computers and mobile phones for analysis
Exhibit E2
Germany
UnitedKingdom
France
Sweden
210-1
Italy
Average2
43
UnitedStates
Spain
3 4210-1 0 2-1 1 43
In many countries, exceptionally low productivity-growth postrecession reflects slowing value-added growth with robust growth in hours worked
Compound annual growth rate%
Value addedLabor productivity Hours worked
1 Looking at these periods allows us to identify short-term factors behind the productivity-growth slowdown that are likely to be resolved, and long-term trends that are likely to remain in place.
2 Weighted average across France, Germany, Italy, Spain, Sweden, United Kingdom, and United States, based on 2016 GDP (2016 $ million).NOTE: Order of countries based on fastest to slowest productivity growth in the 1985–2005 period.
SOURCE: The Conference Board (May 2017 release); McKinsey Global Institute analysis
2010–1611985–20051
ES and report

5McKinsey Global Institute Solving the productivity puzzle: The role of demand and the promise of digitization
and communication, and new software to better design, produce, and ship products, but this has not been occurring at past rates. A decomposition of labor
4 We acknowledge that this analysis represents a decomposition and is not a causal analysis, and is sensitive to the underlying growth accounting formulation. The choice of time periods reflects both the specific trends we want to highlight and constraints from data availability. Comparing the productivity growth in the 2000 to 2004 period with the recent slowdown (2010 to 2014 period) allows us to identify short-term factors behind the productivity-growth slowdown that are likely to be resolved, helping to determine the potential for productivity growth in the future. We were also constrained by a longer-term comparison due to data availability issues across countries in EU KLEMS. For further details, please see the technical appendix. Other researchers have also found large contributions from capital intensity growth and total factor productivity growth in the United States, see for example Alexander Murray, What explains the post-2004 US productivity-growth slowdown? CSLS Research Report 2017-05, 2017.
productivity shows that slowing growth of capital per hour worked contributes about half or more of the productivity-growth decline in many countries (Exhibit E3).4
Exhibit E3
Spain France Germany Sweden2 Italy3United States4
United Kingdom
Labor productivity growth (as measured), 2000–04 (%)
0.0 1.5 1.7 2.9 0.0 3.6 2.3
Change in capital intensity growth
Change in labor quality growth
Change in total factor productivity growth
Change in mix effect
Labor productivity growth (as measured), 2010–14 (%)
1.4 1.0 0.9 0.9 0.6 -0.2 -0.2
Contribution to the decline in productivity growth, 2000–04 vs. 2010–141
Percentage points
Slow productivity growth was accompanied by a decline in capital intensity growth, as well as declining total factor productivity growth in some countries
1 See technical appendix for details on methodology.2 EU KLEMS data on total factor productivity (TFP) was significantly different compared with other data sources such as The Conference Board and Penn
World Tables. Hence, we take the average TFP of the three databases and calculate labor quality as a residual.3 In Italy, the period analyzed is 2010–13 instead of 2010–14 due to data limitations. 4 US data are for the private business sector only; Europe data are for the total economy.NOTE: Order of countries based on fastest to slowest productivity growth in 2010–14.
SOURCE: EU KLEMS (2016 release); BLS Multifactor Productivity database (2016 release); McKinsey Global Institute analysis
Increases productivity growth
Decreases productivity growth0.5Size of bubble
= 0.5
ES and report

6 McKinsey Global Institute Executive summary
THE WANING OF A BOOM STARTING IN THE 1990S AND FINANCIAL CRISIS AFTEREFFECTS HAVE DRAGGED DOWN PRODUCTIVITY GROWTH TO HISTORIC LOWS WHILE DIGITIZATION IS UNDER WAYTwo waves have dragged down productivity growth by 1.9 percentage points on average across countries since the mid-2000s: the waning of a boom that began in the 1990s with the first information and communications technology (ICT) revolution, and a subsequent phase of restructuring and offshoring, which reduced productivity growth by about one percentage point. Financial crisis aftereffects, including weak demand and uncertainty, reduced it by another percentage point. A third wave, digitization, contains the promise of significant productivity-boosting opportunities but the benefits have not yet materialized at scale. This is due to adoption barriers and lag effects as well as transition costs; the net effect on productivity in the short term is unclear (Exhibit E4). We do not attempt to quantify the impact of digitization. Today we find that companies are allocating substantial time and resources to changes and innovations that do not yet have a direct and immediate impact on output and productivity growth.
The importance of these waves was not equal across countries (Exhibit E5). The first wave mattered more in Sweden and the United States, where the productivity boom had been more pronounced, while financial crisis aftereffects were felt more broadly across countries.2
A third wave, digitization, contains the promise of significant productivity-boosting opportunities but the benefits have not yet materialized at scale. This is due to adoption barriers and lag effects as well as transition costs; the net effect on productivity in the short term is unclear.
Coming into the crisis, a boom that began in the 1990s with the first ICT revolution and a restructuring and offshoring phase wanedAn initial ICT-enabled productivity boom, starting in the second half of the 1990s, was particularly strong in Sweden and the United States. The productivity boom in the ICT sector itself reflected a wave of rapid innovation in semiconductor design and manufacturing processes that raised productivity in the sector significantly and translated into higher-quality and higher-value products of downstream computer equipment producers. It also benefited sectors like retail, as large-format retailers like Walmart used technology to transform supply chains and the rest of the industry followed.3 The global industry restructuring following the 2001 tech downturn helped sustain productivity gains across manufacturing as production shifted to Asia and nearshore assembly locations in Mexico and Eastern Europe, and manufacturing production employment declined in the United States and Western Europe. In addition, rapid declines in ICT equipment prices encouraged an investment boom in other sectors such as professional and business services, as well as strong growth in the ICT services and software sector, and boosted productivity growth as these industries integrated new technology into their business processes and systems.
2 For an overview of the methodology used to conduct this sizing, see the technical appendix. This analysis ends at 2014 due to lack of data availability across countries after that date. Please note that this analysis is based on sector-level data. Firm-level trends, some of which we discuss throughout the report, can also play a role in influencing productivity growth.
3 How IT enables productivity growth: The US experience across three sectors in the 1990s, McKinsey Global Institute, November 2002.

7McKinsey Global Institute Solving the productivity puzzle: The role of demand and the promise of digitization
Exhibit E4
0.5
2.4
-0.2
-0.9
-0.8
???
Productivity growth,2000–04
Wave 1Waning of a mid-1990s productivity boom
The waning of the mid-1990s productivity boom includes the waning impact from a PC, software, and database system ICT revolution, and the restructuring of domestic operations and global supply chains
Wave 2Financial crisis aftereffects including weak demand and uncertainty
Financial crisis aftereffects encompass weak demand, uncertainty, excess capacity, contraction and expansion of hours, and a boom/bust in finance, real estate, and construction
Residual2
Productivity growth,2010–14
Wave 3Digitization
Digitization offers the promise to boost productivity growth, yet comes with adoption barriers and lag effects as well as transition costs
The waning of a mid-1990s productivity boom and financial crisis aftereffects have contributed roughly equally to the decline in productivity growth
SOURCE: EU KLEMS (2016 release); BLS Multifactor Productivity database (2016 release); McKinsey Global Institute analysis
1 US data are for the private business sector only; Europe data are for the total economy.2 Includes impact of reallocation (share of total labor and relative price movement) across sectors (“mix effect”) and sectors not considered in our analysis.
May include some of the impact from transition costs of digital. For further details, see technical appendix.NOTE: Italy and Spain are excluded from this analysis because their productivity growth between these time periods did not decrease. We did not attempt to
size the impact from Wave 3 (Digitization). While digitization contains the promise of significant productivity-boosting opportunities, it comes with lag effects and adoption barriers as well as transition costs. The net effect on productivity is unclear. Numbers may not sum due to rounding.
Contribution to the decline in productivity growth in 2010–14 vs. 2000–041
Simple average of France, Germany, Sweden, United Kingdom, and United StatesPercentage points
ES and report
Wave 1 The first ICT revolution Restructuring and offshoring
Wave 2 Sectors experiencing boom and bust (finance, real estate, construction) Hours contraction and expansion Excess capacity, slow demand recovery, uncertainty

8 McKinsey Global Institute Executive summary
By the mid-2000s, the productivity-growth benefits from that first wave of ICT innovation had matured. The retail and wholesale supply chain revolution had largely run its course. Productivity growth in the tech sector itself declined by roughly 14 percentage points in the United States from 2000–04 to 2010–14. The composition of the tech industry had shifted toward skilled labor intensive, less scalable software services. And tech manufacturing became more fragmented and innovation more complex as the proliferation of electronic devices and applications broadened the demands on performance beyond just processor speed.4 For example, the shift in demand toward smartphones requires managing sometimes dozens of sensors from fingerprint recognition and GPS to multiple cameras,
4 Some researchers also question whether Moore’s law still holds, or takes more effort. See, for example, Kenneth Flamm, “Has Moore’s law been repealed? An economist’s perspective,” Computing in Science and Engineering, IEEE, 2017; Nicholas Bloom et al., Are ideas getting harder to find? NBER working paper number 23782, September 2017; and Moore’s law: Repeal or renewal? McKinsey & Company, 2013.
Exhibit E5
The impact of each wave varies across countries
SOURCE: EU KLEMS (2016 release); BLS Multifactor Productivity database (2016 release); McKinsey Global Institute analysis
1 US data are for the private business sector only; Europe data are for the total economy.2 Total change in productivity growth also includes the impact of reallocation (share of total labor and relative price movement) across sectors (“mix effect”)
and sectors not considered in our analysis. May include some of the impact from transition costs of digital. For further details. see technical appendix.NOTE: Italy and Spain are excluded from this analysis because their productivity growth between these time periods did not decrease. We did not attempt to
size the impact from Wave 3 (Digitization). While digitization contains the promise of significant productivity-boosting opportunities, it comes with lag effects and adoption barriers as well as transition costs. The net effect on productivity is unclear. Numbers may not sum due to rounding.
Percentage point contribution to the decline in productivity growth in 2010–14 vs. 2000–04
-0.4
-0.2
-0.1
-1.1
-0.8
-2.0
-0.9
-1.1
-1.3
-1.2
-0.3
-0.9
-1.9
-3.8
-2.5
-2.0
-0.7
-0.5
Wave 1Waning of a mid-1990s productivity boom
Wave 2Financial crisis aftereffects including weak demand and uncertainty
Total change in productivity growth2
ES and report
The first ICT revolution Restructuring and
offshoring
Sectors experiencing boom and bust (finance, real estate, construction)
Hours contraction and expansion
Excess capacity, slow demand recovery, uncertainty
United States1
United Kingdom
Sweden
Germany
France
Simple average
9McKinsey Global Institute Solving the productivity puzzle: The role of demand and the promise of digitization
all requiring efficient power consumption to save battery time. Virtual world gaming, artificial intelligence, and autonomous driving have dramatically expanded the performance demands on Graphics Processor Units (GPUs). The breadth and depth of innovation is vast, making it harder both to accurately measure improvements and to achieve past pace of improvements given the scale in many specialized chips is lower and cost declines slower.5
At the same time, the productivity gains from globalization and offshoring as well as efficiency gains from restructuring post-2001 were plateauing. While we found this trend had a smaller impact on productivity growth across countries than the waning of the ICT-enabled boom, it did affect certain sectors. In the auto sector in the United States, the productivity improvements from restructuring and job declines after the 2001 downturn and of regional footprint optimization across NAFTA tapered off by the mid-2000s. In Germany, regional offshoring to Eastern European countries continues today.
Financial crisis aftereffects, including weak demand and heightened uncertainty, created a dynamic of declining productivity growthDemand for goods and services across countries and industries dropped sharply during the financial crisis as people lost jobs, income contracted, and the credit impulse reversed.6 For example, in the United States, light-vehicle production fell by 47 percent between 2007 and 2009 (data from IHS Markit, 2017 for light-vehicle production), while in retail demand growth slowed by roughly one percentage point compared with the pre-crisis period (data from BLS). This fall in demand for goods and services resulted in significant excess capacity and a pullback of investment. At the same time, in many countries, companies reacted to the demand shock by cutting hours worked, particularly in sectors like manufacturing, retail, finance, and construction. The contraction of hours was so dramatic in the United States that it briefly increased productivity growth in 2009 and 2010.
By the end of 2009, the crisis reached a turning point, with GDP levels bottoming out in the United States. However, the depth of the crisis, deleveraging by households and corporations, weak animal spirits, and structural demand drags such as rising inequality and declining labor share of income resulted in a prolonged recovery that by some measures continues today.7 Some European countries also experienced double-dip recessions in 2011.
A combination of factors in this slow recovery period created a dynamic of declining productivity growth: a slow increase in demand, excess capacity, and economic, political, and regulatory uncertainty, all in an environment of low wage growth. This cocktail contributed to the trend of weak growth in productive capital coupled with a rebound in hours worked growth. The decline in the growth rate of capital intensity, the lowest in the postwar period, reflects a substantial decline in equipment and structures investment during the crisis with a slow recovery while intangible investment, such as R&D and software, recovered more quickly after a brief and smaller dip in 2009.8 As hours worked had significantly contracted during the crisis and capacity was underutilized, companies met slowly rising demand by filling excess capacity and adding hours. For example, in the auto
5 Other research has also pointed to the importance of the waning of this first ICT-enabled boom. See, for example, John Fernald and Bing Wang, “The recent rise and fall of rapid productivity growth,” FRBSF Economic Letter, Federal Reserve Bank of San Francisco, September 2015. Others have questioned whether mismeasurement could explain the productivity-growth decline, given the exceptionally thorny challenges of measuring output of rapidly changing tech industries. For a good overview, see David Byrne, Stephen Oliner, and Daniel Sichel, Prices of high-tech products, mismeasurement, and pace of innovation, NBER working paper number 23369, April 2017.
6 The credit impulse is measured as acceleration or deceleration in debt-to-GDP ratios and thus indicative of the role of borrowing in impacting demand. See, for example, Michael Biggs and Thomas Mayer, Bring credit back into the monetary policy framework! Political Economy of Financial Markets policy brief, August 2013.
7 See Chapter 1, Box 2, “How the Great Recession was different.”8 Companies typically see R&D investment as longer term. In many industries with rapid speed of technological
change, competitive pressure kept investment a priority for companies.
10 McKinsey Global Institute Executive summary
sector in the United States, growth in hours worked surged after 2010, but total hours still remained below pre-crisis levels in 2015 (based on data from the BLS). Capacity utilization in the United States in light-vehicle production began a significant drop in 2007 and fell by 32 percentage points between 2007 and 2009.9 From 2009–10, US capacity utilization rates went up 20 percentage points, then 9 percentage points from 2010–11 (thus returning close to 2007 levels), and another 10 percentage points from 2011–12. Across the economy, once capacity utilization picked up, though, a reason for continued weak investment was the persistent slow recovery in demand. Normalizing capital-to-output ratios across countries indicates that the investment recovery kept pace with the recovery in demand, but since demand growth was weak, capital services growth remained weak, too.10
Slow wage growth dampened the need to substitute capital for labor. Low wage rates in retail in the United States, for example, seem consistent with comparatively slow investment in technologies like automated checkouts and redeploying freed-up resources in low-productivity occupations like greeters.11 In addition, stagnant wages had implications for limiting demand growth. In our sector analysis, we found weak demand dampened productivity growth through other channels than investment, such as economies of scale and a subsector mix shift (see Box E3, “Additional ways weak demand hurt productivity growth during the recovery”).
The slow recovery, together with political and regulatory uncertainty in the aftermath of the crisis, may be continuing to restrain investment today.12 There is debate around how far the recovery has progressed. For instance, while we have witnessed an extended period of job growth, employment rates are still well below pre-crisis levels in some countries, notably the United States, where the unemployment rate is around historic lows but labor force participation has not fully recovered.13 Household investment remains subdued, and business investment as a share of GDP has only slowly recovered to rates seen before the crisis, and has still not fully recovered in parts of Europe. Real investment in structures and equipment remains below trend lines in many countries. Indeed, the latest economic data highlight the fact that capital intensity growth remains noticeably weak across countries. Demand and uncertainty are key drivers. We have found from our global surveys of business that 47 percent of companies that are increasing their investment budgets are doing so
9 Capacity utilization based on straight-time capacity at a one-, two-, or three-shift/three-crew structure dependent on the shift structure in a plant in a given year. This is calculated without overtime. Based on data from IHS Markit, 2017, for light-vehicle production capacity.
10 For other explanations of the slowdown, see Uneven growth: Short – and long-term factors, IMF World Economic Outlook, April 2015; Gustavo Adler et al., Gone with the headwinds: Global productivity, IMF staff discussion note number 17/04, April 2017; Business investment developments in the euro area since the crisis, Occasional Paper Series, number 167, European Central Bank, January 2016; Georg Erber, Ulrich Fritsche, and Patrick Christian Harms, “The global productivity slowdown: Diagnosis, causes and remedies,” Intereconomics, volume 52, number 1, January/February 2017; and Diego Anzoategui et al., Endogenous technology adoption and R&D as sources of business cycle persistence, NBER working paper number 22005, February 2016; Claudio Borio, “Secular stagnation or financial cycle drag?” National Association for Business Economics, 33rd Economic Policy Conference 5–7 March 2017, Washington, DC; Bart van Ark and Kirsten Jäger, Recent trends in Europe’s output and productivity growth performance at the sector level, 2002-2015, working paper.
11 See, for example, Sebastian Vanderzeil, Emma Currier, and Michael Shavel, Retail automation: Stranded workers? Opportunities and risks for labor and automation, Investor Responsibility Research Center, May 2017. For a review of findings related to the role of minimum wages in impacting employment, see David Neumark, Employment effect of minimum wages, IZA World of Labor, May 2014. Interestingly, even when retailers are investing in automation, they have tended to move existing workers to other jobs such as food service to keep store service levels up and improve customer engagement.
12 For a measure of uncertainty, see the Economic Policy Uncertainty Index () and see Scott R. Baker, Nicholas Bloom, and Steven J. Davis, “Measuring economic policy uncertainty,” The Quarterly Journal of Economics, volume 131, issue 4, November 2016. Research has also shown that long-run uncertainty, which is influenced by policy uncertainty, influences both investment and hiring, but the former is more impacted by it than the latter. This is due to lower depreciation rates and higher adjustment costs of investment relative to hiring. See Jose Maria Barrero, Nicholas Bloom, and Ian Wright, Short and long run uncertainty, NBER working paper number 23676, August 2017.
13 Participation is also low due to long-run trends such as aging; see Danny Yagan, Employment hysteresis from the Great Recession, NBER working paper number 23844, September 2017.

11McKinsey Global Institute Solving the productivity puzzle: The role of demand and the promise of digitization
because of an increase in demand, yet 38 percent of respondents say risk aversion is the key reason for not investing in all attractive opportunities.14 However, the good news is that the latest data from Europe and the United States indicate that economic growth is picking up and performance was marginally stronger in 2015 to 2017 compared with the previous period.
The benefits of digitization have not yet materialized at scale and come with adoption barriers, lags, and transition costsWhile the first wave of ICT investment starting in the mid-1990s was mostly from using technology to deliver supply-chain, back-office, and later front-office efficiencies, today we are experiencing a new way of digitization that comes with a more fundamental transformation of entire business models and end-to-end operations. We may be experiencing a renewal of the Solow Paradox of the 1980s, with the digital age around us but not yet visible in the productivity statistics.
There are several reasons that the impact of digital is not yet evident in the productivity numbers. These include lag effects from technological and business readiness to reaching adoption at scale, costs associated with the absorption of management’s time and focus on digital transformation, and transition costs and revenue losses for incumbents that can drag sector productivity during the transition; the net impact today of digitization is unclear.15 On the lag effects, we have found that digitization has not yet reached scale, with a majority of the economy still not digitized. MGI has calculated that Europe overall operates at only 12 percent of digital potential, and the United States at 18 percent, with large sectors
14 McKinsey Quarterly survey, March 2017.15 See also Jacques Bughin and Nicolas van Zeebroeck, Getting digital “bucks”: How the interplay of disruption
and types of strategic responses shapes digital investment payoffs and solves the Solow paradox, working paper, December 2017; Erik Brynjolfsson, Daniel Rock, and Chad Syverson, Artificial intelligence and the modern productivity paradox: A clash of expectations and statistics, NBER working paper number 24001, November 2017.
Box E3. Additional ways weak demand hurt productivity growth during the recoveryWe identify two channels in which weak demand hurt sector productivity growth during the recovery in addition to holding back investment:
Economies of scale. In finance, productivity-growth declined, particularly in Spain, the United Kingdom, and the United States, due to contractions in lending volumes that banks were unable to fully offset with staff cuts due to the need for fixed labor (for example, to support branch networks and IT infrastructure). The utilities sector, which has seen flattening demand growth due to energy efficiency policies, as well as a decline in economic activity during the crisis, was similarly not able to downsize labor due to the need to support electricity distribution and the grid infrastructure.
The shape of demand and subsector mix shift. Consumer preferences boosted productivity growth in both the auto and retail sectors from the mid-1990s to the mid-2000s through a shift to higher value-per-unit, more productive goods. Today that trend has slowed. The German and US auto sectors have experienced a trend of customers purchasing higher-value-added SUVs and premium vehicles. This boosted productivity growth by 0.4 to 0.5 percentage point in the auto sector in the early 2000s. That trend has slowed slightly in both countries, contributing only 0.3 percentage point to productivity growth in 2010–14. Similarly, in retail, we estimate that consumers shifting to higher-value goods, for example higher-value wines or premium yogurts, contributed 45 percent to the 1995–2000 retail productivity-growth increase in the United States. This subsequently waned, dragging down productivity growth.

12 McKinsey Global Institute Executive summary
lagging in both.16 While the ICT, media, financial services, and professional services sectors are rapidly digitizing, other sectors such as education, health care, and construction are not. We also see the lack of scale in our sector deep dives. In retail, for example, we found that the growing share of sales taking place online in the United States added roughly 0.5 percentage point to productivity growth in the sector per year, as those forms of retail are more productive than traditional forms yet those sales are about 10 percent of retail volume.17
History shows that technological diffusion takes time and comes with barriers to adoption.18 An MGI review of the historical rate of adoption of 25 previous technologies over the past half century shows that the time from commercial availability to 90 percent adoption ranges from approximately eight to 28 years.19 This was demonstrated by the first Solow Paradox of the mid-1970s and 1980s, for example, and the ICT boom in the 1990s. Productivity growth in the United States slowed in the former period, despite innovations at the time in the area of microelectronics and communications technology.20 Productivity gains were not automatic and did not occur in all industries that invested heavily in ICT. Instead, real productivity gains required significant changes in business process, as well as managerial and technical innovation.21
The challenge of adoption in the current digital wave may be even harder because of the broad range of uses of digital that not only help improve current processes but fundamentally transform business models and operations. For example, in retail, the first ICT revolution was focused on getting the right goods to the right place at the right time. With digitization, the transition to online requires building a new channel with a new supply-chain structure to deliver goods directly to customers and determining what combination of stores and online presence is optimal. Digital also requires significant up-front investment and new skills in data analysis; our survey shows fear of technological obsolescence as well as gaps in digital technical and organizational capabilities as barriers. The current wave of digitization also requires customers to embrace developments such as mobile banking, online shopping, autonomous driving, and resolving questions with a bot. Finally, some incumbents have reasons to actively delay adoption, whether for fear of cannibalization or, in some cases, the challenges of large-scale transformations.
16 Potential is defined by comparing each sector against a frontier sector defined as the US ICT sector. This analysis uses a set of 18 metrics of digitization spanning assets, usage, and labor. Our use of the term “digitization” and our measurement of it encompasses: the digitization of assets, including infrastructure, connected machines, data, and data platforms; the digitization of operations, including processes, payment and business models, and customer and supply-chain interactions; and the digitization of the workforce, including worker use of digital tools, digitally skilled workers, and new digital jobs and roles. Digital Europe: Pushing the frontier, capturing the benefits, McKinsey Global Institute, June 2016; Digital America: A tale of the haves and have-mores, McKinsey Global Institute, December 2015.
17 Impact on retail productivity growth calculated based on the mix shift between online and offline retail, assuming today’s level of relative productivity between the two segments. Based on data from Euromonitor International, Retailing data (2018 edition) and S&P Capital IQ.
18 Boyan Jovanovic and Peter L. Rousseau, “General purpose technologies,” in Handbook of Economic Growth, volume 1B, Philippe Aghion and Steven Durlauf, eds., Elsevier, 2005. Take the advent of steam power, for example. Productivity growth was quite rapid, at 2 to 3 percent, when steam power was introduced around 1870 but fell with the arrival of electrification in the 1890s, to 1 to 2 percent in the United States. It was only in the period after 1915, which saw the diffusion of machines operated by stand-alone secondary motors and the widespread establishment of centralized power grids, that electricity finally pervaded businesses and households, and productivity growth began to rise. Then productivity growth rose to 3 percent. See also Paul David, Computer and dynamo: The modern productivity paradox in a not-too distant mirror, The Warwick Economics Research Paper Series, 1989.
19 A future that works: Automation, employment, and productivity, McKinsey Global Institute, January 2017. See also Diego Comin and Bart Hobijn, “An exploration of technology diffusion,” American Economic Review, volume 100, number 5, December 2010.
20 Paul David, Computer and dynamo: The modern productivity paradox in a not-too distant mirror, The Warwick Economics Research Paper Series, 1989.
21 How IT enables productivity growth: The US experience across three sectors in the 1990s, McKinsey Global Institute, November 2002.
About
10%share of online sales in retail

13McKinsey Global Institute Solving the productivity puzzle: The role of demand and the promise of digitization
While new digital entrants as well as fast-moving incumbents may increase profits and productivity, others can experience a transition that drags down productivity. As they lose revenue to attackers and their growing digital arms cannibalize revenues further, some companies may end up with duplicate structures and processes, and underutilized capacity in their traditional operations. For example, in retail, when firms increase their online presence and stores or entire malls suffer declining footfall, that cannot readily be remedied.22 In a recent survey we conducted, companies with digital transformations under way said that 17 percent of their market share from core products or services was cannibalized by their own digital products or services.23 Industry productivity benefits will then materialize mostly as incumbent businesses restructure or exit, and adoption costs are outweighed by benefits as digitization reaches scale.
In a recent survey we conducted, companies with digital transformations under way said that 17 percent of their market share from core products or services was cannibalized by their own digital products or services.
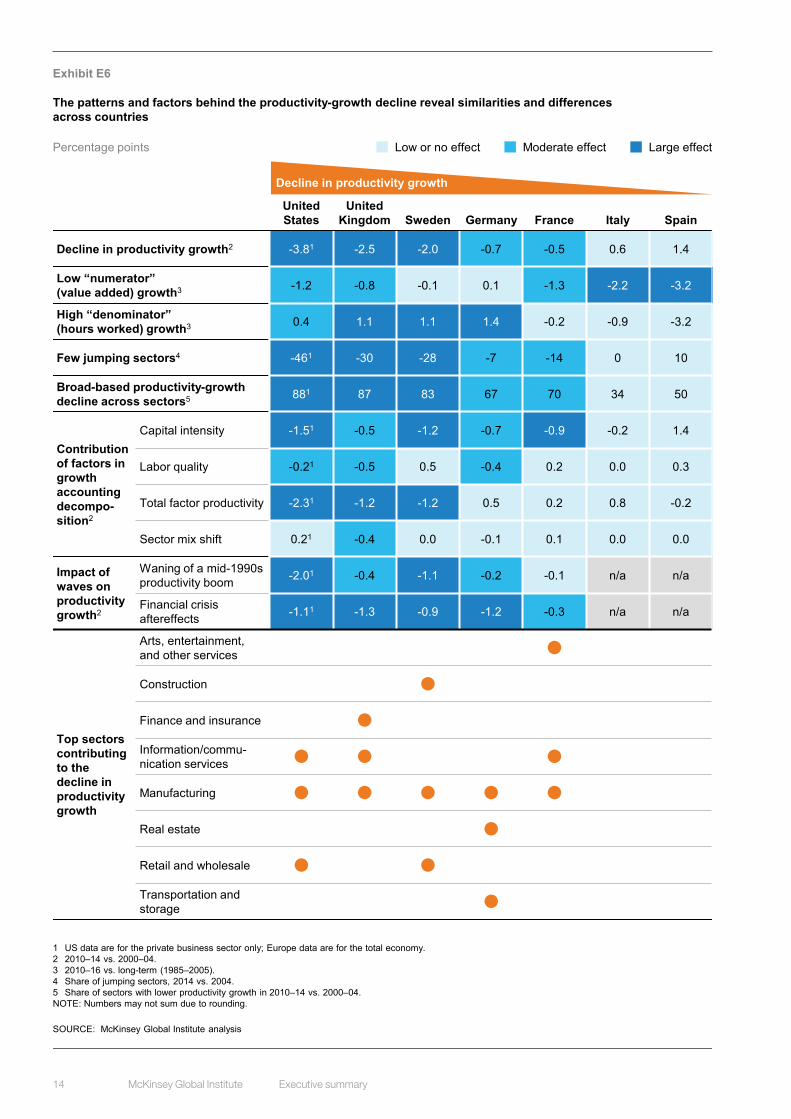
COUNTRY VARIATIONS PROVIDE GREATER INSIGHT INTO THE PRODUCTIVITY-GROWTH SLOWDOWNWe find three broadly similar groups of countries: Sweden, the United Kingdom, and the United States, which have experienced the largest productivity-growth decline in our sample; France and Germany, which experienced a less dramatic drop in productivity growth but a continuing long-term decline; and Italy and Spain, with no decline (Exhibit E6). These variations are mainly associated with the strength of the boom prior to the financial crisis, the extent of the crisis itself, and differences in labor market flexibility.
22 See also Jacques Bughin and Nicolas van Zeebroeck, Getting digital “bucks”: How the interplay of disruption and types of strategic responses shapes digital investment payoffs and solves the Solow paradox, working paper, December 2017; Jacques Bughin, Laura LaBerge, and Anette Mellbye, “The case for digital reinvention,” McKinsey Quarterly, February 2017; and Jacques Bughin and Nicolas van Zeebroeck, “The right response to digital disruption,” MIT Sloan Management Review, April 2017.
23 McKinsey Digital Global Survey 2017: How digital reinventors are pulling away from the pack, McKinsey & Company, October 2017.
.
14 McKinsey Global Institute Executive summary
Exhibit E6
The patterns and factors behind the productivity-growth decline reveal similarities and differences across countries
Percentage points
SOURCE: McKinsey Global Institute analysis
1 US data are for the private business sector only; Europe data are for the total economy.2 2010–14 vs. 2000–04.3 2010–16 vs. long-term (1985–2005).4 Share of jumping sectors, 2014 vs. 2004.5 Share of sectors with lower productivity growth in 2010–14 vs. 2000–04.NOTE: Numbers may not sum due to rounding.
Low or no effect Moderate effect Large effect
United States
United Kingdom Sweden Germany France Italy Spain
Decline in productivity growth2 -3.81 -2.5 -2.0 -0.7 -0.5 0.6 1.4
Low “numerator” (value added) growth3 -1.2 -0.8 -0.1 0.1 -1.3 -2.2 -3.2
High “denominator” (hours worked) growth3 0.4 1.1 1.1 1.4 -0.2 -0.9 -3.2
Few jumping sectors4 -461 -30 -28 -7 -14 0 10
Broad-based productivity-growth decline across sectors5 881 87 83 67 70 34 50
Contribution of factors in growth accounting decompo-sition2
Capital intensity -1.51 -0.5 -1.2 -0.7 -0.9 -0.2 1.4
Labor quality -0.21 -0.5 0.5 -0.4 0.2 0.0 0.3
Total factor productivity -2.31 -1.2 -1.2 0.5 0.2 0.8 -0.2
Sector mix shift 0.21 -0.4 0.0 -0.1 0.1 0.0 0.0
Impact of waves on productivity growth2
Waning of a mid-1990s productivity boom -2.01 -0.4 -1.1 -0.2 -0.1 n/a n/a
Financial crisis aftereffects -1.11 -1.3 -0.9 -1.2 -0.3 n/a n/a
Top sectors contributing to the decline in productivity growth
Arts, entertainment, and other services
Construction
Finance and insurance
Information/commu-nication services
Manufacturing
Real estate
Retail and wholesale
Transportation and storage
Decline in productivity growth

15McKinsey Global Institute Solving the productivity puzzle: The role of demand and the promise of digitization
A SECTOR VIEW HIGHLIGHTS A 2 PERCENT PLUS POTENTIAL FOR THE FUTUREOur sector analysis provides an alternative lens to examine the macro trend of declining productivity growth. We find the three waves played out in different ways and to different degrees across sectors (Exhibit E7). Few sectors illustrate how this perfect storm impacted productivity growth across countries as well as the retail sector. By the time the crisis hit in 2007, the retail sector was at the tail end of a productivity boom that began around 1995. Then weak demand resulting from the financial crisis and recovery made matters worse in two ways: through an overall reduction in sales without a corresponding reduction in labor, and a switch to lower value-per-unit products and brands. As demand began to recover and wages across countries remained low, retailers hired more than they invested. In the middle of this slow recovery and challenging demand environment, the rise of Amazon and the wave of digital disruption occurring in the retail industry added about 0.5 percentage point per year to productivity growth from the shift to more productive online channels, accompanied by transition costs, duplicate structures, and drags on footfall in traditional stores.24 The tourism sector provides a counterexample. It shows how productivity growth has been slow but steady across many countries from the incorporation of new technology, new business models, increasing consolidation, new competitors, and growing demand. (Please see Chapter 4 for an analysis of each individual sector.)
As financial crisis aftereffects continue to dissipate, we expect productivity growth to recover from current lows across sectors and countries. Our sector deep dives reveal significant potential to boost productivity growth both from a continuation of more typical productivity opportunities such as operational efficiency gains and from new avenues enabled by digital technologies. Digital automation is just one channel in which digitization will impact productivity growth; digital flows and platforms can also accelerate globalization and global competition, and digital features can substantially increase customer value.25 Over all, we estimate that the productivity-boosting opportunities could be at least 2 percent on average per year over the next ten years, with 60 percent coming from digital opportunities.26 While low productivity growth of today may lead to concern about the future, research indicates that past productivity performance is a poor indicator of future productivity growth.27
24 Impact on US retail sector. Impact calculated based on the mix shift between online and offline retail, assuming today’s level of relative productivity between the two segments. Based on data from Euromonitor International, Retailing data (2018 edition) and S&P Capital IQ.
25 Global flows in a digital age: How trade, finance, people, and data connect to the world economy, McKinsey Global Institute, April 2014.
26 Our estimate for the productivity-growth potential builds on extensive past MGI research on sector opportunities for improving productivity through technologies that are already implemented today or have a clear path to deployment at scale by 2025. These include benefits from digitization (e.g., big data, Internet of Things, automation, AI) as well as non-digital opportunities such as mix shifts in products and channels, continued consolidation, etc. See Global growth: Can productivity save the day in an aging world? McKinsey Global Institute, January 2015; Digital America: A tale of the haves and have-mores, McKinsey Global Institute, December 2015; Digital Europe: Pushing the frontier, capturing the benefits, McKinsey Global Institute, June 2016; and A future that works: Automation, employment, and productivity, McKinsey Global Institute, January 2017. See the technical appendix for more details.
27 See Erik Brynjolfsson, Daniel Rock, and Chad Syverson, Artificial intelligence and the modern productivity paradox: A clash of expectations and statistics, NBER working paper number 24001, November 2017.
60%of productivity-boosting opportunities will come from digital

16 McKinsey Global Institute Executive summary
Exhibit E7
Automotive2 Wave 1 Benefits of US restructuring post-2001 and NAFTA-wide footprint optimization wanedWave 2 Excess capacity and low profits as demand dropped, slowing investment in equipment and
structures (not R&D); slow demand recovery was met with hours expansion About 0.2 percentage point productivity drag from slower shift to higher-value vehicles
Wave 3 Investment in digital currently under way (autonomous vehicles, connectivity, electric vehicles, industry 4.0) but still subscale; highly or fully autonomous cars not yet commercially available but could represent up to 15% of sales by 2030
Finance2,3 Wave 1 n/aWave 2 Slow growth in lending/deposit volumes due to deleveraging, weak credit demand, stricter
regulation, together with difficulty streamlining fixed labor Regulatory changes, settlements dampened value-added growth and occupied management
attentionWave 3 Digitization, fintech are reshaping front and back end of banks, yet transformation takes time
Potential to boost productivity from online and automation (e.g., up to 60% of total costs of retail and commercial banking could benefit from automation and shift to online banking) Strong customer willingness to move to digital products (e.g., only about 13% of North
American customers obtain an account online but 56% are willing to do so)Retail2,4 Wave 1 Benefits from ICT-enabled supply-chain efficiencies and business process transformations
reached saturationWave 2 Weak demand reduced sales growth (by ~3 percentage points on average) without easy
options to scale down labor Shift to higher value-per-unit goods waned, dragged down productivity growth Low wages limited automation (e.g., checkouts) and allowed redeployment into low-value
tasks (meeter-greeter)Wave 3 Online is twice as productive as offline yet makes up only ~10% of total retail
Shift to online involves transition costs (e.g., revenue loss for incumbents’ stores)Technology2 Wave 1 Mobile and graphics use broadened performance requirements and added complexity without
Moore's law improvement dynamics Benefits from restructuring and manufacturing offshoring after 2001 waned
Wave 2 n/aWave 3 Rapid innovations and performance improvements across broad range of industries, devices,
applications (e.g., virtual reality, autonomous/electric vehicles, crypto-currencies) Continued growth of software and services (e.g., cloud services) with robust productivity
growth, including driven by AI and machine learning (a growing measurement challenge across broadening performance dimensions)
Tourism The exception, with slow but sustained productivity growth from industry restructuring and consolidation (airlines and hotels), early introduction of digital (e.g., online transactions), and new business models (Airbnb, TripAdvisor); helped by robust yet at times volatile demand
Utilities2 Wave 1 Efficiency gains from increasing competition after liberalization in the 1990s/2000s in electricity generation and retail subsectors waned along with incentives for the transmission and distribution subsector to drive efficiency, e.g., performance-based ratings schemes
Wave 2 Energy efficiency efforts and the financial crisis eroded electricity demand (e.g., demand growth declined by ~3.5 percentage points in Europe between 2000–04 vs. 2010–14), while labor in transmission and distribution (60% of employment) could not be streamlined
Wave 3 Smart meters and grids, digital productivity tools for employees, and automation of back-office processes could boost profitability by as much as 20 to 30%; however, investments are still subscale and come with a learning curve Solar and wind technologies have higher labor productivity but legacy plants cannot yet be
decommissioned, resulting in transition costs and revenue losses
0.7 0.7
6.5
1.7
Across sectors, two waves—waning of a mid-1990s productivity boom and financial crisis aftereffects—slowed productivity growth; a third wave, digitization, offers promise but comes with lag effects and transition costs
SOURCE: BLS Multifactor Productivity database (2016 release); Eurostat (June 2017 release); EU KLEMS (2016 release); WTTC; McKinsey Global Institute analysis
1.8 0.9
2.9 1.9
3.92.0
2010–142000–04Productivity growthCompound annual growth rate (%)
4.4
-1.4
Contribution to overall productivity growth slowdown (%)1
1 Productivity-growth data in the bar charts are the simple average of all seven countries in our sample. However, the contribution to the overall productivity-growth slowdown is the simple average of only those countries in which the sector contributed to a slowdown (vs. an increase) in productivity growth. The contribution cannot be added up across sectors since the sample of countries varies by sector. For an overview of the sector codes used for each sector, please see sector infographics in Chapter 4.
2 US data are for the private business sector only; Europe data are for the total economy.3 These data include both finance and insurance due to data availability issues across countries.4 These data include both retail and wholesale trade due to data availability issues across countries.
18
4
18
17
n/a
15
17McKinsey Global Institute Solving the productivity puzzle: The role of demand and the promise of digitization
CAPTURING THE PRODUCTIVITY POTENTIAL OF ADVANCED ECONOMIES MAY REQUIRE A FOCUS ON PROMOTING BOTH DEMAND AND DIGITAL DIFFUSIONThere is no guarantee that the productivity-growth potential we identify will be realized without taking action. While we expect financial crisis–related drags to dissipate, long-term drags may continue, such as a rise in the share of low-productivity jobs and slackening demand for goods and services due to changing demographics and rising income inequality; all of these factors may be further amplified by digitization. At the same time, the nature of digital technologies could fundamentally reshape industry structures and economics in a way that could create new obstacles to productivity growth.
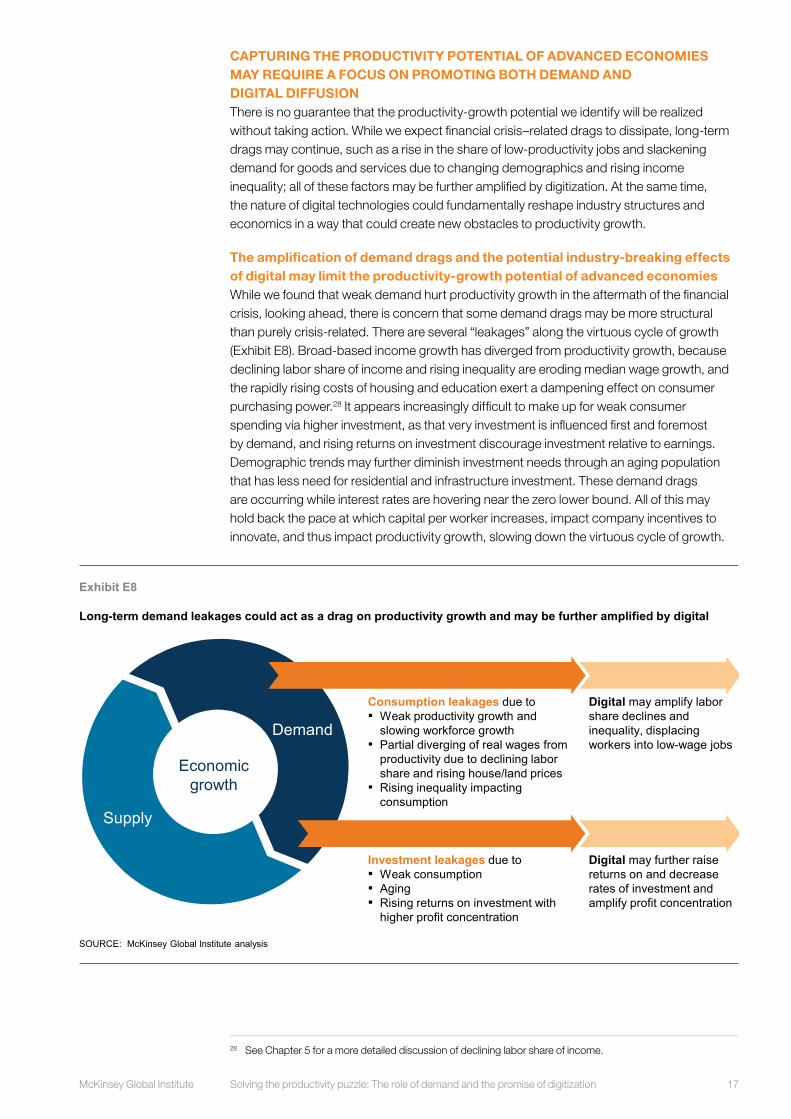
The amplification of demand drags and the potential industry-breaking effects of digital may limit the productivity-growth potential of advanced economiesWhile we found that weak demand hurt productivity growth in the aftermath of the financial crisis, looking ahead, there is concern that some demand drags may be more structural than purely crisis-related. There are several “leakages” along the virtuous cycle of growth (Exhibit E8). Broad-based income growth has diverged from productivity growth, because declining labor share of income and rising inequality are eroding median wage growth, and the rapidly rising costs of housing and education exert a dampening effect on consumer purchasing power.28 It appears increasingly difficult to make up for weak consumer spending via higher investment, as that very investment is influenced first and foremost by demand, and rising returns on investment discourage investment relative to earnings. Demographic trends may further diminish investment needs through an aging population that has less need for residential and infrastructure investment. These demand drags are occurring while interest rates are hovering near the zero lower bound. All of this may hold back the pace at which capital per worker increases, impact company incentives to innovate, and thus impact productivity growth, slowing down the virtuous cycle of growth.
.
28 See Chapter 5 for a more detailed discussion of declining labor share of income.
Exhibit E8
Long-term demand leakages could act as a drag on productivity growth and may be further amplified by digital
SOURCE: McKinsey Global Institute analysis
Demand
Supply
Economic growth
Consumption leakages due to▪ Weak productivity growth and
slowing workforce growth▪ Partial diverging of real wages from
productivity due to declining labor share and rising house/land prices
▪ Rising inequality impacting consumption
Digital may amplify labor share declines and inequality, displacing workers into low-wage jobs
Investment leakages due to▪ Weak consumption▪ Aging▪ Rising returns on investment with
higher profit concentration
Digital may further raise returns on and decrease rates of investment and amplify profit concentration
ES and report

18 McKinsey Global Institute Executive summary
Digitization may further amplify those leakages, for example as automation may compress labor share of income and increase income inequality by hollowing out middle-class jobs and may polarize the labor market into “superstars” vs. the rest. It may also raise returns on investment and thus reduce rates of investment. Cannibalization of incumbent revenues puts pressure on nominal demand. And the rate of technological labor displacement is set to rise. Unless displaced labor can find new highly productive and high-wage occupations, workers may end up in low-wage jobs that create a drag on productivity growth.29 Our ability to create new jobs and skill workers will impact prospects for income, demand, and productivity growth.
Digital technologies may also dampen their own productivity promise through other channels. Various digital technologies are characterized by large network effects, large fixed costs, and close to zero marginal costs. This leads to a winner-take-most dynamic in industries reliant on such technologies, and may result in a rise in market power that can skew supply chains and lower incentives to raise productivity. For example, some digital platforms benefit from a growing user base, as social networks with more users allow for more connections, while larger pools of search data generate better and more targeted results. While the potential economic costs and approaches to regulation of network industries are well established, the nature of digital platforms is sufficiently different to warrant further policy consideration (see Chapter 5 for a further discussion).
Independent of platform economies, rising corporate concentration throughout the economy may reduce competitive pressure and translate into weaker incentives to innovate and invest in raising productivity, although we have not found evidence of that yet. While the empirical evidence suggests that the link between concentration and either competitive intensity or productivity growth may not be a strong one, this is another often-cited concern today.30 Importantly, in our sector deep dives, we have found no evidence that rising business concentration has hurt productivity growth so far. However, going forward, that may not be the case. There may be a tipping point where the initial benefits from industry consolidation, from factors such as economies of scale and reducing the need for staff, and from restructuring operations may give way to costs as competitive pressure declines with the rise of market power. Rising corporate concentration could also further increase income inequality and compress labor share of income.
New digitally enabled business models can also have dramatically different cost structures that change the economics of industry supply significantly and raise questions about whether the majority of companies in the industry and the tail will follow the frontier as much as in the past. For example, in retail, productivity growth in the late 1990s and early 2000s was driven by Tier 2 and 3 retailers replicating the best practices of frontier firms like Walmart. Today, it is unclear if many of Amazon’s practices can be replicated by most other retailers, given Amazon’s large platform and low marginal cost of offering additional products on its platform. On the other hand, platforms like Amazon, TripAdvisor, and Airbnb offer the potential for new, small, and niche players to compete effectively with larger players, fundamentally changing the structure of the industry. It is unclear then what the net productivity impact of such changes in industry structure and economics will be, depending, for example, on the share of the market different players are able to gain and their relative productivity levels.
29 See also Michael A. Landesmann and Robert Stehrer, “Technology diffusion, international competition and effective demand,” Revue d’economie industrielle, number 105, 2004; Jobs lost, jobs gained: Workforce transitions in a time of automation, McKinsey Global Institute, November 2017.
30 Jason Furman and Peter Orszag, A firm-level perspective on the role of rents in the rise in inequality, presentation at Columbia University, October 2015; Germán Gutiérrez and Thomas Philippon, Declining competition and investment in the US, March 2017.

19McKinsey Global Institute Solving the productivity puzzle: The role of demand and the promise of digitization
Finally, digitization may reduce price transparency and market efficiency as the customization of price, product, and terms proliferates through the use of consumer data, potentially reducing the incentives for companies to focus on efficiency gains as they extract more of the consumer surplus.
A new paradigm for policy in a digital age may be warrantedUnlocking the productivity potential of advanced economies may require a focus on promoting both demand and digital diffusion, in addition to interventions that help remove traditional supply-side constraints such as red tape.31 To incentivize broad-based change, companies need competitive pressure to perform better, a business environment and institutions that enable change and creative destruction, and access to infrastructure and talent. Yet additional emphasis on digital diffusion and demand is warranted.
There are many opportunities today for policy makers to help boost productivity growth in advanced economies that focus on demand and digital diffusion. Demand may deserve attention to help boost productivity growth not only during the recovery from the financial crisis but also in terms of longer-term structural leakages and their impact on productivity. Suitable tools for this longer-term situation include: focusing on productive investment as a fiscal priority; growing the purchasing power of low-income consumers with the highest propensity to consume; unlocking private business and residential investment; and supporting worker training and transition programs to ensure that periods of transition do not disrupt incomes.
On digital, action is needed both to overcome adoption barriers of large incumbent business and to broaden the adoption of digital tools by all companies and citizens. Actions that can promote digital diffusion include: leading by example and digitizing the public sector; leveraging public procurement and investment in R&D; driving digital adoption by small and medium-sized enterprises (SMEs); investing in hard and soft digital infrastructure and clusters; doubling down on the education of digital specialists as well as consumers; ensuring global connectivity; and addressing privacy and cybersecurity issues. Furthermore, regulators and policy makers will need to understand the differences in the nature of digital platforms and networks from the network industries of the past, and develop the tools to identify non-competitive behavior that could harm consumers.
Other stakeholders have a role to play, too. How do companies, labor organizations, and even economists respond to the challenge of restarting productivity growth in a digital age? Companies will need to develop a productivity strategy that includes the digital transformation of their business model as well as their entire sector and value chain, and not just focus on operational efficiency. In addition, they may have to rethink their employee contract in order to develop a strategy, potentially together with labor organizations, where people and machines can work side by side and workers and companies can prosper together. Economists can play a key part by developing new and improved ways to measure productivity and by developing models that can assess the impact of technology on markets and prices.
31 William Lewis, The power of productivity: Wealth, poverty, and the threat to global stability, University of Chicago Press, 2004; John B. Taylor, “Slow economic growth as a phase in a policy performance cycle,” Journal of Policy Modeling, volume 38, issue 4, July–August 2016; Steven J. Davis, “Regulatory complexity and policy uncertainty: Headwinds of our own making,” prepared for Hoover Institution conference on “Restoring Prosperity,” Stanford University, February 9–10, 2017.

20 McKinsey Global Institute Executive summary
•••
While productivity growth in advanced economies has been slowing for decades, the sharp downturn following the financial crisis has raised alarms. We find that the most recent slowdown is the product of two waves, the waning of a 1990s productivity boom and financial crisis aftereffects, while a third wave, digitization, is under way. As financial crisis aftereffects continue to recede and digitization matures, productivity growth should recover from historic lows. How strong the recovery is, however, will depend on the ability of companies and policy makers to unlock the benefits of digitization and promote sustained demand growth. There is a lot at stake. A dual focus on demand and digitization could unleash a powerful new trend of rising productivity growth that drives prosperity across advanced economies for years to come.
RELATED MGI AND MCKINSEY RESEARCH
The productivity puzzle: A closer look at the United States (March 2017) This MGI paper provides a fresh analysis on productivity growth in the US and highlights opportunities for companies and policy makers to act on.
Secular stagnation and low investment: Breaking the vicious cycle (April 2016) This MGI discussion paper explains how ultra-low interest rates have failed to spark investment and economic demand.
Reinventing construction: A route to higher productivity (February 2017)This MGI report explores the factors that contribute to productivity in the global construction market.
Jobs lost, jobs gained: Workforce transitions in a time of automation (December 2017) This MGI report explains that as many as 375 million workers may need to switch occupational categories and learn new skills.
A future that works: Automation, employment, and productivity (January 2017) This MGI report explores the potential uses of automation in multiple industries and its effects on employment and productivity.
Global growth: Can productivity save the day in an aging world? (January 2015) Without action, global economic growth will almost halve in the next 50 years. This MGI report offers a solution: a dramatic improvement in productivity.
European business: Overcoming uncertainty, strengthening recovery (May 2017) Executives are increasingly optimistic about the region’s business outlook, but survey results suggest more work is needed to instill confidence and stability. A few measures could help.
Beyond the supercycle: How technology is reshaping resources (February 2017) The ways we consume energy and produce commodities are changing. This transformation could benefit the global economy, but resource producers will have to adapt to stay competitive.
www.mckinsey.com/mgi
E-book versions of selected MGI reports are available at MGI’s website, www.mckinsey.com/mgi.
Download and listen to MGI podcasts on iTunes or at www.mckinsey.com/mgi/publications/multimedia/
Cover image: © Tony Tallec/Alamy Stock Photo

McKinsey Global InstituteFebruary 2018 Copyright © McKinsey & Company www.mckinsey.com/mgi
@McKinsey_MGI McKinseyGlobalInstitute