solving the math problem 2-19-07 - depaul university
TRANSCRIPT

Solving the Math Problem Prepared for the Association of Teacher Educators Annual Conference Strand: Creating New Pathways to Teacher Excellence Presented: February 20, 2007 Presenters: Lynn Narasimhan, Ph.D., Center for Interdisciplinary Math and Science, DePaul University Steve Ponisciak, Ph.D., Consortium on Chicago School Research, University of Chicago Barbara Radner, Ph.D., Center for Urban Education, DePaul University Contributing Researchers: Vince Cyboran, Ed.D., Roosevelt University Peter Drake, DePaul University Joseph Ferrari, Ph.D., DePaul University Project Team Barbara Radner, Ph.D., Project Director Lynn Narasimhan, Ph.D., Co-Project Director Vince Cyboran, Ed.D. Peter Drake Joseph Ferrari, Ph.D. Steve Ponisciak, Ph.D.
This project is a research grant funded by the Institute of Education Sciences,
US Department of Education, Award Number R305M040127
Project Website: http://teacher.depaul.edu/AlgebraConnections.html

Solving the Math Problem 2
Contents Introduction p. 3 Premises Based in Theory and Research p. 4 The Study p. 6 Data Collection and Measures p. 7 Implementation p. 9 Data Analysis p. 10 Discussion p. 45 Current Conclusions and Recommendations p. 46 References p. 48 Appendixes Appendix 1: Preliminary Findings: Content Analysis of p. 50 Algebra Connections Student and Teacher Responses Appendix 2: Analysis of Student Math Responses p. 65

Solving the Math Problem 3
Introduction Through a three-year research project funded by the U.S. Department of Education Institute of Education Sciences, a team of researchers has introduced a teacher education model to improve student learning of mathematics at grades five through 8 in poverty level schools in Chicago. The project addresses the problem of limited student achievement in mathematics at the middle grades and in schools serving poverty level communities. The problem is substantial and persistent. This limited achievement is evident in the reports on the national assessment (NAEP) of 4th and 8th grade achievement and in the subsequent failure rate of students in high school algebra. Current reports on student achievement in mathematics indicate that while there has been progress among some populations, there still are substantial gaps between the levels of math achievement of students in urban areas attending public schools in high poverty areas. One way to solve the problem of limited math learning has been the development of programs that range from direct instruction on skills to constructivist learning. The project reported in this research report is “program-neutral” in terms of any specific math curriculum. The participating teachers might use a more teacher-directed approach or an open-ended approach. The only requirement for implementation of the program in instruction was that teachers model algebraic thinking in problem solving and provide opportunities for students to solve problems independently and then write to explain their strategies. The project examines a comprehensive approach to solving this problem, a structure that emphasizes teacher development and application of knowledge about mathematics and assessment. It is a course-based model to enable teachers to work more effectively in teaching math to upper grade elementary students in high poverty urban schools. The project was based on an initiative of the Center for Integrated Science and Technology at DePaul University that provided a three-course sequence in algebra for middle school teachers. The current study developed a comprehensive treatment for teachers that complemented the three-course sequence. Beginning in 2004, the project provided a one-year intensive teacher development through three courses in algebraic thinking, one course in formative evaluation, and on-site facilitation by a project coordinator. Two cohorts of teachers have completed the treatment, one in 2004-5 and a second cohort in 2005-6. Data analysis is in progress, and current findings provide useful information for teacher educators at the in-service and pre-service stage. The treatment is designed to affect what teachers know about mathematics and effective math instruction and to increase achievement of students of those teachers. It has developed and implemented an intervention that enables teachers to become more competent teachers of mathematics who emphasize the strategic thinking that is central to algebra. The sample size is limited, so generalizations from this study will be tentative. However, particularly through the content analysis findings, it appears that the project approach is positively

Solving the Math Problem 4
influencing student attitudes toward problem solving, and the quantitative analysis of gains scores indicates that at some grades there is an increased rate of gain. Premises Based in Theory and Research The project’s design is based on theories of learning, professional development, and formative evaluation. This section presents those theories as premises on which the project was designed. It identifies the theories and clarifies how they were applied in the intervention. A subsequent section explains the theories used to develop a content analysis framework for teacher statements. The content analysis framework developed for this project has the potential to contribute to future research by providing a theory-based framework for interpreting teacher statements about their instructional work. The learning theories of greatest importance to the project were applied both in the planning and modification of courses for teachers and in the formative evaluation course that guided their ongoing assessment of student work. The two theories are based on the work of Lev Vygotsky: the proximal zone of development; scaffolding learning in that proximal zone. Teachers’ knowledge of problem solving was assessed on a continuing basis, and math course sessions were designed to take the teachers to their proximal knowledge about algebra. Through the formative evaluation course, teachers were guided to use that same process: first to identify their students’ current knowledge of problem solving and then to sequence instruction so that students moved to their proximal knowledge. The teachers received scaffolds for their own application of learning, including guides to formative evaluation of their students’ math progress, and scaffolds to use to guide their students’ math learning. The teachers’ scaffolds essentially were outlines to organize the systematic analysis of student math status and plan next instructional priorities. The teachers’ formative analysis guides were based on the work of Benjamin Bloom. The students’ scaffolds were problem-analysis guides that emphasized students’ writing about the problems they solved. The math course sessions emphasized problem-solving and included modeling of algebraic thinking and acceptance and discussion of different strategies to solve the same problem. The use of modeling is based on a principle of effective teaching, and the emphasis on modeling and discussion of problem-solving was intended to respond to a need identified by the Third International Math and Science Study. Most teachers studied math in university courses taught to students who were not going to become teachers. The purpose of those courses was to develop mathematical competence not to develop models of teaching mathematics effectively. In methods courses, teachers learn ways to teach math, while in math courses they learn the math they are to teach, but the two are not connected. Both the math content courses and the methods courses are completed without transfer to the teacher’s own classroom. The treatment courses were designed to provide an opportunity to learn math with teaching approaches that are transferable to the middle school classroom. The problems addressed in the math course sessions generally were from problems in middle-school level curricula or assessments, including the Illinois Standards Achievement Test.

Solving the Math Problem 5
The study was designed to determine the effect of a combined intervention that included three components: Three courses in mathematics and algebraic thinking One course in Formative Evaluation In-school facilitation The premise for including all three components is that in-service teacher education should relate directly to the work of the teacher—be “job-embedded”. Although course work has been evaluated to contribute to teacher knowledge about content and teaching, it also has been determined that teacher education that is not applied does not affect teaching. Conversely, it has been demonstrated that teachers who participate in “sustained professional development based on mathematics curriculum standards were more likely to use reform-oriented teaching practices and have students who achieved higher levels on the state mathematics test” (Sparks). The content of the course work and the assessments correlated with math content required by State of Illinois learning standards as well as NCTM. The courses and applications related directly to the teachers’ instructional requirements. The teacher is the critical learner in this project. Teachers’ effects on learning have been determined to be very significant. (Nye & Hedges; Sanders & Rivers). The study is designed to increase teacher knowledge and ability in math instruction and assessment. Based on prior research that the teacher’s ability correlates with academic achievement, this study is intended to use a treatment to demonstrate that effect—and the appropriateness of a comprehensive design for such treatments. The formative evaluation course was designed to require teachers to apply what they learned in the math courses in the planning of their instruction. The in-school facilitation was intended to scaffold the teachers in instruction so that the plans made were used. Fidelity of implementation is a concern for any educational study, and particularly for a study based in real school settings. Measures of fidelity of implementation included the assignments for the Formative Evaluation course, which required teacher plans, student work based on those plans, and teacher assessments of student work and subsequent modifications in instruction based on those assessments. Theories of math instruction were embedded in the kinds of activities selected as models for teacher learning and student learning, including the use of modeling, collaborative problem-solving, and acceptance of divergent strategies to solve the same problem. The math courses were intended not only to teach mathematics but to model ways to teach it to middle school students. Class sessions included modeling of problem solving, discussions of strategies for problem-solving, presentation and clarification of algebra principles and their application, collaborative problem solving, use of manipulatives, and writing about the problem solving, including a “learning log” at the completion of each session.

Solving the Math Problem 6
The Study Hypotheses The study is designed to examine three hypotheses: 1. The education of teachers about math with methods of instruction that they themselves then apply will increase their confidence and competence to teach algebra effectively 2. Improved math education will increase student achievement in mathematics as measured by standardized tests 3. In-school implementation support is a significant component in the improvement of their teaching Methods The project used an experimental research design to investigate these hypotheses. It included a treatment group, a limited treatment group, and a control group with randomly assigned schools and participants. Treatment: The treatment included three components: Algebra Courses In-service teachers complete three graduate courses in algebra for middle school teachers. The three courses in algebra will emphasize an understanding of patterns and problem solving. Each quarter during the three-quarter academic year teachers will complete one of the three courses. Four teachers from the four schools will participate in a cohort structure in that all 16 teachers will complete the three courses as a continuing group. School Implementation Support Through in-school weekly on-site meetings, there will be opportunities for teachers to implement and analyze what they learn in algebra courses. A School Coordinator for the project will spend one day each week at each school in support of implementation. Course in Formative Evaluation A course that will continue throughout the three quarters. The course will provide “scaffolds” for students that guide them to demonstrate mathematical understanding in problem solving with problems based on NAEP and ISAT and to explain their strategies. The course sessions incorporate the text Fostering Algebraic Thinking, by Mark Driscoll, both as a text and a source of problems for class activities and assignments. Assessment course sessions and assignments coordinate teachers’ assessment and response to student learning progress. Limited Treatment: The Limited Treatment group will receive the student guides to problem solving.

Solving the Math Problem 7
Because the Limited Treatment includes problem-solving scaffolds that parallel the kind of test questions used on ISAT, one of the measures in the study, and includes sample items from ISAT, the inclusion of the Limited Treatment component is intended to determine whether the use of such scaffolds significantly affects student achievement gains. This student scaffold is incorporated in the assessment course and is collected periodically, it is possible that it could be a significant influence on student achievement on ISAT. Because the scaffold specifically requires students to explain their thinking, it not only prepares students to respond to that question, which is included in ISAT, but it also gives teachers an opportunity to identify student learning needs and progress in terms of strategic problem solving. If significant effects are identified for the Limited Treatment group, there are important implications for making this one simple innovation in teaching and assessing mathematics. However, as indicated above it is hypothesized that a comprehensive treatment is needed rather than one component. Sample A representative sample of 12 Chicago public schools serving poverty level communities would participate, with the following selection criteria: schools that are not currently involved in any intensive math professional development; schools that had substantial (more than 50%) poverty-level enrollment; schools that enrolled students from their attendance area—not magnet schools; schools that are not involved simultaneously in school-wide professional development that would prevent teachers from active involvement in implementation of the math treatment; schools that are interested in improving math achievement, as indicated by principal commitment to the project (in response to an invitational letter). Two of the treatment and two of the control schools will serve primarily Latino communities and two of the treatment and two of the control schools will serve primarily African American communities so that there is the opportunity to determine if the treatment is effective in those different communities. The sample of schools would be randomly assigned to Treatment or Limited Treatment. At each school, teachers in grades 5-8 would be asked if they were interested in participating. Initially, the plan was that there would be four schools in the Treatment, two in the Limited Treatment, and four in the control group, with four teachers at each school. It was anticipated that eight teachers would offer to participate, with four teachers randomly assigned to the treatment or limited treatment. Both Limited Treatment and Treatment Schools would be matched so that there was representation of parallel demographics and recent achievement scores. The control group schools would be selected to represent the same demographics and achievement levels. Data Collection and Measures The project includes two areas of evaluation: an evaluation of the program’s implementation; and an evaluation of the program’s effects on teachers and students.

Solving the Math Problem 8
Program Implementation To analyze the program’s implementation, we are using the Improvement Focused Model for program evaluation. In this model, a program is evaluated on a formative basis in terms of its original plan, specific activities, and actual implementation. The Focused Model is a kind of formative evaluation that requires a specification of activities, a reporting of whether the activities were implemented as planned, an analysis of that implementation, and recommendations for continuing or modification of that plan. That model’s application enables researchers to make systematic modifications in the program as it proceeds so that there is a consistent basis for replication and if needed variations from the original design. Effects on Teachers and Students Teacher Data: Pre-Assessments and post-assessments were used to identify teachers’ current methods of instruction and assessment. Pre-tests and post-tests of teachers were designed to identify changes in their knowledge about algebra and math instruction. The pre-tests and post-tests incorporate items developed for the initial pilot of the three-course sequence, including a problem that represents the kind of algebraic thinking required by the ISAT. To provide a basis to analyze teacher application of the model and their development, periodic samples of teachers’ lesson plans, assessments of student work, and decisions based on those assessments were used to determine effects of the program on the teachers’ knowledge and practice. Those data were evaluated through content analysis. Student Data: Student data include achievement scores on the Iowa Test of Basic Skills in mathematics and the Illinois Standards Achievement Test (ISAT). Those data will be used to analyze gains by students in the three groups, treatment, limited treatment, and control, as well as in the analysis of variables that may influence achievement by students of teachers with different backgrounds in their own math preparation. Student writing about problem solving is embedded into the structure of the course work of teachers and also is collected and assessed using content analysis. The following table presents an overview of the collection of data from three groups. Year 1 2004-5
Treatment Group 1
Limited Treatment Group 1
Control Group
Data Collected for Analysis
ITBS and ISAT Teacher and student pre- and post assessments Teacher lesson plans and assessments
ITBS and ISAT student pre- and post-assessments
ITBS and ISAT

Solving the Math Problem 9
Year 2 2005-6
Treatment Group 2
Limited Treatment Group 2
Control Group continues
Data Collected for Analysis
Group 2: ITBS Teacher pre- and post assessments Teacher lesson plans and assessments Current students of Teachers from Cohorts 1 and 2: Student pre-and post-assessments: ISAT
Group 2: ITBS student pre- and post-assessments Current students of teachers from cohorts 1 and 2: ISAT
ISAT
Year 3 2006-7
No additional treatment groups
No additional limited treatment groups
Control Group continues
Data Collected for Analysis
ISAT
ISAT
ISAT
Implementation The implementation analysis includes one change that affected the treatment itself. As teachers participated in the first course in algebra, their rate of learning progress did not match the rate of the teachers who had completed the same coursework previously. The initial participants in the three-course sequence were teachers who had self-selected to participate in order to obtain an “endorsement” to teach math, particularly to teach algebra at the middle school level. They taught at a diverse range of schools, not exclusively poverty-level. The project researchers speculate that the teachers who participated in that prior delivery of the three-course sequence may have brought more substantial math preparation to the courses, as is indicated by their responses to the pre-test. A comparison of pre-test responses by that initial group and by the experimental treatment groups in both years indicate that some of the teachers in the two treatment groups were at the level of those previously enrolled teachers but that approximately half of the teachers in each year of the treatment were less able to succeed on the math pre-test. Applying principles of formative evaluation, the course content was revised to provide for the completion of the content of two of the courses through the three-course sequence for Treatment Groups 1 and 2. Three changes affected the data collection and analysis.
• Test Data: Originally, the program intended to use the ITBS as the measure of student achievement. That test was given annually in May to all Chicago public elementary students. However, in year 2, the Chicago Public School system

Solving the Math Problem 10
discontinued use of the ITBS. Instead, the system used the ISAT, which was administered to all students, grades 3-8, in math and reading. The ISAT correlates with the ITBS, and therefore the project plans to use the ISAT data instead of ITBS as noted above. However, delays in processing the ISAT data resulted in concern that the project would not have achievement data in time to proceed with the analysis of gains in math achievement, so the project gave the ITBS directly to students in the Treatment Group 2 and Limited Treatment Group 2 in 2006. Those data are included in the preliminary data analysis that is reported in the next section.
• Selection Limit: Inclusion of six schools for the treatment group because an insufficient number of teachers volunteered at the initial sample of schools to enable random assignment of teachers.
• Attrition: During year 1, the treatment sample was reduced to 14 teachers due to attrition. The initial sample size was to have been 16 teachers. To accommodate, additional teachers were enrolled in the year 2 treatment group, which began with 22 teachers in order to obtain a minimum of 16, to compensate for year 1 attrition and provide for year 2 attrition. However, only 15 teachers completed the treatment in year 2. No attrition occurred either year for the Limited Treatment group.
Fidelity of implementation was an issue for both treatment years. A measure had been developed for the program identified as Teacher Commitment. That measure was based on evidence of teacher participation (attendance and involvement in course sessions; participation in in-school meetings) and on completion of assignments for both the math courses and the formative evaluation course. During year 2, one of the treatment teachers could not be persuaded to implement the project with students despite on-site facilitation, so although that teacher completed the course work her students in effect did not have the application of the treatment. Data Analysis The analysis of data is still in progress and will be completed in summer 2007. Two kinds of analysis have been conducted: quantitative analysis of the ITBS and ISAT data and content analysis of written statements by students and by teachers. It was anticipated that since teachers were applying the strategies of formative evaluation and students were writing about their math learning during the entire treatment year that there would be more immediate evidence of effects in the written responses to questions than in achievement gains. The content analysis has provided greater evidence of teacher change and student change than the achievement data, but the teachers who participated in the treatment each year actually would have completed the development of their improved competence at a point after which they would have been able to influence their current students. It is anticipated that the year after the teacher’s treatment the students of that teacher would demonstrate increased gains in communication about problem solving as well as

Solving the Math Problem 11
in the skills measured on the achievement tests. That is why the subsequent years’ achievement tests are so essential to completing the analysis of effects. Due to the unavailability of ISAT data at this time, the findings are limited to the ITBS test results for tests administered in 2006 to the Treatment and Limited Treatment groups. As soon as the ISAT data are available, the project analysis can proceed to complete the analysis of year 2 gains. It is planned to then use the March 2007 ISAT scores to analyze effects on students of teachers who have participated in treatment and limited treatment groups during 2004-5 and 2005-6 in comparison with the control group students. The delay in delivery of the test data led to “educated guesses” by the system about the status of students. (McNeil, 20). The initial delays in May 2006 led the project researchers to administer the ITBS in May. While the test administration lacked the “high stakes” context that accompanied the previous years’ administrations of ITBS, the project did gain a basis for analyzing the second cohort treatment and limited treatment students’ achievement. Analysis of data that have been obtained through the project do indicate some significant effects, particularly as identified through content analysis. The following juxtaposition of the responses by one teacher to the same question asked at the beginning and end of the treatment exemplify the kinds of changes in teacher knowledge and practice that were observed. Question: What do you think are some effective strategies for helping students learn problem-solving?
Response by teacher on Pre-Assessment: “Students should learn the steps such as estimating the answer and looking to see if their answer is reasonable.” Post-Assessment Response by same teacher: “Teachers need to model strategies and give students opportunities to practice each problem solving strategy. Then, students should be encouraged to try the strategies that they like or think are appropriate depending on the problem. Some good strategies are: draw a picture, make an equation, make a table/chart/organized list, work backwards and find a pattern.”
Similar changes in student knowledge and in student attitude were observed in the analysis of student-written statements on pre- and post-assessments before and after the treatment began for teachers. A content analysis of the Year 1 Treatment teachers’ and students’ statements at the beginning of the project and at its completion for the first year was completed by a researcher from Roosevelt University in Chicago. To complete that analysis, the researcher developed a framework based on the work of Neuman and Schwarz's three categories of self-explanation and Marshall's model of schemata knowledge levels: 1) identification, 2) elaboration, 3) planning, and 4) execution. He developed a parallel framework for analysis of teacher responses to pre- and post-assessments of their perceptions of math and math instruction, a framework that also was used in the analysis of teacher lesson plans. The researcher concludes (in a report that is appended):

Solving the Math Problem 12
Overall, teachers came to believe that active, social learning on the part of the students would improve student understanding of pre-algebra. In addition, they came to believe that they must individualize instruction as much as possible as well as spend more time planning. The data for students in the treatment group suggest that the combination of teacher training and student writing practices led to improvements in their problem solving skills. Improvements were noted in their use of problem restatement, strategies, and explicit math techniques, such as charting, underlining, and math paths. 1
Content analysis for year 1 student responses to pre- and post-assessments of application of math strategies has been completed, and findings indicate varying effects on student ability, which may correlate also with teacher competence and commitment. Those correlations will be completed during winter. Content analysis of year 1 Treatment students’ self-assessment indicates significant positive changes in students’ attitudes towards math and confidence to work more independently. The project research will include analyzing the year 2 students’ self-assessment and teacher responses to pre and post-assessments and also analyzing the correlation between students’ changes identified in the content analysis and teacher variables, particularly commitment and competence gains. Teacher Commitment and Teacher Competence Gain Analysis of Variance identified significant results from two teacher variables that were established for the project: commitment and competence gain. These tests use all grades together since there were not enough observations in each grade to do one analysis per grade. We could not compare gains across grades since different grades most likely have different ITBS gains. The following charts detail the components of the two variables: competence gain and commitment. Unlike other variables in the project (years of teaching, poverty level), both of these variables were controllable by teachers. They represent not only the entry level of teachers (in competence) but also the effort they devoted to learning and applying the principles and practices both of algebraic thinking and formative evaluation. The commitment variable is of particular importance as it represents fidelity of implementation. Teachers were classified at a level from 0 to 4, 0 meaning little or no evidence of competence, based on their demonstration of competence as measured by achievement on a pre and post-test of algebraic problem solving, demonstration of application of principles of formative evaluation in their work, and their responses to questions about effective teaching on an open-ended assessment administered three times during the project. Then a gain score was determined based on measures at the beginning and completion of the treatment. Teachers were also measured for commitment based on attendance to course sessions, completion of “homework”—application of the course contents in specific assignments, and implementation of the project in their classroom (as demonstrated by student work as well as teacher plans). 1 Analysis prepared by Vince Cyboran, Ed.D., Roosevelt University; the data were coded by the University of Chicago Survey Lab.

Solving the Math Problem 13
That measure was based on behaviors of teachers throughout the project, but it was a summative rating rather than a comparison score. The following charts list the basis on which these teacher characteristics were determined.
COMPETENCE AND COMMITMENT GAIN DETERMINATION
Initial Teacher Competence Points Attribute Basis for Assessment Knowledge of math at entry to program Pretest on Algebraic Problem Solving, including
ISAT math problem Emphasis on strategies of math vs. skills Pre-Assessment (assessment course) Responsiveness of learner needs Pre-Assessment (assessment course) and review
of initial lesson plans Knowledge of formative evaluation principles and practices
Pre-assessment (assessment course) and initial assessment plans for evidence of principles and practices of formative evaluation
Competence Development points Attribute Basis for Assessment Increase in knowledge of math during program
Post-Test
Emphasis on strategies of math vs. skills Pre-test, post-test (assessment course) Responsiveness to learner needs Quarterly assessment in formative evaluation
course and evaluation of lesson plans for evidence of application of formative evaluation findings
Knowledge of formative evaluation principles and practices
Quarterly assessment plans for representation of principles and practices of formative evaluation
Commitment Points Attribute Basis for Assessment Commitment to learning algebraic thinking Course learning logs
Course attendance (algebra courses) Algebra Course Homework—amount and level of work demonstrated
Commitment to applying formative evaluation to improve instruction
Course learning logs Course attendance (assessment course) Assessment Course Homework—amount and level of work demonstrated
Commitment to increasing diversity of teaching and learning activities
Representation of strategies modeled in courses in lesson plans
Commitment to increasing student independent competence in math
Representation of independent applications by students in quarter plans

Solving the Math Problem 14
One point is assigned to each of these components of the teacher rating. Two raters assessed the teachers’ status. First, they established consistency for rating, using a set of examples in each category to guide their decisions. An analysis of competence gain and of commitment and student achievement was conducted. The analysis of variance for cohort 1 shows that there is an association between the percentage of students at or above the norm in math and the teachers' commitment ratings. Subsequent t-tests show that there are significant differences between teachers with ratings of 1 and 4, and between ratings of 3 and 4. There were also significant associations between the percentage of students at or above the norm in math and the teachers' commitment ratings and the percentage of students meeting or exceeding ISAT standards in reading and the teachers' commitment ratings. Although the study does not deal with reading, that finding is included in this report as it may have some implications for analyzing the effects of teacher commitment and achievement in areas other than math. There is a significant association between the percentage of students meeting or exceeding ISAT standards in math and the teachers' competence gains. Subsequent t-tests show that there is a significant difference between competence gains of 1 and 2. In cohort 2, there is an association between competence gains and the percentage of students at or above the ITBS norm in math. T-tests show that there is a significant difference between competence gains of 0 and 1, and between 0 and 2. While these results are significant, a limitation must be noted. All of these tests could be corrupted by the relationship between achievement and poverty. Correlation of Characteristics of Teachers, Students, and Achievement When disaggregated into individual grade levels, the effect sizes are small. At some grade levels, there is evidence of an effect of the intervention. There is a difference between the two cohorts in terms of the gains and effect sizes, indicating a possibly greater effect for the year 2 treatment. Data that were obtained for both cohorts of treatment teachers indicate varying rates of gain at different grade levels in comparison with limited treatment and (for year 1) control. In 2004-5, the treatment group at grade 5 gain scores are lower than those of the control group. However, the treatment gains are higher than the control at grades 6 and 8. The gain of 14.56 by the treatment at grade 6 vs. the control of 10.58 has an effect size of 0.38. For the 8th grade, the gain is 17.93 for the treatment vs. 12.48 for control, with an effect size of 0.444. However, the Limited Treatment group made greater gains at grades 5 and 8 than the Treatment group, and the gain for grade 6 is very close. In both fifth and eighth grades, the treatment group didn't have significantly different ISAT scores than the Limited Treatment Group or Control Group. The difference between the Treatment and Limited Treatment gains are greater in year 2 than year 1. An analysis of the year 2 data, which are limited both by the lack of a control group and the fact that the test was not a “high stakes” test in that it was

Solving the Math Problem 15
administered only for the project and with no relationship to student or school status, indicate significantly greater gains for the treatment vs. limited treatment at grades 5 and 8. At grade 5, the gain for the Treatment, which had a prior achievement level lower than the Limited Treatment, is 20.15 vs. 10.91 for the Limited Treatment, with an effect size of 0.814. The 8th grade gain for the treatment was 10.38 vs. 8.36 for the Limited Treatment, with an effect size of 0.141. Sixth grade demonstrated the opposite pattern. For Limited Treatment, the gain was 16.19 vs. Treatment gain of 10.07, with an effect size of 0.449. The seventh grade comparison shows little difference and in fact a lower rate of gain than the other grade levels by both Treatment and Limited Treatment. To determine the potential causes of such effects, correlation of teacher and student variables were analyzed. The characteristics include: Student Characteristics Poverty level (based on percentage of free and reduced cost lunch) Bilingual level Teacher Characteristics Years of Teaching Experience Years of Teaching at Current School Years of Teaching within the Chicago Public School system Gender Teacher Development Participation in Professional Development on Math Prior to Program Number of Support Visits to Teacher Classroom by Program “Coach” That analysis has not provided any correlation of any of these characteristics with rate of achievement gain. Table 1 (following page) provides information about the correlations. The subsequent tables and graphs detail the analysis of the competence gains, commitment level, and other variables with the student achievement in math on ITBS for the two phases of the project.

Solving the Math Problem 16
Table 1: Analysis of Correlation of Characteristics and Student Achievement Gains For cohort 1, which completed the treatment during the 2004-5 academic year. Poverty level had a negative (but non-significant) correlation with percentage at or above ITBS math, percentage at or above ITBS reading, percentage meeting or exceeding ISAT math, and percentage meeting or exceeding ISAT reading, a positive (but non-significant) correlation with ITBS math gain and ITBS reading gain. Bilingual percentage of students had a positive (but non-significant) correlation with percentage at or above ITBS math, percentage at or above ITBS reading, and percentage meeting or exceeding ISAT reading, a negative (but non-significant) correlation with ITBS math gain and ITBS reading gain, and a positive (and significant) correlation with percentage meeting or exceeding ISAT math. Years of teaching had almost no correlation with percentage at or above ITBS math, percentage at or above ITBS reading, percentage meeting or exceeding ISAT reading and math, a negative and non-significant correlation with ITBS math gain and reading gain. Years of teaching at the current school had a positive and non-significant correlation with percentage at or above ITBS math, percentage at or above ITBS reading, ITBS math gain, ITBS reading gain, and percentage meeting or exceeding ISAT reading, and a negative and non-significant correlation with percentage meeting or exceeding ISAT math. Years of teaching in the Chicago public school system had a positive and non-significant correlation with percentage at or above ITBS math, percentage at or above ITBS reading, percentage meeting or exceeding ISAT reading and ISAT math, and a negative and non-significant correlation with ITBS math gain and ITBS reading gain. There were no significant differences between the genders of teachers in percentage meeting or exceeding ISAT math or reading, percentage at or above ITBS math or reading, or ITBS math or reading gains. There were no significant differences associated with receiving professional development in math prior to the treatment in percentage meeting or exceeding ISAT math or reading, percentage at or above ITBS math or reading, or ITBS math or reading gains. Visits by program “coach” had a negative and non-significant correlation with percentage at or above ITBS math, percentage at or above ITBS reading and percentage meeting or exceeding ISAT math, and a positive and non-significant correlation with ITBS math gain and reading gain and percentage meeting or exceeding ISAT reading.

Solving the Math Problem 17
Table 1 (continued) For cohort 2, which completed the treatment during the 2005-6 academic year. Poverty had a positive but non-significant correlation with percentage at or above ITBS math, and a negative but non-significant correlation with ITBS math gain. Bilingual percentage of students had a positive but non-significant correlation with percentage at or above ITBS math and ITBS math gain. Years of teaching had a positive but non-significant correlation with percentage at or above ITBS math, and a negative but non-significant correlation with ITBS math gain. Years of teaching at current school had a positive but non-significant correlation with percentage at or above ITBS math, and a negative but non-significant correlation with ITBS math gain. Years of teaching in the Chicago public school system had a negative but non-significant correlation with percentage at or above ITBS math and ITBS math gain. There were no significant differences between the genders of teachers in percentage at or above ITBS math or ITBS math gains. There were no significant differences associated with receiving professional development in math in percentage at or above ITBS math or ITBS math gains. Visits by program coach had a negative but non-significant correlation with percentage at or above ITBS math and ITBS math gain.

Solving the Math Problem 18
Year 1 Analysis ITBS Administered by Chicago Public School System, May 2005 Year 1 Treatment Group N = 331 students Year 1 Limited Treatment Group N = 233 students Year 1 Control Group N = All students at grade level indicated at
control schools Description Participating Students Analysis Grade 5 ITBS Math Gains, 2004 to 2005 for Treatment, Limited Treatment and Control Groups
Treatment Group N = 68 5th graders; Limited Treatment Group N = 78 5th graders; Control Group = all students in 5th grade classes at 6 matched schools
T gain = 14.15 LT gain = 15.15 C gain = 14.78 T-LT Effect Size = -0.085 T-C Effect Size = -0.056 LT-C Effect Size = 0.032
Grade 6 ITBS Math Gains, 2004 to 2005 for Treatment, Limited Treatment and Control Groups
Treatment Group N = 26 6th graders; Limited Treatment Group N = 81 6th graders; Control Group = all students in 6th grade classes at 6 matched schools
T gain = 14.56 LT gain = 14.47 C gain = 10.58 T-LT Effect Size = 0.009 T-C Effect Size = 0.38 LT-C Effect Size = 0.37
Grade 7 ITBS Math Gains, 2004 to 2005 for Treatment, Limited Treatment and Control Groups
Treatment Group N = 51 7th graders; Limited Treatment Group N = 25 7th graders; Control Group = all students in 7th grade classes at 6 matched schools
T gain = 11.47 LT gain = 10.36 C gain = 14.18 T-LT Effect Size = 0.083 T-C Effect Size = -0.187 LT-C Effect Size = -0.31
Grade 8 ITBS Math Gains, 2004 to 2005 for Treatment, Limited Treatment and Control Groups
Treatment Group N = 186 8th graders; Limited Treatment Group 05 N = 49 8th graders; Control Group = all students in 8th grade classes at 6 matched schools
T gain = 17.93 LT gain = 18.65 C gain = 12.48 T-LT Effect Size = -0.046 T-C Effect Size = 0.349 LT-C Effect Size = 0.444

Solving the Math Problem 19
Teacher Commitment—Treatment Group Only Grade 5 ITBS Math Gains, 2004 to 2005: Teacher Commitment Comparison (Commitment=3 vs. Commitment=4)
Teacher Commitment=3, N=19 5th Graders; Teacher Commitment=4, N=49 5th Graders
Grade 6 ITBS Math Gains, 2004 to 2005: Teacher Commitment Comparison (Commitment=1 vs. Commitment=4)
Teacher Commitment=1, N=2 6th Graders; Teacher Commitment=4, N=26 6th Graders
Grade 7 ITBS Math Gains, 2004 to 2005: Teacher Commitment Comparison (Commitment=1 vs. Commitment=2)
Teacher Commitment=1, N=1 7th Grader; Teacher Commitment=2, N=51 7th Graders
Grade 8 ITBS Math Gains, 2004 to 2005: Teacher Commitment Comparison (Commitment=3 vs. Commitment=4)
Teacher Commitment=3, N=32 8th Graders; Teacher Commitment=4, N=154 8th Graders
Analysis of Teacher Commitment and Student ITBS Gains Grade Commitment ITBS Math Gain Effect Size 5 3 vs 4 9.33 (3)
16.11 (4) 0.053
6 1 vs 4 10.5 (1) 14.14 (4)
0.046
7 1 vs 2 20 (1) 11.26 (2)
NA
8 3 vs 4 20.23 (3) 18.03 (4)
-0.008
Solving the Math Problem 20
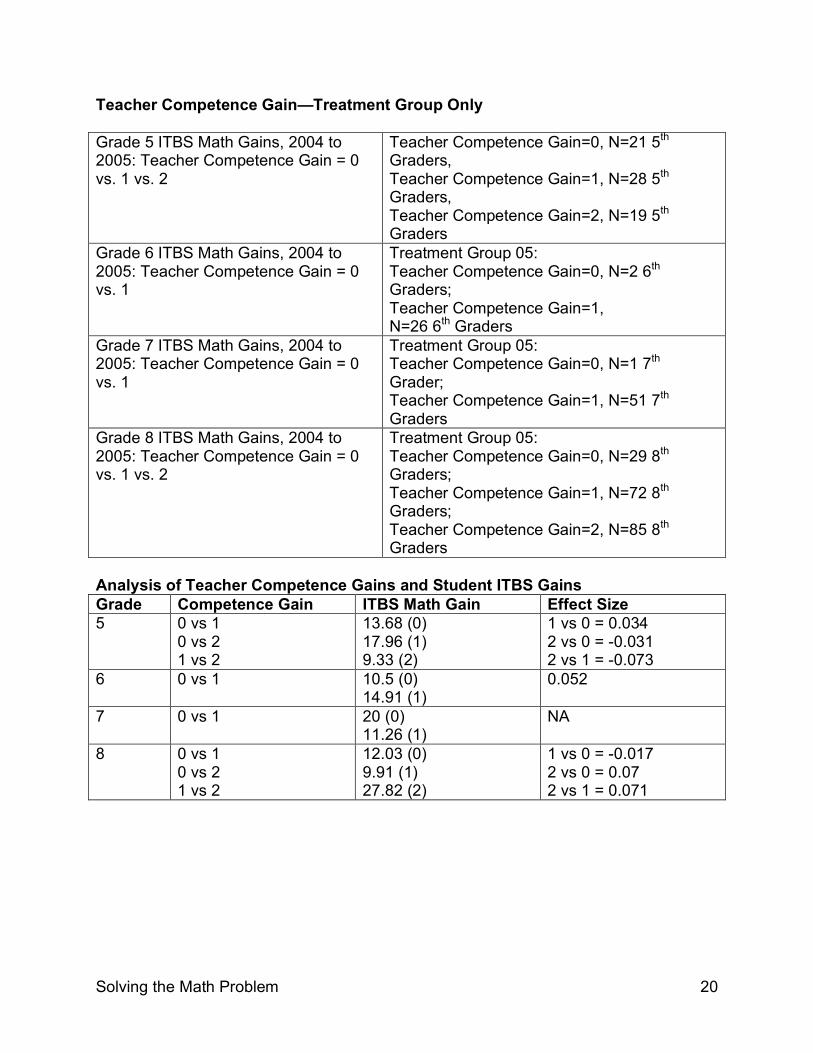
Teacher Competence Gain—Treatment Group Only Grade 5 ITBS Math Gains, 2004 to 2005: Teacher Competence Gain = 0 vs. 1 vs. 2
Teacher Competence Gain=0, N=21 5th Graders, Teacher Competence Gain=1, N=28 5th Graders, Teacher Competence Gain=2, N=19 5th Graders
Grade 6 ITBS Math Gains, 2004 to 2005: Teacher Competence Gain = 0 vs. 1
Treatment Group 05: Teacher Competence Gain=0, N=2 6th Graders; Teacher Competence Gain=1, N=26 6th Graders
Grade 7 ITBS Math Gains, 2004 to 2005: Teacher Competence Gain = 0 vs. 1
Treatment Group 05: Teacher Competence Gain=0, N=1 7th Grader; Teacher Competence Gain=1, N=51 7th Graders
Grade 8 ITBS Math Gains, 2004 to 2005: Teacher Competence Gain = 0 vs. 1 vs. 2
Treatment Group 05: Teacher Competence Gain=0, N=29 8th Graders; Teacher Competence Gain=1, N=72 8th Graders; Teacher Competence Gain=2, N=85 8th Graders
Analysis of Teacher Competence Gains and Student ITBS Gains Grade Competence Gain ITBS Math Gain Effect Size 5 0 vs 1
0 vs 2 1 vs 2
13.68 (0) 17.96 (1) 9.33 (2)
1 vs 0 = 0.034 2 vs 0 = -0.031 2 vs 1 = -0.073
6 0 vs 1 10.5 (0) 14.91 (1)
0.052
7 0 vs 1 20 (0) 11.26 (1)
NA
8 0 vs 1 0 vs 2 1 vs 2
12.03 (0) 9.91 (1) 27.82 (2)
1 vs 0 = -0.017 2 vs 0 = 0.07 2 vs 1 = 0.071

Solving the Math Problem 21
Fifth Grade ITBS Math Gains: 2004 to 2005 Comparisons Treatment, Limited Treatment, and Control Groups (YEAR 1)

Solving the Math Problem 22
Sixth Grade ITBS Math Gains: 2004 to 2005 Comparisons Treatment, Limited Treatment, and Control Groups (YEAR 1)

Solving the Math Problem 23
Seventh Grade ITBS Math Gains: 2004 to 2005 Comparisons Treatment, Limited Treatment, and Control Groups (YEAR 1)

Solving the Math Problem 24
Eighth Grade ITBS Math Gains: 2004 to 2005 Comparisons Treatment, Limited Treatment, and Control Groups (YEAR 1)

Solving the Math Problem 25
Fifth Grade ITBS Math Gains: 2004 to 2005 (YEAR 1) Teacher Commitment=3 vs. Teacher Commitment=4

Solving the Math Problem 26
Sixth Grade ITBS Math Gains: 2004 to 2005 (YEAR 1) Teacher Commitment=1 vs. Teacher Commitment=4

Solving the Math Problem 27
Seventh Grade ITBS Math Gains: 2004 to 2005 (YEAR 1) Teacher Commitment=1 vs. Teacher Commitment=2

Solving the Math Problem 28
Eighth Grade ITBS Math Gains: 2004 to 2005 (YEAR 1) Teacher Commitment=3 vs. Teacher Commitment=4

Solving the Math Problem 29
Fifth Grade ITBS Math Gains: 2004 to 2005 (YEAR 1) Teacher Competence Gain = 0 vs. 1 vs. 2

Solving the Math Problem 30
Sixth Grade ITBS Math Gains: 2004 to 2005 (YEAR 1) Teacher Competence Gain = 0 vs. 1

Solving the Math Problem 31
Seventh Grade ITBS Math Gains: 2004 to 2005 (YEAR 1) Teacher Competence Gain = 0 vs. 1

Solving the Math Problem 32
Eighth Grade ITBS Math Gains: 2004 to 2005 (YEAR 1) Teacher Competence Gain = 0 vs. 1 vs. 2

Solving the Math Problem 33
Year 2 (2005-6) Analysis
ITBS Test Administered by Project, May 2006 Year 2 Treatment Group N = 325 students Year 2 Limited Treatment Group N = 218 students No control group available at this time—ITBS not given citywide; when ISAT data from spring 2006 administration are available those data will be used to analyze Treatment, Limited Treatment, and Control Groups. ITBS data do not include three classes that were tested by CPS and therefore not able to complete the project test. CPS is not releasing the ITBS data for those classes. Description 06 Treatment Group and Limited
Treatment Group Analysis
Grade 5 ITBS Math Gains, 2005 to 2006 for Treatment and Limited Treatment Groups
Treatment Group 06 N=76 5th graders; Limited Treatment Group 06 N=67 5th graders
T gain = 20.15 LT gain = 10.91 Effect Size = 0.814
Grade 6 ITBS Math Gains, 2005 to 2006 for Treatment and Limited Treatment Groups
Treatment Group 06 N=71 6th graders; Limited Treatment Group 06 N=62 6th graders
T gain = 10.07 LT gain = 16.19 Effect Size = -0.449
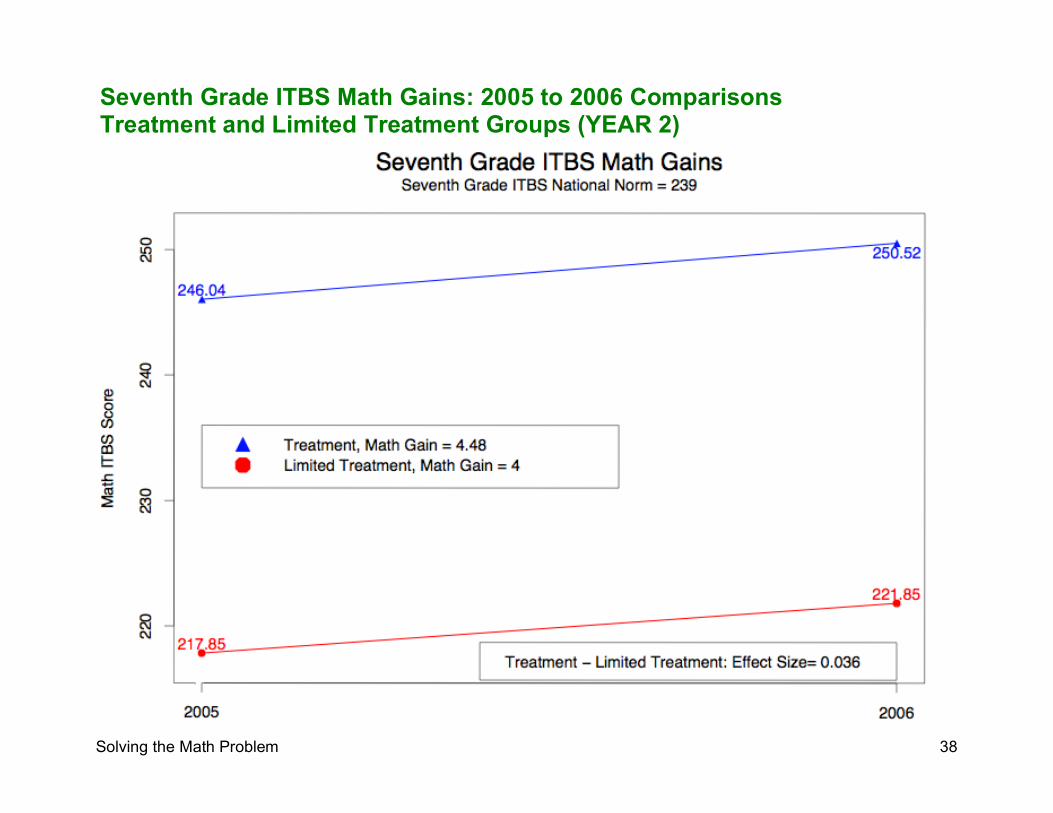
Grade 7 ITBS Math Gains, 2005 to 2006 for Treatment and Limited Treatment Groups
Treatment Group 06 N=28 7th graders; Limited Treatment Group 06 N=43 7th graders
T gain = 4.48 LT gain = 4 Effect Size = 0.036
Grade 8 ITBS Math Gains, 2005 to 2006 for Treatment and Limited Treatment Groups
Treatment Group 06 N=150 8th graders; Limited Treatment Group 06 N=46 8th graders
T gain = 10.38 LT gain = 8.36 Effect Size = 0.141

Solving the Math Problem 34
Teacher Commitment—Treatment Group Only Grade 6 ITBS Math Gains, 2005 to 2006: Teacher Commitment Comparison (Commitment=3 vs. Commitment=4)
Treatment Group 06: Teacher Commitment=3, N=17 6th Graders; Teacher Commitment=4, N=54 6th Graders
Grade 8 ITBS Math Gains, 2005 to 2006: Teacher Commitment Comparison (Commitment=1 vs. 3 vs. 4)
Treatment Group 06: Teacher Commitment=1, N=25 8th Graders; Teacher Commitment=3, N=50 8th Graders; Teacher Commitment=4, N=75 8th Graders
Analysis of Teacher Commitment and Student ITBS Gains Grade Commitment ITBS Math Gain Effect Size 6 3 vs 4 5.18 (3)
11.74 (4) 0.032
8 1 vs 3 1 vs 4 3 vs 4
6.45 (1) 4.23 (3) 15.72 (4)
4 vs 3: 0.059 4 vs 1: 0.057 3 vs 1: -0.017
There was only one seventh grade teacher, so there is no basis for comparison. All three fifth grade teachers had the same commitment level, so there also is no basis for comparison.

Solving the Math Problem 35
Teacher Competence Gain—Treatment Group Only Grade 5 ITBS Math Gains, 2005 to 2006: Teacher Competence Gain = 1 vs. 2
Treatment Group 06: Teacher Competence Gain=1, N=19 5th Graders; Teacher Competence Gain=2, N=57 5th Graders
Grade 6 ITBS Math Gains, 2005 to 2006: Teacher Competence Gain = 0 vs. 1 vs. 2
Treatment Group 06: Teacher Competence Gain=0, N=17 6th Graders; Teacher Competence Gain=1, N=25 6th Graders; Teacher Competence Gain=2, N=29 6th Graders
Grade 8 ITBS Math Gains, 2005 to 2006: Teacher Competence Gain = 0 vs. 1 vs. 2
Treatment Group 06: Teacher Competence Gain=0, N=25 8th Graders; Teacher Competence Gain=1, N=74 8th Graders; Teacher Competence Gain=2, N=51 8th Graders
Analysis of Teacher Competence Gain and Student ITBS Gains Grade Competence Gain ITBS Math Gain Effect Size 5 1 vs 2 13.3 (1)
21.38 (2) 0.065
6 0 vs 1 0 vs 2 1 vs 2
5.18 (0) 1.68 (1) 19.64 (2)
1 vs 0 = -0.024 2 vs 0 = 0.079 2 vs 1 = 0.15
8 0 vs 1 0 vs 2 1 vs 2
6.45 (0) 11.09 (1) 11.27 (2)
1 vs 0 = 0.023 2 vs 0 = 0.043 2 vs 1 = 0.001
There was only one seventh grade teacher, so there is no basis for comparison.

Solving the Math Problem 36
Fifth Grade ITBS Math Gains: 2005 to 2006 Comparisons Treatment and Limited Treatment Groups (YEAR 2)

Solving the Math Problem 37
Sixth Grade ITBS Math Gains: 2005 to 2006 Comparisons Treatment and Limited Treatment Groups (YEAR 2)
Solving the Math Problem 38
Seventh Grade ITBS Math Gains: 2005 to 2006 Comparisons Treatment and Limited Treatment Groups (YEAR 2)

Solving the Math Problem 39
Eighth Grade ITBS Math Gains: 2005 to 2006 Comparisons Treatment and Limited Treatment Groups (YEAR 2)

Solving the Math Problem 40
Sixth Grade ITBS Math Gains: 2005 to 2006 (YEAR 2) Teacher Commitment=3 vs. Teacher Commitment=4

Solving the Math Problem 41
Eighth Grade ITBS Math Gains: 2005 to 2006 (YEAR 2) Teacher Commitment=1 vs. 3 vs. 4

Solving the Math Problem 42
Fifth Grade ITBS Math Gains: 2005 to 2006 (YEAR 2) Teacher Competence Gain = 1 vs. 2

Solving the Math Problem 43
Sixth Grade ITBS Math Gains: 2005 to 2006 (YEAR 2) Teacher Competence Gain = 0 vs. 1 vs. 2

Solving the Math Problem 44
Eighth Grade ITBS Math Gains: 2005 to 2006 (YEAR 2) Teacher Competence Gain = 0 vs. 1 vs. 2
Solving the Math Problem 45
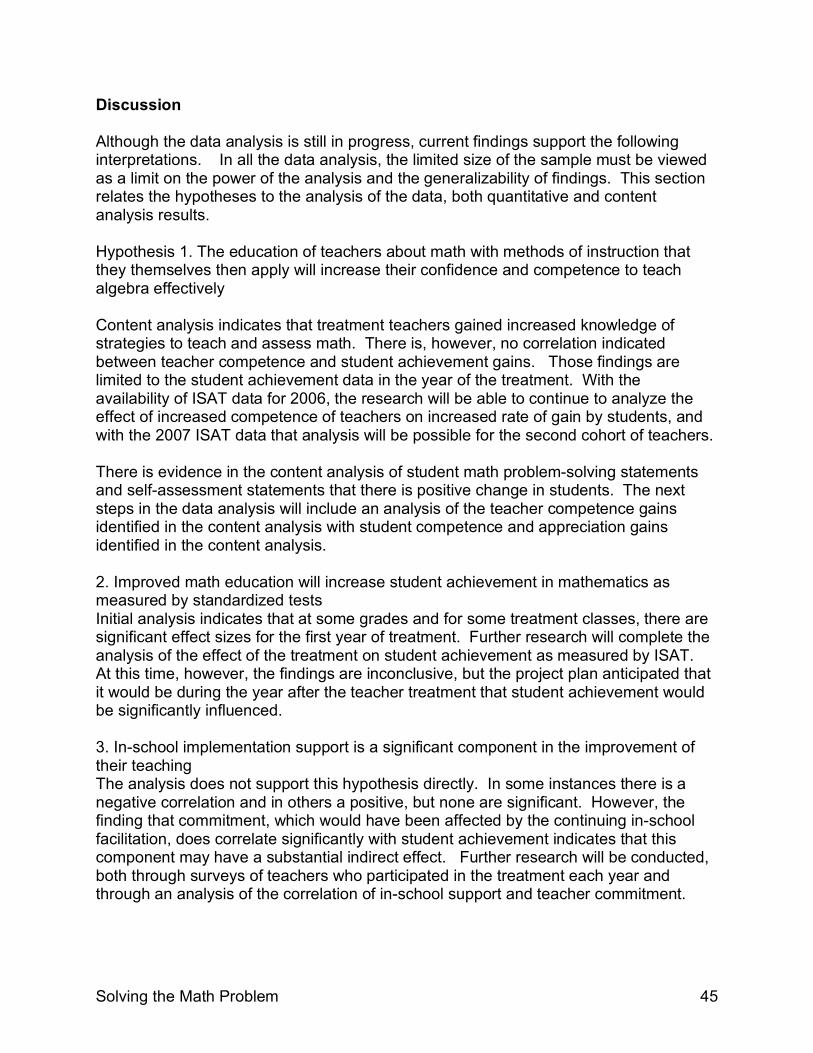
Discussion Although the data analysis is still in progress, current findings support the following interpretations. In all the data analysis, the limited size of the sample must be viewed as a limit on the power of the analysis and the generalizability of findings. This section relates the hypotheses to the analysis of the data, both quantitative and content analysis results. Hypothesis 1. The education of teachers about math with methods of instruction that they themselves then apply will increase their confidence and competence to teach algebra effectively Content analysis indicates that treatment teachers gained increased knowledge of strategies to teach and assess math. There is, however, no correlation indicated between teacher competence and student achievement gains. Those findings are limited to the student achievement data in the year of the treatment. With the availability of ISAT data for 2006, the research will be able to continue to analyze the effect of increased competence of teachers on increased rate of gain by students, and with the 2007 ISAT data that analysis will be possible for the second cohort of teachers. There is evidence in the content analysis of student math problem-solving statements and self-assessment statements that there is positive change in students. The next steps in the data analysis will include an analysis of the teacher competence gains identified in the content analysis with student competence and appreciation gains identified in the content analysis. 2. Improved math education will increase student achievement in mathematics as measured by standardized tests Initial analysis indicates that at some grades and for some treatment classes, there are significant effect sizes for the first year of treatment. Further research will complete the analysis of the effect of the treatment on student achievement as measured by ISAT. At this time, however, the findings are inconclusive, but the project plan anticipated that it would be during the year after the teacher treatment that student achievement would be significantly influenced. 3. In-school implementation support is a significant component in the improvement of their teaching The analysis does not support this hypothesis directly. In some instances there is a negative correlation and in others a positive, but none are significant. However, the finding that commitment, which would have been affected by the continuing in-school facilitation, does correlate significantly with student achievement indicates that this component may have a substantial indirect effect. Further research will be conducted, both through surveys of teachers who participated in the treatment each year and through an analysis of the correlation of in-school support and teacher commitment.

Solving the Math Problem 46
Fidelity of implementation was identified as a significant variable positively correlated with achievement gains, as represented by the commitment of teachers. It is possible to extrapolate from that finding that the treatment has potentially significant effects if implemented consistently. That conclusion actually could then support the other hypotheses. However, it also is an indication of the vulnerability of this research of any other school-based research to the decisions of teachers about their commitment to implementation. Ironically, a factor that may have reduced commitment is the emphasis of the school system on standards-based math education. In fact, 6 of the 10 teachers who left the treatment stated that their reason for leaving was that they could not apply the current math focuses of the sessions because they had too much math to “cover” in their teaching. It is ironic in that the treatment emphasizes Illinois and NCTM standards for math—and Illinois and NCTM standards for math instruction. However, the teachers who expressed concern about the need to cover more content may have been reflecting a problem that NCTM recognized and addressed in 2006 with the publication of Curriculum Focal Points. “As states and local school districts implement more rigorous assessment and accountability systems, teachers often face long lists of mathematics topics or learning expectations to address at each grade level, with many topics repeating from year to year. Lacking clear, consistent priorities and focus, teachers stretch to find the time to present important mathematical topics effectively and in depth.” (NCTM). Current Conclusions and Recommendations The project can contribute to research and practice based on current findings. Based on the evidence of increased student appreciation of math and increased ability to communicate effective strategies for problem-solving, the project resources that directly relate to kinds of student learning and problem solving may be of use. The project website is being organized and will be accessible at the time of the session. The frameworks and blueprints that can be incorporated in teacher education at the graduate and undergraduate level are being input into the site. Urban Potholes The project encountered obstacles to implementation that are in effect urban “potholes” obstacles to professional development in urban schools such as conflicting priorities for curriculum, limited teacher qualifications (as reflected in teachers who were insufficiently prepared to study algebra). These obstacles are not unique to urban schools but are intense in the urban school that serves a poverty-level community and often has difficulty recruiting and retaining teachers. These limits also affect research projects. One project lesson is to include as many as 1/3rd more teachers in a professional development research project to obtain the sample size needed for analysis. A more significant finding for professional development is that there seems to be an almost bi-modal population of teachers in terms of knowledge and ability to teach mathematics.

Solving the Math Problem 47
That finding has implications for professional development. Just as there is no one math program that fits all elementary students (otherwise it would be in use in every US school), there probably is no one professional development curriculum that will enable all teachers in a school to gain competence in math education. Implications for Teacher Education Teachers in the project commented on the usefulness of linking the classwork to their teaching, so having a job-embedded approach contributed to the project’s acceptance. In terms of teacher educators, the finding that a teacher workshop should relate to the teacher’s classroom agenda is a well-established principle. This project determined that a course that correlates with the classroom agenda is valued by teachers. That teachers who left the treatment did so because they did not perceive a relationship between the content of the class sessions and their own class instruction indicates that this relationship—or lack of it--is a determinant for involvement by teachers. Probably the most significant implication of this study is for pre-service teacher education. Until the gap between teacher knowledge and ability to teach math is reduced, student achievement will continue to lag in urban schools such as the schools that participated in this study. During recent years, studies have determined that incoming elementary teachers lack the depth of knowledge about math that they need in order to teach it effectively. Schools of Education have an opportunity to rethink their curricula in terms of content of math in collaboration with Colleges of Liberal Arts and Sciences. And they can adjust the course work so that students have opportunities to participate in application of the math they learn in math courses at college to the math they will teach in schools. No Child Left Behind seems to be about to be renewed though revised. If it continues to require supplemental services, then Schools of Education could address the math shortage (limited teacher knowledge and teaching strategies) by organizing a student teaching corps that provided preservice teachers with an ongoing role in working with elementary students on improving math. That innovation would take substantial effort, but it would contribute to solving the math problem systematically. Only if the teachers who come to schools to teach are prepared to meet the math learning challenges of their students will this problem diminish. Until that progress takes place, the problem multiplies.

Solving the Math Problem 48
References Driscoll, Mark. (1999). Fostering Algebraic Thinking: A Guide for Teachers, Grades 6-
10. Portsmouth: Heinemann. McNeil, Michele. (2006). Glitches, Data Errors Delay Illinois Test-Score Release.
Education Week, 26 (14), 20. National Council of Teachers of Mathematics (2006). Curriculum Focus Points for
Prekindergarten through Grade 8 Mathematics: A Quest for Coherence. Reston, VA: NCTM, vii.
Nye, B., Konstantopoulos, S., & Hedges, L. V. (2004). How large are teacher effects? Educational Evaluation and Policy Analysis, 26, 237-257.
Sanders, W. & Rivers, J. (1996). Cumulative and residual effects of teachers on future
student academic achievement. Knoxville, TN: University of Tennessee. Sparks, D. (2003) What Teachers Know and Don’t Know Matters. Harvard Education
Letter, 5.

Solving the Math Problem 49
Appendixes The following two papers provide information on the content analyses that have been conducted for the project. Appendix 1: Preliminary Findings: Content Analysis of Algebra Connections Student and Teacher Responses Appendix 2: Analysis of Student Math Responses

Solving the Math Problem 50
Appendix 1 Preliminary Findings: Content Analysis of Algebra Connections Student and Teacher Responses Vince Cyboran, Roosevelt University, Chicago, June 2006 The Voices of the Teachers in the Treatment Group: What Teachers Say about Teaching Math A content analysis was conducted on responses to three questions posed only to teachers in the treatment condition prior to and following the treatment: 1) “List three important outcomes for teaching mathematics to students in grades 5-8.” 2) “What are three things that make a math lesson effective?” and 3) “What do you think are some effective strategies for helping students who are having difficulties learning mathematics?” These questions were designed to help teachers to clarify their own thinking about their teaching practices. The following section presents for each question the code categories developed from an analysis of teacher responses, along with examples of the code from the teacher responses or definitions of the codes. This is followed by a brief interpretation of the findings. 2 Question 1: “List three important outcomes for teaching mathematics to students in grades 5-8.” Teachers’ written responses to Question 1 were organized into six categories. Table 1 shows the response code categories developed for Question 1, along with examples of the code from the teacher responses. Table 1. Codes for Teacher Question 1 with Examples Q1. “List three important outcomes for teaching mathematics to students in grades 5-8.” Code Examples Student Knowledge Concepts, equations Student Attitudes/Beliefs Comfort, confidence Student Techniques Problem solving strategies Student Outcomes Increased computational rate; critical
thinking Teacher Techniques Assign more problems Other Anything else not fitting above
2 The data were coded by the University of Chicago Survey Lab.

Solving the Math Problem 51
Table 2 summarizes the results of the changes identified from the pre-test to the post-test. Table 2. Summary of Pre to Post Changes in Codes for Question 1 Code Pre-Test
Frequency Post-Test Frequency
Difference
Q1 Student Attitudes and Beliefs 8 9 1
Q1 Student Knowledge 10 6 -4
Q1 Student Outcomes 6 6 0
Q1 Student Techniques and Processes 10 9 -1 Q1 Teacher Techniques 1 1 0 Discussion of Question 1 Results Teachers initially believed the three most important outcomes to be “Student Attitudes and Beliefs” (n=8), “Student Knowledge” (n=10), and “Student Techniques and Processes” (n=8). Following the treatment, these remained important outcomes. The most changed result was “Student Knowledge”, decreasing from an n of 10 to an n of 6. Teachers did not believe that their own techniques, such as assigning more problems, were an important outcome. Question 2: “What are three things that make a math lesson effective?” Teachers’ written responses to Question 2 were organized into ten categories, including ‘Other.’ Table 3 shows the response code categories developed for Question 2, along with examples of the code from the teacher responses. Table 3. Codes for Teacher Question 2 with Examples Q2 “What are three things that make a math lesson effective?” Code Examples Social Learning Group work, peer tutors Active Learning Manipulatives, hands-on, apply Student attitudes or beliefs Comfort, feel good Content of teaching Introduce vocabulary, introduce concepts Instruction type One-on-one, model for students Planning Selecting good problems Student demonstration of knowledge or skills
Students explain, see student comprehension and application
Lesson Descriptors Engaging, fun Other Anything else not fitting above

Solving the Math Problem 52
Table 4 summarizes the results of the changes identified from the pre-test to the post-test. Table 4. Summary of Pre to Post Changes in Codes for Question 2 Code Pre-Test
Frequency Post-Test Frequency
Difference
Q2 Active learning 6 11 5
Q2 Content of teaching 2 2 0
Q2 Instruction type 5 9 4
Q2 Lesson descriptors 7 2 -5
Q2 Planning 2 6 4
Q2 Social learning 6 9 3
Q2 Student attitudes or beliefs 2 0 -2 Q2 Student demonstration of knowledge or skills 6 10 4 Teacher responses indicate the most important items for effective lessons were “Active learning”, “Planning”, “Social learning”, and “Instruction type.” The most changed item was “Active learning”, cited by 11 out of 14 teachers on the post-test. This item is supported by similar changes in “Social learning” and “Student demonstration of knowledge or skills”. Interestingly, on the pre-test, only two teachers cited planning as important; this changed to an n of 6 on the post-test.

Solving the Math Problem 53
Question 3: “What do you think are some effective strategies for helping students who are having difficulties learning mathematics?” Teachers’ written responses to Question 3 were organized into ten categories. Table 5 shows the response code categories developed for Question 3, along with examples of the code from the teacher responses. Table 5. Codes for Teacher Question 3 with Definitions Q3 “What do you think are some effective strategies for helping students who are having difficulties learning mathematics?” Codes Definition
Peer interaction
Peer tutors, peer coaching, pair strong student with weaker student, study buddy, cooperative/collaborative groups, discussion, peer communication, group projects, flexible groups
Student-initiated cognitive/meta-cognitive techniques
Math journals, write steps, draw problem, student provides oral explanation of problem, student provides written explanation of problem solving, create own problems, using prior knowledge, student logs, students choose form of assessment
Practice Students need to practice, try more problems, learn rules, let students work through the problems
Teacher directed instruction
One-on-one teaching, teacher tutoring of student, leading students to final solution, modeling a problem, presentation of terms from tests, small group instruction
Teacher diagnosis techniques
Oral or written assessment, locate patterns of error, re-testing
Reframing/repetition techniques
Break down into smaller steps, slow down, fewer problems, simpler problems, repeat problems, draw connections to other problems, different explanation, try different approach, restating problem, re-teach lesson
Affect /Body language
Smile, be encouraging, patience
Teaching to multiple learning modalities
Manipulatives (hands-on applications), models, presenting info in multiple formats, visuals, technology
Teacher instruction of cognitive/meta-cognitive techniques
Math path, flow chart, mnemonics, provide students with multiple [problem solving] strategies, teaching student to “undo” solution
Examples/applications Real world applications, relate math to students’ lives, story problems, projects

Solving the Math Problem 54
Table 6 summarizes the results of the changes identified from the pre-test to the post-test for Question 6. Table 6. Summary of Pre to Post Changes in Codes for Question 3 Code Pre-Test
Frequency Post-Test Frequency
Difference
Q3 Affect 1 0 -1
Q3 Examples and applications 3 3 0
Q3 Peer interaction 6 11 5
Q3 Practice 2 0 -2
Q3 Reframing / repetition techniques 2 4 2 Q3 Student initiated cognitive or meta-cognitive techniques
6 2 -4
Q3 Teacher diagnostic techniques 2 2 0
Q3 Teacher direct instruction 4 4 0 Q3 Teacher instruction of cognitive or meta-cognitive techniques
1 2 1 Q3 Teaching to multiple learning modalities 5 7 2 The teachers initial responses focused on “Peer interaction” (n=6), “Student initiated cognitive or meta-cognitive techniques” (n=6), and “Teaching to multiple learning modalities” (n = 5). By the time of the post-test, during which teachers were completing their coursework in responsive assessment, there was a greater emphasis placed on “Peer interaction” (n=11) and “Teaching to multiple learning modalities” (n = 7); there was less emphasis placed on “Student initiated cognitive or meta-cognitive techniques” (n=2). Comparison of teacher responses across the three questions When comparing teacher responses across the three questions, it became clear that there were some items on which teacher responses were consistent and some items on which teacher responses were inconsistent. Teachers were consistent in mentioning ‘Instruction type’ on Question 2 (pre-test n=5; post-test n=9). This is consistent with the importance given to the item ‘Teaching to multiple learning modalities on Question 3 (pre-test n=5; post-test n=7). Both items were important pre and post and showed an increase. Similar results are found for the items ‘Social learning’ from Question 2 (pre-test n=6; post-test n=9) and “Peer interaction’ from Question 3 (pre=-test n=6; post-test n=11). A notable inconsistency was found for the items “Student Attitudes and Beliefs” from Question 1 (pre-test n=8; post-test n=9) and “Student Attitudes or Beliefs” from Question 2 (pre-test n=2; post-test n=0). For Question 1, the item was deemed

Solving the Math Problem 55
important on both the pre- and post-tests, and showed an increase. On Question 2, this item was deemed relatively unimportant on both the pre-test and post-test; in addition, the item showed a decrease between the tests. The Voices of the Students: Students Write about Solving Math Problems A content analysis was conducted on responses to problems assigned to students during the pre-treatment stage and during the post-treatment stage. The content analysis was concerned with the students’ thinking and elaboration of problem solving: it did not take into account whether or not students solved the problems correctly. During the pre-treatment stage, teachers administered one of the following three problems to their students: The Babysitter Problem: The baby-sitter had no money on Monday. Then the babysitter earned $9.00 on Tuesday, spent $6.00 on Wednesday, earned $8.00 on Thursday, and $6.00 on Friday. How much money did the babysitter have then?
The Garage Problem: A parking garage charges $8.50 for the first hour and $2.75 for each additional hour or part of an hour. How much will it cost to park in the garage for 6 hours?
The Sticker Problem: The school store has two kinds of stickers. The star stickers cost 15 cents each. The dragon stickers cost 10 cents each. Maria has $1. She wants to spend it all to buy stickers. She wants both kinds of stickers. How many of each sticker will she buy?
During the post-treatment stage, teachers administered the following problem to their students: The CD Player Problem: Maria wants to buy a CD player that costs $240. She has saved $20 each week for 3 weeks. How many more weeks does Maria need to save money if she continues to save $20 each week?

Solving the Math Problem 56
Scaffolding of Problem Worksheets The worksheets used by students during the pre-treatment stage provided explicit prompts, encouraging students to write. In addition, the problem is boxed, visually separating it from the student work area, thus commanding visual attention, a technique especially useful for students with visual/spatial problems. For example, the worksheet for “The Babysitter Problem” looked like this:

Solving the Math Problem 57
The worksheets used by students during the post-treatment stage provided fewer prompts. Students had been practicing writing about how they solved problems, so they were expected to provide explanations with fewer prompts. The worksheet for “The CD Player Problem” looked like this:

Solving the Math Problem 58
Codes: Students written responses to the math problems were organized into nine categories, including “No response.” Table 7 depicts the coding scheme for student responses to the math problems. As much as possible, the codes represent a hierarchy from lower to higher-order reasoning skills. Table 7. Coding Scheme for Math Problems Code Name Code Description NONE No response at all
LACKSEQ No sequential steps provided (almost all students do this, so coding the
few cases who don’t seems more revealing than coding the vast majority who do).
WHY Justification of answer. Provides a reason for having done it a certain way. Statements include such things as “because it is easier” “because we were taught this way” “to check my work”.
RESTATE Clarification or restatement of the problem. Possible statements include “the problem says,” “they asked for,” “they started with.”
BADPLAN Student clearly has an approach or plan but it is incorrect. This does not refer to computational errors, but to errors in the set up of the problem. For example, “I multiplied 2.75 and 6 and added $8.50 because you have to add $8.50 to get this product.” The student has a plan for getting the answer that is fairly explicit, yet s/he misses that $2.75 should be multiplied by 5 instead of 6.
INCOMPLETE Students has completed some steps toward a right answer but stops before reaching correct answer.
STRATEGY Student has an implied or stated strategy that is not a specific, named technique. The coder has to infer some pieces of the plan. For example, “I add 15 four times and it comes up to 60. Then I add ten four times and it comes up to 40. Then I add 60 and 40 and came up to a dollar”. This implies a strategy of adding up until the numbers seem in the correct ballpark, working toward an even dollar. This is more implied or vague than logic.
LOGIC Student explains the explicit logic behind the steps they took. This is NOT a simplistic statement of numerical calculations (e.g. I subtracted 6 from 9 to get 3) but a higher order reference to a strategy or method such as “I did it this way because there was a pattern” “I repeated these steps again to get the answer” “I did it two ways” “I wanted to go in order”.
TECHNIQUE Student references a specific technique taught in the classroom. These include chart, math path, guess and check, reading and extracting relevant information.

Solving the Math Problem 59
The following table provides a summary of changes noted by the coders from the students’ pre-test to post-test responses. Table 8. Change in Percent of Students with Various Codes from Pre to Post Test by Classroom and Treatment/Limited Treatment Status
Classrooms with Increased* Percent
at Post-Test
Classrooms with No Change* at
Post-Test
Classrooms with Decreased*
Percent at Post-Test
Code Treatment Limited Treatment
Treatment Limited Treatment
Treatment Limited Treatment
No answer
29% (N=4)
10% (N=1)
36% (N=5)
40% (N=4)
36% (N=5)
50% (N=5)
Lack sequential steps
64% (N=9)
70% (N=7)
21% (N=3)
30% (N=3)
14% (N=2)
0% (N=0)
Justify answer
7% (N=1)
80% (N=8)
0% (N=0)
10% (N=1)
93% (N=13)
10% (N=1)
Restate question
7% (N=1)
60% (N=6)
14% (N=2)
30% (N=3)
79% (N=11)
10% (N=1)
Incorrect logic
21% (N=3)
90% (N=9)
21% (N=3)
10% (N=1)
57% (N=8)
0% (N=0)
Incomplete logic
93% (N=13)
100% (N=10)
0% (N=0)
0% (N=0)
7% (N=1)
0% (N=0)
Implied strategy
64% (N=9)
60% (N=6)
0% (N=0)
0% (N=0)
36% (N=5)
40% (N=4)
Correct logic
21% (N=3)
30% (N=3)
21% (N=3)
30% (N=3)
57% (N=8)
40% (N=4)
Named technique
36% (N=5)
40% (N=4)
50% (N=7)
30% (N=3)
14% (N=2)
30% (N=3)
* An increase is defined as a positive change of more than 3 percentage points, and a decrease as a negative change of more than 3 percentage points when comparing classrooms between the pre- and post- tests. A positive or negative change of less than 3 percentage points is considered no change. For the treatment group, positive changes are found in increases of the following items: restate question (7%), implied strategy (64%), correct logic (21%) and named technique (36%). Positive changes are also found in decreases of the following variables: no

Solving the Math Problem 60
answer (36%), lack sequential steps (14%) incorrect logic (57%), and incomplete logic (7%). Such changes seem to indicate an improvement in student problem-solving skills. Clearly, there is a great deal of variation among the students in the limited treatment group. This group also experienced positive changes, which may be due, in part, to their math writing practice. Students’ Problem Solving A solid and growing body of research on problem solving, particularly in the area of algebra and pre-algebra, has focused on the usage of concept formation and schemas by students (Lee and Wheeler, 1987; Marshall, 1995; Silver and Cai, 1996; Steele and Johanning, 2004). A separate, but related, strand of research has extended this focus to bridge the gap between schema development and instructional practices, often focusing on the schema development of teachers (Borko and Livingston; Hutchinson). In addition, substantive research has focused on schema development and cognitive strategies for students with learning problems (Garcia, et. al., 2006; Hutchinson, 1993). Our goal in establishing a framework for inquiry was to explicitly avoid the problems of dispute in defining the term “schema” and to avoid mapping particular schemas with instructional techniques with the particular types of mathematical problems to be solved. Such avoidance affords broader generalization of results to school districts/populations without recommending specific math products/texts/series, etc. The theoretical basis underpinning the framework of inquiry for this project/study stems primarily from two existing models: Marshall’s (1995) work on schema development in problem solving and Neuman and Schwarz’s categories of self-explanation (1998, 2000). Brief explanations of their models and the rationale for combining them can be found below. In her 1995 text, Schemas in Problem Solving, Marshall provides a thorough discussion of the history of schemas and schema research in philosophy and psychology. To reconcile the differences among philosophers and psychological and educational researchers, she has adopted the following definition of schema: “…a vehicle of memory, allowing organization of an individual’s similar experiences in such a way that the individual…”(p. 39). We chose Marshall’s work first because she recognizes that “schemas organize knowledge stored in memory. Thus, they provide the necessary scaffolding for a domain, and, as such, they will serve as supports for future instruction and learning” (p. 113). Second, she is particularly interested in schemas formed in the solving of story/word problems, particularly as they are developed in middle school students. Specifically, she establishes a developmental model of schema formation, using the following categories: identification, elaboration, planning, and execution. “Identification” knowledge is defined as “pattern recognition” and “contributes to the initial recognition of a situation, event, or experience”. “Elaboration” knowledge “contains elaborations about the main features of the situation or event…” and “It is primarily declarative.” “Planning” knowledge is defined as “the way in which the schema can be used to make plans, create expectations, and set up goals and subgoals”. “Execution” knowledge “allows the individual to carry out the steps of the plans. It consists of techniques that lead to action…”.

Solving the Math Problem 61
Neuman and Schwarz’s work has focused on the role of self-explanation, which they define as “a general term for different modes of verbal mediation that support the transformation of a problem from its initial state (e.g., the story form in a word problem) to its goal state (e.g., the numeric solution of a word problem) (p. 200). As they note, “Researchers have shown that self-explanations during learning or problem solving are positively correlated with learning and problem-solving measures” (p. 197). Neuman and Schwarz suggest three broad categories of self-explanation: clarification, inference, and justification. “Clarification” entails “explaining the problem space.” “Justification” entails “giving reasons that a particular solution step was taken.” “Inference” entails “generating new knowledge having the general form of ‘If…then.’” Though Neuman and Schwarz seek to categorize learners into “good” and “poor” problem solvers based upon the particular categories of and success with self-explanations used, our interest was simply the usage of self-explanation as a means of revealing and perhaps directing students’ strategies for solving word problems. The combination of Marshall’s model and Neuman and Schwarz’s model, though similar in many respects, provides us with a broader perspective than could be obtained from either model alone. The combinatorial model informed, but did not dictate, the eventual categories used in the content analysis; the final coding categories emerged from the data. Students’ Beliefs about Math and about Learning Math Students’ dispositional beliefs about mathematics and learning mathematics can be readily determined by administering scales such as Kloosterman and Stage’s Indiana Mathematics Belief Scale (1992) and Fennema and Sherman’s Mathematics Is Useful Scale. However, as writing plays such a strong role in this project/study, it was deemed more advantageous and, perhaps, more authentic, to have students respond in writing to more generalized questions, as follows: 1. “What do I like about math?”, 2. “What helps me learn math?”, and 3. “What kinds of things do I need to do to learn more about math?” Further, the second and third questions beg expository replies, rather than simple responses to checklists. The influences of student beliefs and subsequent performance have been widely documented (Chapman, 2002; DeCorte, 2002; Schoenfeld, 1983, 1985). As DeCorte notes, “mathematics-related beliefs may not be considered as epistemological beliefs as such, but rather perceived as domain-specific manifestations of the general epistemological beliefs.” Consequently, we also sought to avoid measures of general epistemological beliefs among students, concentrating instead on the domain of mathematics. Teachers’ Beliefs about Math and about Learning Math The influence of teacher beliefs on student learning has been explored in many contexts for a number of years (Askew, Brown, Rhodes, Johnson, & Wiliam, 1997; Beswick, 2005; Watson and DeGeest, 2005). Beswick (2005) has studied the connection

Solving the Math Problem 62
between teachers’ general beliefs about teaching and students to academic performance in mathematics. Watson and DeGeest (2005), in particular, examined math teachers’ practices with underachieving students, and found that “Overt methods were less important than the collection of beliefs and commitments which underpinned teachers’ choices.” (p. 209). For the collection of beliefs and commitments resulted in varying levels of engagement used in instruction and different emphases on short-term gains versus long-term understanding of mathematics. Consequently, as with students’ beliefs, teachers’ beliefs about math and the teaching and learning of math were obtained by posing three open-ended questions, as follows: 1. “List three important outcomes for teaching mathematics to students in grades 5-8.” 2. “What are three things that make a math lesson effective?”, and 3. “What do you think are some effective strategies for helping students who are having difficulties learning mathematics?” Summary Overall, teachers came to believe that active, social learning on the part of the students would improve student understanding of pre-algebra. In addition, they came to believe that they must individualize instruction as much as possible as well as spend more time planning. The data for students in the treatment group suggest that the combination of teacher training and student writing practices led to improvements in their problem solving skills. Improvements were noted in their use of problem restatement, strategies, and explicit math techniques, such as charting, underlining, and math paths.

Solving the Math Problem 63
References Askew, M., Brown, M., Rhodes, V., Johnson, D. & Wiliam, D. (1997). Effective Teachers of Numeracy. London: School of Education, King’s College. Beswick, K. (2005). The beliefs/practice connection in broadly defined contexts. Mathematics Education Research Journal, 17(2), 39–68. Beswick, K. (in press). Teachers’ beliefs that matter in secondary mathematics classrooms. (accepted February 2006 for publication in Educational Studies in Mathematics). Borko, H. & Livingston, C. (1989). Cognition and improvisation: Differences in mathematics instruction by expert and novice teachers. American Educational Research Journal, 26(4), 473-498. Chapman, O. (2002). Beliefs structure and inservice high school mathematics teacher growth. In G. C. Leder, E. Pehkonen & G. Torner (Eds), Beliefs: A Hidden Variable in Mathematics Education? (177–193). Dordrecht: Kluwer. De Corte, E., Op't Eynde, P., & Verschaffel, L.(2002). Knowing what to believe: The relevance of students' mathematical beliefs for mathematics education. In B. K. Hofer & P. R. Pintrich (Eds.), Personal epistemology: The psychology of beliefs about knowledge and knowing (297-320). Mahwah, NJ: Erlbaum. Duell, O. K., & Schommer-Aikins, M. (2001). Fennema, E., & Sherman, J. (1976). Fennema-Sherman mathematics attitudes scale: Instrument designed to measure attitude toward the learning of mathematics by females and males. Madison: University of Wisconsin, Center for Educational Research. García, A.I., Jiménez, J.E. & Hess, S. (2006). Solving arithmetic word problems: An analysis of classification as a function of difficulty in children with and without arithmetic LD. Journal of Learning Disabilities, 39(3), 270–281. Hutchinson,N. (1993). Effects of cognitive strategy instruction on algebra problem solving of adolescents with Learning Disabilities. Learning Disability Quarterly, 16(1), 34-63. Kloosterman, P., & Stage, R K. (1992). Measuring beliefs about mathematical problem solving. School Science and Mathematics, 92,109-115. Lee, J. & Wheeler, D. (1987). Algebraic thinking in high school students: Their conceptions of generalization and justification. Research Report. Concordia University, Montreal, Canada. Marshall, S. (1995) Schemas in Problem Solving. Cambridge University Press.

Solving the Math Problem 64
Neuman, Y; Leibowitz, L., & Schwarz, B. (2000). Patterns of verbal mediation during problem solving: A sequential analysis of explanation. The Journal of Experimental Educational, 68(3), 197-213. Schoenfeld, A. H. (1983). Beyond the purely cognitive: Belief systems, social cognitions, and metacognitions as driving forces in intellectual performance. Cognitive Science, 7, 329-363. Schoenfeld, A. H. (1985), Mathematical problem solving. New York: Academic Press. Silver, E. A & Cai, J. (1996). An analysis of arithmetic problem posing by middle school students. Journal for Research in Mathematics Education, 27(5), 521-539. Steele, D. & Johanning, D. (2004). A schematic–theoretic view of problem solving and development of algebraic thinking. Educational Studies in Mathematics, 57(1), 65-90. Watson, A., & De Geest, E. (2005). Principled teaching for deep progress: Improving mathematical learning beyond methods and materials. Educational Studies in Mathematics, 58(2), 209–234.

Solving the Math Problem 65
Appendix 2:
Analysis of Student Math Responses Project Report
December 2006
Prepared by
Peter A. Drake, M.A. DePaul University
Abstract This project is an extension of ongoing research to determine the efficacy of an urban middle school math teaching improvement intervention. The Algebra Connections model is designed to improve math performance in general and algebra performance specifically. Treatment consists of 3 math courses, an assessment course, and on-site support to improve teacher practice and student learning. Participants are teachers and students at Chicago neighborhood public middle schools that serve primarily African-American or Latino students from low-income families. A content analysis was conducted on responses to 3 questions posed to students pre- and post-treatment: 1) “What do I like about math?” 2) “What helps me learn math?” and 3) “What kinds of things do I need to do to learn more math?” Inter-rater reliability was established at 92% (see Appendix A). Documents were coded and analyzed in QSR NVivo version 2.0. Significant differences were found between pre- and post treatment groups for both affective and cognitive outcomes. Students’ overall “expressed feelings” about math nearly doubled in character count (pre-treatment n = 4576; post-treatment n = 8444). In other words, students in the post-treatment condition wrote more on how they felt about math in general. “Positive feelings” about math increased in frequency (pre-treatment n = 45; post-treatment n = 60), while “negative feelings” remained the same. Students post-treatment wrote more (character count) when expressing “positive feelings” about math (pre-treatment n = 3578; post-treatment n = 7126). Both “extrinsic” (pre-treatment n = 18; post-treatment n = 40) and “intrinsic” (pre-treatment n = 33; post-treatment n = 76) motivations for learning math increased in frequency. Students in the post-test condition more frequently expressed “challenge” (pre-treatment n = 28; post-treatment n = 47) as their primary intrinsic motivation for liking math. Students in the post-treatment condition more frequently (pre-treatment n = 12; post-treatment n = 32) indicated a need and/or appreciation for teachers to “break down math into smaller steps.” Further data analysis should focus on the specific factors contributing to these and other observed differences.

Solving the Math Problem 66
Project Overview
Chicago Algebra Connections is a professional development program for
Chicago Public Schools (CPS) teachers of grades 5-8, administered by DePaul
University’s Center for Urban Education. Scholarship funding covers most of the
teacher tuition expense. This project is funded by a Teacher Quality Research Grant
from the Institute of Education Sciences at the U.S. Department of Education. Barbara
Radner, Ph.D. is the principal investigator for a study that involves interventions with
participating Algebra Connections teachers. Dr. Radner is Director of the Assessment
Center at the School for New Learning (SNL) at DePaul University, and a member of
the resident faculty. This methods report describes the data and details the coding
process (see Appendix B).
Data was collected from 23 classrooms in year one of the study. Of the total, 13
received treatment (treatment group) and 10 received limited treatment (control group).
The treatment included training for the teachers in the form of four graduate-level
courses. Three of the courses focused on strategies for teaching algebra in the math
curriculum, and one course focused on how to assess and improve student math
learning. All four courses were correlated with State standards and best practices of
math education. Students in each classroom were given a pre-treatment (October
2004) and post-treatment (May 2005) questionnaire. This assessment included three
open-ended questions: “What do I like about math?” “What helps me learn math?”
“What kinds of things do I need to do to learn more math?” One question, “What is my
favorite kind of math problem?” included five response options, plus room for write-in
answers. There was no pre-survey done for the limited treatment group in year one.

Solving the Math Problem 67
Student response data was consolidated, in bullet-point format, into MS Word
documents. The data was sorted by classroom, with each student response identified
by a set of initials. Teacher identity was masked using a randomly-assigned numeric
identification number (ID). The qualitative student response data was coded and
analyzed using the QSR NVivo 2.0 software application. Further quantitative data
analysis and summary was conducted using SPSS 13.0 for Mac OS X software
application.
Student responses were coded (at “Nodes” in NVivo) for evidence of affective as
well as cognitive outcomes. The data were coded at the classroom level, meaning each
student response (in each respective class) was coded individually. Each classroom,
treatment or partial treatment, pre- or post-intervention, was organized as a “case.” A
combined inductive-deductive approach was used in developing the initial thematic
categories for coding. Certain measures of intended outcomes were combined with
bottom-up analysis to capture any emergent themes grounded in the data. The final
high-level summary codebook for student response data is shown in Table 1. Additional
tables highlight significant observed differences, with included discussion. Tables are
arranged in macro to micro order, moving from high-level generalities to more specific
observations and conclusions.

Solving the Math Problem 68
Table 1. Codebook Parent Node Child Node Example Student Attitudes and Beliefs
Comfort/Confidence Level; Expressed Feelings About Math
Easy; Hard Positive: Fun, Excitement, Interesting, Likes Teacher(s) Negative: Boredom, Hatred, Dislikes Teacher(s)
Motivation for Learning Math
Intrinsic; Extrinsic
Challenge/Achievement: Learning New Things Preparation:Grades/Grade Promotion, Life Skills, Professional/Vocational
Student Knowledge
Math Operations; Math Computation
Addition, Subtraction; Problem Solving; Stepwise Logic
Teacher Techniques
Attitudes/Behaviors; Instruction Type;
Helping, Availability; Re-Framing/Repetition Techniques; Learning Modes; Assessment Modes
Student Techniques
Classroom Behaviors; Hard Work/Commitment; Study Skills/Habits
Paying Attention, Focusing, Listening, Asking for Help Studying, Practicing Note-Taking
Student Support Requirements
People; Materials/Supplies; Resources;
Family, Parents, Siblings, Friends, Neighbors Textbooks, Workbooks, Calculators, PCs Tutoring, After-School Programs
Table 2. Summary of parent nodes pre- to post-treatment changes in frequency Parent Node
Pre-treatment Frequency
Post-treatment Frequency
Change +/-
Percent
Student Attitudes and Beliefs
90 103 +13 14%
Motivation for Learning Math
91 118 +27 30%
Student Knowledge 187 200 +13 7% Teacher Techniques 202 217 +15 7% Student Techniques 260 293 +33 13% Student Support Requirements
115 109 -6 6%

Solving the Math Problem 69
Discussion: Students in the post-treatment condition indicated their motivation for learning math more frequently (+30%) than students in the pre-treatment condition. This category represents the most significant change among parent codes. This increase may be related to an increased awareness/acceptance post-treatment of why learning math is important. The student support requirements category was the only category to decrease, post-treatment (-6%). This result may be related to a slight decrease in the need/desire for external support resources. The rank order frequency of mention of the core categories did not change. This may indicate students’ relatively stable perception/belief around how math knowledge is constructed, and about where they assign responsibility for learning/liking outcomes. Table 3. Summary of parent nodes pre- to post-treatment changes in character count Parent Node
Pre-treatment Character Count
Post-treatment Character Count
Change +/-
Percent
Student Attitudes and Beliefs
7775 10921 +3146 40%
Motivation for Learning Math
7408 13692 +6284 85%
Student Knowledge 11770 18406 +6636 56% Teacher Techniques 14159 21835 +7676 54% Student Techniques 15366 24748 +9382 61% Student Support Requirements
7940 7512 -428 6%
Discussion: Students in the post-treatment condition wrote more, in relation to the parent nodes, than in the pre-treatment survey. The most significant change was indicated in the motivation for learning math (+85%) category. This result indicates that students had more to say about why they thought math was important to learn, or for what practical/applied purposes they might need math knowledge and skills. Participants in the post-treatment condition wrote less (-6%) when identifying student support requirements. Again, this may be related to a decreased need/desire for external resources (e.g., tutoring), and/or a possible increase in accepting personal responsibility (e.g., studying, paying attention) for learning math.

Solving the Math Problem 70
Table 4. Summary of Student Attitudes and Beliefs, pre- to post-treatment changes in frequency and character count Child Node/Sub-Node*
Pre-treatment Frequency/Character Count
Post-treatment Frequency/Character Count
Change +/-
Percent
Expressed Feelings About Math
52/4576 81/8444 +29/+3868 56%/85%
*Positive Feelings
45/3578 60/7126 +15/+3548 33%/99%
*Negative Feelings
22/2067 20/1162 -2/-905 10%/78%
Discussion: Students in the post-treatment survey showed a significant (+56%) increase in expressing their feelings about math in general, as well as writing 85% more. Post-treatment survey participants expressed their feelings about math 33% more, and showed a 99% increase in how much they wrote about these feelings. It is important to note that the relatively low incidence of negative feelings is largely due to the nature of the questions (i.e., What do I like about math?). Students were not asked specifically what they disliked about math. Future surveys may want to ask whether students like math, rather than the presumptive what do I like. The 78% decrease in the volume students wrote when discussing negative feelings about math may be meaningful, indicating a possible decrease in overall negative attitudes toward math. Table 5. Summary of Motivation for Learning Math, pre- to post-treatment changes in frequency and character count Child Node/Sub-Node*
Pre-treatment Frequency/Character Count
Post-treatment Frequency/Character Count
Change +/-
Percent
Intrinsic 33/2557 76/8534 +43/+5977 130%/234% *Challenge 28/2656 47/5166 +19/+2510 68%/95% Extrinsic 18/1331 40/5149 +22/+3818 122%/287% *Counting Money
8/570 23/2391 +15/+1821 188%/319%
Discussion: Very large post-treatment differences were observed in this area. Students indicated more frequently their motivations for learning math, both intrinsic and extrinsic. Students also had significantly more to say, when writing about their motivations. Challenge and achievement was indicated as the primary intrinsic motivation for learning math; this category was cited more frequently (68%) in the post-treatment condition. Counting Money was mentioned more frequently (188%) in the post-treatment condition. This sub-node was often discussed in the context of “not getting

Solving the Math Problem 71
ripped off at the store,” a good motivation for learning math. Students had significantly more (319%) to say about Counting Money, post-treatment. Table 6. Summary of Student Knowledge (Basic Skills), pre- to post-treatment changes in frequency, in descending order of mention (post-treatment) Child Node/Sub-Node*
Pre-treatment Frequency/Character Count
Post-treatment Frequency/Character Count
Change +/-
Percent
*Multiplication 55 65 +10 18% *Addition 41 48 +7 17% *Division 41 41 0 0% *Subtraction 26 37 +11 42% *Fractions 15 33 +12 120% *Geometry 16 18 +2 13% *Algebra 13 17 +4 31% *Decimals 15 7 -8 114% Discussion: Table 6 lists, in rank order, the basic skills components that make up the category Student Knowledge. Students mentioned Multiplication (in any context) more than any other basic skill. Results showed the most significant increases post-treatment in the areas of Fractions and Decimals. There may have been a greater emphasis placed on learning and/or working with Fractions and Decimals in the post-treatment condition. Both Algebra and Geometry were mentioned more often in the post-treatment condition. Division was the only basic math skill showing no change of mention, post-treatment. Mention of Decimals decreased significantly (114%), post-treatment. These basic math skills would need to be evaluated in pairwise comparisons with Attitudes and Beliefs (Comfort Level and Expressed Feelings about Math) in order to further explain these changes. Table 7. Summary of Teacher Techniques, pre- to post-treatment changes in frequency Child Node/Sub-Node*
Pre-treatment Frequency
Post-treatment Frequency
Change +/-
Percent
*Explaining 42 40 -2 5% *Helping 33 36 +3 9% *Breaking Down into Smaller Steps
12 32 +20 167%
*Showing, Modeling, Demonstrating
13 27 +14 108%
*Working in Groups 25 21 -4 19% *Examples 11 22 +11 100% *Games 12 15 +3 25%

Solving the Math Problem 72
Discussion: Table 7 summarizes the most frequently mentioned Teacher Techniques that students found helpful, felt they needed, or liked about math instruction. The two (2) most-frequently indicated Teacher Techniques, 1. Helping and 2. Explaining, remained important but essentially unchanged. The three (3) categories 1. Breaking Down into Smaller Steps; 2. Showing, Modeling, and Demonstrating; and 3. Providing Examples all showed significant increases of mention in the post-treatment condition. The category Working in Groups decreased (19%) post-treatment. This may be offset and explained by an increase in Student Techniques (Working Individually), and/or a decreased dependence on others, and/or an increased sense of independence. Students expressed some level of interest, appreciation, or desire for playing math Games in the classroom more often (25%) in the post-treatment condition. Table 8. Summary of Student Techniques, pre- to post-treatment changes in frequency Child Node/Sub-Node*
Pre-treatment Frequency
Post-treatment Frequency
Change +/-
Percent
*Studying 73 89 +16 22% *Paying Attention 60 70 +10 17% *Practicing 20 48 +28 140% *Asking for Help 26 42 +16 62% *Note-taking 31 35 +4 13% *Listening 40 35 -5 14% Discussion: Table 8 categories collectively describe some of the various techniques students employ to learn more math. The most frequently mentioned areas are listed here, in order of post-treatment frequency. These six (6) categories were identified as most important techniques pre-treatment, and continued to be most important post-treatment. All but one technique showed marked increases in post-treatment frequency. Listening was ranked third in importance pre-treatment, and decreased by 13% post-treatment. Practicing and Asking for Help moved ahead of Listening in order of importance, post-treatment. These increases in Student Techniques may suggest a shift toward personal agency/self-reliance in learning math, and an acknowledgement of their role/responsibility in the learning process.

Solving the Math Problem 73
Table 9. Summary of Student Support Requirements, pre- to post-treatment changes in frequency Child Node/Sub-Node*
Pre-treatment Frequency
Post-treatment Frequency
Change +/-
Percent
Others 11 10 -1 10% *Tutors 23 25 +2 9% *Parents 17 6 -11 183% *Teachers 27 32 +5 19% *Textbooks 24 33 +9 38% Discussion: Table 9 lists the categories identified most frequently by students indicating what specific resources they require to learn math. Modest frequency increases were reported post-treatment in the identified need for support from Tutors, Teachers, and Textbooks (Learning Materials). These frequency increases are not in proportion to increases seen in other core categories, indicating a potential effect. The students’ support requirements from Parents declined sharply (183%) in frequency. Teachers, Textbooks, and Tutors comprised the majority of student responses, both before and after treatment. While these remained important support requirements, students may have assumed more internal locus of control, post-treatment, requiring less in the way of external resources. Conclusions
Both qualitative and quantitative differences were found in open-ended student
survey responses between the pre- and post-treatment conditions. In general, students
had more to say, literally writing more, in their post-treatment survey responses. The
six core categories captured and organized hierarchically the qualitative response data
into meaningful quantifiable text units. Post-treatment, students expressed more
positive feelings about math in general, and used the word “fun” more often in the
context of math. The data suggests that these students have taken more ownership
and personal accountability for learning math, while at the same time are requiring the
same or less in the way of external resources. Post-treatment, students appeared to
have a keener sense of why they are (or should be) motivated to learn math. Specific
classroom teaching techniques stood out as highly important and valuable to the post-
treatment group, possibly as a result of the program intervention/teacher training.