solving real life problems using data science part - 1
TRANSCRIPT

Solving Real Life Problemsusing Data Science
SOHOM GHOSHROLL: - 1251117
UNIVERSITY ROLL NO: - 12600112172UNIVERSITY REGN. NO: - 121260110110 OF 2012-2013
4thYr (7th Semester) Project ReportSUPERVISOR: - DR. DINABANDHU BHANDARI


Data Science Applications
1. Predictive Analytics (7th sem)– Modeling Customer Churn using Data Science– Prediction of Cancellations of Taxi Reservations
2. Natural Language Processing (7th- 8th sem)– Defining a Quantitative Measure for Scientific
Articles (ongoing)– Recommendation System using NLP (ongoing)
3. Online Ad. Targeting OR Recommender Systems (8th sem)

Modeling Customer Churn using Data Science
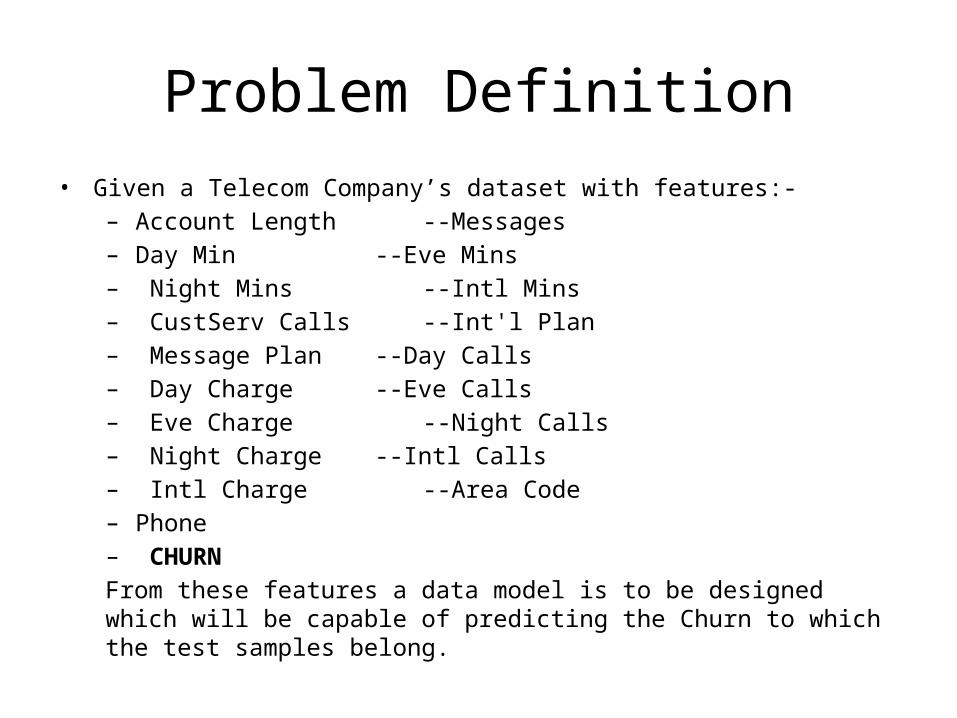
Problem Definition• Given a Telecom Company’s dataset with features:-
– Account Length --Messages– Day Min --Eve Mins– Night Mins --Intl Mins– CustServ Calls --Int'l Plan– Message Plan --Day Calls– Day Charge --Eve Calls– Eve Charge --Night Calls– Night Charge --Intl Calls– Intl Charge --Area Code– Phone– CHURNFrom these features a data model is to be designed which will be capable of predicting the Churn to which the test samples belong.

Tools Used• MS-Excel for preprocessing of data• Weka for implementing Logistic Regression, SVM, MLP and Random
Forest.• Graph for plotting.

Data Preparation
• Phone number is unique for each case, so it is removed from the feature set.
• Dealing with the Sate column (i.e. Nominal String Attribute) is not worth doing. Thus, this feature is discarded.
• Other features are kept as it is.• For implementing Machine Learning Algorithms
using Weka, csv file are converted to arff file was necessary.
Algorithm Selection
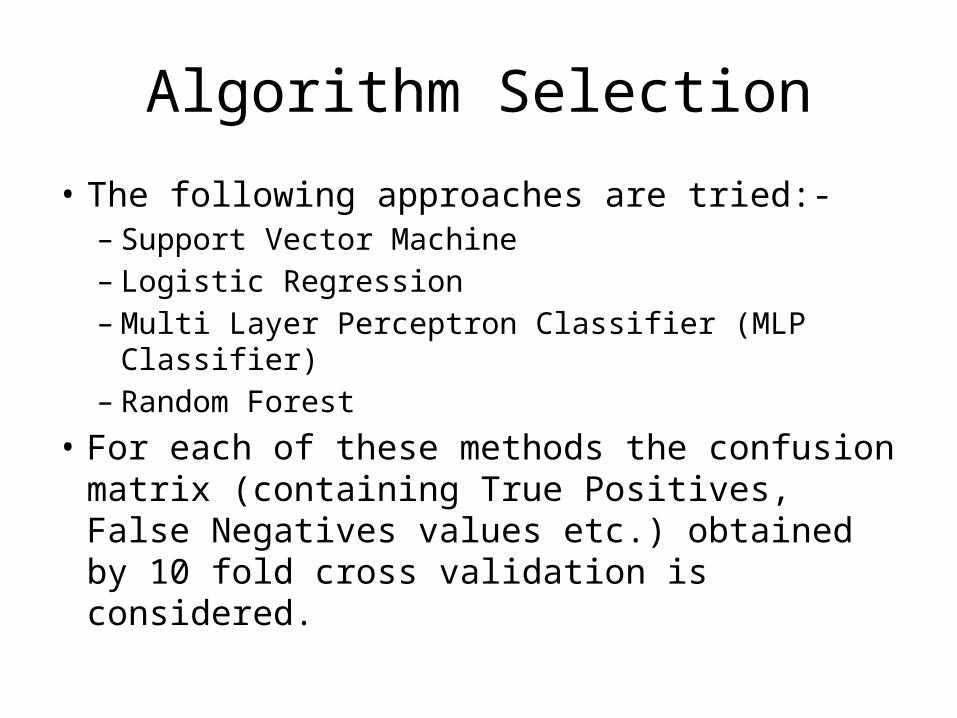
• The following approaches are tried:-– Support Vector Machine– Logistic Regression– Multi Layer Perceptron Classifier (MLP Classifier)– Random Forest
• For each of these methods the confusion matrix (containing True Positives, False Negatives values etc.) obtained by 10 fold cross validation is considered.
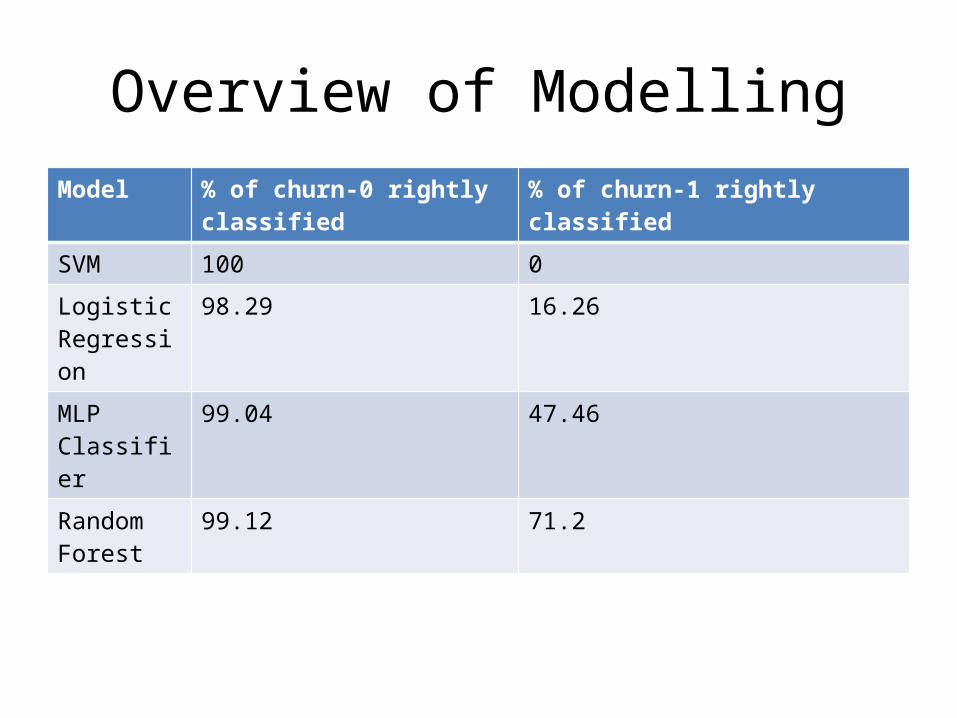
Overview of ModellingModel % of churn-0 rightly classified % of churn-1 rightly classified
SVM 100 0
LogisticRegression
98.29 16.26
MLP Classifier
99.04 47.46
RandomForest
99.12 71.2

Interpretation of Results
• From the previous table it can be observed that applying SVM results in over-fitting i.e it can properly classify elements belonging to churn 0. But, when it comes to churn 1, it cannot classify a single one correctly.
• Logistic Regression & MLP are giving better results compared to SVM. But, they are not capable to classify elements of churn 0 as efficiently as Random Forests.
Issues Encountered
• Most of the popular machine learning algorithms (like MLP, SVM) for predictions resulted in over fitting.
• The possible reason is the skewed dataset containing 2292 instances of churn 0 and only 375 instances of churn 1.
• If the dataset had about equal number of instances of class 0 & class 1, the predictions are expected to be better.

Other Approaches Tried
• Normalizing each features to bring its value within a range.
• Dividing each features (except Area Code, Int'l Plan, Message Plan) by Account Length (Weeks) to calculate weekly usage.

Insights Uncovered
• Removal of outliers is uncovered. Calculating the z-score of each entity and removing a certain percentage may have given better results.
• SVM with other kernel functions may have given better results.

Prediction of Cancellations of Taxi Reservations

Problem Definition
Predict the cancellations of booking made by the company due to unavailability of cars.
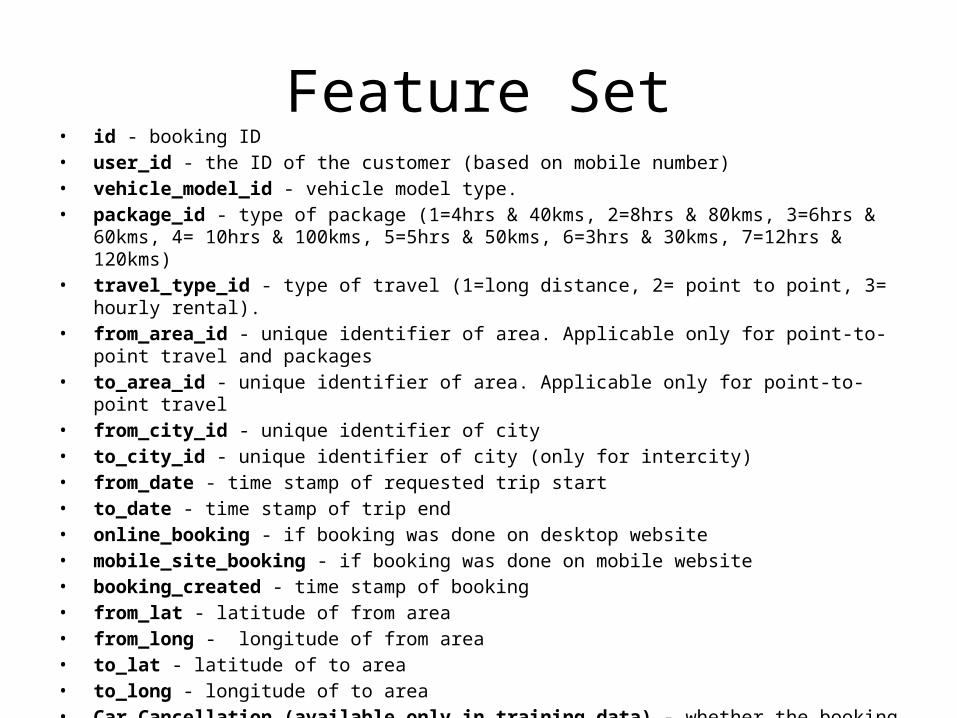
Feature Set• id - booking ID• user_id - the ID of the customer (based on mobile number)• vehicle_model_id - vehicle model type.• package_id - type of package (1=4hrs & 40kms, 2=8hrs & 80kms, 3=6hrs & 60kms, 4= 10hrs & 100kms,
5=5hrs & 50kms, 6=3hrs & 30kms, 7=12hrs & 120kms)• travel_type_id - type of travel (1=long distance, 2= point to point, 3= hourly rental).• from_area_id - unique identifier of area. Applicable only for point-to-point travel and packages• to_area_id - unique identifier of area. Applicable only for point-to-point travel• from_city_id - unique identifier of city• to_city_id - unique identifier of city (only for intercity)• from_date - time stamp of requested trip start• to_date - time stamp of trip end• online_booking - if booking was done on desktop website• mobile_site_booking - if booking was done on mobile website• booking_created - time stamp of booking• from_lat - latitude of from area• from_long - longitude of from area• to_lat - latitude of to area• to_long - longitude of to area• Car_Cancellation (available only in training data) - whether the booking was cancelled (1) or not (0) due
to unavailability of a car.

Tools Used
• R (Rattle package)• IBM-SPSS• Weka• Python
Methodology
• Feature Engineering• Cleaning and Preprocessing• Training the Predictive Model• Evaluation of the Predictive Model

Feature Engineering
• Time difference(mins) i.e. the time left for the journey to start
• Day of Journey i.e. on which day of the week the journey is suppose to start
• Distance(km) to be traveled

Cleaning & Preprocessing
• Remove instances with NULL values• Conversion of Day (nominal attribute) to a
numeric value• Normalizing:-• Xnew = (X − Xmin)/(Xmax − Xmin)
Training the Predictive Model
• Baye’s Classifier• Decision Tree (Random Forest)• MLP• SVM
Results & Discussions
• Basic Analysis– Cancellations per day of a week– Cancellations per package id– Cancellations per Travel id
• Evaluation of the Predictive Model and Software Packages– Percentage Correctly Classified & Time required
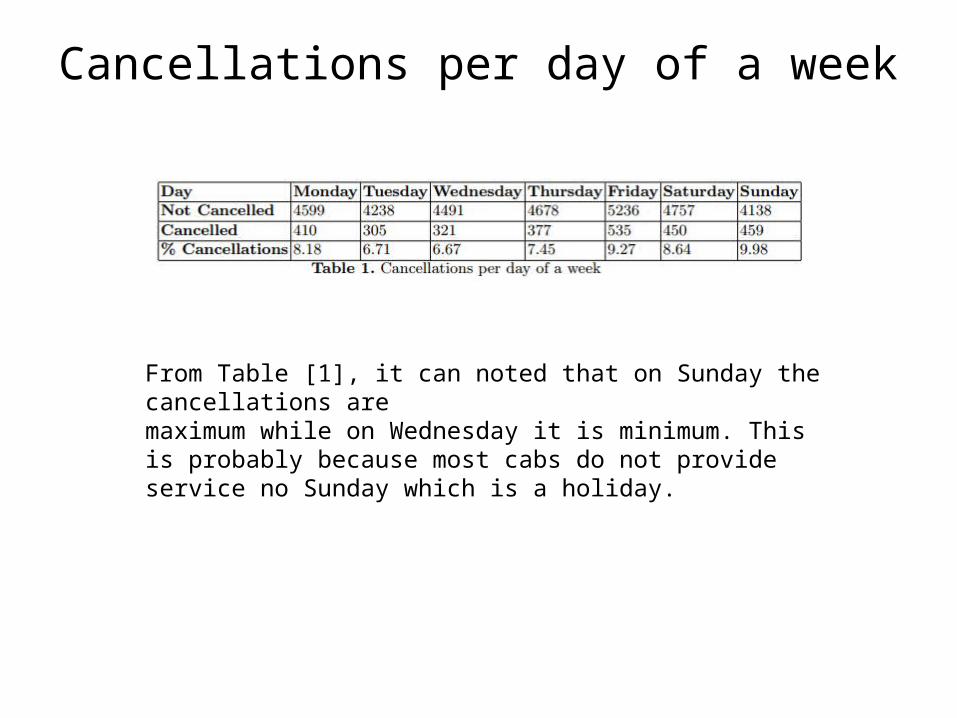
Cancellations per day of a week
From Table [1], it can noted that on Sunday the cancellations aremaximum while on Wednesday it is minimum. This is probably because most cabs do not provide service no Sunday which is a holiday.
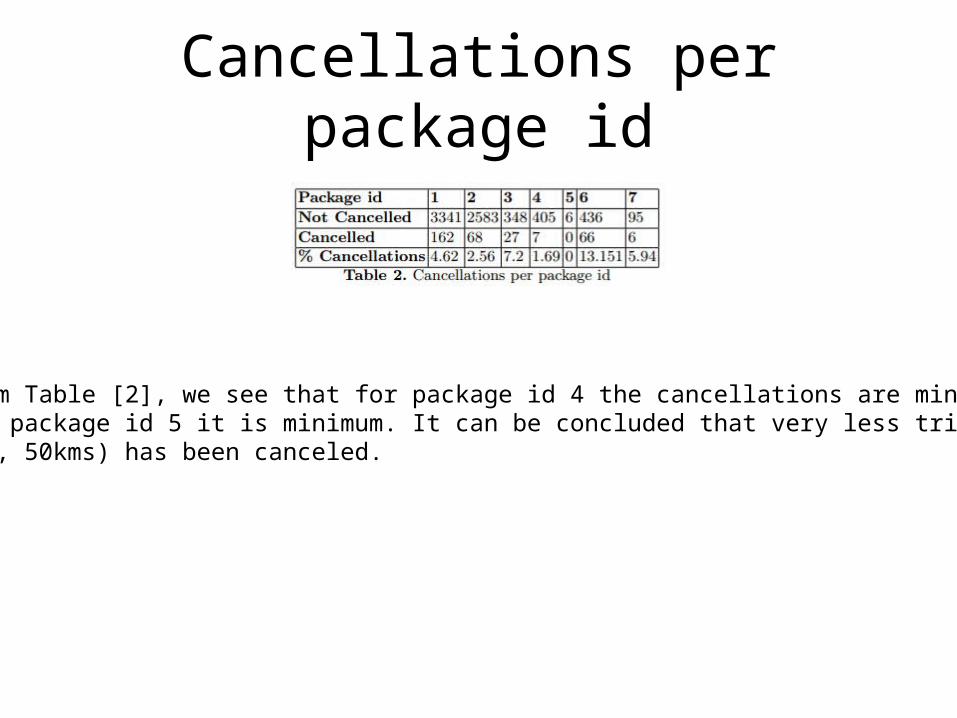
Cancellations per package id
From Table [2], we see that for package id 4 the cancellations are minimum whilefor package id 5 it is minimum. It can be concluded that very less trip of 5hrs(or, 50kms) has been canceled.

Cancellations per Travel id
From Table [3], we find that for travel type id 2 i.e. point to point travel type,percentage of bookings that were canceled are more than that of long distanceand hourly rental. Thus, we may say that point to point bookings are most likelyto be canceled

Percentage Correctly Classified & Time required

Discussion• Tradeoff between the efficiency and time required to built the
model.• Naive Bayesian Classifier Weka requires least time and gives
moderate efficiency. • Random Forest when implemented in Weka takes moderate time
but results in high efficiency. • Among these three software tools, IBM-SPSS has least inbuilt packages for classification• Weka despite being free & open source has a huge collection of
inbuilt libraries for classification. • Rattle (R Data Miner), another free & open source software is in
development phase.

Future Work• Feature Selection: Use of PCA• Removal of NULL values: For simplification, we removed
the instances with NULL values. We are trying to build the predictive model which will be capable of dealing with NULL values.
• Ensemble: Ensembling classifiers may yield better result• Using Separate Data for Testing: Done by splitting the given
dataset into training and test data. Efficiency calculated by 10 fold cross validation.
• More Comparisons: Compare with Matlab, Scilab & Octave
References1. Alastair M. Morrison, Su Jing, Joseph T. OLeary, and Liping A. Cai, Predictingusage of the Internet for Travel Bookings: An Exploratory Study, InformationTechnology & Tourism, Vol. 4 pp. 15302. Mark Hall, Eibe Frank, Geoffrey Holmes, Bernhard Pfahringer, Peter Reutemann,Ian H. Witten (2009); The WEKA Data Mining Software: An Update; SIGKDDExplorations, Volume 11, Issue 13. www.kaggle.com, Predicting cab booking cancellations ,Wed 27 Nov 2013 Mon 23Dec 20134. Williams, G. J. (2011), Data Mining with Rattle and R: The Art of ExcavatingData for Knowledge Discovery, Use R!, Springer.5. Kou-Yuan Huang and Kai-Ju Chen, Multilayer Perceptron for Prediction of 2006World Cup Football Game, Advances in Artificial Neural Systems, Volume 2011(2011), Article ID 3748166. Rumelhart, David E., Geoffrey E. Hinton, and R. J. Williams. Learning InternalRepresentations by Error Propagation. David E. Rumelhart, James L. McClelland, and the PDP research group. (editors), Parallel distributed processing: Explorations in the microstructure of cognition, Volume 1: Foundations. MIT Press,1986.7. V. Vapnik, Statistical Learning Theory, John Wiley & Sons., 1998.8. James, G., Witten, D., Hastie, T., Tibshirani, R., An Introduction to StatisticalLearning with Applications in R, Springer-Verlag New York9. Bishop, C.M. (1995) Neural Networks for Pattern Recognition, Oxford: OxfordUniversity Press. ISBN 0-19-853849-910. www.andrew.hedges.name/experiments/haversine/ used on 19th june 2015

Thank You!!!