solving for project risk management: understanding the
TRANSCRIPT

1
Solving for Project Risk
Management: Understanding
the Critical Role of Uncertainty
in Project Managementby
Christian B. Smart, PhD, CCEA
Presented to the NASA Cost and Schedule Symposium
March 31, 2021

2
ABOUT THE AUTHOR
• Chief Scientist with Galorath Federal
• Former Cost Director for Missile Defense Agency
• Twenty years of experience with cost and schedule risk analysis, predictive analytics, probabilistic reliability analysis, and machine learning
• Exceptional public service medal from NASA
• Named Parametrician of the Year by the International Society of Parametric Analysts
• Ph.D. in Applied Mathematics
• Contact: [email protected]

3
IT’S ALWAYS RISKIER THAN YOU EXPECT
EVEN TAKING INTO ACCOUNT IT IS RISKIER THAN YOU EXPECT!
COMPUTER CHESS
The concept of computer programs for playing chess was first
developed in the 1940s
Belief was that, in ten years, a computer program would be able to
defeat the world champion
This prediction was continually updated to be ten years away
Did not occur until the 1990s
HOFSTADTER S LAW’
Inspired by this example, the cognitive scientist Douglas
Hofstadter coined the recursive and eponymous Hofstadter’s
Law:
It always takes longer than you expect, even when you take
into account Hofstadter’s Law
CONNECTION WITH COST AND RISK
As time is money, Hofstadter’s Law applies to cost
Entropy is the general tendency towards disorder in the
universe – more can (and does) go wrong than go right
Due to entropy, a similar law applies to risk
Time Milestone
Late 1940s Claude Shannon and Alan Turing invent
computerized chess.
1957 IBM engineer Alex Bernstein creates the
first computer chess program.
1967MacHack VI becomes the first computer
chess engine to beat a human.
1977 Chess 4.5 wins the Minnesota Open with a
master-level performance.
1988
Deep Thought achieves grandmaster
level and ties for 1st at the United States
Open.
1997Deep Blue defeats World Champion
Garry Kasparove in a six-game match.

4
WHAT IS AT STAKE: WORLD DOMINANCETHE 21ST CENTURY SPACE RACE
19th CENTURY - SEA
The British Empire was the dominant world
power in the nineteenth century because of
its supremacy at sea
21st CENTURY - SPACE
The nation that controls space will be the
dominant world power in the twenty-first
century – Michael Griffin, former NASA
Director and former Under Secretary of
Defense for Research and Engineering
5
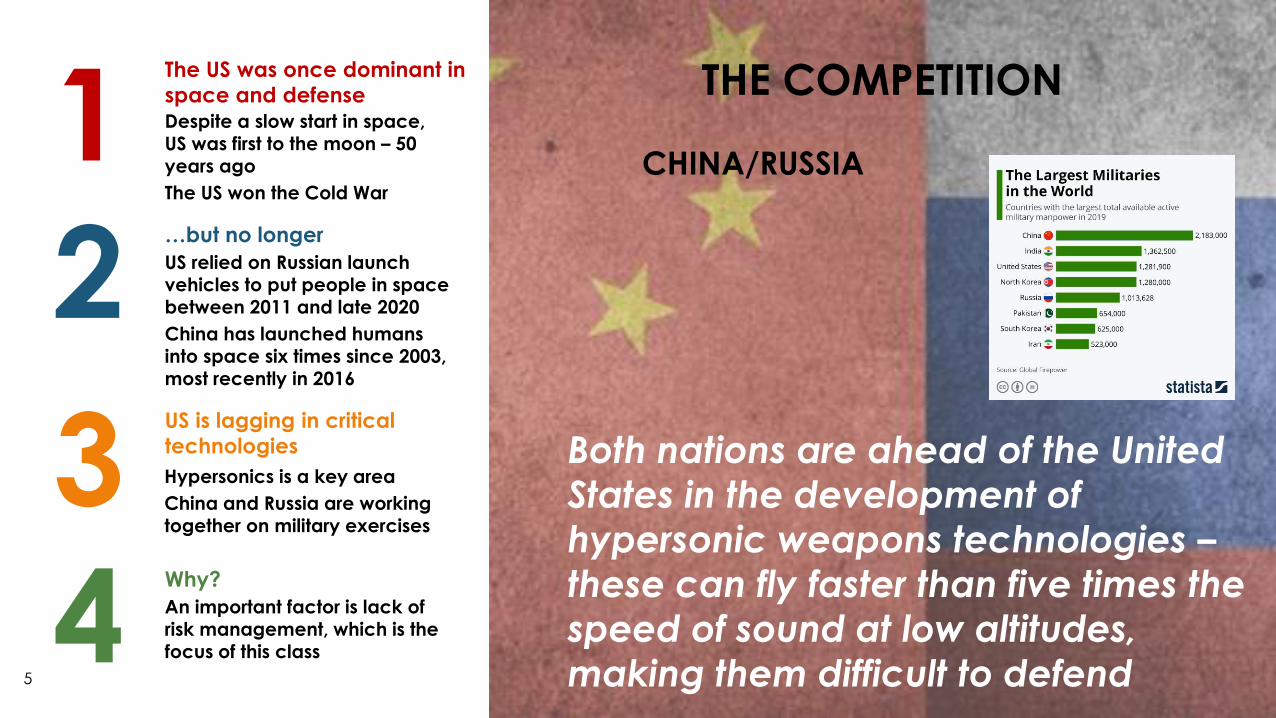
THE COMPETITION
CHINA/RUSSIA
Both nations are ahead of the United
States in the development of
hypersonic weapons technologies –
these can fly faster than five times the
speed of sound at low altitudes,
making them difficult to defend
1The US was once dominant in
space and defenseDespite a slow start in space, US was first to the moon – 50 years ago
The US won the Cold War
2…but no longer
US relied on Russian launch vehicles to put people in space between 2011 and late 2020
China has launched humans into space six times since 2003, most recently in 2016
3US is lagging in critical
technologies
Hypersonics is a key area
China and Russia are working together on military exercises
4Why?
An important factor is lack of risk management, which is the focus of this class
6
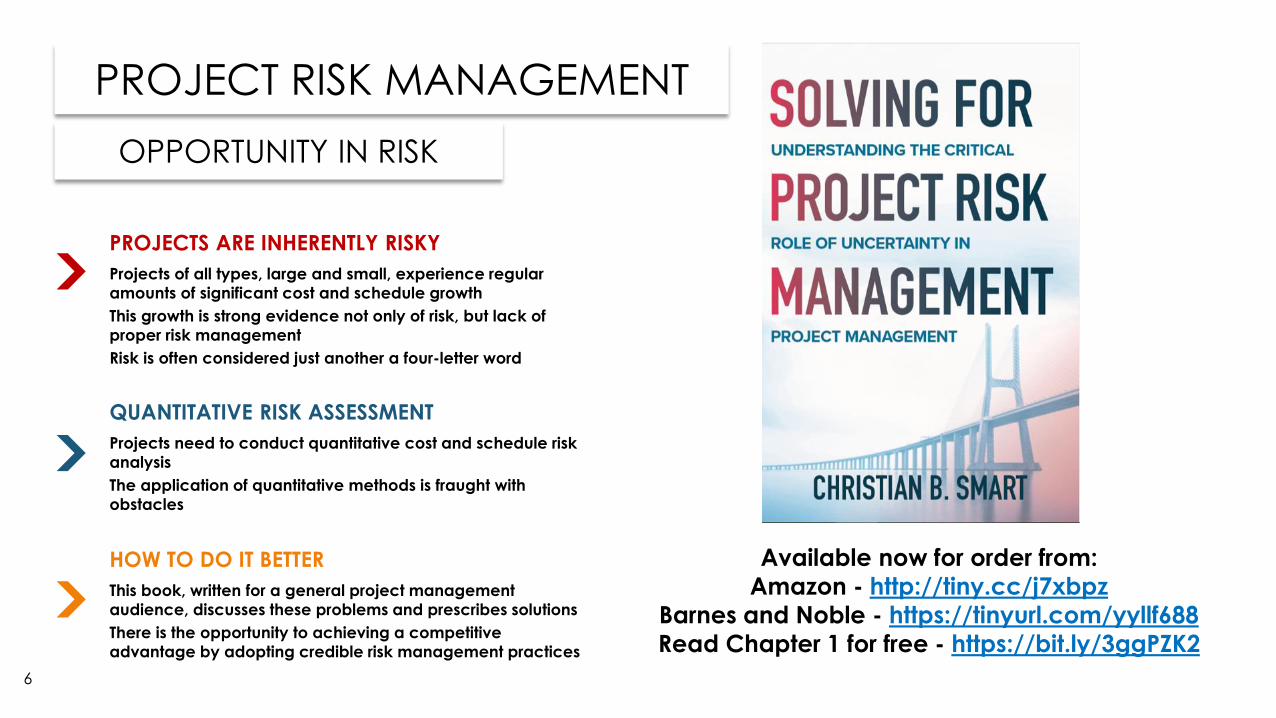
PROJECT RISK MANAGEMENT
OPPORTUNITY IN RISK
PROJECTS ARE INHERENTLY RISKY
Projects of all types, large and small, experience regular
amounts of significant cost and schedule growth
This growth is strong evidence not only of risk, but lack of
proper risk management
Risk is often considered just another a four-letter word
QUANTITATIVE RISK ASSESSMENT
Projects need to conduct quantitative cost and schedule risk
analysis
The application of quantitative methods is fraught with
obstacles
HOW TO DO IT BETTER
This book, written for a general project management
audience, discusses these problems and prescribes solutions
There is the opportunity to achieving a competitive
advantage by adopting credible risk management practices
Available now for order from:
Amazon - http://tiny.cc/j7xbpz
Barnes and Noble - https://tinyurl.com/yyllf688
Read Chapter 1 for free - https://bit.ly/3ggPZK2

7
?
AGENDA
Image Source: James Ford Bell Library
HIGH COST AND SCHEDULE
GROWTH
Cost and schedule growth is universal
across all types of projects – it is
frequent, high, and extreme
WHY COST AND SCHEDULE
GROWTH OCCUR
Cost and schedule growth occur for a
multitude of reasons – we discuss a few
and provide examples
THE QUANTITATIVE RISK
MANAGEMENT IMPERATIVE
Averages are not enough, nor are
qualitative methods – quantitative
risk assessment is a must, not just a
nice to have
COVERED WITH OIL: REALISM
IN RISK ANALYSIS
Even when risk is measured, it is
unrealistically low
THE PORTFOLIO EFFECT AND
THE FREE LUNCH
Funding for government systems
relies on a portfolio effect, which like
a “free lunch,” does not exist
HERE BE DRAGONS –
CONSIDERING THE RIGHT
TAIL IN RISK MANAGEMENT
Risk measurement does not typically
incorporate the right tail, which is
where the risks we want to guard
against lurk (“dragons”)
TRYING TO DO TOO MUCH
WITH TOO LITTLE
Portfolio management is not
conducted consistently
Results in organization shooting
themselves in their own proverbial
foot due to trying to fund too many
programs with too few dollars
THINKING STRATEGICALLY
A little strategic thinking could go a
long way – incentives can achieve
better outcomes

8
COST AND SCHEDULE GROWTH
A LEGACY OF DISASTER
1COMMONMultiple Industries Experience Significant Cost and Schedule Growth – Has Been a Problem for a Long Time
2FREQUENT70-80% of Projects Experience Cost and Schedule Growth
3HIGH
Cost: 50% or More on Average (Mean)
Schedule: 30% or More on Average (Mean)
4EXTREME (FOR COST) Cost Growth in Excess of 100% Is a Common Occurrence in Most Projects (1 in 6)
9
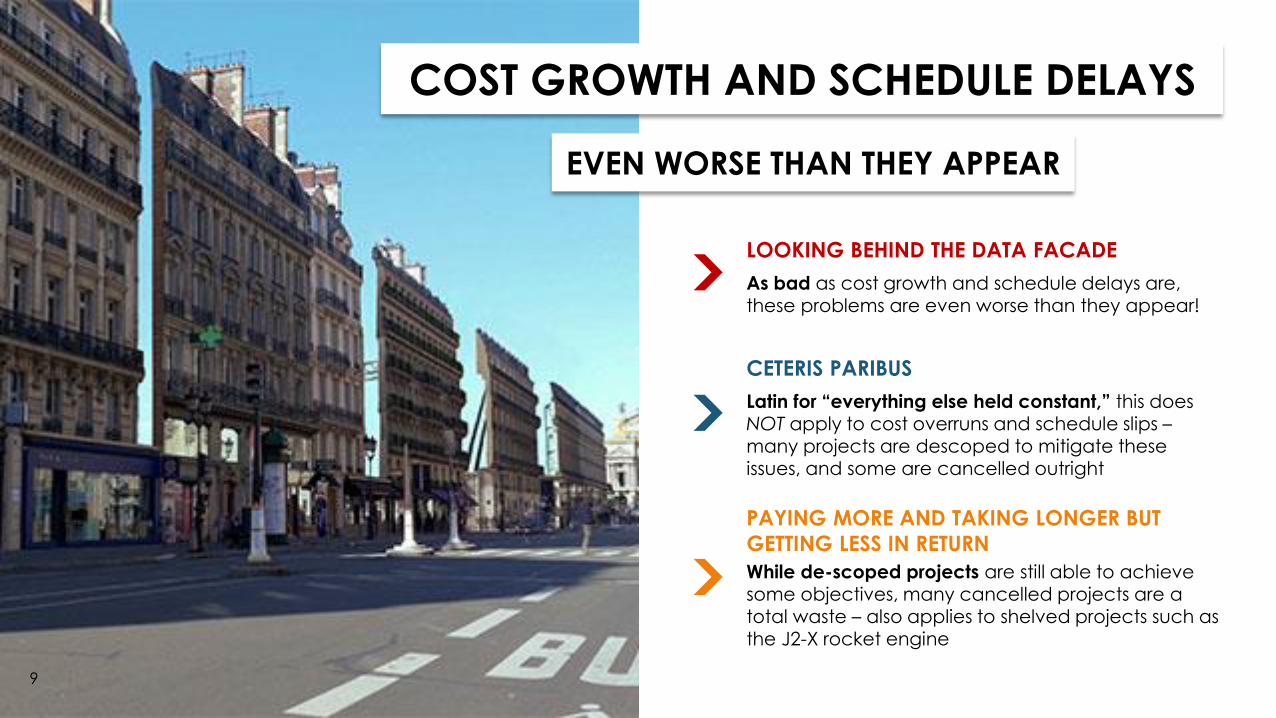
COST GROWTH AND SCHEDULE DELAYS
EVEN WORSE THAN THEY APPEAR
LOOKING BEHIND THE DATA FACADE
As bad as cost growth and schedule delays are, these problems are even worse than they appear!
CETERIS PARIBUS
Latin for “everything else held constant,” this does NOT apply to cost overruns and schedule slips –many projects are descoped to mitigate these issues, and some are cancelled outright
PAYING MORE AND TAKING LONGER BUT
GETTING LESS IN RETURN
While de-scoped projects are still able to achieve some objectives, many cancelled projects are a total waste – also applies to shelved projects such as the J2-X rocket engine
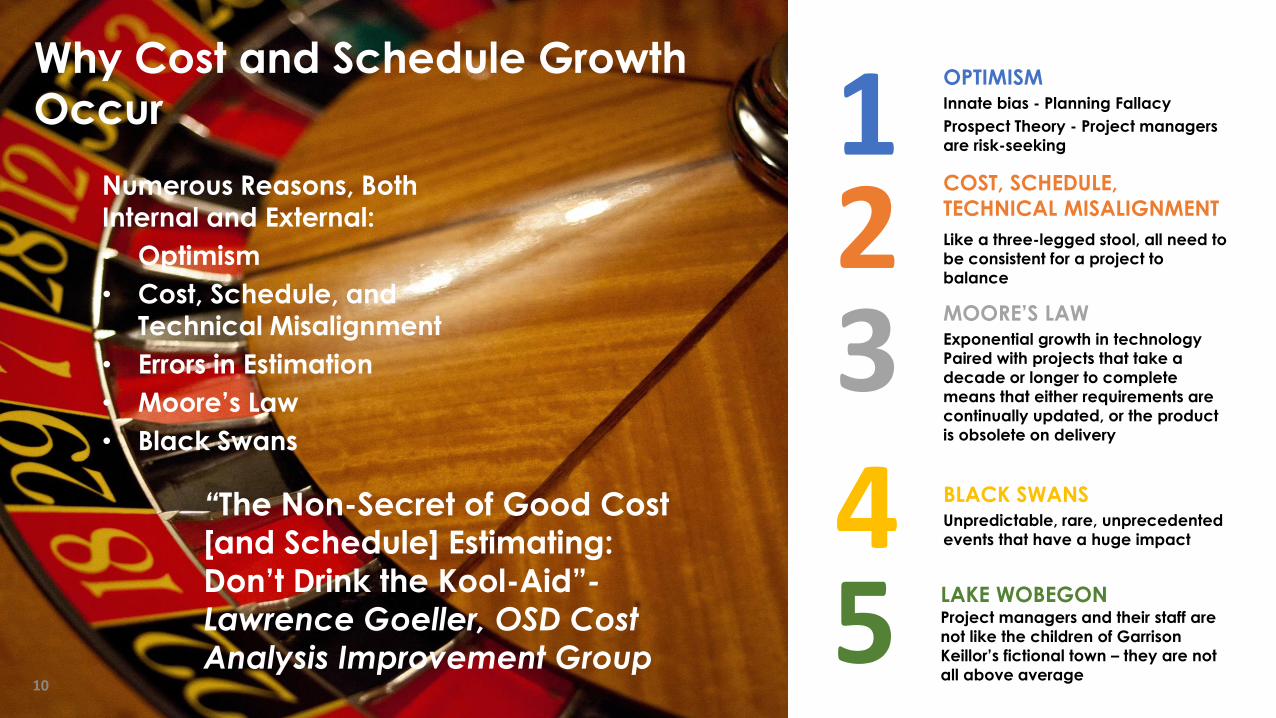
Why Cost and Schedule Growth
Occur
Numerous Reasons, Both
Internal and External:
• Optimism
• Cost, Schedule, and
Technical Misalignment
• Errors in Estimation
• Moore’s Law
• Black Swans
“The Non-Secret of Good Cost [and Schedule] Estimating:
Don’t Drink the Kool-Aid”-
Lawrence Goeller, OSD Cost
Analysis Improvement Group
1OPTIMISMInnate bias - Planning Fallacy
Prospect Theory - Project managers
are risk-seeking
2COST, SCHEDULE,
TECHNICAL MISALIGNMENT
Like a three-legged stool, all need to
be consistent for a project to
balance
3MOORE’S LAWExponential growth in technology
Paired with projects that take a
decade or longer to complete
means that either requirements are
continually updated, or the product
is obsolete on delivery
4 BLACK SWANSUnpredictable, rare, unprecedented
events that have a huge impact
10
5 LAKE WOBEGONProject managers and their staff are
not like the children of Garrison
Keillor’s fictional town – they are not
all above average
11
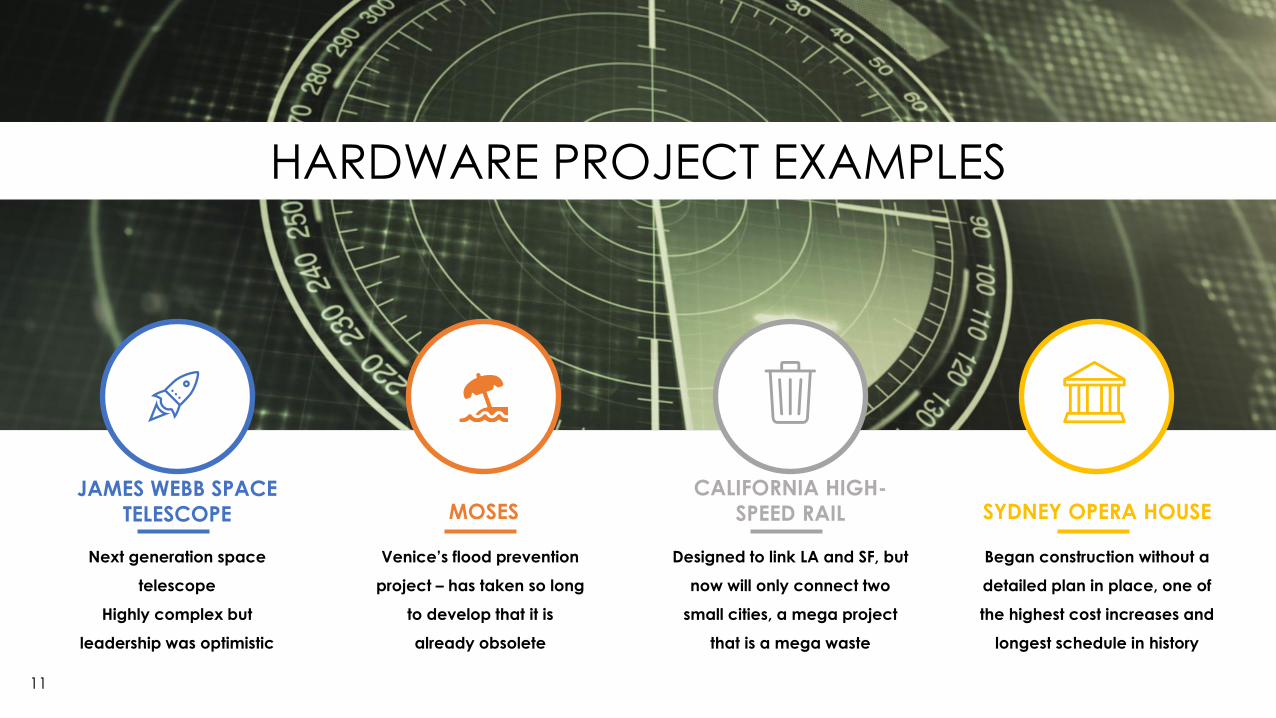
HARDWARE PROJECT EXAMPLES
JAMES WEBB SPACE
TELESCOPE
Next generation space
telescope
Highly complex but
leadership was optimistic
MOSES
Venice’s flood prevention
project – has taken so long
to develop that it is
already obsolete
CALIFORNIA HIGH-
SPEED RAIL
Designed to link LA and SF, but
now will only connect two
small cities, a mega project
that is a mega waste
SYDNEY OPERA HOUSE
Began construction without a
detailed plan in place, one of
the highest cost increases and
longest schedule in history

12
SOFTWARE DEVELOPMENT EXAMPLES
PHOENIX FEDERAL PAY
SYSTEM
Incorporated COTS
elements, intended to
save money; bug in
system underpaid civil
servants, cost billions to
fix
HEALTHCARE.GOV
Agile project; system was
rolled out before it was
ready; technical issues, not
designed to handle the
expected number of users;
required billions to fix
DENVER AIRPORT
BAGGAGE SYSTEM
Poor planning, aggressive
schedule, and technical
complexity caused this project
to delay the new airport’s
opening and was ultimately
cancelled
FOX MEYER ERP
$5 billion pharmaceutical
wholesale giant went bankrupt
trying to implement an ERP
system
13
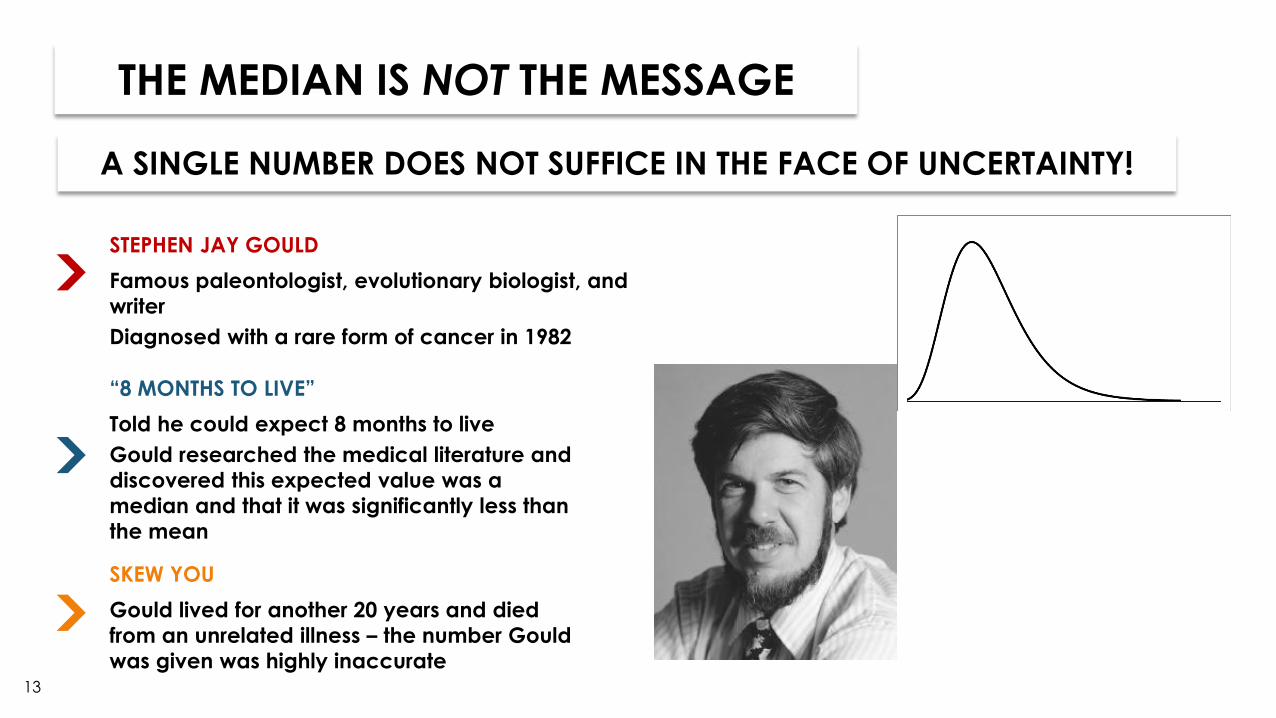
THE MEDIAN IS NOT THE MESSAGE
A SINGLE NUMBER DOES NOT SUFFICE IN THE FACE OF UNCERTAINTY!
STEPHEN JAY GOULD
Famous paleontologist, evolutionary biologist, and
writer
Diagnosed with a rare form of cancer in 1982
“8 MONTHS TO LIVE”
Told he could expect 8 months to live
Gould researched the medical literature and
discovered this expected value was a
median and that it was significantly less than
the mean
SKEW YOU
Gould lived for another 20 years and died
from an unrelated illness – the number Gould
was given was highly inaccurate
14
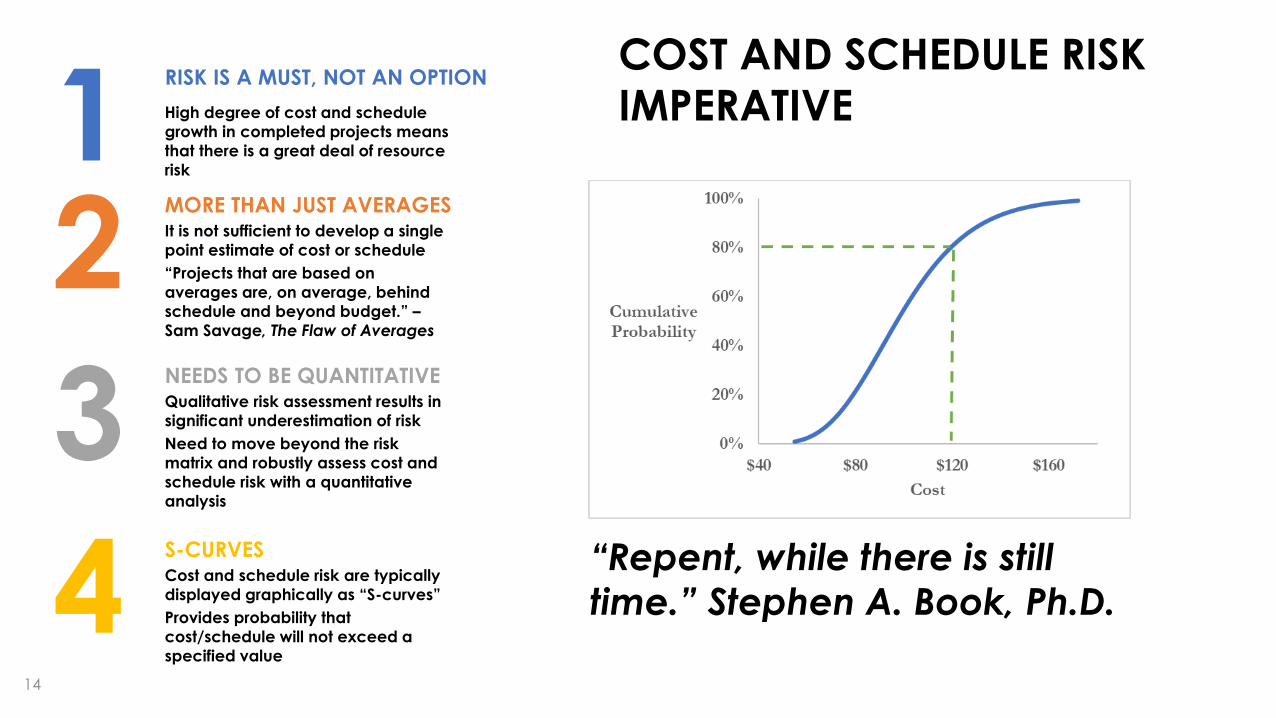
COST AND SCHEDULE RISK
IMPERATIVE
“Repent, while there is still
time.” Stephen A. Book, Ph.D.
1RISK IS A MUST, NOT AN OPTION
High degree of cost and schedule
growth in completed projects means
that there is a great deal of resource
risk
2MORE THAN JUST AVERAGESIt is not sufficient to develop a single
point estimate of cost or schedule
“Projects that are based on
averages are, on average, behind
schedule and beyond budget.” –
Sam Savage, The Flaw of Averages
3NEEDS TO BE QUANTITATIVEQualitative risk assessment results in
significant underestimation of risk
Need to move beyond the risk
matrix and robustly assess cost and
schedule risk with a quantitative
analysis
4S-CURVESCost and schedule risk are typically
displayed graphically as “S-curves”
Provides probability that
cost/schedule will not exceed a
specified value
15
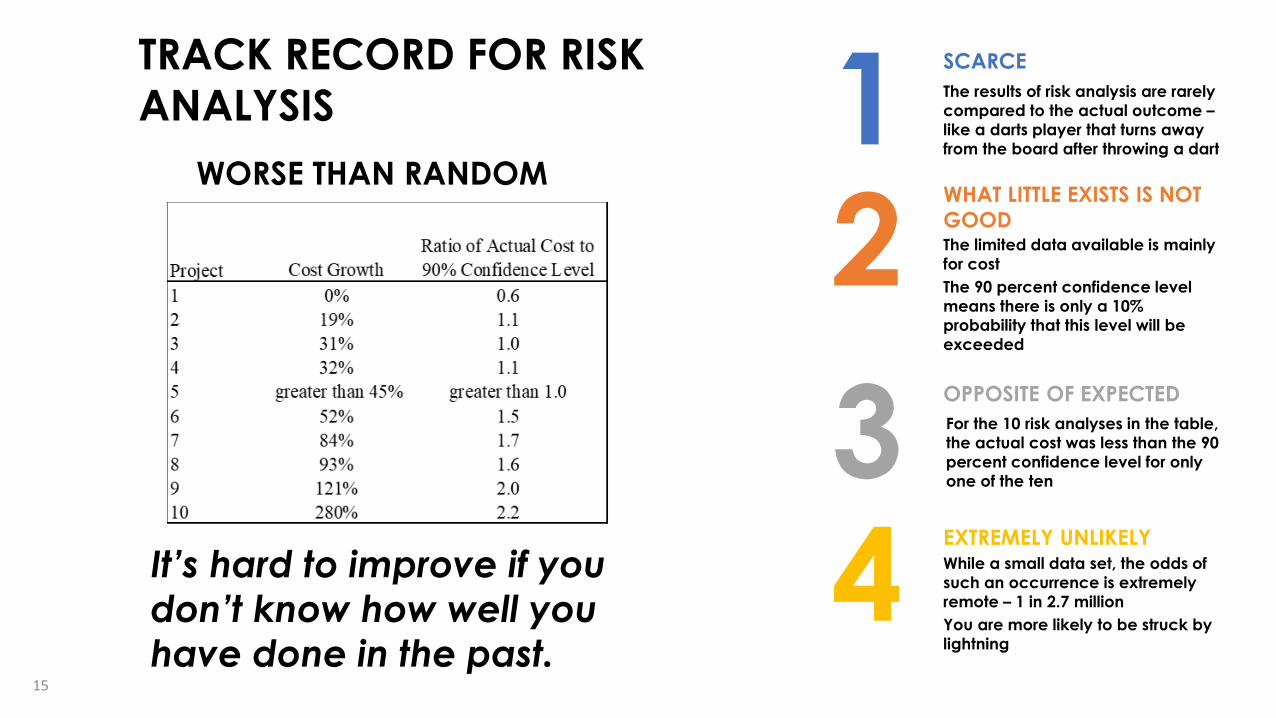
TRACK RECORD FOR RISK
ANALYSIS
WORSE THAN RANDOM
It’s hard to improve if you
don’t know how well you
have done in the past.
1SCARCE
The results of risk analysis are rarely
compared to the actual outcome –
like a darts player that turns away
from the board after throwing a dart
2WHAT LITTLE EXISTS IS NOT
GOODThe limited data available is mainly
for cost
The 90 percent confidence level
means there is only a 10%
probability that this level will be
exceeded
3OPPOSITE OF EXPECTED
For the 10 risk analyses in the table,
the actual cost was less than the 90
percent confidence level for only
one of the ten
4EXTREMELY UNLIKELYWhile a small data set, the odds of
such an occurrence is extremely
remote – 1 in 2.7 million
You are more likely to be struck by
lightning
16
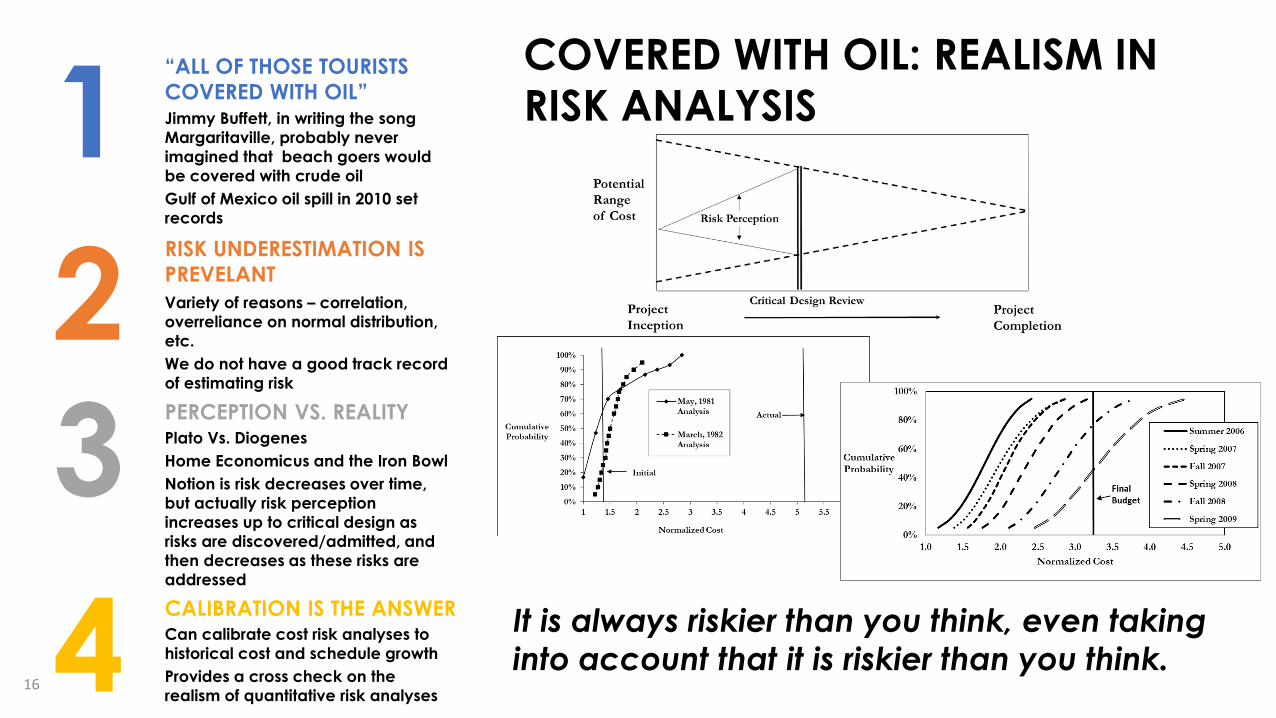
COVERED WITH OIL: REALISM IN
RISK ANALYSIS
It is always riskier than you think, even taking
into account that it is riskier than you think.
1“ALL OF THOSE TOURISTS
COVERED WITH OIL”Jimmy Buffett, in writing the song
Margaritaville, probably never
imagined that beach goers would
be covered with crude oil
Gulf of Mexico oil spill in 2010 set
records
2RISK UNDERESTIMATION IS
PREVELANT
Variety of reasons – correlation,
overreliance on normal distribution,
etc.
We do not have a good track record
of estimating risk
3PERCEPTION VS. REALITYPlato Vs. Diogenes
Home Economicus and the Iron Bowl
Notion is risk decreases over time,
but actually risk perception
increases up to critical design as
risks are discovered/admitted, and
then decreases as these risks are
addressed
4CALIBRATION IS THE ANSWERCan calibrate cost risk analyses to
historical cost and schedule growth
Provides a cross check on the
realism of quantitative risk analyses
17
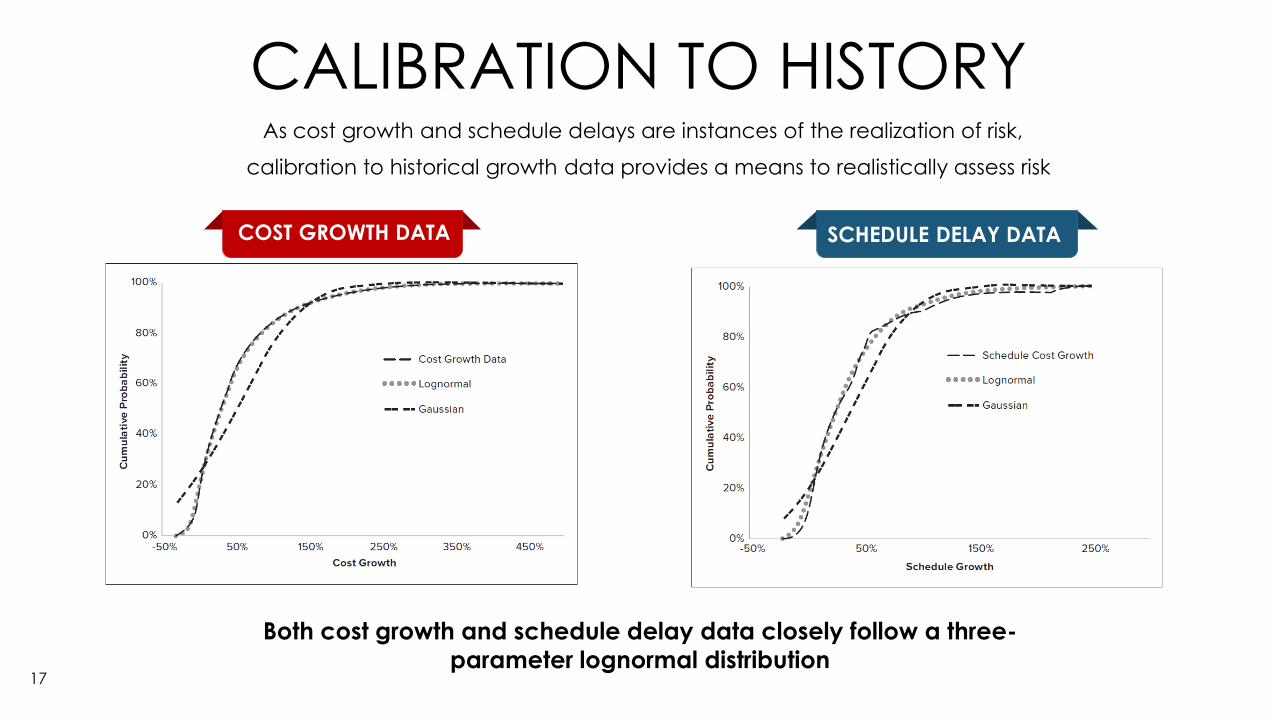
CALIBRATION TO HISTORYAs cost growth and schedule delays are instances of the realization of risk,
calibration to historical growth data provides a means to realistically assess risk
COST GROWTH DATA SCHEDULE DELAY DATA
Both cost growth and schedule delay data closely follow a three-
parameter lognormal distribution
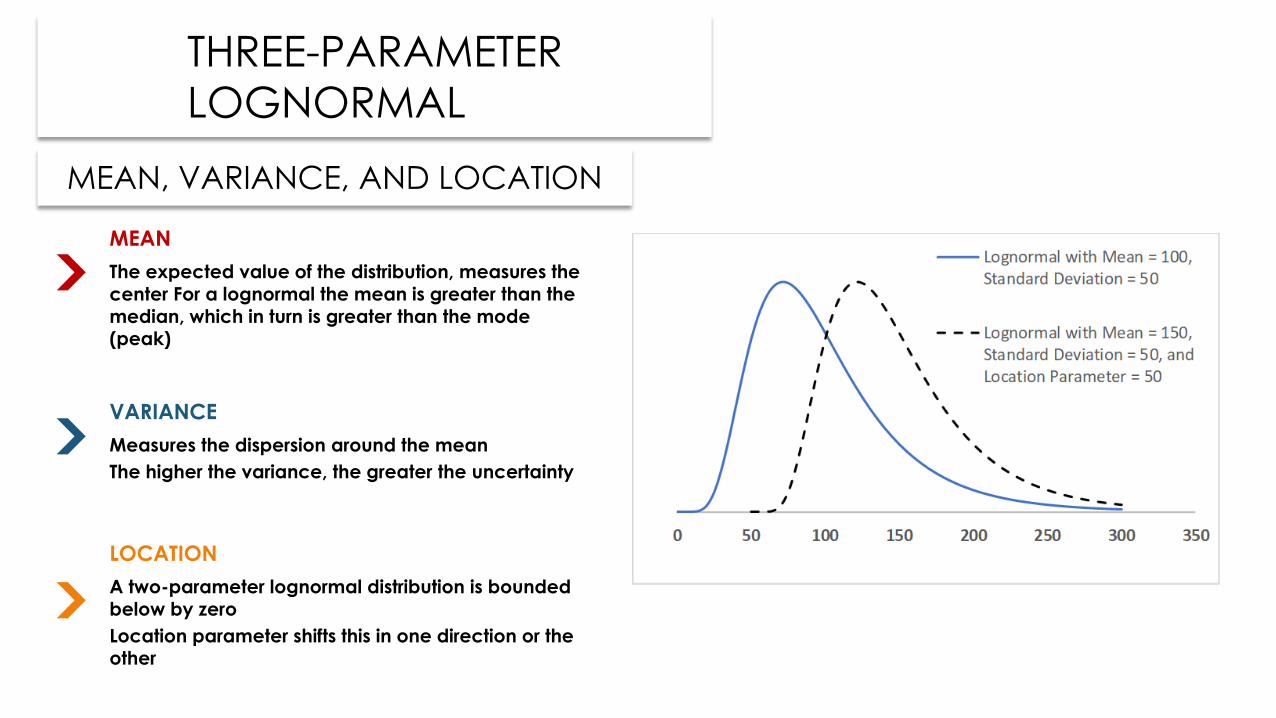
THREE-PARAMETER
LOGNORMAL
MEAN, VARIANCE, AND LOCATION
MEAN
The expected value of the distribution, measures the center For a lognormal the mean is greater than the median, which in turn is greater than the mode (peak)
VARIANCE
Measures the dispersion around the mean
The higher the variance, the greater the uncertainty
LOCATION
A two-parameter lognormal distribution is bounded below by zero
Location parameter shifts this in one direction or the other

19
THE PORTFOLIO EFFECT AND THE
FREE LUNCH
Economics in nine words –
There ain’t no such thing as
a free lunch.
1JIM CRAMER – “MAD MONEY”
Describes diversification as the only
free lunch on Wall Street
But as economist Milton Friedman
was fond of saying “There’s no such
thing as a free lunch.”
2PORTFOLIO EFFECT
Notion that you can fund to a low
confidence level for individual
projects but achieve high
confidence for the portfolio
Example – fund 10 individual
programs to ~60% confidence level
to achieve 80% confidence for the
total portfolio
3HYPOTHESIS VS. REALITY
When you incorporate realistic
assumptions, the portfolio effect
vanishes
Even possible to have a negative
portfolio effect
4DEVIL IS IN THE TAILSWhen funding to percentiles, it is
always at the 80% confidence level
or below
This is not in the tails – real risks are
at the 90-95% confidence levels and
above

THE BENEFITS OF DIVERSIFICATION
DEPEND ON RISK VS. REWARD
“Behold the fool saith, ‘Put not all thine eggs in the one basket’ - which is but a manner of
saying, ‘Scatter your money and your attention;’
but the wise man saith, ‘Put all your eggs in the
one basket and -WATCH THAT BASKET.’”
- Mark Twain
1A NOBEL IDEA
Harry Markowitz pioneered the idea
of the benefits of diversification
Led to the notion of trading risk with
reward
2THEORY VS. REALITYPrior to Markowitz, diversification
was frowned upon on Wall Street
Highly successful investors like
Warren Buffet only hold a few
investments at a time
3INVESTING IN JUNKMichael Milken sold investors on the
idea that if you invest in enough
high-risk investments, your overall
investment is not risky
This approach led to the failure of
Executive Life Insurance Company
in 1990
4SKEWED RISKSMore can go wrong than go right -
entropy
Funding below the mean leads to a
negative portfolio effect – adding
programs increases risk of
overrunning total budget20

21
HC SVNT DRACONES
Hunt-Lenox Globe is one of the
oldest known still in existence
Contains the Latin phrase “HC
SVNT DRACONES” (Here Be
Dragons) near the eastern coast
of Asia
Represents unknown areas,
which have risk and uncertainty

22
HERE BE DRAGONS –
CONSIDERING THE RIGHT TAIL IN
RISK MANAGEMENT
Image: Courtesy of the James Ford Bell Library
Funding to the 80th percentile is
like playing Russian Roulette –
consequence is more important
than likelihood.
1CONFIDENCE LEVEL FUNDING IS
FLAWEDOnly measures risk
Does not provide any risk
management
Consequence of extreme events is
ignored
2PASCAL’S WAGERConsequence vs. likelihood
Even if perceived likelihood of God’s
existence is low, consequence of
unbelief if He exists is huge
Rational bettor should bet on God
3THE LOGNORMAL PARADOXLognormal is riskier than the
overused “normal” distribution
When funding to low levels (below
84% confidence level), “normal”
appears riskier than the lognormal
4BEYOND S-CURVESConfidence levels do not take tail risks
into account
Coherent measures of risk take into
account tail risk and provide risk
management
Examples – Expected Shortfall, Semi-
Deviation
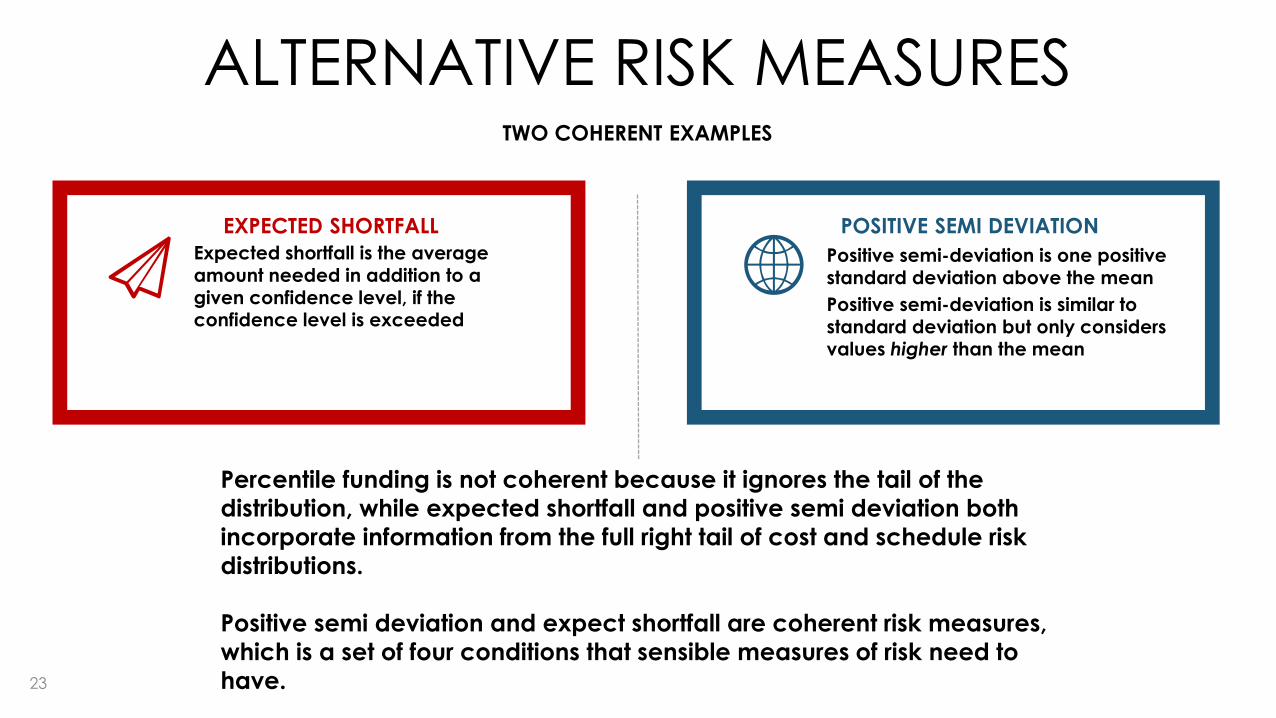
23
ALTERNATIVE RISK MEASURESTWO COHERENT EXAMPLES
EXPECTED SHORTFALL
Expected shortfall is the average amount needed in addition to a given confidence level, if the confidence level is exceeded
POSITIVE SEMI DEVIATION
Positive semi-deviation is one positive standard deviation above the mean
Positive semi-deviation is similar to standard deviation but only considers values higher than the mean
Percentile funding is not coherent because it ignores the tail of the
distribution, while expected shortfall and positive semi deviation both
incorporate information from the full right tail of cost and schedule risk
distributions.
Positive semi deviation and expect shortfall are coherent risk measures,
which is a set of four conditions that sensible measures of risk need to
have.

24
TRYING TO DO TOO MUCH WITH
TOO LITTLE
“We have met the enemy and
he is us” cartoon character
Pogo, by Walt Kelly
1TRAFFIC JAMSTraffic jams in big cities are often
caused by too many cars on the
road at peak times (rush hour)
2TOO MANY PROJECTSTrying to fund too many projects with
limited information is like too many
vehicles on the road
Organizations start new programs
with little money but as they
progress they need more funds
Cheaper to conceive a child than to
raise one
3RESULT – COST AND
SCHEDULE GROWTH
Too many programs cause funding
constraints
Funding constraints cause schedule
delays, resulting in cost growth
4PORTFOLIO MANAGEMENTThere is a critical need for portfolio
risk management
Rarely done at all

25
THINKING STRATEGICALLY
“There is … all the difference between
deliberately creating a system within which
competition will work beneficially as
possible and passively accepting institutions
as they are.” Friedrich Hayek, The Road to Serfdom
1MONEY ALLOCATED IS
MONEY SPENTWriting a contract to a high confidence
level will lead to all the funds getting
spent
Need to hold some of the funding in
reserve
Perverse incentives in cost-plus contracts
2ASYMMETRY OF INCENTIVES
AND INFORMATIONHidden information
Incentive for contractor but none for
government (“skin in the game”)
3MONOPOLY IN PRODUCTION Government does not purchase
data rights, so system developer is a
monopoly producer
Leads to higher cost and lower
quantities – deadweight loss
4MECHANISM DESIGNTurns game theory on its head
Design game to achieve desired
outcomes
Can be used to achieve lower prices
and higher quantities in bargaining
with monopoly
26
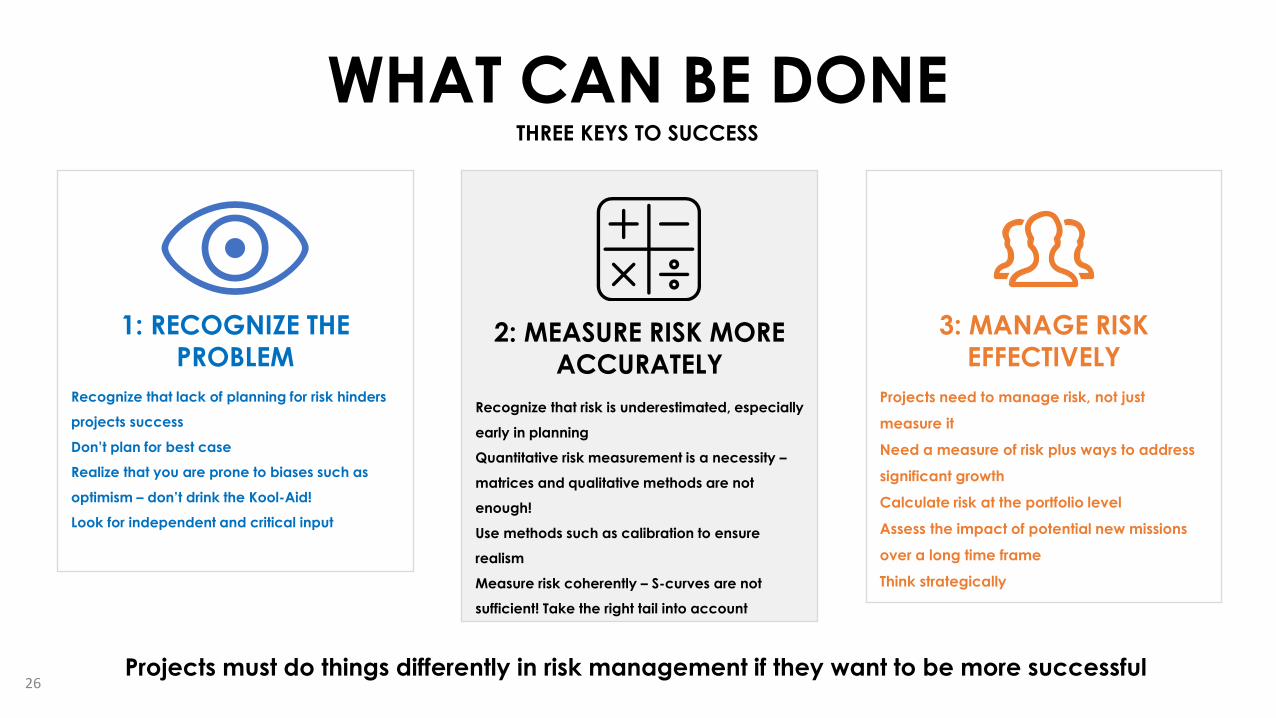
WHAT CAN BE DONETHREE KEYS TO SUCCESS
1: RECOGNIZE THE
PROBLEM
Recognize that lack of planning for risk hinders
projects success
Don’t plan for best case
Realize that you are prone to biases such as
optimism – don’t drink the Kool-Aid!
Look for independent and critical input
2: MEASURE RISK MORE ACCURATELY
Recognize that risk is underestimated, especially
early in planning
Quantitative risk measurement is a necessity –
matrices and qualitative methods are not
enough!
Use methods such as calibration to ensure
realism
Measure risk coherently – S-curves are not
sufficient! Take the right tail into account
3: MANAGE RISK
EFFECTIVELY
Projects need to manage risk, not just
measure it
Need a measure of risk plus ways to address
significant growth
Calculate risk at the portfolio level
Assess the impact of potential new missions
over a long time frame
Think strategically
Projects must do things differently in risk management if they want to be more successful

27
WHAT IS THE POINT?
UNDERSTANDING CONTEXT:
THE HEART OF RISK
MANAGEMENT
Urban Legend: NASA spent millions to design a pen to
write in low gravity environments while Russian
cosmonauts used a pencil – the story is not exactly true
(e.g., pencils are flammable) but it provides a valuable
lesson: risk management also entails looking at the
outcome you want to achieve and finding low risk way to
achieve it.
Risk management is
not about avoiding
risk but
understanding it in
order to maximize
the odds of success.