- solvent extraction database -infochim.u-strasbg.fr/recherche/research/sxd_manuel_eng.pdf ·...
TRANSCRIPT
- Solvent eXtraction Database -
- manual -
SXD user manual
Three modes of functioning are available:
• Adminisitrator mode: database management and creation/deletion of users accounts.
• Operator mode: supply SXD using an electronic form • User mode: search and exploitation of the information from SXD.
1

Administrator manual
1.Home Main page shows the functions available to the administrator
2. Users The administrator creates or deletes the users’ accounts. The list of the users of SXD can be visualized.
3. Database
This part is related to the management of the SXD.
2
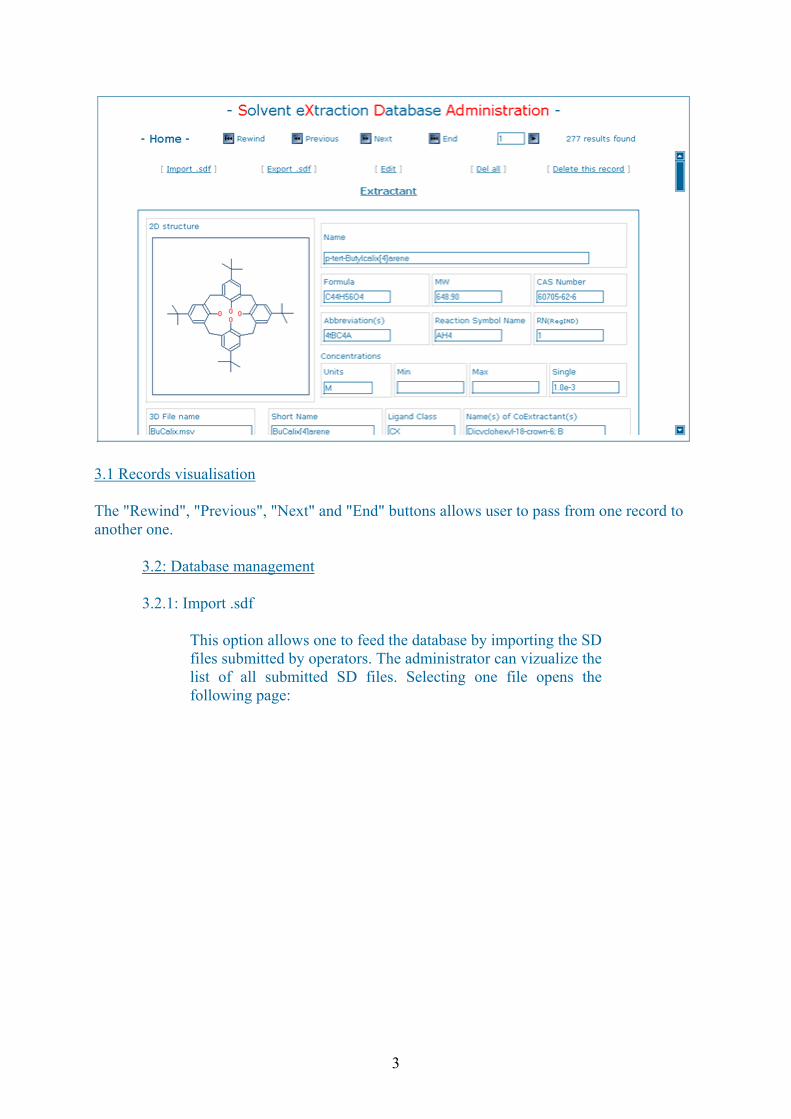
3.1 Records visualisation
The "Rewind", "Previous", "Next" and "End" buttons allows user to pass from one record to another one.
3.2: Database management
3.2.1: Import .sdf
This option allows one to feed the database by importing the SD files submitted by operators. The administrator can vizualize the list of all submitted SD files. Selecting one file opens the following page:
3

One SD file can contain information about several extraction systems, each of whose represents a potential record of SXD. Administrator verifies the content of each record using the "View" button. If the data are correct, the record(s) are imported in SXD using the "Import" or the "Import all" button. If the SD file is not incorrect, Administrator uses the "Reject this file" button to send his comments and the SD file to the operator
3.2.2: Export sdf
This function allow administrator to export the records from the database to the SD file. For confidentiality reasons, it is protected with login and password which by default are the same as the login and password of the administrator.
The administrator can export either one record only, or several records (from X record to Y record) or all records. Selecting X-Y interval is advised when the number of exported records is very big; this allows administrator to create several SD files instead of one huge file.
The program creates the SD file on the server followed by its automatic download to the client machine. When the download procedure is finished, the file created on the server can be deleted using a corresponding “Delete” button.
4
3.2.3: Edit
This function allows administrator to edit selected records from the database. One can select one record using the "Rewind", "Previous", "Next" and "End" buttons, then clicking on the “Edit” button. In a current record, all fields can be modified except of ID (RegIND). The modified record is saved since it is submitted to the database.
3.2.4: Del all
This function allows administrator to delete all records. For security reasons, administrator login and password are requested.
Warning: There's no way to undo this operation.
3.2.5: Delete this record
This function allows administrator to delete the selected record from the database. The program presents the detailed report showing if the procedure was successful.
Warning: There's no way to undo this operation.
4. SD files
This option allows the administrator to show and to download the SD files stored on the /files/sdf/ operators directories on the server. Files submitted by operators are not listed here.
5. Other files
This option allows the administrator to visualize and to download different types of files stored on the server. It concerns the files corresponding to 2D structures (MOL and PNG), to graphs (PNG) and to some temporary files.
6. Tools
This menu bring together the following functions:
6.1: Change the news
5
Here, the administrator writes a message informing all users about the date of the last update of SXD or the maintenance periods. Being posted, that message appears at the user home page.
6.2 Remove all temporary files
This function allows administrator to delete all temporary files stored on the server.
Remark: Only files from disconnected users are deleted.
6.3 View all admin temporary files
This function allows administrator to see the content of his temporary directory.
6

Operator manual
This part is related to the "Supply SXD" menu.
The operator’s interface includes 5 sub menus:"MOL files", "SD files", "Submitted files", "Submit results" and "All files".
Operators feed SXD using an electronic form. The submitted data are stored on the server as SD files. Each operator has his directory containing several sub directories.
The SXD feeding proceeds in two steps: (i) drawing or importing the 2D structure of extractant using the Mol files menu and, (ii) an input of experimental extraction data using the SD files menu.
1.1: "MOL files"
This option allows the user to input 2D chemical structures of the extractant molecule. There are two possibilities: (i) to import a MOL file using the "Enter the MOL file you want to import" button and, (ii) to draw the structure using the JAVA applet included in SXD.
7
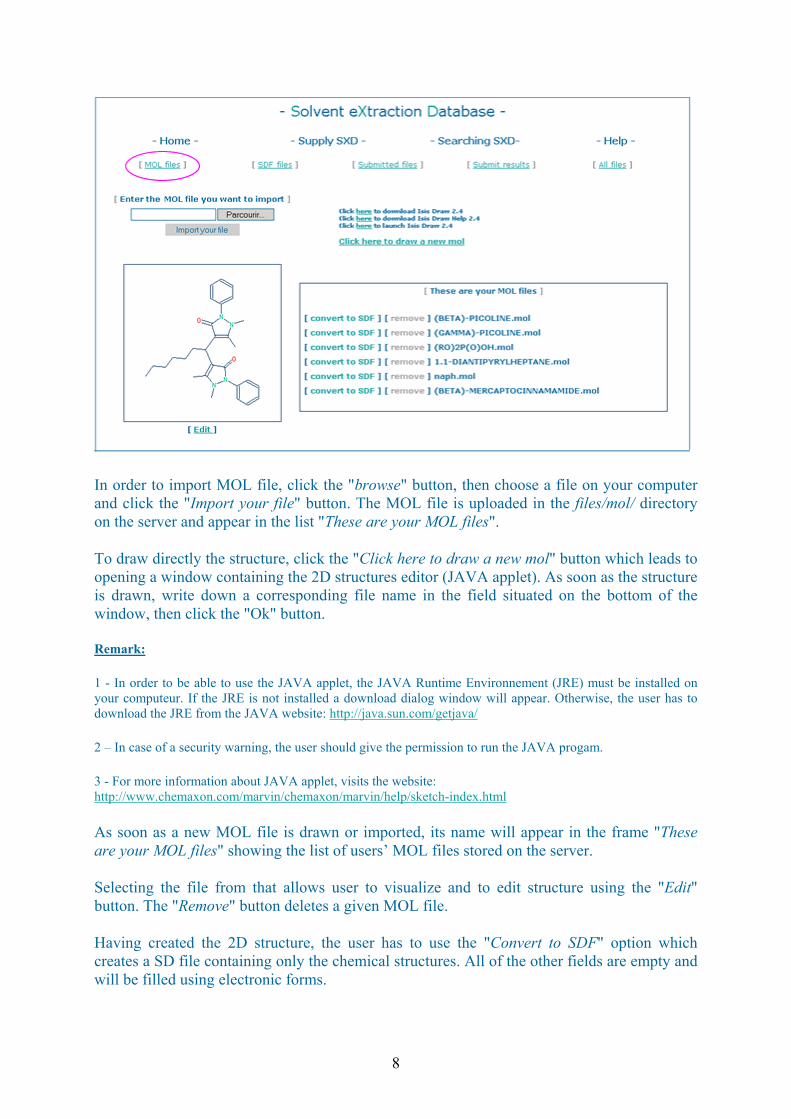
In order to import MOL file, click the "browse" button, then choose a file on your computer and click the "Import your file" button. The MOL file is uploaded in the files/mol/ directory on the server and appear in the list "These are your MOL files".
To draw directly the structure, click the "Click here to draw a new mol" button which leads to opening a window containing the 2D structures editor (JAVA applet). As soon as the structure is drawn, write down a corresponding file name in the field situated on the bottom of the window, then click the "Ok" button.
Remark:
1 - In order to be able to use the JAVA applet, the JAVA Runtime Environnement (JRE) must be installed on your computeur. If the JRE is not installed a download dialog window will appear. Otherwise, the user has to download the JRE from the JAVA website: http://java.sun.com/getjava/
2 – In case of a security warning, the user should give the permission to run the JAVA progam.
3 - For more information about JAVA applet, visits the website: http://www.chemaxon.com/marvin/chemaxon/marvin/help/sketch-index.html
As soon as a new MOL file is drawn or imported, its name will appear in the frame "These are your MOL files" showing the list of users’ MOL files stored on the server.
Selecting the file from that allows user to visualize and to edit structure using the "Edit" button. The "Remove" button deletes a given MOL file.
Having created the 2D structure, the user has to use the "Convert to SDF" option which creates a SD file containing only the chemical structures. All of the other fields are empty and will be filled using electronic forms.
8
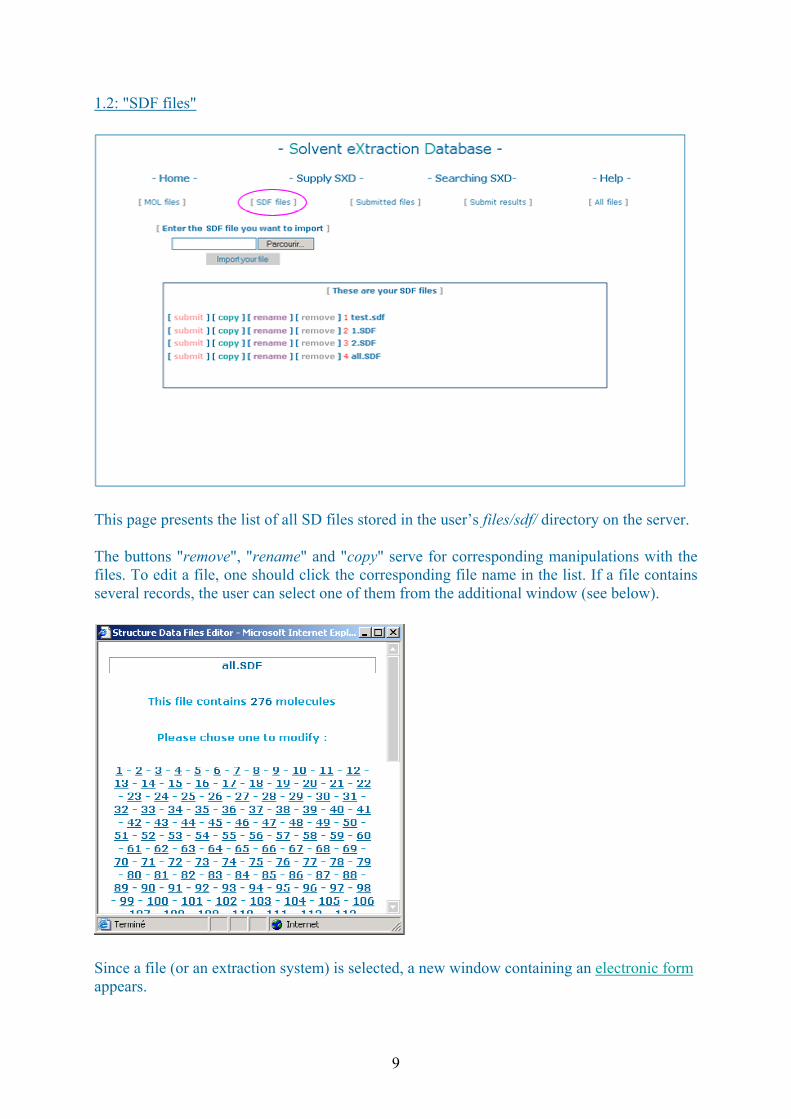
1.2: "SDF files"
This page presents the list of all SD files stored in the user’s files/sdf/ directory on the server.
The buttons "remove", "rename" and "copy" serve for corresponding manipulations with the files. To edit a file, one should click the corresponding file name in the list. If a file contains several records, the user can select one of them from the additional window (see below).
Since a file (or an extraction system) is selected, a new window containing an electronic form appears.
9

The textual and numerical data are entered by filling the corresponding fields. To edit the structure of the extractant one should click on the extractant picture, then use 2D editor (JAVA applet.) In order to draw the graphs, the data are placed in the field "XY_Data".
7.236 0.08.605 0.0619.421 0.24110.05 0.50811.55 0.899
Remarks: - The X and Y values must be entered corresponding to the ascending order of X. - Only unique values of X are permitted.
Having finished the input of the X-Y values, use the "Redraw graph" button to visualize the graph.
The SXD software allows the user to input an unlimited number of curves on each plot as well as an unlimited number of plots for each record. To add a curve or a plot use "Add plot" or "Add graph" menus.
Use the "valid your entry" button to save the data.
Remark: If your browser displays a message asking if you want to close the window, you should answer "yes". Some browsers ask for a confirmation before running the JavaScript commands used in the SXD code.
The "Submit" button serves to submit the prepared SD file to the administrator. It should be noted that the data submitted by the operators must be validated by the administrator before being loaded to the database.
The selected SD file is located in the files/submit directory on the server. All files in that directory are accessible via the "Submitted files" part.
1.3: "Submitted files"
This page presents the list of all SD files submitted to the administrator and located in the files/submit directory on the server. The "Cancel" option moves the selected file into the "SD File" part in order to modify it. (Then, the operator will have to re-submit the file when the modifications are done.) Any file can be removed, renamed or visualized using the corresponding buttons.
As soon as the administrator validates a given SD file, it is copied in the files/succes/ directory or in the files/error/ directory and, hence, it will disappear from this list of submitted files.
1.4: "Submit results"
10

This part concerns the files which have been examined by the administrator. The top frame shows the list of the files which have been successfully imported in the database. Those files are stored on the server in the sdf/succes/ directory and they can be visualized, removed or downloaded using the corresponding buttons.
The bottom frame shows the list of the files which have been rejected by the administrator and stored on the server in the sdf/error/ directory. To read the administrators’ comments, use the "View note" button. Operator can edit the SD file clicking the corresponding file name and re-submit it using the "Submit" button.
1.5: "All files"
This part presents the list of all the MOL and SD files used for the alimentation of SXD. The submitted SD files are not given in thas list.
1.6: Remarks:
The "graph", "structure" and "temp" are temporary directories to which the user has no access. The "query" directory is related to the user’s part, it is used to save the search query submitted to the database search engine. (see user manual for the details).
11
User manual
This part is related to the "Searching SXD" menu of the user interface.
There are two ways to retrieve an information from the database:
- Search by form: The user prepares a query using an electronic form. - Filtering: The user groups the records according to selected parameters.
1. Search by form
The first page contains the search form. Once prepared the query is automatically saved, which allows the user to refine the next search. The "New query" option clears the form.
To prepare a query, the user fills one or more fields in the form which corresponds to the Boolean ‘AND’. The SXD search engine also includes some functions giving a certain flexibility in query preparation. For example, it is possible to input an incomplete name for a textual fields or a range of values for numeric fields.
The following functions are available:
Operator Function Example % Replaces any number of unspecified characters calix%arene _ Replaces only one unspecified character c_lix[4]arene < Searches of values less than the target value <100 > Searches of values larger than the target value >100 - Searches of values in the range between x and y 100-200
exists Searches all records where a given field is filled exists
Remarks:
- The wildcard ‘%’ and ‘_’ are applied only for textual variables. - The operators ‘<’, ‘>’ and ‘-‘ are applied only for numerical variables.
- If the option "Graph exists" is selected, the program searches the records which includes the plots.
- - By default, for any textual field in the query, the search is performed as: %word%.
12
- Example: the search for "benzene" in the "Name" field, results in "benzene", "chloro-benzene" etc...
- - For any numerical field in the query values, if a exact value is written the search is performed automatically for the range of ±1%.
Example: If 100 is written in the temperature field, the search engine selects all records where temperature is included in the range of 99 to 101.
The program recognizes automatically a correspondence between different unities for the temperature and pressure. Thus, for the query containing “25” and "C" in the fields “Temperature” and "T Unit" fields, respectively, the search engine retrieves the records corresponding to 25°C and to 298 K.
Unities used for temperature:
Symbol Unity C Celsius degree K Kelvin degree
Unities used for pressure
Symbol Unity atm Atmosphere bar Bar Pa Pascal psi Pound- per square inch mmHg Millimetres of mercury
As soon as the query form is completed, click on the "Search" button to perform the search. To refine the search, the user can modify the query by clicking the "Edit query" button or create a new one using the "New query" button.
The SXD search engine applies both structural and alphanumerical search procedures. The retrieved information is given in a table containing (i) an index of the record in the database, (ii) the 2D structure of the extractant, (iii) the extracted metal and (iv) the diluent.
13

In order to see the content of retrieved records, the user has to select one or several records from the list or to use the “Select all records” button, then to click the "View selected results" button.
As soon as a new record appears, the user can pass from one selected record to another one using the "Rewind", "Previous", "Next" and "End" buttons. The "Extractant", "Phases", "Exp. conditions", "Graphs", "Numeric properties" and "References" buttons provide a rapid access to different parts of the given record.
The [ PDF ] button allows one to create a PDF file corresponding to one selected record.
2. Filtering:
This option allows one to group the records according to certain filter criteria (see Figure below).
For example, the user can select the records related to extraction of a given cation by different ligands under similar conditions (temperature, pressure, pH, diluent).
14
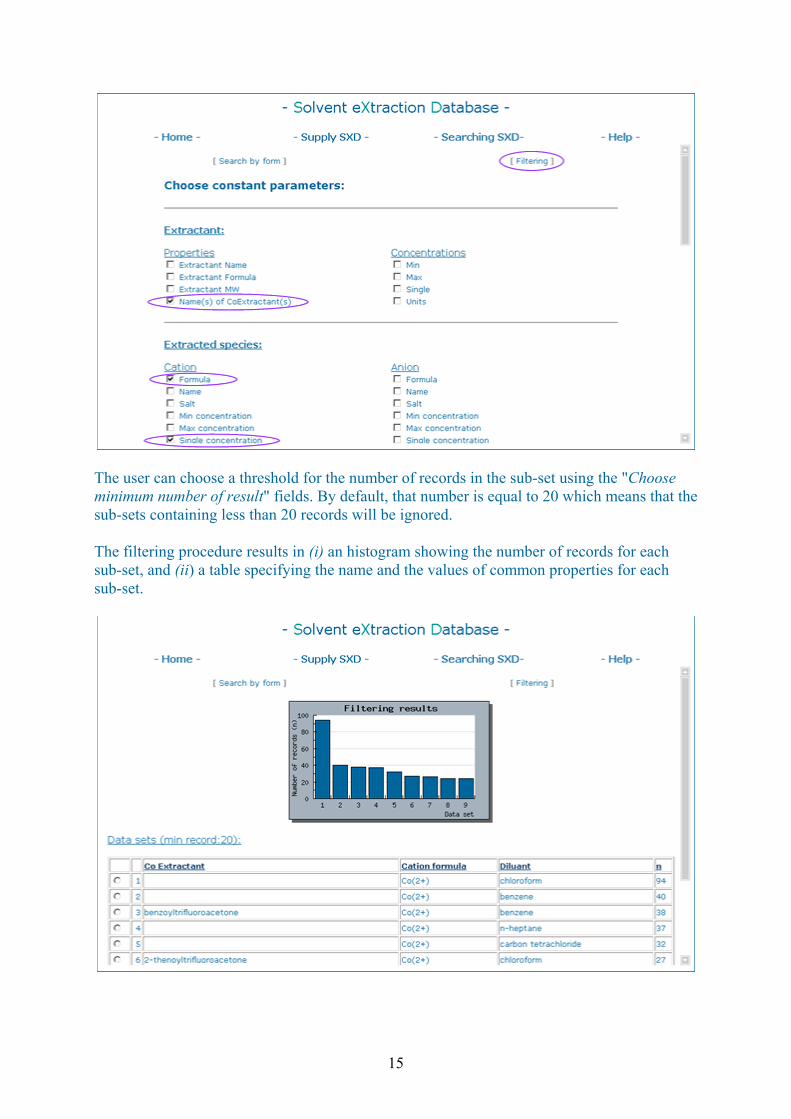
The user can choose a threshold for the number of records in the sub-set using the "Choose minimum number of result" fields. By default, that number is equal to 20 which means that the sub-sets containing less than 20 records will be ignored.
The filtering procedure results in (i) an histogram showing the number of records for each sub-set, and (ii) a table specifying the name and the values of common properties for each sub-set.
15

Using the "View data-set" button the user can visualize the content of the selected sub-sets as a table containing internal number of records in SXD, the 2D structure of extractants, the name of the cation and some thermodynamics properties (logK and logD).
The "View detailed report with selected results” button shows content of the selected records.
3. Curves comparison tools
This option allows the user to place the curves from the different records in one plot. This procedure is launched using the "Compare graph" button in the “Graphs” section in any record having at least one plot.
16

In the new window, the user has to select the filtering criteria related to axis names, cation, and composition of aqueous and organic phases. The filtered results are presented in the table containing the number of record in SXD, the numbers of a plot and a curve on a given plot (if there are some), as well as the filtering criteria. If the initial plot contains several curves, the user can select some of them using the “Redraw graph” and "Clear unselected" buttons.
The user can switch on/off the filtering criteria using corresponding checkboxes. The “View filtering results” button visualizes the list of records which satisfy the selected criteria (table “Filtering results”).
In order to place curves from different records in the same plot, the user should select the curves to be compared from the table “Filtering results” and to use the "Add to graph" button.
17

When the selected records appear in the “Plots” table, the user visualises an ensemble of curves with the “Redraw graph” button.
18