solvency ii introduction to pillar 3 - welcome to the ... · solvency ii –introduction to pillar...
TRANSCRIPT

Solvency II – Introduction to Pillar 3
Friday 20th May 2016

The views expressed in this presentation are
those of the presenter(s) and not necessarily
of the Society of Actuaries in Ireland
Disclaimer

• Ursula Morrow, Senior Consultant, PwC
• Rob Murphy, Consultant, PwC
Introduction
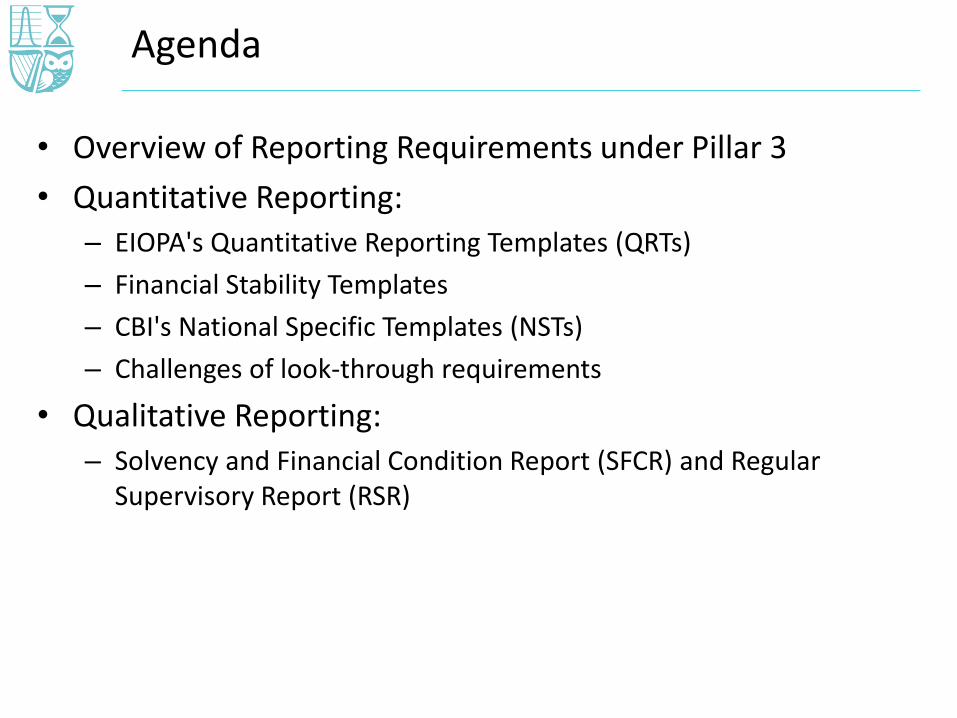
• Overview of Reporting Requirements under Pillar 3
• Quantitative Reporting:
– EIOPA's Quantitative Reporting Templates (QRTs)
– Financial Stability Templates
– CBI's National Specific Templates (NSTs)
– Challenges of look-through requirements
• Qualitative Reporting:
– Solvency and Financial Condition Report (SFCR) and Regular Supervisory Report (RSR)
Agenda
Overview of Reporting Requirements
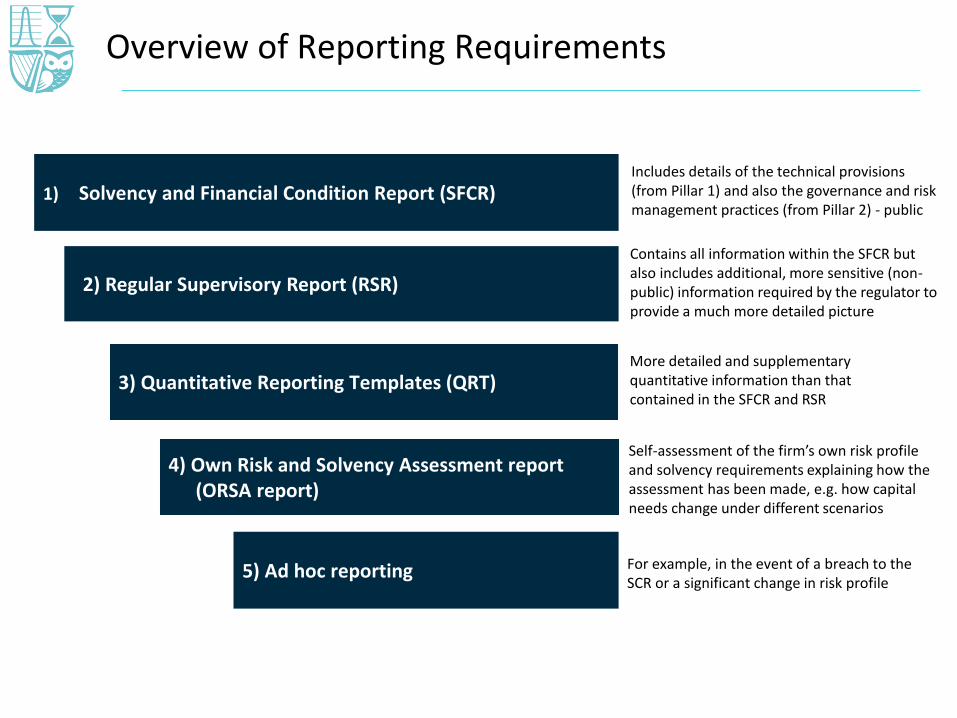
4) Own Risk and Solvency Assessment report (ORSA report)
2) Regular Supervisory Report (RSR)
3) Quantitative Reporting Templates (QRT)
1) Solvency and Financial Condition Report (SFCR)
5) Ad hoc reporting
Includes details of the technical provisions (from Pillar 1) and also the governance and risk management practices (from Pillar 2) - public
Contains all information within the SFCR but also includes additional, more sensitive (non-public) information required by the regulator to provide a much more detailed picture
More detailed and supplementary quantitative information than that contained in the SFCR and RSR
Self-assessment of the firm’s own risk profile and solvency requirements explaining how the assessment has been made, e.g. how capital needs change under different scenarios
For example, in the event of a breach to the SCR or a significant change in risk profile
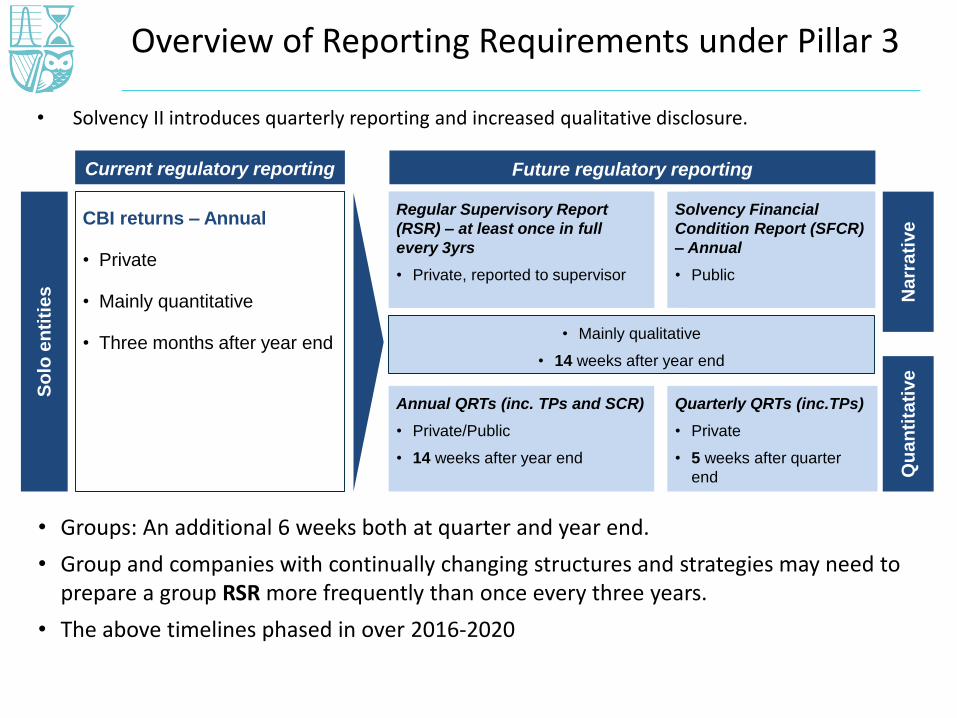
• Solvency II introduces quarterly reporting and increased qualitative disclosure.
Overview of Reporting Requirements under Pillar 3
Regular Supervisory Report
(RSR) – at least once in full
every 3yrs
• Private, reported to supervisor
Solvency Financial
Condition Report
(SFCR) – Annual
• Public
Future regulatory reporting
Annual QRTs (inc. TPs and SCR)
• Private/Public
• 14 weeks after year end
So
lo e
nti
tie
s
CBI returns – Annual
• Private
• Mainly quantitative
• Three months after year end
Current regulatory reporting
Na
rra
tive
Qu
an
tita
tive
Regular Supervisory Report
(RSR) – at least once in full
every 3yrs
• Private, reported to supervisor
Solvency Financial
Condition Report (SFCR)
– Annual
• Public
Quarterly QRTs (inc.TPs)
• Private
• 5 weeks after quarter
end
• Mainly qualitative
• 14 weeks after year end
• Groups: An additional 6 weeks both at quarter and year end.
• Group and companies with continually changing structures and strategies may need to prepare a group RSR more frequently than once every three years.
• The above timelines phased in over 2016-2020
Quantitative Reporting Requirements
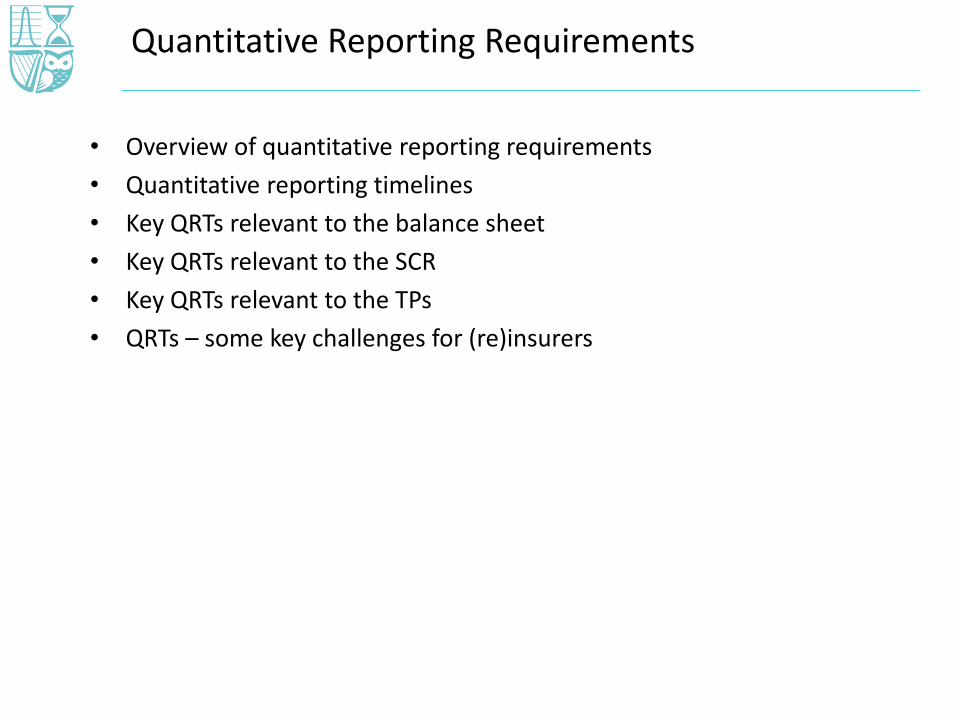
• Overview of quantitative reporting requirements
• Quantitative reporting timelines
• Key QRTs relevant to the balance sheet
• Key QRTs relevant to the SCR
• Key QRTs relevant to the TPs
• QRTs – some key challenges for (re)insurers

Overview of Quantitative Reporting Requirements
ComponentNumber of templates
What is included?
EIOPA designated QRTs
80• Applicable QRTs for an undertaking will depend on nature of
business, e.g. life / non-life, mix of assets, use of MA
Financial stability (FS) QRTs
9
• Only applicable to solo entities or groups with assets > €12bn• Extra information included on duration of technical
provisions, P&L, discretionary benefits and lapses
ECBadd-ons
5
• Extra fields added to Balance sheet and List of Assets QRTs• 3 new QRTs covering deposits to cedants, pension
entitlements and non-life reinsurance policies split by country
National Specific Templates (NSTs)
14
• Applicability varies, e.g. by life and non-life, PRISM rating• NSTs include income statement, quarterly balance sheet,
non-life specific and variable annuity specific information
Overview of Quantitative Reporting Requirements
Key messages
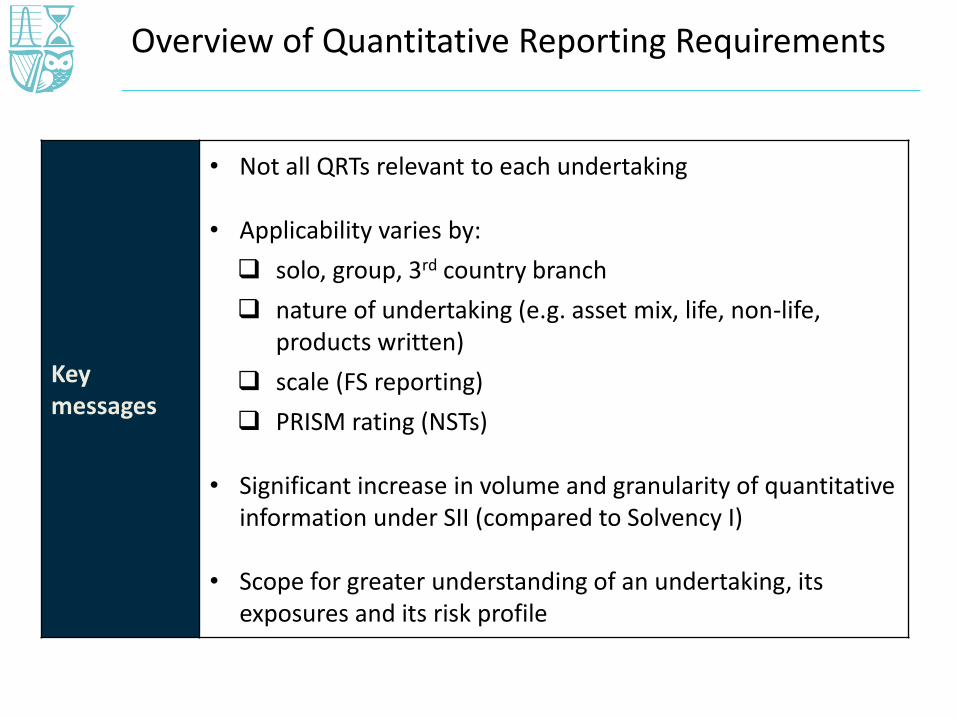
• Not all QRTs relevant to each undertaking
• Applicability varies by:
solo, group, 3rd country branch
nature of undertaking (e.g. asset mix, life, non-life, products written)
scale (FS reporting)
PRISM rating (NSTs)
• Significant increase in volume and granularity of quantitative information under SII (compared to Solvency I)
• Scope for greater understanding of an undertaking, its exposures and its risk profile

Quantitative Reporting Timelines
Reporting Deadline What is included?
Day 1Within 20
weeks of year end 2015*
• One off reporting requirement on transition to SII• Subset of EIOPA QRTs, e.g. Balance sheet, Own Funds, MCR
and SCR
QuarterlyWithin 8 weeks of quarter end
2016**
• EIOPA QRTs include balance sheet, own funds, TPs, SCR, assets, derivatives and look through
• 3 ECB add-ons and 1 FS QRT (where applicable)• All NSTs (where applicable to an undertaking)
AnnualWithin 20
weeks of year end 2016**
• Full set of EIOPA QRTs• Additional FS and ECB add-ons• Subset of NSTs (where applicable to an undertaking)
* Where applicable
** These timescales reduce in future years (reducing to 5 weeks and 14 weeks by 2019 for quarterly and annual submissions, respectively)

Key QRTs relevant to the balance sheet
Area QRT Name
Assets
S.06.02 List of assets
S.06.03 Collective investment schemes
S.08.01 Open Derivatives
Off Balance sheet items
S.03.01 Off-balance sheet items – general
S.08.02 Off-balance sheet items – list of guarantees received
S.09.01 Off-balance sheet items – list of unlimited guarantees provided
Technical Provisions
S.12.01 Life and Health SLT Technical Provisions
S.17.01 Non-life Technical Provisions
Variation analysis
S.29.01 Analysis of variation of excess of assets over liabilities
S.29.02 Analysis of changes due to investments and financial liabilities
S.29.03 Analysis of changes due to technical provisions
OtherS.23.01 Own Funds
S.24.01 Participations held

Assets• All assets held by the insurer attributable to both shareholders and
policyholders
• Individual asset holdings in collective investment schemes
• Derivative holdings as at the valuation date
• Derivative transactions over the previous reporting period
Off Balance sheet items
Technical Provisions
Variation analysis
Other
Key messages
QRT information enables better understanding of assets held by an undertaking, e.g.
• Exposures, concentrations, consistency with stated investment and hedging strategy
Key QRTs relevant to the balance sheet
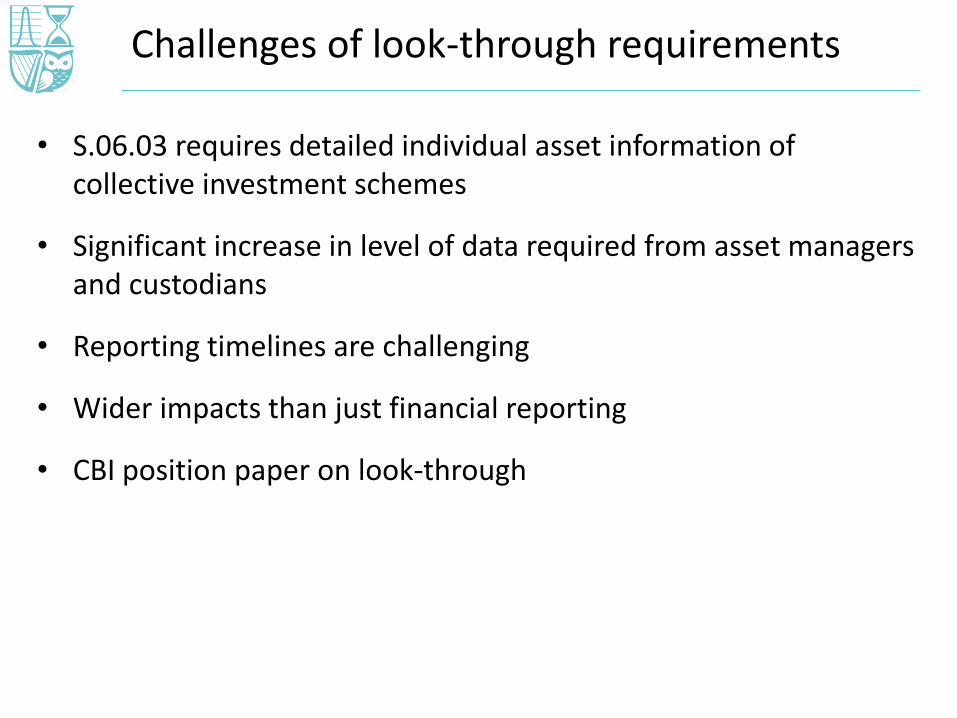
• S.06.03 requires detailed individual asset information of collective investment schemes
• Significant increase in level of data required from asset managers and custodians
• Reporting timelines are challenging
• Wider impacts than just financial reporting
• CBI position paper on look-through
Challenges of look-through requirements
Assets
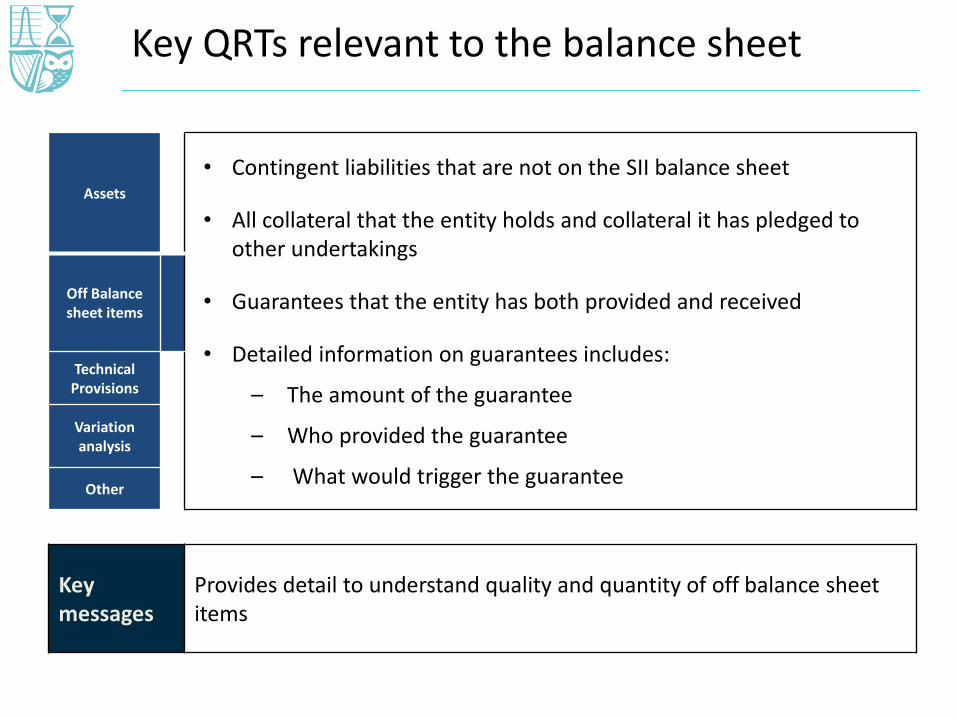
• Contingent liabilities that are not on the SII balance sheet
• All collateral that the entity holds and collateral it has pledged to other undertakings
• Guarantees that the entity has both provided and received
• Detailed information on guarantees includes:
– The amount of the guarantee
– Who provided the guarantee
– What would trigger the guarantee
Off Balance sheet items
Technical Provisions
Variation analysis
Other
Key messages
Provides detail to understand quality and quantity of off balance sheet items
Key QRTs relevant to the balance sheet

Assets • The split of the following items across SII product classes for each insurance segment:
– Technical provisions
– The risk margin
– Reinsurance
• A split of technical provisions into component cash flows
• The surrender value of contracts (life insurance only)
• The impact of the volatility adjustment and transitional measures
Off Balance sheet items
Technical Provisions
Variation analysis
Other
Key messages
• Provides analysis of technical provisions components across product segments
• Includes projection of component cash flows
Key QRTs relevant to the balance sheet

Assets A comprehensive step–through of excess assets over liabilities over the reporting period includes variation in:
– Each basic own fund item
– The reconciliation reserve
– Investments and Financial liabilities
– Technical provisions
– The impact of income tax and dividend distribution during the reporting period is also shown
Off Balance sheet items
Technical Provisions
Variation analysis
Other
Key messages
Key QRTs for understanding movements in the period, e.g.
• changes in capital / financing structure
• experience variance (claims, expenses)
• impact of new business
Key QRTs relevant to the balance sheet

Assets
Own funds
• Line by line split of basic own funds, ancillary own funds and the reconciliation reserve
• Expected profits in future premiums
• All items are allocated to Tier 1, Tier 2 and Tier 3 own funds
Participations
• List of all participations split into strategic and non-strategic along with financial institutions and non-financial institutions
• Classified as type 1 or type 2 equity
Off Balance sheet items
Technical Provisions
Variation analysis
Other
Key messages
• Provides detail on source of all Tier 1,2 and 3 own funds and how these are used to support the MCR and SCR
• Provides a breakdown of all participations along with how they are classified
Key QRTs relevant to the balance sheet

Key QRTs relevant to the SCR
Area QRT Name
SCRSummary
S.25.01 SCR – for undertakings on Standard Formula
S.25.02 SCR – for undertakings using the standard formula and partial internal model
S.25.03 SCR – for undertakings on full internal model
Individual risks
S.26.01 SCR – Market risk
S.26.02 SCR – Counterparty default risk
S.26.03 SCR – Life underwriting risk
S.26.04 SCR – Non-life underwriting risk
S.26.05 SCR – Health underwriting risk
S.26.06 SCR – Operational risk
S.26.07 SCR – Simplifications
S.27.01 SCR – Non-life and health NSLT catastrophe
MCRS.28.01 MCR – Only life or only non-life (re)insurance
S.28.02 MCR – Both life and non-life insurance

SCR Summary
• These QRTs are required for opening reporting and on a quarterly basis
• Gross and net SCR figures are available for all components of the basic SCR
• Further information available on loss absorbency of deferred tax and technical provisions
• Information also available on ring fenced funds and matching adjustment portfolios
Individual risks
MCR
Key messages
The summary SCR QRTs provide a high-level overview of the SCR and will be available from day one (and each quarter)
Key QRTs relevant to the SCR

SCR Summary
• These QRTs are required on an annual basis so the first version will be available in 2017 based on year-end 2016
• Impact of each stress on assets and liabilities is shown
• Life and market risk impacts are shown before and after the impact of loss absorbency of technical provisions
• Non-life risk impacts shown before and after the impact of reinsurance
• Information on simplifications used is also available
Individual risks
MCR
Key messages
• Information must be published on individual sub-risks annually
• Data is very granular (e.g. the impact of lapse up and down as well as interest rate up and down are disclosed)
Key QRTs relevant to the SCR

SCR Summary
• These QRTs are required for opening reporting and on a quarterly basis
• The linear MCR, the SCR cap and floor values are all presented along with the final MCR
Individual risks
MCR
Key messages
The summary MCR QRTs provide an overview of the MCR and will be available from day one (and each quarter)
Key QRTs relevant to the SCR

Key QRTs relevant to Life and Health SLT TPs
QRT Name
S.12.01 Life and Health SLT TPs
S.12.02 Life and Health SLT TPs – by country
S.13.01 Projection of future gross cash flows
S.14.01 Life obligation analysis
S.15.01 Description of the guarantees of variable annuities
S.15.02 Hedging of guarantees of variable annuities
S.16.01 Information on annuities stemming from Non-Life Insurance obligations
S.22.01 Impact of long term guarantees and transitional measures
S.22.02 Projection of future cash flows (Best Estimate – Matching portfolios)
S.22.03 Information on the matching adjustment calculation
S.22.04 Information on the transitional on interest rates calculation
S.22.05 Overall calculation of the transitional on technical provisions
S.22.06 Best estimate subject to volatility adjustment by country and currency
S.29.03 Analysis of Change due to Technical Provisions

S.12.01 Life and Health SLT TP
• This template provides an analysis of life and health SLT technical provisions by type of contract (e.g. with profits, linked, other).
• The information is split between the best estimate and the risk margin(with technical provision calculated as a whole separately reported).
• The annual template provides more detailed sub-analyses.
Key messages
• Facilitates consistency checks (e.g. across QRTs, period on period, gross vs net of reinsurance)
• Provides more granular understanding of TPs by segment

S.13.01 Projection of future gross cash flows
• Provides analysis of cash flows by line of business by year over the next 30 years, by decade up to 50 years and in total thereafter.
Key messages
Profile and length of projected cashflows aids understanding of exposures (e.g. impact of discounting, future premiums and persistency) and reasonableness of component cashflows
S.29.03 Analysis of changes due to technical provisions
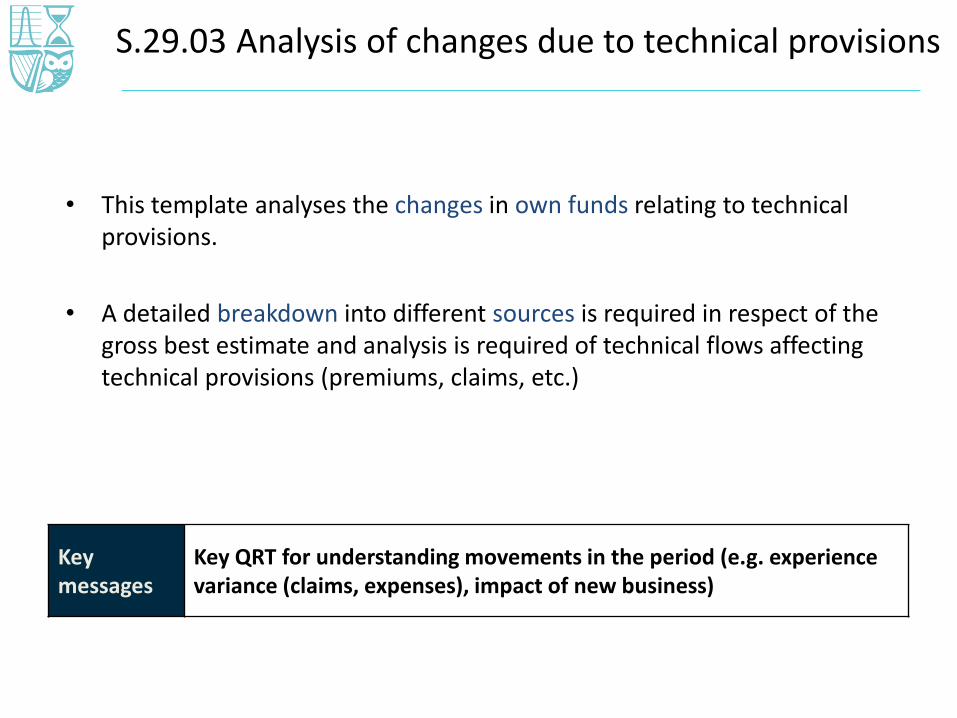
• This template analyses the changes in own funds relating to technical provisions.
• A detailed breakdown into different sources is required in respect of the gross best estimate and analysis is required of technical flows affecting technical provisions (premiums, claims, etc.)
Key messages
Key QRT for understanding movements in the period (e.g. experience variance (claims, expenses), impact of new business)
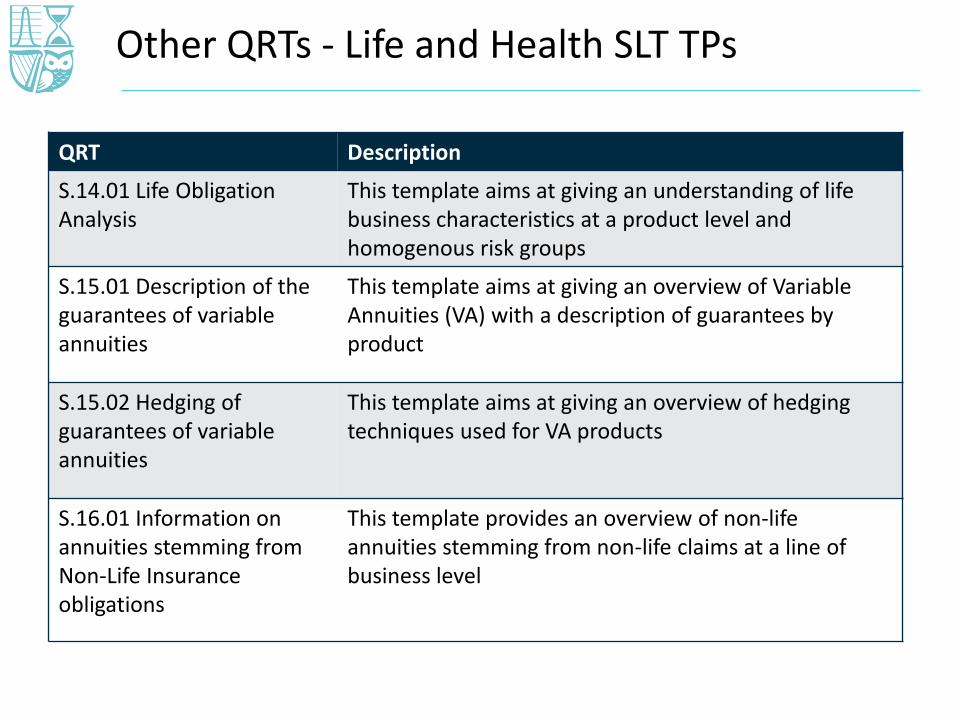
Other QRTs - Life and Health SLT TPs
QRT Description
S.14.01 Life Obligation Analysis
This template aims at giving an understanding of life business characteristics at a product level and homogenous risk groups
S.15.01 Description of the guarantees of variable annuities
This template aims at giving an overview of Variable Annuities (VA) with a description of guarantees by product
S.15.02 Hedging of guarantees of variable annuities
This template aims at giving an overview of hedging techniques used for VA products
S.16.01 Information on annuities stemming from Non-Life Insurance obligations
This template provides an overview of non-life annuities stemming from non-life claims at a line of business level

Other QRTs - Life and Health SLT TPs
QRT Description
S.22.01 Impact of long term guarantees and transitional measures
Analyses the impact of the long term guarantee and transitional measures on technical provisions, basic own funds, own funds eligible to meet the SCR by tier, and the SCR.
S.22.02 Projection of future cash flows (Best Estimate – Matching portfolios)
Provides a projection of cash flows and analysis of mismatch during the reporting period for each matching adjustment portfolio
S.22.03 Information on the matching adjustment calculation
Provides information on the calculations supporting the matching adjustment, by matching adjustment portfolio

Other QRTs - Life and Health SLT TPs
QRT Description
S.22.04 Information on the transitional on interest rates calculation
Provides information on the calculation of the transitional arrangements on interest rates, by currency for which the adjustment is calculated.
S.22.05 Overall calculation of the transitional on technical provisions
Provides the information on the calculation of the transitional adjustment on technical provisions
S.22.06 Best estimate subject to volatility adjustment by country and currency
Provides information on the best estimate subject to volatility adjustments by country and currency
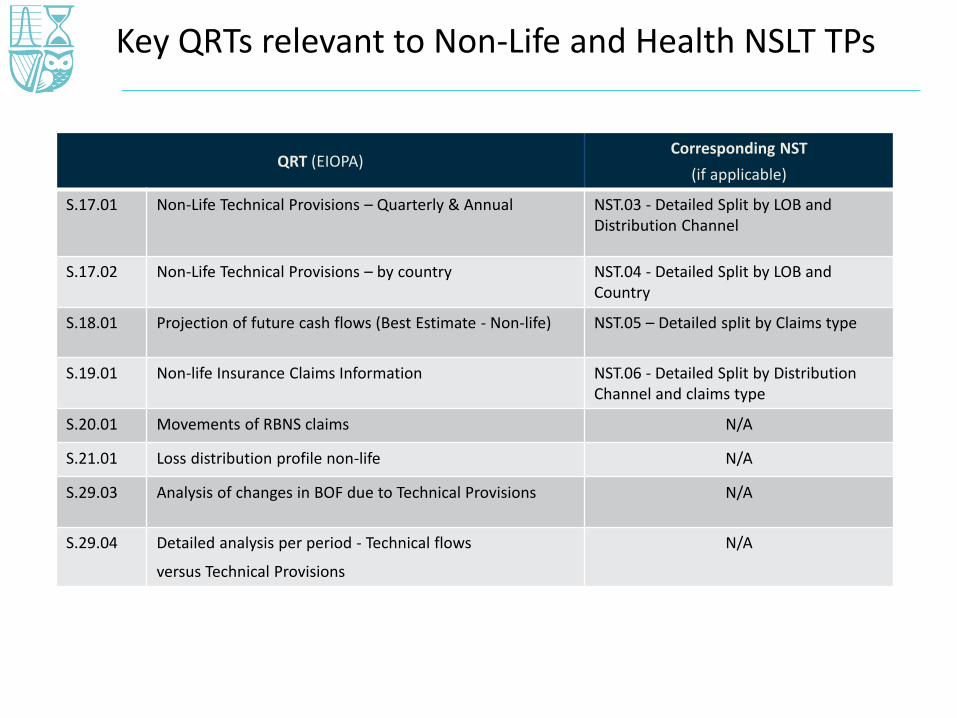
Key QRTs relevant to Non-Life and Health NSLT TPs
QRT (EIOPA)Corresponding NST
(if applicable)
S.17.01 Non-Life Technical Provisions – Quarterly & Annual NST.03 - Detailed Split by LOB and Distribution Channel
S.17.02 Non-Life Technical Provisions – by country NST.04 - Detailed Split by LOB and Country
S.18.01 Projection of future cash flows (Best Estimate - Non-life) NST.05 – Detailed split by Claims type
S.19.01 Non-life Insurance Claims Information NST.06 - Detailed Split by Distribution Channel and claims type
S.20.01 Movements of RBNS claims N/A
S.21.01 Loss distribution profile non-life N/A
S.29.03 Analysis of changes in BOF due to Technical Provisions N/A
S.29.04 Detailed analysis per period - Technical flows
versus Technical Provisions
N/A

S.17.01 Non-Life Technical Provisions
S.17.01
S.17.02
S.18.01
S.19.01
S.20.01
S.21.01
S.29.03 & S.29.04
• Provides an analysis of technical provisions by line of business
• Information is split between the best estimate and the risk margin
• (Re)insurers are required to submit both annual (S.17.01.01) and quarterly templates (S.17.01.02)
• The annual template provides more detailed sub-analyses
• Direct/ Accepted Proportional/ Accepted Non-Proportional
• Recoverables from reinsurance
• NST .03 : Provides a Detailed Split by LOB and Distribution Channel
• Distribution Channel: Direct and All intermediated including Broker
• LoB: Motor Vehicle split into Private Motor and Commercial Motor, Liability is split into Employers Liability and Public Liability

S.17.02 Non-Life Technical Provisions - by country
• Provides an analysis of technical provisions by line of business and by country (for direct business only)
• This is an annual template
• Completion thresholds apply - Information on technical provisions by country is only required to achieve a 90% coverage.
• NST .04 : Provides a Detailed Split by LOB and Distribution Channel
• Distribution Channel: Direct and All intermediated including Broker
• LoB: Motor Vehicle split Private Motor and Commercial Motor, Liability split Employers Liability and Public Liability
S.17.01
S.17.02
S.18.01
S.19.01
S.20.01
S.21.01
S.29.03 & S.29.04

S.18.01 Projection of future cash flows (Best Estimate - Non-life)
• Gives an overview of the future cash flows by year expected to be required to settle the insurance obligations.
• Cash flows are analysed by year over the next 30 years and in total thereafter.
• NST .05 : Provides a more detailed Split by LOB, Claim Type and Distribution Channel
• LoB: Motor Vehicle split Private Motor and Commercial Motor, Liability split Employers Liability and Public Liability ( PL to include Professional Indemnity and Products Liability)
• Claim Type:
Motor – BI , PD and Latent Claims
EL and PL – Latent claims separated out
• Distribution Channel: Direct and Intermediated
S.17.01
S.17.02
S.18.01
S.19.01
S.20.01
S.21.01
S.29.03 & S.29.04

S.19.01 - Non-life Insurance Claims Information
• Provides development triangles for each line of business and material currency for:
• claims paid;
• the undiscounted best estimate of claims outstanding; and
• claims reported but not settled (RBNS).
• There is separate reporting of gross amounts; reinsurance recoveries and net amounts.
• Undertakings are required to report run-off triangles with a default length of 15 years.
• NST .06 : Detailed Split by Distribution Channel and claims type
• Motor : Private/ Commercial, PD/BI
• Liability : EL/ PL (including Professional Indemnity and Products)
S.17.01
S.17.02
S.18.01
S.19.01
S.20.01
S.21.01
S.29.03 & S.29.04
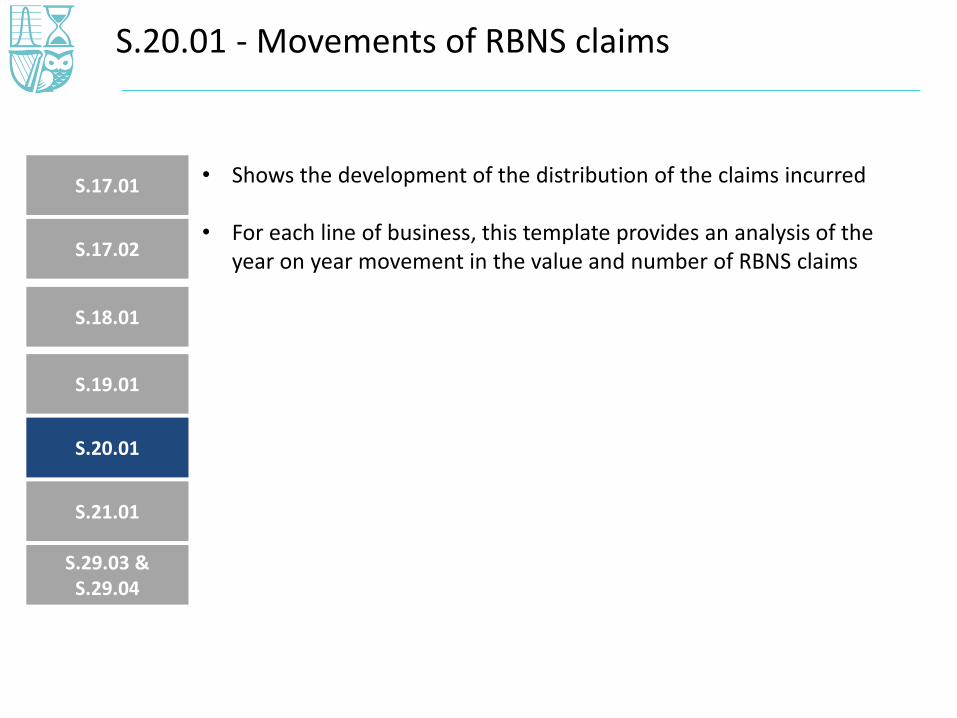
S.20.01 - Movements of RBNS claims
• Shows the development of the distribution of the claims incurred
• For each line of business, this template provides an analysis of the year on year movement in the value and number of RBNS claims
S.17.01
S.17.02
S.18.01
S.19.01
S.20.01
S.21.01
S.29.03 & S.29.04

S.21.01 - Loss distribution profile non-life
• Analyses the number and value of claims incurred at the end of the current and previous 14 accident or underwriting years in predefined brackets.
S.17.01
S.17.02
S.18.01
S.19.01
S.20.01
S.21.01
S.29.03 & S.29.04

S.29.03 Analysis of changes in BOF due to TPsS.29.04 Detailed analysis per period - Technical flows versus TPs
• Analyses changes in own funds relating to technical provisions
• Requires a breakdown into different sources of the variation of the gross best estimate, examples:
• Due to unwinding of the discount rate
• Due to experience and other sources
• Requires an analysis of technical flows affecting technical provisions
• Premiums
• Claims and benefits
• Expenses
• Flows relating to reinsurance
• S.29.04 provides further analysis differentiating between risks accepted/covered during, prior and after (accident year only) the reporting period.
S.17.01
S.17.02
S.18.01
S.19.01
S.20.01
S.21.01
S.29.03 & S.29.04

QRTs – some key challenges for (re)insurers
1
Volume of data and tighter reporting timelines (compared with SI)
2 Obtaining all required data, in particular, achieving asset look-through
3
Consistency of data provided in various templates and with other sources (capital model vs reserving vs QRTs, Solo vs Group)
Interpreting QRT requirements, e.g. what data should be included in each field
4
5 Governance and internal controls – issue is complicated where outsourcing arrangement are in place
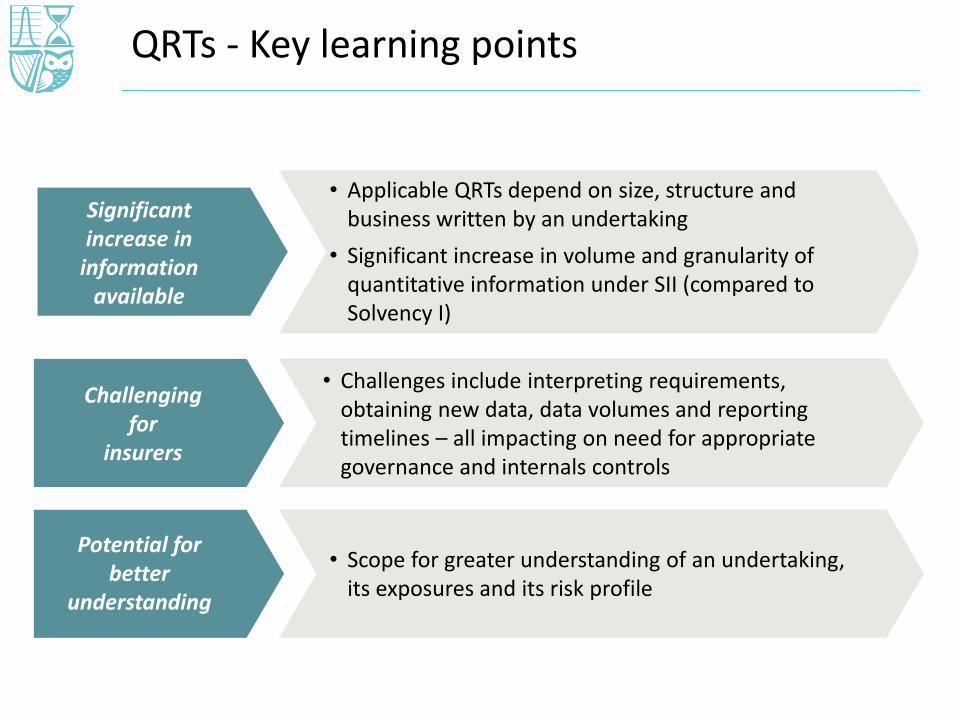
QRTs - Key learning points
• Applicable QRTs depend on size, structure and business written by an undertaking
• Significant increase in volume and granularity of quantitative information under SII (compared to Solvency I)
Potential for better
understanding
Challenging for
insurers
• Scope for greater understanding of an undertaking, its exposures and its risk profile
• Challenges include interpreting requirements, obtaining new data, data volumes and reporting timelines – all impacting on need for appropriate governance and internals controls
Significant increase in
informationavailable

Narrative Reporting: Overview
Narrative reporting under Pillar 3
Regular Supervisory Report –
At least once in full every 3 years
• Private, reported to supervisor
• All information necessary for the
purposes of supervision
Solvency Financial Condition Report –
Annual
• Publicly disclosed information
• Mainly qualitative
• Due 14 weeks after year end
Article 310 of Delegated Acts:
“Valuation for solvency purposes 1. The regular supervisory report shall include any important information, other than that already disclosed in the solvency and financial condition report of the insurance or reinsurance undertaking, regarding the valuation of its assets, technical provisions and other liabilities for solvency purposes.”
• Pillar 3 qualitative reporting should tell the story around the numbers, including insights into the governance, the significance of the risk and capital evaluations for the management of the business and why they may deviate from statutory reporting.
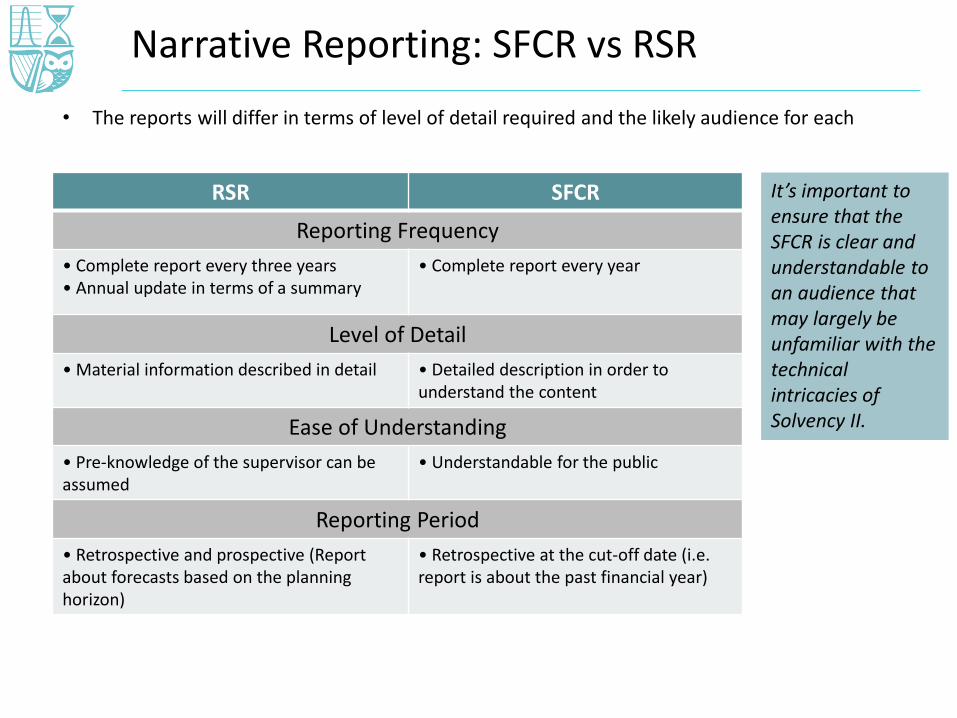
Narrative Reporting: SFCR vs RSR
RSR SFCR
Reporting Frequency
• Complete report every three years • Annual update in terms of a summary
• Complete report every year
Level of Detail
• Material information described in detail • Detailed description in order to understand the content
Ease of Understanding
• Pre-knowledge of the supervisor can be assumed
• Understandable for the public
Reporting Period
• Retrospective and prospective (Report about forecasts based on the planning horizon)
• Retrospective at the cut-off date (i.e. report is about the past financial year)
It’s important to ensure that the SFCR is clear and understandable to an audience that may largely be unfamiliar with the technical intricacies of Solvency II.
• The reports will differ in terms of level of detail required and the likely audience for each

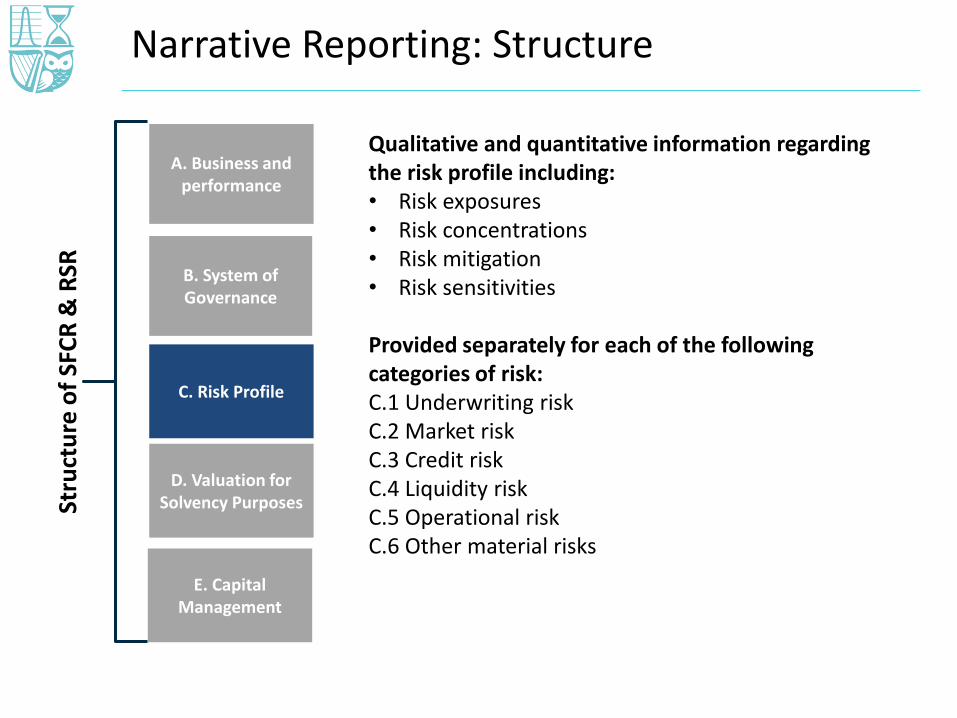
Narrative Reporting: Structure
A. Business and performance
B. System of Governance
D. Valuation for Solvency Purposes
C. Risk Profile
E. Capital Management
Stru
ctu
re o
f SF
CR
& R
SR
A.1 Business• Name and legal form of the insurer• Details of group structure (if applicable)
A.2 Underwriting Performance• In aggregate, by LoB and by geographical area
A.3 Investment Performance• Income and expenses by asset class• Info about any gains or losses recognised directly in
equity
A.4 Performance of other activities• Other material income and expenses
A.5 Any other information

Narrative Reporting: Structure
A. Business and performance
B. System of Governance
D. Valuation for Solvency Purposes
C. Risk Profile
E. Capital Management
Stru
ctu
re o
f SF
CR
& R
SR
B.1 General Information on the system of governance• Structure of the management body including main
roles/responsibilities• Remuneration policiesB.2 Fit and proper requirements• Insurer’s specific requirements concerning skills,
knowledge and expertiseB.3 Risk management system including the ORSA• Description of the system and the ORSA process
including how they’re implemented• Descriptions of how the following are implemented:B.4 Internal control systemB.5 Internal audit functionB.6 Actuarial functionB.7 OutsourcingB.8 Any other information
Narrative Reporting: Structure
A. Business and performance
B. System of Governance
D. Valuation for Solvency Purposes
C. Risk Profile
E. Capital Management
Stru
ctu
re o
f SF
CR
& R
SR
Qualitative and quantitative information regarding the risk profile including:• Risk exposures• Risk concentrations• Risk mitigation• Risk sensitivities
Provided separately for each of the following categories of risk:C.1 Underwriting riskC.2 Market riskC.3 Credit riskC.4 Liquidity riskC.5 Operational riskC.6 Other material risks

Risk Profile: SFCR vs RSR
SFCR (public) RSR (supervisor only)
C. Risk Profile
• Material changes to material risks & measures used for thoserisks
• Material risk concentrations, their probability and impact of risk mitigation
• Methods, assumptions and outcomes of stress testing and sensitivity analysis for material risks
• Material risk exposures, risk concentrations and effect of risk mitigation techniques over business planning horizon
• Quantitative data to determine risk dependencies
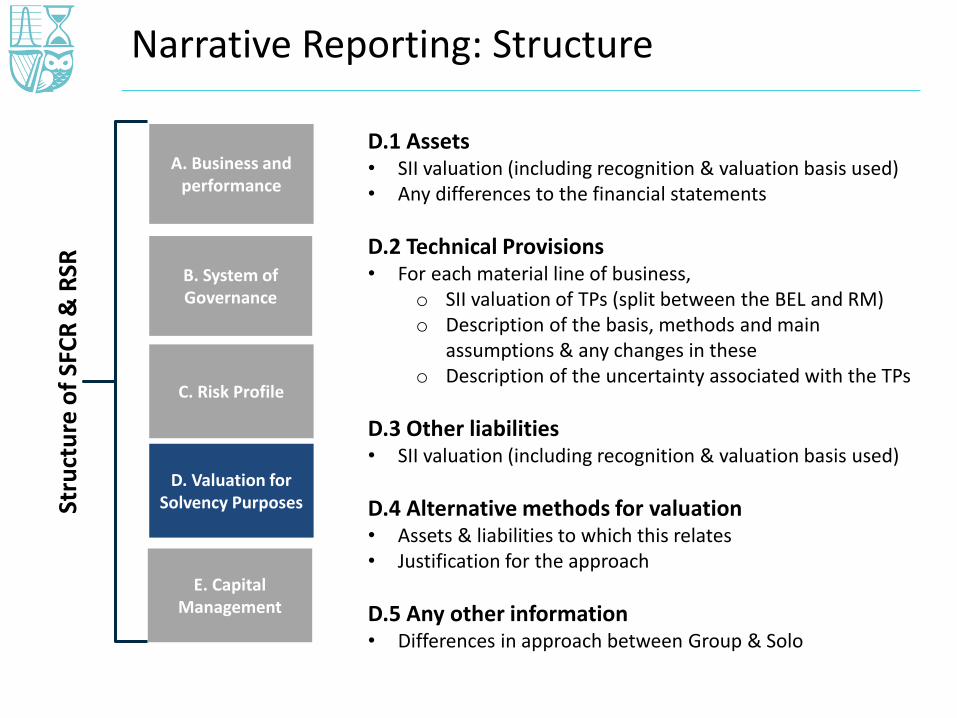
Narrative Reporting: Structure
A. Business and performance
B. System of Governance
D. Valuation for Solvency Purposes
C. Risk Profile
E. Capital Management
Stru
ctu
re o
f SF
CR
& R
SR
D.1 Assets• SII valuation (including recognition & valuation basis used)• Any differences to the financial statements
D.2 Technical Provisions• For each material line of business,
o SII valuation of TPs (split between the BEL and RM) o Description of the basis, methods and main
assumptions & any changes in theseo Description of the uncertainty associated with the TPs
D.3 Other liabilities• SII valuation (including recognition & valuation basis used)
D.4 Alternative methods for valuation• Assets & liabilities to which this relates• Justification for the approach
D.5 Any other information • Differences in approach between Group & Solo

Valuation for Solvency Purposes: SFCR vs RSR
SFCR (public) RSR (supervisor only)
D. Valuation for SolvencyPurposes
• Description of bases, methods and assumptions used
• Description of level of uncertaintyassociated with TPs
• Explanation of differences between methods and assumptions used for TPs and in financial statements for each material line of business
• Material changes in assumptions compared to previous YE
• Description of matching and volatility adjustment & quantification of impact on financial position of reducing those adjustments to zero
• Material differences in M&A between Group & Subsidiaries
• Actuarial methodologies, assumptions, simplifications, homogenous risk groups used
• Details on contract boundaries applied, options and guarantees
• Description of unbundling
• Recommendations for improvements in relation to data
• Data deficiencies and adjustments
• Details of the ESG assumptions
• Approach taken to calculate reinsurance recoveries
• Moe detail on matching and volatility adjustments
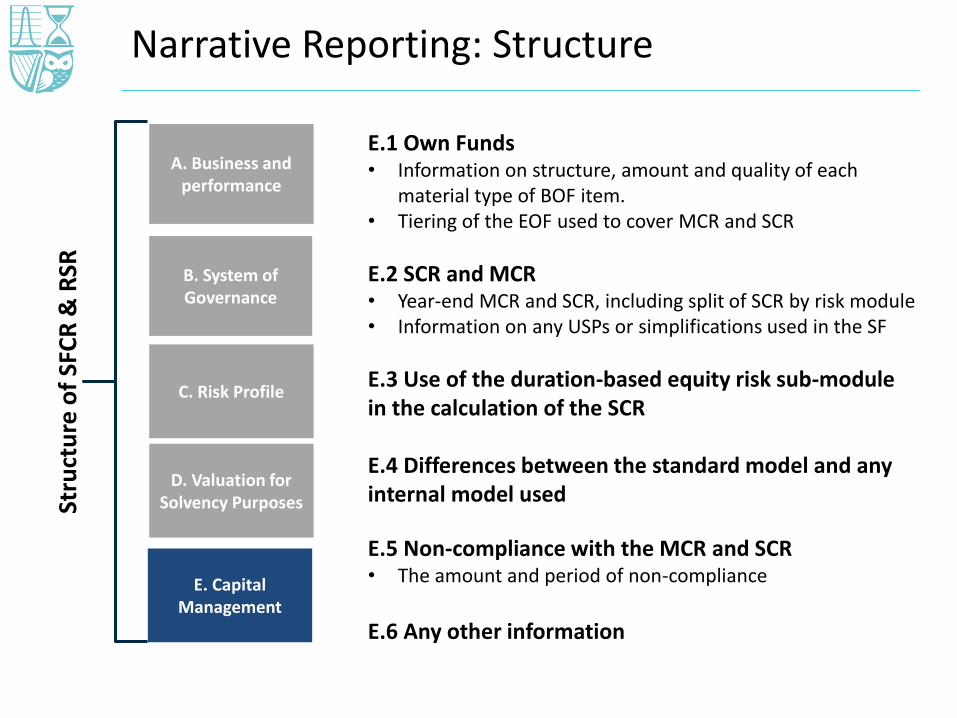
Narrative Reporting: Structure
A. Business and performance
B. System of Governance
D. Valuation for Solvency Purposes
C. Risk Profile
E. Capital Management
Stru
ctu
re o
f SF
CR
& R
SR
E.1 Own Funds• Information on structure, amount and quality of each
material type of BOF item.• Tiering of the EOF used to cover MCR and SCR
E.2 SCR and MCR• Year-end MCR and SCR, including split of SCR by risk module • Information on any USPs or simplifications used in the SF
E.3 Use of the duration-based equity risk sub-module in the calculation of the SCR
E.4 Differences between the standard model and any internal model used
E.5 Non-compliance with the MCR and SCR• The amount and period of non-compliance
E.6 Any other information
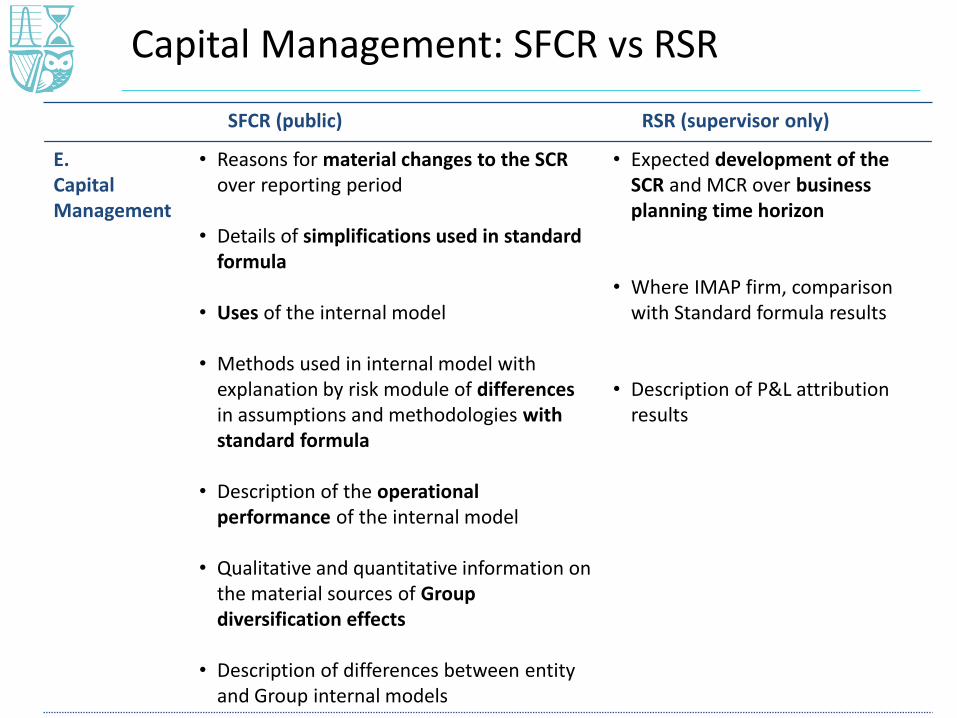
Capital Management: SFCR vs RSR
SFCR (public) RSR (supervisor only)
E. Capital Management
• Reasons for material changes to the SCR over reporting period
• Details of simplifications used in standard formula
• Uses of the internal model
• Methods used in internal model with explanation by risk module of differencesin assumptions and methodologies with standard formula
• Description of the operational performance of the internal model
• Qualitative and quantitative information on the material sources of Group diversification effects
• Description of differences between entity and Group internal models
• Expected development of the SCR and MCR over business planning time horizon
• Where IMAP firm, comparison with Standard formula results
• Description of P&L attribution results

Questions?